

SUMMARY
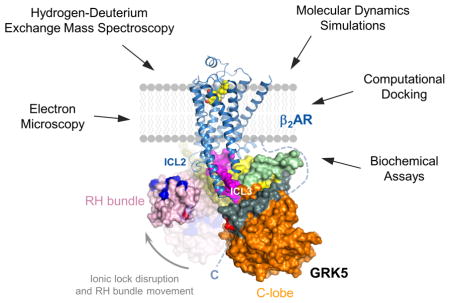
The phosphorylation of agonist-occupied G protein-coupled receptors (GPCRs) by GPCR kinases (GRKs) functions to turn off G-protein signaling and turn on arrestin-mediated signaling. While a structural understanding of GPCR/G-protein and GPCR/arrestin complexes has emerged in recent years, the molecular architecture of a GPCR/GRK complex remains poorly defined. We used a comprehensive integrated approach of cross-linking, hydrogen-deuterium exchange mass spectrometry, electron microscopy, mutagenesis, molecular dynamics simulations and computational docking to analyze GRK5 interaction with the β2-adrenergic receptor (β2AR). These studies revealed a dynamic mechanism of complex formation that involves large conformational changes in the GRK5 RH/catalytic domain interface upon receptor binding. These changes facilitate contacts between intracellular loops 2 and 3 and the C-terminus of the β2AR with the GRK5 RH bundle subdomain, membrane-binding surface and kinase catalytic cleft, respectively. These studies significantly contribute to our understanding of the mechanism by which GRKs regulate the function of activated GPCRs.
e-TOC
Biophysical analysis of a G protein-coupled receptor (GPCR) complex with a GPCR kinase reveals significant conformational changes in the kinase that are essential for effective receptor phosphorylation.
INTRODUCTION
G protein-coupled receptors (GPCRs) regulate the activity of numerous effector molecules and play an essential role in coordinating the ability of cells to rapidly respond to their environment (Lefkowitz, 2007). Agonist binding to a GPCR activates heterotrimeric G-proteins, which mediate downstream signaling and ultimately a physiological response. GPCR signaling is dynamic and undergoes rapid regulation by GPCR kinases (GRKs), which specifically phosphorylate activated GPCRs, and arrestins, which bind to GRK-phosphorylated GPCRs to promote receptor desensitization and endocytosis as well as arrestin-mediated signaling (Figure 1A). While significant structural and dynamic insight on GPCR interaction with G-proteins (Rasmussen et al., 2011) and arrestins (Kang et al., 2015) has been gained in recent years, we still know little about how GRKs target activated GPCRs.
Figure 1. Receptor agonist and anionic lipids are required for functional interaction between GRK5 and the β2AR in bicelles and detergent solution.

(A) Schematic of G protein, GRK and arrestin interaction with GPCRs.
(B) Crystal structure of GRK5 bound to AMP-PNP (PDB ID 4TND). The RH bundle and terminal subdomains, catalytic C-lobe and N-lobe subdomains, N-terminal lipid binding domain (NLBD) and an ionic lock between the RH and kinase domains are highlighted. Disordered αN-helix (green) and C-terminal lipid binding domain (CLBD) (magenta) were computationally modeled.
(C) Direct binding (pull-down) and phosphorylation assays showing GRK5 coupling to β2AR reconstituted into bicelles or solubilized in MNG. Values represent mean ± SEM from three independent experiments.
(D) Analytical gel filtration of GRK5 and MNG-solubilized BI-bound β2AR.
(E) Sequence alignment of NLBD and CLBD of human GRKs (residues 22–29 and 546–565 in GRK5, respectively). Identical residues are boxed in red while residues showing similarity are in red and grouped in a blue frame.
See also Figure S1.
The GRK family includes 7 mammalian members across three sub-families: GRK1 (GRK1 and 7); GRK2 (GRK2 and 3); and GRK4 (GRK4, 5 and 6). Significant insight into GRK function has come from X-ray crystallography and structures for GRK1, GRK2, GRK4, GRK5 and GRK6 have been reported. These structures reveal that the Regulator of G protein signaling homology (RH) and catalytic domains have extensive contacts with each other and help to hold the kinase in an inactive open conformation (Figure 1B). Recent studies suggest that an N-terminal α-helical domain may regulate catalytic domain closure and that this process may be regulated by receptor binding (Pao et al., 2009; Boguth et al., 2010; Huang et al., 2011). Indeed, this domain has been observed in some crystal forms of GRK1 (Huang et al., 2011) and GRK6 (Boguth et al., 2010) and appears to stabilize catalytic domain closure and activation. While these studies have provided significant insight into how GRKs might function, we currently know little about the critical regions that mediate GRK interaction with GPCRs or how this interaction ultimately regulates GRK activation. Here we utilize the β2AR and GRK5 as a model system to characterize the mechanisms by which GRKs phosphorylate activated GPCRs.
RESULTS AND DISCUSSION
Receptor Activation and Acidic Lipids are Required for Efficient Interaction of the β2AR and GRK5
GRKs specifically interact with agonist-occupied GPCRs to trigger GRK activation and subsequent phosphorylation of the receptor. Since isolation of a complex between GPCRs and GRKs for structural characterization has not been reported, our initial efforts were aimed at identifying conditions to generate stable complex formation between the β2AR and GRK5. We purified GRK5 and the β2AR from insect cells and tested their interaction under different conditions using a bead pull-down assay as well as a kinase assay measuring GRK5-catalyzed phosphorylation of the β2AR. Only weak GRK5 binding to β2AR bound to the high affinity agonist BI-167107 (BI) was detected regardless of whether the β2AR was in detergent or reconstituted into phospholipid bicelles (Figure 1C). Although binding was slightly enhanced using GRK5 ligands like sangivamycin (Figure S1A), the observed weak interaction between GRK5 and β2AR is in contrast to the stable association between Gs and β2AR under similar conditions (Rasmussen et al., 2011). However, inclusion of natural PIP2 into the bicelles significantly increased the amount of GRK5 that co-eluted with BI-bound β2AR (Figure 1C). Addition of PIP2 also resulted in a high level of β2AR phosphorylation (~2 mol of Pi/mol of β2AR) demonstrating that a functional complex between GRK5 and β2AR was formed. The effect of PIP2 was found to be dose-dependent (Figure S1B) and salt-sensitive (Figure S1C).
While natural PIP2 worked well to facilitate efficient GRK5/β2AR coupling in bicelles, it was not effective in detergent micelles (Figure 1C). We reasoned that using PIP2 with a shorter carbon chain might be more effective since the detergent MNG used to extract the receptor contains a short 10 carbon hydrophobic tail, which matches well with the short tail of C8-PIP2 (Figure S1E). Indeed, C8-PIP2 can effectively substitute for natural PIP2 to provide a high extent of binding and β2AR phosphorylation in detergent micelles (Figure 1C). Moreover, the proteins migrate as a single homogeneous peak on size exclusion chromatography in the presence of C8-PIP2, in marked contrast to conditions without C8-PIP2 where the β2AR and GRK5 migrate as separate peaks (Figure 1D). Estimation of molecular mass suggests a 1:1 complex of β2AR/GRK5 arguing against nonspecific association of GRK5 with C8-PIP2 containing detergent micelles.
Strong GRK5 binding and β2AR phosphorylation also occurred in reconstituted high-density lipoparticles (HDLs, or nanodiscs) (Figure S1D). Although the lipid bilayer of HDL didn’t include PIP2, it did contain the acidic lipid palmitoyl-oleoyl-phosphatidylglycerol (PG) consistent with a general requirement of acidic lipids for GRK5 binding to β2AR.
The requirement of acidic lipids to form a stable β2AR/GRK5 complex was complemented by the requirement of agonist. Though significant GRK5 binding was observed in a pull-down assay with inverse agonist bound β2AR (ICI-β2AR), this was a very poor substrate for GRK5 phosphorylation despite its reconstitution into bicelles with natural PIP2 (Figure 1C) or HDLs (Figure S1D). Thus, agonist-driven conformational changes in the β2AR are needed for functional coupling of GRK5 to β2AR, while PIP2 might elevate the local concentration of GRK5 to allow fast formation of a catalytic complex when the β2AR is activated.
Taken together, our data demonstrate that a stable complex between the β2AR and GRK5 is highly dependent on acidic lipids and agonist. It was previously shown that GRK5 contains a stretch of basic residues at the N- and C-terminus (residues 22–29 and 546–565) that mediate recruitment to phospholipid vesicles when supplemented with PIP2 (Pitcher et al., 1996; Pronin et al., 1998). Interestingly, these two lipid-binding domains seem to colocalize in the three-dimensional atomic model of GRK5 (Figure 1B), thereby constituting a large membrane-binding surface near the RH terminal subdomain and N-lobe that anchors GRK5 on the anionic surface of phospholipid membranes.
It is important to note that the presence of polybasic regions at the N- and C-termini is a specific attribute of the GRK4 subfamily of GRKs (Figure 1E) and GRK5 solely relies on these regions to target phospholipid membranes. Other GRKs employ different mechanisms of membrane recruitment with either the assistance of a lipid moiety attached to the far C-terminus (GRK1 and GRK7 are prenylated, GRK4 and GRK6 are palmitoylated) or a pleckstrin homology domain that binds to acidic lipids and Gβγ (GRK2 and GRK3). Therefore, the lipid requirements for other GRKs might be different than GRK5 and might contribute to the specificity of GRKs for targeting GPCRs.
The GRK5 Docking Site on the Cytoplasmic Surface of the β2AR
Evidence presented above demonstrates the role of negatively charged phospholipids in interactions between GRK5 and the β2AR. In addition, two independent structural sites on GPCRs are utilized by GRKs to mediate phosphorylation. The primary site involves the GPCR intracellular loops which serve as the initial platform for GRK docking (Shi et al., 1995). This region also likely provides allosteric control of GRK activation through triggering the catalytic domain closure required for the phosphotransfer reaction. The catalytic domain of GRKs is engaged in phosphorylation of the C-terminus and/or third intracellular loop, which serves as a second site of interaction. Thus, the binding pose of a GRK in complex with a receptor is defined by specific interactions with the intracellular loops and 7TM bundle (the docking site), which helps to coordinate GRK activation and receptor phosphorylation.
To assess a role for the GPCR docking site and further corroborate functional complex formation, we examined the effect of the β2AR-specific nanobody Nb6B9 on receptor phosphorylation. This nanobody forms a high-affinity complex with the β2AR (Kd = 6.4 nM) through targeting a hydrophobic cleft in the intracellular portions of the receptor as revealed by the crystal structure of a Nb6B9/β2AR complex (Figure 2A) (Ring et al., 2013). Nb6B9 engages a large area on the receptor and would be expected to block interactions with GRK5. Addition of a stoichiometric amount of the nanobody effectively inhibited β2AR phosphorylation by GRK5 (Figure 2B). In contrast, GRK5 phosphorylation of the nonreceptor substrate tubulin was not influenced by Nb6B9. Thus, a complex between GRK5 and β2AR can be disrupted by blocking β2AR regions important for enzyme docking and activation. GRK5/Nb6B9 competition also validated specific protein-protein interaction in the β2AR/GRK5 complex.
Figure 2. Validation of GRK5/β2AR complex formation.

(A) The crystal structure of nanobody Nb6B9 complex with β2AR (PDB ID 4LDE).
(B) Nb6B9 inhibits GRK5-mediated phosphorylation of agonist-bound β2AR (BI-β2AR). Values represent mean ± SEM from three independent experiments.
(C) Ribbon representation of the active (PDB 3SN6) and inactive (PDB 4GBR) structures of the β2AR with TM6 and the position of Cys265 (yellow) highlighted. The cytoplasmic end of TM6 moves outward following β2AR activation, increasing solvent exposure of a bimane probe covalently bound to Cys265.
(D) Fluorescence emission spectra for monobromobimane-labeled β2AR in rHDL in the presence or absence of agonist (ISO), GRK5 and Gs.
See also Figure S1.
GRK5 phosphorylation of the β2AR is agonist dependent, suggesting that GRK5 preferentially binds to an active conformation of the β2AR and may stabilize this conformation. Previously, it was shown that formation of a Gs/β2AR complex affected the conformation of both proteins with the β2AR adopting a more open conformation of the cytoplasmic end of TM6 to facilitate interaction with the C-terminal helix of Gαs. This can be monitored by changes in fluorescence of monobromobimane attached to the cytoplasmic end of TM6 (Yao et al., 2009). Upon activation with agonist, TM6 is displaced from its original basal position (Figure 2C) resulting in a decrease in fluorescence intensity and a red shift. These changes in the bimane emission spectra become even more prominent in the complex with Gs due to further outward movement of TM6. We measured bimane fluorescence of ligand-free β2AR, as well as β2AR bound to the agonist isoproterenol alone and together with GRK5 (Figure 2D). GRK5 potentiated the effect of agonist on bimane fluorescence causing an additional decrease in intensity, supporting interaction between β2AR and GRK5. The effect of GRK5 on bimane fluorescence is similar to, albeit markedly smaller, than the effect of nucleotide-free Gs, which binds to the β2AR with much higher affinity (Figure 2D). Moreover, bimane emission spectra were insensitive to the addition of GRK5 or Gs when β2AR was bound to the inverse agonist ICI (Figure S1F), consistent with the requirement for active receptor for GRK5 binding and receptor phosphorylation (Figure 1C).
Insight into GRK5 Dynamics Following Binding to β2AR and Activation
Little is known about GRK5 dynamics in complex with a GPCR. Dynamics of the N- and C-lobes within a protein kinase’s catalytic domain help to control nucleotide entry/release and enzyme activation (Johnson et al., 2001), which is expected to occur following GRK5 targeting activated β2AR. While an open conformation adopts the largest distance between the N- and C-lobes, the closed conformation represents a catalytically competent state that displays tight packing of the two lobes with closure of the active site cleft needed for proper alignment of ATP and substrate. GRKs crystallized in complex with different low molecular weight ligands and other proteins revealed either open or intermediate conformations of the kinase domain (Homan and Tesmer, 2014; Homan et al., 2015). While a fully-closed active conformation was not observed in any of these crystal structures, it is thought that a GRK complex with activated receptor will drive structural changes resulting in full closure of the kinase domain.
Since the orientation of the N- and C-lobes in other modular protein kinases were shown to be influenced by contacts with adjacent subunits and therefore modulate catalytic activity, we next studied the role of RH domain contacts with the kinase domain in GRK5 activation. The RH and kinase domains in GRKs are intimately associated at two distinct sites. The α10-helix of the RH terminal subdomain has a large hydrophobic interface with the kinase N-lobe, whereas the RH bundle subdomain and C-lobe interact via interactions that form an ionic lock. This latter region constitutes a network of electrostatic interactions in GRK5 (413 Å2 of buried area) between hydrophilic residues in the N-terminal ends of α4 (Glu91 and backbone oxygen of Val92) and α7 (Lys139 and Glu140) that interact with the kinase domain C-lobe via polar contacts with Asn452, Lys454 and Arg455 of the αJ helix (Figure 3A). While the ionic lock comprises slightly different sets of residues in the crystal structures of GRK1, GRK2, GRK4 and GRK6, this is a conserved feature found in all GRKs. Interestingly, disruption of the ionic lock was observed in the crystal structures of GRK5 in complex with the inhibitor CCG215022 (Homan et al., 2015) and in GRK6 bound to sangivamycin (Boguth et al., 2010) suggesting the transient nature of this interface (Figure S2A and S2B). Moreover, disruption of the ionic lock in these crystal structures correlates with a more closed conformation of the kinase domain, suggesting that the disruption might be linked to enzyme activation. To gain further insight into the role of the ionic lock in GRK5 activation, we mutated several ionic lock residues into alanines and compared catalytic parameters of the mutant and wild type enzyme. The mutations neutralized the charges of Lys139, Lys454 and Arg455, and therefore impaired their electrostatic interactions to disrupt the ionic lock. This resulted in enhanced phosphorylation of agonist-bound β2AR (Figure 3B), suggesting a functional relationship between ionic lock interactions and GRK5 activity. Analysis of catalytic parameters of the mutant and wild type proteins for ATP demonstrated a 60% increase in catalytic efficiency (kcat/Km) whereas the Km for ATP was unaltered. The increase in kcat/Km can be attributed to either increased GRK5 binding to the receptor and/or an increased phosphoryl transfer rate.
Figure 3. Electrostatic contact between the RH and kinase domains regulates GRK5 plasticity and catalytic activity.

(A) The network of electrostatic interactions between the kinase and RH domains of GRK5 (“ionic lock”).
(B) Effect of ionic lock mutations on Michaelis-Menten kinetics for ATP. The data represent the mean ± SEM from three independent experiments and were fit using GraphPad Prism.
(C) Interdomain distances in MD simulations of GRK5 wild type (blue) and the ionic lock mutant (red) in which the ionic lock was disrupted by alanine mutations. Distances are measured between alpha carbons on residues 92 and 455 (see panel D) and smoothed using an 8 ns moving average. Three of the six simulations performed under each condition are shown.
(D) A snapshot of a representative elongated conformation of GRK5 (colors), as observed in MD simulations of the ionic lock mutant, superimposed on the crystallographic conformation from which the simulations started (gray).
(E) Representative 2D class averages of GRK5 ionic lock mutant and a GRK5 mutant that contains C138–C454 disulfide bond stabilizing RH/kinase interface (GRK5-DC; described in Figure 4).
(F) Thermal unfolding of wild type and the ionic lock mutant of GRK5 was monitored by measuring the ellipticity at 222 nm as a function of temperature. The cooperativity index, n, was calculated as described in the STAR Methods.
See also Figures S2 and S3 and Movies S1 and S2.
To corroborate the results of ionic lock mutagenesis as well as gain insight into the structural dynamics following ionic lock disruption in GRK5, we utilized molecular dynamics (MD) simulations. In wild-type simulations, the RH and kinase domains occasionally separated, swinging apart transiently to a maximum distance of 15–20 Å (Figures 3C and S2C; Movie S1). Alanine substitution of ionic lock residues substantially increased the dynamics of GRK5 in MD simulations. The maximal separation between the RH and kinase domains increased to 25–30 Å, with significant elongation of the kinase molecule (Figures 3C, 3D and S2C; Movie S2), and such opening became more frequent and prolonged. The hinge for the domain motion is located at the border of the RH and kinase domains near the α10-helix (Figure 3D).
Additional evidence of GRK5 domain dynamics was obtained by electron microscopy (EM). We employed negative stain EM and single particle averaging to visualize the domain arrangement of the GRK5 ionic lock mutant as well as a GRK5 disulfide-stabilized mutant (GRK5-DC, described in Figure 4) that contains the RH and kinase domains cross-linked by an engineered disulfide bond (Figures 3E and S3). The two-dimensional class averages of the GRK5 molecule revealed a single particle (Figure 3E) composed of 2 arms of ~60 Å in length, each showing bilobal features, which correspond to the two domains of GRK5 each consisting of two subdomains. In agreement with MD simulations, class averages of the GRK5 ionic lock mutant showed open and elongated GRK5 particles (Figure 3E, top panel) suggesting significant domain separation though a range of conformations from compact to open with interdomain distances up to 40 Å (Figure S3). In contrast, GRK5-DC lacks this characteristic, instead having an overall compact “horseshoe” shape (Figure 3E, bottom panel), reminiscent of the crystallographic conformation of GRK5. Compact GRK5 was also the predominate form of wild type GRK5 (not shown) indicating that the ionic lock maintains the RH/kinase domain interaction, whereas its disruption in the ionic lock mutant facilitates large-scale domain dynamics in GRK5.
Figure 4. Effective coupling of GRK5 to β2AR requires disruption of the ionic lock and RH/kinase domain separation.

(A) Oxidation using K3Fe(CN)6 causes an upward shift in migration of GRK5 double-cysteine mutant (DC) in a gel under non-reducing conditions, suggesting disulfide bond formation.
(B) Identification of C138–C454 disulfide bond in DC mutant by tandem MS. Inset shows relative positions of the residues in GRK5/AMP-PNP atomic structure (4TND) that were expected to cross-link (E91C/K454C) and were found to cross-link (C138/K454C) in DC mutant upon oxidation. The Cα-Cα distances are indicated.
(C) A time course of C138–C454 disulfide bond formation in GRK5-DC under different conditions (domain proximity assay). The samples were run in SDS-PAGE under non-reducing conditions and stained by Coomassie blue. Positions of cross-linked (GRK5-DCS-S) and non cross-linked (GRK5-DC) species are indicated.
(D) Kinetics of rhodopsin phosphorylation in reducing (+DTT) and non-reducing (-DTT) conditions. Values represent mean ± SEM from three independent experiments.
(E) Conformational changes in GRK5 involving RH/kinase domain separation upon binding to active GPCR while association with phospholipids favors a compact conformation.
Significant elongation of the GRK5 molecule observed in MD simulations and EM studies implies high domain flexibility, which might be regulated by the ionic lock between the RH and kinase domains. The ionic lock seems to be transient and its disruption might have a direct impact on kinase activation and/or its ability to bind receptor. If the ionic lock prevents full closure of the kinase domain, breaking this structural constraint should also favor a higher interlobe plasticity in the kinase domain promoting its closure and GRK5 activation. This is consistent with the observed increase in catalytic efficiency of the ionic lock mutant to phosphorylate β2AR (Figure 3B). In addition, temperature-induced unfolding of the GRK5 ionic lock mutant was observed at a lower temperature than wild type GRK5, supporting higher plasticity of GRK5 in the absence of the ionic lock constraint (Figure 3F). This also reduces the structural relationship between elements of the GRK5 protein architecture as indicated by lowering of the cooperativity index, n, which describes the sigmoidicity of the thermal denaturation curve (Figure 3F).
To further investigate the functional importance of RH/kinase domain interface in GRK5, we placed a disulfide bond to cross-link the RH and kinase domains and prevent domain separation. Based on their proximity in the high-resolution crystal structure of GRK5/AMP-PNP, we mutated Glu91 and Lys454 to cysteine (GRK5-DC) (Figure 3A). The distance between the Cα atoms of these positions (6.4 Å) is within the distance compatible with disulfide bridge formation (<7.5 Å). The cysteine mutant was expressed, purified and treated for 2 h with oxidizing reagent K3Fe(CN)6 to facilitate disulfide bond formation. A distinct upward mobility shift was observed for GRK5-DC in nonreducing SDS-PAGE, indicating formation of an intramolecular cross-link that slows migration (Figure 4A). The upward shift of GRK5-DC was reversed upon addition of reducing agent (Figure 4A).
Cross-linked GRK5-DC was purified and subjected to mass-spectrometry (MS) analysis to identify the precise positions of disulfide bond. While the expected Cys91/Cys454 cross-link was not identified, strong evidence was obtained for disulfide bond formation between Cys138 and Cys454 in GRK5-DC (Figure 4B). Cys138 is one of 17 native cysteines found in GRK5 and is located on the loop connecting α6/α7-helices of the RH bundle subdomain in close proximity to introduced Cys91 located at the distal side of the α4-helix (Figure 4B, Inset). Although Cys138 is 11.3 Å away from Cys454 (Cα-Cα) in the GRK5/AMP-PNP crystal structure, only a modest adjustment (~4 Å) would be needed to accommodate disulfide bond formation between the native Cys138 and engineered Cys454. These data also suggest that the ionic lock interactions are dynamic in solution, as observed in our simulations.
Thus, MS analysis revealed an intramolecular Cys138/Cys454 disulfide bond in GRK5-DC that establishes a covalent cross-link between the RH and kinase domains. Next, we were interested in understanding the factors that facilitate domain separation. To monitor domain separation in GRK5, we developed a domain proximity assay that is based on different electrophoretic mobility of cross-linked and non-cross-linked species under nonreducing conditions. Following a time course of GRK5-DC oxidation, we observed a gradual delay in electrophoretic mobility of the mutant that results in a distinct upward shift (Figure 4C) indicating Cys138/Cys454 disulfide bond formation. This shift is not observed with wild type GRK5. Thus, we can estimate RH/kinase domain proximity in different conditions by comparing the rate of C138–C454 cross-linking.
The rate of GRK5-DC cross-linking was significantly delayed upon addition of agonist-bound BI-β2AR in MNG/C8-PIP2 micelles (Figure 4C). These results suggest that GRK5 adopts an elongated conformation (with RH/kinase domains separated) when bound to agonist-occupied β2AR. Interestingly, GRK5-DC recruitment to a lipid bilayer lacking a receptor actually enhanced cross-linking as evident from the upward gel shift after 5 min of oxidation in the presence of bicelles. However, incorporation of BI-bound β2AR into PIP2-bicelles almost completely blocked accumulation of cross-linked species, similar to the effect observed with BI-bound β2AR in MNG/C8-PIP2 micelles. Thus, these data suggest that GRK5 binding to the lipid membrane stabilizes a compact conformation with the ionic lock preserved and RH/kinase domains tightly associated, while GRK5 interaction with agonist-bound β2AR triggers domain separation and stabilizes a more elongated conformation, as was predicted by MD simulations of the ionic lock disruption in GRK5 (Figures 3C and 3D).
Since RH/kinase domain separation is blocked in the cross-linked GRK5-DC mutant, we next evaluated the ability of this mutant to phosphorylate receptor to address whether domain separation is required for the catalytic properties of GRK5. The oxidized GRK5-DC mutant demonstrated a severe defect in phosphorylating bleached rhodopsin (Figure 4D), consistent with a need for RH/kinase domain separation for GRK5 activation. However, the catalytic activity of GRK5-DC can be fully restored after treatment with reducing agent indicating that no other properties that contribute to the decreased activity of cross-linked GRK5-DC were altered. Taken together, our data demonstrate a specific requirement of ionic lock disruption and domain separation for GRK5 activation. Moreover, we find that these conformational changes are triggered by agonist-bound receptor, while membrane association of GRK5 in the absence of receptor seems to stabilize a “crystallographic” compact conformation (Figure 4E).
Mapping the GRK5/β2AR Binding Interface using Chemical Cross-Linking Coupled with Mass Spectrometry
Our studies suggest that the transition of GRK5 from membrane-bound to receptor-bound state is followed by disruption of the ionic lock and elongation of the kinase. We next sought to determine the GRK5/β2AR binding interface and identify regions engaged in this interaction. Since application of structural approaches is limited by the low affinity, high flexibility and lipid requirement for stable GRK5/β2AR binding to occur, we utilized XL-MS to analyze this complex. This is a powerful method for providing low-resolution spatial information for protein complexes that are not stable enough or are too heterogeneous for crystallography (Rappsilber, 2011).
The GRK5/β2AR complex was subjected to cross-linking with non-deuterated or deuterated forms of the amine-reactive cross-linker BS3, followed by trypsin digestion and tandem MS analysis (Figure 5A). The cross-linking reaction was performed under conditions that yielded a functional complex (Figure 1C) and then isolated by SDS-PAGE to ensure that only 1:1 β2AR:GRK5 complexes were analyzed. We identified ~130 cross-linked peptides, of which 25% were intermolecular in nature, describing GRK5/β2AR protein interface. The resulting high-confidence intermolecular BS3 cross-links (Table S1) were mapped onto both the crystal structure of β2AR and GRK5 and found to cluster into 3 regions (Figure 5B; Table S1). The first cluster yielded several cross-links between ICL3 of β2AR and the N-terminal and C-terminal lipid-binding domains (NLBD and CLBD) of GRK5. It maps regions on GRK5 previously assigned to phospholipid binding that appear to facilitate GRK5 binding to receptor. This also suggests that the orientation of GRK5 relative to the membrane plane is not significantly altered during the transition from membrane-bound to receptor-bound state since the same region appears to target the membrane and receptor. A second cluster revealed close proximity of ICL2 of β2AR and the RH bundle subdomain of GRK5. This highlights the structural proximity of the receptor with a kinase region not previously assigned for receptor interaction. As discussed below, for interactions in clusters 1 and 2 to occur simultaneously, a significant change in the conformation of GRK would be necessary. A third cluster of intermolecular cross-links maps GRK5 catalytic domain interaction with the β2AR C-terminus that contains the sites of phosphorylation. Since priming of the kinase catalytic cleft with the substrate peptide (β2AR C-terminus) is a prerequisite for the catalytic reaction, robust cross-linking of β2AR C-terminus with the kinase active site reflects formation of the enzymatic complex required for phosphorylation. This is supported by the observation of high level of GRK5-mediated phosphorylation of β2AR under these conditions (Figure 1C). The β2AR C-terminus (residues 343–413) also cross-linked with other regions of GRK5 including the CLBD and RH bundle subdomain, in agreement with the highly dynamic character of this region. Thus, the involvement of ICL2, ICL3 and the C-terminus of the receptor validates previous biochemical data suggesting a role for these regions in GRK coupling, whereas the contribution of the RH bundle of GRK5 in binding to β2AR was unexpected.
Figure 5. Identification of structural restraints for the β2AR/GRK5 complex using XL-MS.

(A) Overview of BS3 and zero-length XL-MS analysis for mapping the β2AR/GRK5 binding interface.
(B) Location of identified BS3 cross-linked Lys residues (red spheres around Cα) on the crystal structure of β2AR (PDB ID 3SN6) and GRK5 (PDB ID 4TND). Three main clusters of inter-chain cross-links map structural proximity of ICL3 and GRK5 lipid binding domains (deep red), ICL2 and the RH bundle subdomain (cyan), and the β2AR C-terminus and kinase catalytic cleft (green). Identified cross-links that are not assigned to the three main clusters are highlighted in grey.
(C) Location of identified zero-length cross-linked residues (red spheres around Cα) on the crystal structure of β2AR (PDB ID 3SN6) and GRK5 (PDB ID 4TND). The color code for the cluster assignment is the same as in panel B.
Although the topology of the GRK5/β2AR complex emerged from the BS3 cross-linking data, this cross-linker inserts a relatively long spacer arm (11.4 Å) between the proximal amino acids, reducing the stringency of the derived distance constraints. In contrast, a zero-length cross-linker would not add any extra atoms and therefore would provide the tightest possible spatial constraints. Thus, we next performed zero-length cross-linking of GRK5/β2AR complex using NHS/EDC (Figure 5A) to validate the BS3 cross-linking data and clarify the relative positioning of protein regions in the complex. The GRK5/β2AR complex was cross-linked in MNG solution supplemented with C8-PIP2 (Figure 1D), a 1:1 cross-linked complex was isolated by SDS-PAGE (Figure S4), digested with trypsin and then analyzed by tandem MS. The analysis identified 3 unique inter-chain cross-links for GRK5/β2AR complex (Figure 5C; Table S1). The lower number of identified zero-length cross-links as compared to the BS3 cross-links was consistent with the higher selectivity required by the zero-length cross-linking methodology. The zero-length cross-linked regions of GRK5 and β2AR map to the same areas on the proteins (except ICL2) that were detected in BS3 cross-linking analysis (Figure 5B). ICL3 of the β2AR cross-linked with CLBD of GRK5, further supporting relative positioning of this region at the protein interface revealed using BS3 cross-linking analysis. The ICL2/RH bundle interface that emerged in BS3 cross-linking data was not reflected in zero-length data, most likely due to the lack of exposed acidic residues in ICL2. The C-terminus of β2AR contains only one reactive acidic residue, Asp362, which was cross-linked with the various regions on GRK5, again demonstrating the high mobility of this region. Thus, the zero-length cross-linking results help to validate and refine our model of GRK5/β2AR interaction revealed by BS3 cross-linking.
Modeling the GRK5/β2AR complex
The identified intermolecular cross-links provided valuable experimental constraints for modeling. HADDOCK (Van Zundert et al., 2016) was used to build molecular models of the GRK5/β2AR complex by imposing the structural constraints for unambiguously assigned cross-links revealed in BS3 and zero-length cross-linking analysis. GRK5 in its compact conformation (Figure 6A, Model 1) and two GRK5 models in an elongated conformation (Figure 6A, Models 2 and 3) were docked on the intracellular face of the β2AR from its complex with Gs (PDB ID 3SN6). The correlation of the modeling and experimental data was examined for each model by comparison of Cα-Cα distances for inter-chain cross-links with the theoretical maximum distance between α-carbons imposed by the length of cross-linker arm. Comparison of Cα-Cα distances for those cross-linking pairs that can be mapped on the crystal structures of β2AR and GRK5 shows 6 BS3 cross-links in all models, mainly cluster 1, were within the ~30 Å distance restraint imposed by the chemistry of this cross-linker (Figure 6B). However, inter-chain distances of GRK5 RH bundle subdomain/β2AR ICL2 restraints (cluster 2) significantly exceeded the 30 Å cut-off in Model 1 (Figure 6B) strongly suggesting that GRK5 undergoes substantial conformational changes involving the RH bundle upon forming a complex with the β2AR.
Figure 6. Topology of β2AR/GRK5 complex as suggested by computational modeling and docking guided by cross-linking structural restraints.

(A) Three models of the GRK5/β2AR complex, showing a possible progression of GRK5 from initial binding pose to the final complex through a series of conformational changes. GRK5 was docked on the β2AR in compact conformation (Model 1), elongated based on MD simulations of the ionic lock disruption (Model 2) and the RH bundle subdomain rotated (Model 3).
(B) Cα-Cα distances calculated for BS3 cross-linked residues in three β2AR/GRK5 docking models depicted in panel A. The distances for some cross-links were not measured due to the absence of atomic coordinates for the regions where they are located (Table S1). Expected distance cut-off for BS3 cross-linker is ~30 Å.
(C) Ribbon representation of Model 3. ICL2 of β2AR is aligned against RH bundle subdomain of GRK5 (pink) (left box), and ICL1/helix 8 of β2AR is aligned against N-lobe and NLBD of GRK5 (right box). Cross-linked residues are shown as spheres around Cα with colors according to the clusters they belong to.
The conformational changes described above were better accommodated in Model 2 (Figure 6A) with GRK5 in the elongated conformation observed in MD simulations of GRK5. Marked disposition of RH bundle subdomain was observed following transition from the compact (Model 1) to elongated state (Model 2), with an ~20 Å movement towards the membrane surface. This brings RH bundle subdomain in close proximity to ICL2 and results in a significant decrease of inter-chain distances for cluster 2 cross-links, involving RH bundle/ICL2 interface, while clusters 1 and 3 weren’t markedly changed (Figure 6B; Table S1). This indicates similar orientation of GRK5 in respect to the β2AR in Models 1 and 2 whereas most differences between the two models were contributed by the different position of RH bundle subdomain. This might highlight a progression of GRK5 from the initial docked compact conformation (Model 1) to an active elongated conformation on β2AR (Model 2) through changes involving disruption of the ionic lock and domain dissociation. Although GRK5 RH bundle subdomain/β2AR ICL2 distances were still slightly above distance cut-offs, markedly better convergence with the experimental data was achieved in Model 2 (Figure 6B).
To further refine the model of GRK5/β2AR complex, we took into consideration a high basic charge of RH bundle α5-helix, revealed in electrostatic contour of GRK5. A stretch of 6 lysines (Lys97, Lys101, Lys103, Lys104, Lys108 and Lys113) are located on the same side of the α5-helix (Figure 6A) providing high pI of this helix (10.1) comparable with pI of NLBD (11.4) known to facilitate GRK5 contact with negatively charged phospholipids. We hypothesize that α5-helix is also prone to interact with acidic lipids in this conformation. When disruption of the ionic lock in GRK5 increases dynamics of the RH domain enabling RH bundle α5-helix to translocate in close proximity to the membrane plane (Model 2), electrostatic interaction between this helix and acidic lipids can drive an additional ~30° rotation of RH domain around the same hinge used for the kinase elongation in Model 2. This would place the α5-helix in contact with membrane surface near ICL2 (Model 3). Further computational analysis supports these changes. Two of the lowest-frequency normal modes calculated on the GRK5 structure show a lateral rotation of the RH domain as well as the separation of the RH and kinase domain C-lobe (Figure S5). Generating conformations using these two modes, we obtained several models structurally similar to Model 3, supporting the plausibility of a structural transition from the compact conformation to the conformation of Model 3. Model 3 best agrees with cross-linking data with all cluster 2 (ICL2/RH bundle) cross-links and one cross-link between ICL3 and RH bundle (235-108) satisfying the ~30 Å limit imposed by the cross-linker (Figure 6B; Table S1). Thus, a total of 9 BS3 cross-links are within the maximum expected distance threshold in Model 3, indicating significant support for this docking model. Three large-distance BS3 cross-links connecting β2AR ICL3 with either the catalytic domain C-tail or the loop connecting αB/αC helices in N-lobe of GRK5 exceeded the expected BS3 distance limit by ~19 Å (227–487), ~18 Å (232–487) or ~15 Å (235-226) in Model 3, respectively (Figure 6B; Table S1). However, the catalytic domain C-tail is known to be highly flexible and is either disordered in GRK crystal structures or found in different locations in the vicinity of N-lobe, indicating an ambiguous position that might account for distance cut-off violations by some C-tail cross-links (227–487 and 232–487). Moreover, our docking models don’t take into consideration presumed closure of catalytic domain (activation) following GRK5 binding to receptor. This might slightly alter relative positions of N- and C-lobes of catalytic domain and these dynamics might affect distance restraints involving the N-lobe (235-226). While it’s possible that there are alternative conformations of the GRK5/β2AR complex, we believe our analysis reflects the preferred orientation of the proteins from the cross-linking and other data.
Thus, cross-linking analysis is in agreement with MD simulations involving ionic lock disruption and domain dissociation, with GRK5 adopting an elongated conformation on the receptor (Models 2 and 3). Proposed interaction of RH bundle to phospholipid membrane surface/ICL2 via the α5-helix of GRK5 might stabilize GRK5/β2AR complex in the final structure (Model 3), which provides the best fit to our experimental data (Table S1). This final structure features a large contact surface between the two proteins involving distinct regions of GRK5 thereby increasing stability of the complex necessary for efficient phosphorylation. Moreover, we speculate that the three models of the β2AR complex with GRK5 might represent three steps of complex formation (Figure 6A).
Topology of GRK5/β2AR complex in Model 3 also features the NLBD in the center of the GRK5/β2AR binding interface (Figure 6C), RH bundle in close proximity to ICL2 (Figure 6C, bottom box) and GRK5 N-lobe in the vicinity of ICL1 and helix 8 of the β2AR (Figure 6C, right box). Another aspect of our structural model is the position of the kinase domain with respect to the β2AR. It occupies a space between β2AR ICL3 and helix 8/C-terminus to ensure cluster 3 cross-links (GRK5 catalytic domain/β2AR C-terminus) are still plausible (Figure 6C). Relative structural proximity of ICL3 to GRK5 active site in our model also helps to account for ICL3 phosphorylation by GRKs observed for some GPCRs. Taken together, our modeling suggests that the combined effect of receptor docking and membrane association can result in significant conformational changes in GRK5 that enhance its coupling to a GPCR. Importantly, this is consistent with biochemical data revealing GRK5 conformational dynamics following β2AR binding and activation.
Mapping the GRK5/β2AR Binding Interface and GRK5 Dynamics using Hydrogen-Deuterium Exchange Mass Spectrometry (HDX-MS)
To further validate and refine our model, we mapped the GRK5/β2AR interface using an alternative approach, HDX-MS. We followed the same conditions of complex formation in bicelles/PIP2 as utilized in the BS3 cross-linking studies. Since we specifically looked for changes in the structural dynamics of the proteins upon transition from membrane- to receptor-bound complex, HDX studies of GRK5 alone and β2AR alone were also conducted in bicelles/PIP2 to ensure that changes are attributed to protein-protein rather than protein-membrane interactions.
Among protein regions that exhibited reduced deuterium uptake in the complex as compared to the individual proteins, the cytoplasmic portion of TM5 of β2AR and the NLBD of GRK5 demonstrated a decrease in the exchange rate consistent with their interaction revealed in the cross-linking studies (Figure 7A and 7B; Figure S6). Though the CLBD (residues 546–565) was not covered in HDX-MS analysis, the region that follows the CLBD (peptide 575–583) showed reduced HDX. Thus, these data are in line with our cross-linking data for cluster 1 restraints and support coupling of ICL3 (including TM5) with the lipid-anchoring segments of GRK5 (Figure 7A, bottom box). A few additional regions in close proximity to the NLBD were also protected, constituting a broad surface at the top of the GRK5 RH terminal subdomain and N-lobe facing the β2AR in the complex (Figure 7A).
Figure 7. Mapping binding interface and allosteric conformational changes in β2AR/GRK5 complex using HDX-MS.

(A) Protein regions with HDX rate decrease in the complex as compared to individual proteins are shown as non-transparent elements on the ribbon diagram of Model 3 (Figure 6A) while transparent elements map regions of either no change in HDX rate or not covered in the analysis. Boxed regions with significant HDX rate decrease are enlarged and compared to cross-linking data for cluster 1 (bottom box), cluster 2 (left box) and cluster 3 cross-links (right box). Cross-linked residues are shown as spheres around Cα with colors according to the clusters they belong to.
(B) Snake map showing differential deuterium uptake for the β2AR in complex with GRK5 as compared to the absence of GRK5.
See also Figures S6 and S7.
We observed reduced deuterium uptake of the RH bundle subdomain previously found to be either in close proximity or interacting with ICL2 of β2AR, based on the cross-linking data for cluster 2 restraints (Figure 7A, left box). Although changes in solvent exposure of ICL2 weren’t captured in HDX analysis, we wouldn’t expect to see large changes even if ICL2 is involved in direct interaction with GRK5 if ICL2 is a stable α-helix, as observed in active-state structures of the β2AR. However, reduced deuterium uptake in GRK5 RH bundle enabled validation of cluster 2 cross-links that map association of this domain with either β2AR ICL2 or membrane acidic lipids near β2AR ICL2.
The significant reductions in deuterium uptake in two distal regions of the solvent-exposed C-terminus of the β2AR (peptides 397–409 and 414–420) in the complex with GRK5 (Figures 7B and S6) were also evident from HDX-MS analysis. The reduced HDX rates of GRK5 catalytic domain active loop (peptide 342–357) and the hinge/αD-helix (peptide 264–286) regions seem to account for protection of the β2AR C-terminus (Figure 7A, right box), since it maps kinase regions previously assigned for substrate binding in kinase catalytic cleft of homologous protein kinases (Knighton et al., 1991).
We also noticed the area of protection at β2AR C-terminus is situated more distal (Figure 7B) relative to in cell phosphoproteomic studies of GRK6 phosphorylation sites (GRK5 is a close homolog of GRK6, which phosphorylated the β2AR C-terminus at Ser355 and Ser356) (Nobles et al., 2011). Since this area contains sites preferentially phosphorylated by GRK2 (Ser396, Ser401, Ser407, and Ser411), we sought to determine GRK5 phosphorylation sites on the β2AR under the conditions of HDX-MS experiment to figure out whether phosphoproteomic results correlate with HDX-MS. This might also help to map the position of the crystallographically disordered C-terminus of the β2AR relative to GRK5 catalytic cleft between N- and C-lobes. We performed in vitro phosphorylation using purified β2AR (in bicelles/PIP2) and GRK5. Significant phosphorylation of β2AR by GRK5 was evident from a gel shift of β2AR band (Figure S7A) with seven major and three minor sites of phosphorylation identified by tandem MS (Figure S7B). Four major and two minor sites of GRK5 phosphorylation resided in the regions with reduced deuterium uptake at the C-terminus showing a good correlation between results of phosphoproteomic study and HDX-MS data (Figure S7B). Thus, while mapping GRK5 phosphorylation sites revealed promiscuous phosphorylation of multiple sites at β2AR C-terminus, they are mainly located within the area of decreased deuterium uptake supporting these data.
The changes in deuterium uptake of GRK5 upon binding to β2AR can be attributed not only to intermolecular contacts with receptor but also to changes in the intramolecular dynamics of the enzyme (e.g., GRK5 activation). The dynamics of the phosphate-binding loop (P-loop) plays a role in protein kinase activation through formation of tighter contacts with the ATP triphosphate tail resulting in P-loop movement towards nucleotide during activation (Hemmer et al., 1997). The reduced HDX of the P-loop reflects these dynamic changes (Figure 7A, right box). The kinase domain C-tail, especially its central active site tether (AST) fragment, contributes to the stabilization of the GRK5 active state. AST establishes contact with bound nucleotide, N-lobe and the catalytic domain hinge facilitating kinase domain closure (Komolov et al., 2015). HDX analysis captured these dynamics (Figure 7A, right box).
Taken together, HDX-MS data are in a good agreement with the cross-linking data and support Model 3 of the GRK5/β2AR complex. Moreover, the HDX results support a regulatory role for receptor binding in GRK5 activation since it caused allosteric changes in the GRK5 catalytic domain proposed to stabilize the active state of GRK5.
Conclusions
We performed a comprehensive analysis of GRK5/β2AR interaction using a number of biochemical/biophysical approaches and discovered novel structural aspects of GRK5 activation. We demonstrated that GRKs possess high structural plasticity. Two major domains of GRK5 are able to dissociate following binding to receptor causing disruption of a transient electrostatic contact between them (the ionic lock). This can assist in formation of a more stable complex with the receptor and has a direct impact on catalytic properties of GRK5 to phosphorylate the receptor. Thus, this provides a structural basis for dynamic changes in GRK5 from its basal “crystallographic” conformation to a catalytically competent conformation in response to initial binding to the receptor. Using unambiguous distance restraints derived from chemical cross-linking data in combination with recently developed computational methods of structure modeling and refinement, we were able to generate a low-resolution three-dimensional model of the GRK5/β2AR complex.
STAR METHODS
Contact for Reagent and Resource Sharing
Please contact the Lead Contact, Jeffrey L. Benovic (jeffrey.benovic@jefferson.edu), with any requests regarding reagents used in this study.
Expression and purification of GRK5
The site-specific GRK5 ionic lock (K139A, K454A, R455A and M460A) and GRK5-DC (E91C and K454C) mutants were generated using the QuickChange Site-Directed Mutagenesis kit (Agilent) and verified by DNA sequencing. Wild type GRK5 and its mutants were overexpressed and purified from Sf9 insect cells as previously described (Komolov et al., 2015). For production of K3Fe(CN)6-treated GRK5-DC (containing intermolecular cross-link between GRK5 RH and kinase domains), GRK5-DC (13 μM), purified under nonreducing conditions, was incubated with 13 mM K3Fe(CN)6 in 20 mM HEPES, pH 7.2, 200 mM NaCl at 15°C for 2 h. Oxidizer removal and buffer-exchange into 20 mM HEPES, pH 7.2, 200 mM NaCl was accomplished using size-exclusion chromatography on Superdex 75 16/60 (GE Healthcare). Fractions were analyzed using SDS-PAGE under nonreducing conditions and peak fractions of the monomeric cross-linked protein were collected, concentrated to 2 mg/ml, and stored at −80°C.
Expression and purification of β2AR
The full-length β2AR bearing N-terminal FLAG tag was cloned into pVL1392 transfer vector for Bestbac expression system (Expression Systems). The full-length version was used for all experiments except the zero-length cross-linking studies, where a C-terminally truncated version (truncated after Gly365) was used. Sf9 cells were infected with the recombinant baculovirus, and then harvested after 48 hr of incubation at 27°C as described previously (Yao et al., 2006). Cell pellets were lysed by stirring in lysis buffer (20 mM HEPES, pH 7.5, 5 mM EDTA, 1 μM alprenolol) supplemented with protease inhibitors (Roche) for 30 min. The receptors were extracted from the membrane using dounce homogenization in solubilization buffer (20 mM HEPES, pH 7.5, 100 mM NaCl, 1% DDM, 1 μM alprenolol) supplemented with protease inhibitors for 1.5 hr at 4°C. After adding 2 mM CaCl2, the solubilized receptors were clarified by high-speed centrifugation at 18,000×g for 30 min. The receptors were then captured by M1 antibody affinity chromatography (Sigma), and then eluted with HMS-CHS buffer (20 mM HEPES pH 7.5, 350 mM NaCl, 0.1% DDM, 0.01% cholesterol hemisuccinate) supplemented with 5 mM EDTA and 200 μg/ml free FLAG peptide. The receptors were further purified by affinity chromatography using alprenolol-Sepharose to select functional receptors, ligand exchange and DDM-MNG detergent exchange if needed. The receptor was further treated with PNGaseF/lambda phosphatase (New England Biolabs), dialyzed against HMS-CHS buffer with or without ligand, and concentrated to approximately 250 μM. The purity was >95% as assessed by SDS-PAGE.
In vitro reconstitutions of rHDL and bimane assays
The β2AR-rHDL particles were reconstituted in vitro by mixing POPC, POPG, human ApoA-1 and the β2AR as described (Whorton et al., 2007). 50 nM monobromobimane (bimane, Invitrogen) labeled β2AR was incubated with either 5 μM isoproterenol (ISO) or ICI-118551 (ICI) for 15 min at room temperature. After further addition of 1 μM Gs or GRK5, the protein samples were incubated for another 30 min. The bimane fluorescence was measured by excitation at 370 nm, and emission spectra was recorded from 430 to 510 nm at 1-nm increments with 0.5 nm s−1 integration on a Spex FluoroMax-3 spectrofluorometer (Jobin Yvon Inc.) in photon counting mode set at a 4-nm emission bandwidth pass. The results are representative of three independent experiments.
Bicelle/PIP2 preparation and receptor reconstitution procedures
78 mg DMPC, 1.95 mg cholesterol and 1 mg brain PIP2 (Avanti) were mixed in chloroform, vortexed until a uniform solution was formed and then chloroform was evaporated using a Speedvac. 26 mg CHAPSO (Avanti) was added while the mixture was resuspended in 600 μl buffer (20 mM HEPES, pH 7.5, 50 mM NaCl). This produces a 16% bicelle stock (3:1 molar ratio of DMPC to CHAPSO) with ~0.16% PIP2 which was then sonicated, aliquoted, overlayed with argon, and stored at −80°C. For receptor reconstitu tion into bicelles, bicelles were thawed at room temperature until the phase changed to a clear gel and then transferred to ice to liquefy. Bicelles were gently mixed with receptor sample, incubated on ice for 30 min to allow complete reconstitution of the receptors into bicelles, and kept on ice for the following studies.
In vitro-binding assays
Binding between GRK5 and β2AR was evaluated using a pull-down assay with M1 Flag resin. All operations were carried out at 4°C on a rocker. To test different binding conditions, 5 μM β2AR was initially reconstituted into bicelles (with or without natural PIP2 or C8-PIP2), HDLs (nanodiscs) or solubilized in MNG-3 micelles supplied with 50 μM natural PIP2 or C8-PIP2. β2AR was immobilized on M1 agarose by incubating 15 μg of β2AR with 15 μl of a 75% (v/v) suspension of affinity beads in 0.3 ml of binding buffer (20 mM Tris-HCl, pH 7.5, 25 mM NaCl, 1 mM CaCl2 and 0.0001% MNG-3). After 1 h incubation, the resin was washed three times with 1 ml of the binding buffer and 6 μg of GRK5 was added in 0.3 ml of the binding buffer for another 1 h incubation. The resin was again washed three times with 1 ml of the binding buffer to remove free GRK5 and the β2AR/GRK5 complex was eluted from antibodies by low pH (100 mM Glycine, pH 3.5 and 0.01% MNG-3). Amount of GRK5 bound to β2AR was analyzed by SDS-PAGE.
Phosphorylation of β2AR and other substrates
GRK5-mediated phosphorylation was assayed by incubating purified WT or mutant GRK5 (50 nM) with either ROS membranes (1.5 μM rhodopsin), β2AR (1.5 μM), or tubulin (1.5 μM) in 20 mM Tris-HCl, pH 7.4, 5 mM MgCl2, 30 mM NaCl, 0.5 mM EDTA, 100 μM [γ32P]ATP (2000 cpm/pmol) at 30°C. To study the effect of acidic li pids on GRK5-mediated β2AR phosphorylation, β2AR was prepared as described in the previous section. Reactions were incubated for 10 min, stopped with SDS sample buffer and the samples were electrophoresed on 10% SDS-polyacrylamide gels and visualized by autoradiography. Phosphorylation stoichiometries were determined by excising the phosphorylated proteins from the dried gels and counting in a scintillation counter.
Michaelis-Menten kinetic analysis
Km, Vmax and kcat for ATP were determined by varying ATP concentrations from 2–200 μM in reactions containing 2 μM MNG-solubilized β2AR/20 μM C8-PIP2 and 20 nM WT or ionic lock mutant GRK5 in 20 mM Tris-HCl, pH 7.4, 5 mM MgCl2, 30 mM NaCl, 0.5 mM EDTA and 100 μM [γ32P] ATP (2000 cpm/pmol). Reactions proceeded for 5 min at 30°C and were stopped with SDS sample buffer. β2AR phosphorylation was quantified as described above. Reaction velocities at the various ATP concentrations were fit to the Michaelis-Menten equation using GraphPad Prism.
Analytical size-exclusion chromatography
Complex formation between GRK5 and β2AR (in MNG-3) was tested by preparation of a 13 μM GRK5/β2AR mixture with or without 100 μM C8-PIP2. The sample was run on a Superose 12 10/300 GL column (GE Healthcare) equilibrated with buffer containing 20 mM HEPES, pH 7.2, 100 mM NaCl and 0.0005% MNG-3. Fractions containing GRK5, β2AR or the complex were collected and analyzed by SDS-PAGE. For the apparent molecular mass analysis of free proteins as well as the complex, the column was calibrated using cytochrome c (12.4 kDa), carbonic anhydrase (29 kDa), albumin (66 kDa), alcohol dehydrogenase (150 kDa), β-Amylase (200 kDa) and blue dextran (2000 kDa) from the Gel Filtration Molecular Weight Markers Kit (Sigma-Aldrich).
Domain proximity assay
RH/kinase domain proximity in GRK5 at the ionic lock site was monitored by observation of the rate of intramolecular disulfide cross-linking in GRK5-DC under nonreducing conditions. GRK5 wt or GRK5-DC (1.5 μM) was incubated with 1.5 mM of freshly prepared K3Fe(CN)6 in 20 mM HEPES, pH 7.2, 0.2 M NaCl at 15°C while rocking. At indicated time, an aliquot was withdrawn for SDS-PAGE gel analysis under nonreducing conditions. Effect of GRK5 binding to receptor on disulfide bond formation in GRK5-DC was evaluated in the presence of 5 μM BI-β2AR supplemented with 35 μM C8-PIP2 or reconstituted into bicelles with natural PIP2 essentially as described above.
Circular dichroism
Thermal unfolding of WT and ionic lock mutant GRK5 was monitored by recording variations in ellipticity at 222 nm as a function of temperature in 1.0°C increments from 20 to 70°C using a Jasco J-810 spectropolarimeter equipped with a Peltier temperature control system. Measurements were conducted using a 0.1 cm quartz cuvette (Starna Cells, Inc.) with GRK5 at a final concentration of 5 μM in phosphate-buffered saline solution (3.2 mM Na2HPO4, 0.5 mM KH2PO4, pH 7.4, 135 mM NaCl). The cooperativity index, n, describing the sigmoidicity of the thermal denaturation curve was calculated by applying the Hill equation, n = (log 81)/log(T0.9/T0.1), where T0.1 and T0.9 are the temperatures where the fractional completions of the unfolding transition are 0.1 and 0.9, respectively.
Electron Microscopy
Samples were prepared for electron microscopy using the conventional negative staining protocol (Peisley and Skiniotis, 2015). The negative stained samples were imaged at room temperature with a Tecnai T12 electron microscope operated at 120 kV using low-dose procedures. Images were recorded at a magnification of ×71,138 and a defocus value of ~1.4 μm on a Gatan US4000 CCD camera. All images were binned (2 × 2 pixels) to obtain a pixel size of 4.16 Å on the specimen level. Particles were excised using Boxer (part of the EMAN 2.1 software suite) (Ludtke et al., 1999). Two-dimensional reference-free alignment and classification of particle projections was performed using Stable Alignment and Classification (ISAC) (Yang et al., 2012). 13865 projections of GRK5-DC were subjected to ISAC, producing 274 classes accounting for 9352 particle projections. Similarly, 15292 projections of GRK5 ionic lock mutant were subjected to ISAC, producing 341 classes accounting for 13521 particle projections. Representative class averages are shown in Figure S3.
Identification of phosphorylated residues by tandem mass spectrometry
Full-length agonist-bound BI-β2AR(PN1) and BI-β2AR(GS3) were embedded in bicelles prepared using lipid mixture containing natural PIP2 and phosphorylation was performed as described in the section “Phosphorylation of β2AR and other substrates” using cold ATP. Control sample containing nonphosphorylated (i.e., basally phosphorylated) β2AR was treated in the same manner, except for addition of GRK5 and ATP. Liquid chromatography tandem mass spectrometry (LC-MS/MS) analysis was performed by the Proteomics and Metabolomics Facility at the Wistar Institute using a Q Exactive HF mass spectrometer (ThermoFisher Scientific) coupled with a Nano-ACQUITY UPLC system (Waters). Following separation of the sample by SDS-PAGE, Coomassie-stained bands of nonphosphorylated or phosphorylated β2AR were excised, digested with trypsin, and injected onto a UPLC Symmetry trap column (180 μm i.d. x 2 cm packed with 5 μm C18 resin; Waters). Tryptic peptides were separated by reversed phase HPLC on a BEH C18 nanocapillary analytical column (75 μm i.d. x 25 cm, 1.7 μm particle size; Waters) using a 95 min gradient formed by solvent A (0.1% formic acid in water) and solvent B (0.1% formic acid in acetonitrile). A 30-min blank gradient was run between sample injections to minimize carryover. Eluted peptides were analyzed by the mass spectrometer set to repetitively scan m/z from 300 to 2000 in positive ion mode. The full MS scan was collected at 60,000 resolution followed by data-dependent MS/MS scans at 15,0000 resolution on the 20 most abundant ions exceeding a minimum threshold of 20,000. Peptide match was set as preferred, exclude isotopes option and charge-state screening were enabled to reject unassigned charged ions.
Peptide sequences were identified using MaxQuant 1.5.2.8 (Cox and Mann, 2008). MS/MS spectra were searched against a custom UniProt protein database containing the recombinant protein sequences using partial tryptic specificity with up to two missed cleavages, static carboxamidomethylation of Cys, and variable oxidation of Met, protein N-terminal acetylation, and phosphorylation on Ser, Thr and Tyr. Modified peptides were required to have a minimum score of 40. Consensus identification lists were generated with false discovery rates of 1% at protein, peptide and site levels. We thank Dr. Hsin-Yao Tang for performing these studies at the Wistar Institute Proteomics and Metabolomics Facility.
HDX-MS sample preparation, mass spectrometry, peptide identification and data processing
To prepare a β2AR/GRK5 complex, 250 μM BI-167107-bound β2AR in 0.1% DDM was incubated with bicelle/PIP2 in a 1:2 ratio for 30 min on ice. An equal volume of 250 μM sangivamycin-bound GRK5 was further added and incubated 1 hr on ice to facilitate complex formation (final concentration of 4% bicelles with 0.04% PIP2). The β2AR alone in bicelles/PIP2 and sangivamycin-bound GRK5 alone in bicelles/PIP2 were used as controls at a final concentration of 125 μM. For deuterated samples, 8 μl of sample was mixed with 112 μl D2O buffer (20 mM HEPES, pH 7.5, 50 mM NaCl in D2O) and incubated for 10, 100, 1,000 and 10,000 sec on ice. At the indicated time points, a 30 μl sample was quenched with 30 μl ice-cold quench solution (100 mM Na2HPO4, 20 mM TCEP, pH 2.01) and then immediately frozen in liquid nitrogen. For non-deuterated samples, 6 μl samples were mixed with 84 μl H2O buffer (20 mM HEPES, pH 7.5, 50 mM NaCl in H2O), and a 30 μl sample was quenched with 30 μl ice-cold quench solution to achieve three 0 sec samples. Duplicate samples were prepared for each experiment, and three independent experiments were performed.
The samples were digested and analyzed by HDX-MS as described (Duc et al., 2015). Briefly, digestion was performed using an immobilized pepsin column (2.1 × 30 mm) (Life Technologies, Carlbad, CA, USA) at a flow rate of 100 μL/min with 0.05% formic acid in H2O at 10°C. Digested fragments were desalted and collected on a C18 VanGuard trap column (Waters, Milford, MA, USA) for 2 min and then analyzed by ultra-pressure liquid chromatography using an Acquity UPLC C18 column (1.7 μm, 1.0 × 100 mm) (Waters) at a flow rate of 40 μL/min with an acetonitrile gradient. To minimize back-exchange of deuterium to hydrogen, solvents were adjusted to pH 2.4 using 0.15% formic acid and the system including trap and UPLC columns were maintained at 0.5°C during analysis. Mass spectra of peptide fragments were analyzed with a Xevo G2 Quadruple-Time of Flight (Q-TOF) mass spectrometer equipped with a standard electrospray ionization (ESI) source in MSE mode. The mass spectra were acquired in the range of m/z 100–2000 Da for 10 min in positive ion mode.
Peptic peptides were identified from non-deuterated samples using Proteinlynx Global Server 2.4 software (Waters, Milford, MA, USA). Searches were conducted with the variable methionine oxidation modification and the peptides were filtered on a peptide score of no less than 6. The amount and percent deuterium exchange values for each peptide at variable time points were processed and determined by measuring the centroid of the isotopic distribution using DynamX 2.0 software (Waters).
Cross-linked protein complex preparation, mass spectrometry, peptide identification, data processing and analysis
The same procedures for HDX-MS sample preparations were also used to prepare 125 μM β2AR-GRK5 samples in 0.04% PIP2-containing 4% bicelles for BS3 cross-linking studies. The sample was diluted 5-fold to achieve a final concentration of 25 μM on ice. 125 μM BS3-d0 and 125 μM BS3-d4 (Thermo Scientific) were added into the protein sample for cross-linking at room temperature for 20 min and the reaction was terminated by adding 20 mM NH4HCO3.
For zero-length cross-linking studies, cross-linking controls revealed incidental cross-linking of GRK5 alone but not β2AR alone under these conditions and therefore we chose to conduct a two-step reaction with cross-linker activation in the presence of only β2AR, with GRK5 added after quenching of unreacted cross-linker. This eliminated the possibility of GRK5 self-crosslinking and minimized the risk of GRK5 structural perturbations due to extensive chemical modification. Thus, reactive acidic residues (Asp/Glu) on the β2AR targeted primary amines of GRK5 yielding 1:1 and 1:2 GRK5:β2AR complexes (Figure S4). For these studies, 120 μM of BI-bound β2AR(365N) in 0.01% MNG was incubated with 670 μM C8-PIP2 for 30 min on ice. The activation of β2AR with cross-linker was performed using 15 mM of freshly prepared 1-ethyl-3-(3-dimethylaminopropyl) carbodiimide (EDC, Pierce)/30 mM N-hydroxysulfosuccinimide (sulfo-NHS, Pierce) in activation buffer containing 25 mM MES, pH 6.0, and 100 mM NaCl. The reaction was allowed to proceed for 15 min at 20°C with shaking (1100 rpm), and unreacted EDC was then quenched with an 8-fold excess of β-mercaptoethanol (120 mM). Purified GRK5 (12 μM) was then added to β2AR (12 μM) to facilitate β2AR-GRK5 cross-linking reaction. The reaction proceeded for 40 min at 20°C with shaking (1100 rpm) in cross-linking buffer containing 20 mM HEPES, pH 7.2, 100 mM NaCl and 0.0005% MNG. BS3 and zero-length cross-linked samples were separated on SDS-PAGE gels, stained with Coomassie Blue and the 1:1 β2AR-GRK5 complexes were excised and stored in 10% acetic acid for MS analysis.
Sample preparation for LC-MS
Gel bands were diced into 1×1 mm squares, rinsed multiple times with 50 mM ammonium bicarbonate and reduced with 5 mM DTT, 50 mM ammonium bicarbonate at 55°C for 30 min. Residual solvent was removed and alkylation was performed using 10 mM propionamide in 50 mM ammonium bicarbonate for 30 min at room temperature. The gel pieces were rinsed 3 times with 50% acetonitrile, 50 mM ammonium bicarbonate and placed in a speed vac for 5 min. Digestion was performed with trypsin/LysC (Promega) in both a standard overnight digest (14 hr) at 37°C as well as in a limited digest format (1 hr at 50°C). Chymotrypsin (Promega) digests were performed overnight with the addition of 0.5 mM CaCl2 to the 50 mM ammonium bicarbonate. Tubes were centrifuged and the solvent including peptides were collected and further peptide extraction was performed by the addition of 60% acetonitrile, 39.9% water, 0.1% formic acid and incubation for 10–15 min. The peptide pools were dried in a speed vac.
LC-MS
In a typical experiment, digested cross-linked peptide pools were reconstituted and injected onto a 100 micron I.D. C18 reversed phase analytical column, 25–50 cm in length. The UPLC was a Waters M class, operated at 300 nL/min using a linear gradient from 4% to 35% mobile phase B. Mobile phase A consisted of 0.1% formic acid, 5% DMSO; mobile phase B was 0.1% formic acid, 5% DMSO, acetonitrile. All data were collected using an Orbitrap Fusion mass spectrometer set to acquire data in a data dependent decision tree fashion selecting and fragmenting by ETD or HCD the most intense precursor ions defined by a predetermined schema where both m/z and charge state are considered. An exclusion window of 60 sec was used to improve proteomic depth and multiple charge states of the same ion were sampled.
LC-MS data analysis
All MS/MS data were analyzed using Preview, Byonic v2.6.49 and Byologic v. 2.6–73 (ProteinMetrics) as well as custom in house tools for data analysis developed in MatLab. Preview was used to verify system calibration using uncrosslinked peptides prior to Byonic analysis. For BS3 crosslinks, Byonic used the exact mass of peptide fragments for crosslink assignment. For zero-length crosslinking, Byonic analyses were completed using the ‘Xlink’ functionality to generate a complete list of possible crosslinked peptides using a custom FASTA file containing the target protein sequences. For both analyses, sequences were searched with a reverse-decoy strategy at a 1% false discovery rate to identify both crosslinked and uncrosslinked peptide assignments. Byonic searches were performed using 10 ppm mass tolerances for precursor and HCD fragment ions, and with 0.3 Da tolerances for ETD fragment ions detected in the ion trap. In addition, these searches required fully specific tryptic or chymotryptic digestion allowing up to two missed cleavages per peptide. The resulting identified potential crosslinked peptide spectral matches were then exported for further analysis by Byologic.
Given the number of possible crosslinked peptides observed in these experiments, additional empirical constraints were applied to the potential crosslinked peptides to produce a more rigorous validation set for comparison with other biochemical assays. For the BS3 cross-linking studies, crosslinked spectra were required to meet the following criteria: 1) all peptides, crosslinked or native, were filtered to a <1% FDR; 2) precursor mass error of less than 7 ppm was required for crosslinked peptides, and 3) the peptide primary sequence was at least 6 amino acids in length for at least one of the GRK5/β2AR crosslinked peptide pairs. For zero-length crosslinking data analysis, the following additional constraints were added to those described above for BS3 crosslinking: 1) a minimum length of five amino acids was required for both members of the crosslink; 2) an alternative ‘XLink’ algorithm from Byonic was used to make assignments based on fragmentation of both peptides rather than just crosslink partner mass; 3) the crosslinks were assumed valid only if the GRK5 contained the lysine crosslink partner; and 4) at least two crosslinked peptide spectra were assigned to the linkage.
MD simulation setup
Simulations of GRK5 were based on the sangivamycin-bound crystal structure (PDB ID 4TNB) (Komolov et al., 2015). The protein was simulated in two distinct conditions: (1) the sangivamycin-bound crystal structure, and (2) the same structure with the residues Glu91, Val92, Lys139, Glu140, Asn452, Lys454, and Arg455 mutated to alanine to eliminate the ionic lock interactions which we hypothesized stabilizes the crystallographic conformation. Missing hydrogen atoms were added using Prime (Schrödinger, Inc.). The protein chain termini were capped with the neutral groups acetyl and methylamide. Titratable residues were left in their dominant protonation state at pH 7.0. The prepared protein structures were inserted into a cubic box of explicitly represented water with 0.15 M NaCl, then neutralized by removing sodium ions. Final system dimensions were approximately 110 × 110 × 110 Å3, including about 107 sodium ions, 109 chloride ions, and 40,000 water molecules.
MD simulation force field parameters
We used the CHARMM36 parameter set for protein molecules and salt ions, and the CHARMM TIP3P model for water (Best et al., 2012). Parameters for sangivamycin were generated using the CHARMM General Force Field (CGenFF) (Vanommeslaeghe et al., 2010) with the ParamChem server (paramchem.org), version 1.0.0. Full parameter sets are available upon request.
MD simulation protocol
Simulations were performed on GPUs using the CUDA version of PMEMD (Particle Mesh Ewald Molecular Dynamics) in Amber 16 (Case et al., 2016). Prepared systems were minimized, then equilibrated as follows: the system was heated using the Langevin thermostat from 0 to 100 K in the NVT ensemble over 12.5 ps with harmonic restraints of 10.0 kcal·mol−1·Å−2 on the non-hydrogen atoms of the protein and ligand, and initial velocities sampled from the Boltzman distribution. The system was then heated to 310 K over 125 ps in the NPT ensemble with anisotropic pressure coupling and a pressure of one bar. Further equilibration was performed at 310 K with harmonic restraints on the protein and ligand starting at 5.0 kcal·mol−1·Å−2 and reduced by 1.0 kcal·mol−1·Å−2 in a stepwise fashion every 2 ns, for a total of 10 ns of additional restrained equilibration.
Six independent production simulations were initialized from the final snapshot of the restrained equilibration for each condition, for a total of 12 simulations. These simulations were conducted in the NPT ensemble at 310 K and 1 bar, using a Langevin thermostat and Monte Carlo barostat. In each of these simulations, we performed 5 ns of unrestrained equilibration followed by production simulations. Production simulations were 1.2 μs, 1.0 μs, 0.8 μs, 0.6 μs, 0.6 μs and 0.6 μs in length for condition 1 (wild-type) and 1.2 μs, 1.2 μs, 0.9 μs, 0.9 μs, 0.8 μs and 0.8 μs in length for condition 2 (ionic lock mutant).
Simulations used periodic boundary conditions, and a time step of 4.0 fs, with hydrogen mass repartitioning (Hopkins et al., 2015). Bond lengths to hydrogen atoms were constrained using SHAKE. Non-bonded interactions were cut off at 9.0 Å, and long-range electrostatic interactions were computed using the particle mesh Ewald (PME) method with an Ewald coefficient β of approximately 0.31 Å and B-spline interpolation of order 4. The FFT grid size was chosen such that the width of a grid cell was approximately 1 Å.
Analysis protocols for MD simulations
Trajectory snapshots were saved every 200 ps during production simulations. Trajectory analysis was performed using VMD (Humphrey et al., 1996) and CPPTRAJ (Roe and Cheatham, 2013), and visualization was performed using VMD.
Modeling of GRK5 with additional N- and C-terminal residues
A structural model of GRK5 was built starting from the published crystal structure of the kinase in a partially closed state (PDB ID 4TNB) (Komolov et al., 2015). The N-terminus of GRK5, predicted to be important for receptor-kinase interactions but unresolved in the crystal structure, was extended and modeled as an alpha-helix based on the structure of GRK6 (PDB ID 3NYN) (Boguth et al., 2010). The C-terminal domain of GRK5, thought to be important for lipid anchoring and absent in any of the crystal structures, was extended by 5 residues and modeled freely, to allow inclusion of two extra cross-linked sites for docking. The remainder of the domain was left out of the final model due to the lack of appropriate structural templates. The modeling was carried out using MODELLER (version 9.15) and the models ranked by the DOPE scoring function (Shen and Sali, 2006). To probe local flexibility of the structure prior to docking, CONCOORD (De Groot et al., 1997) was used on the best scoring model (using default parameters). The resulting models were clustered (using the root mean square deviation of the coordinates of alpha-carbon atoms and a threshold of 2 Å). The centroids of the ten largest clusters were then optimized using Reduce and used as a representative structural ensemble of GRK5.
Integrative modeling of the β2AR/GRK5 complex
The interaction of β2AR and GRK5 was modeled using HADDOCK (version 2.2) (Van Zundert et al., 2016), using the published structure of active β2AR (PDB ID 3SN6) (Rasmussen et al., 2011) and the structural ensemble of GRK5 described above. We used this crystal structure of the β2AR in our modeling since it adopts an active conformation when in complex with Gs with an outward swing of TM5 and TM6, and an opening of the cytoplasmic pocket between ICLs which is utilized by Gs and likely by GRK5 for binding (predicted by our bimane fluorescence studies). The two proteins were docked rigidly and then their interfaces, a region comprising all atoms of one partner within 10 Å of the other partner, were refined with full flexibility (backbone & side-chain). Among a total of 22 distance restraints identified in MS spectra of BS3 and zero-length cross-linked proteins, ten distance restraints (7 BS3 and 3 zero-length) couldn’t be mapped onto a three-dimensional model of GRK5/β2AR complex since they connect highly dynamic regions unresolved in the crystal structure (ICL3/C-terminus of β2AR and C-terminus of GRK5) (Table S1). Although we can’t accurately determine Cα-Cα distances for these structural restraints, visual inspection of the models showed structural proximity of these cross-linked domains indicating the possibility of their cross-linking in all three models (Figure 6A).
10,000 models were generated at the rigid-body stage and the best scoring 400, ranked by the HADDOCK scoring function, were further refined in the semi-flexible and solvated protocols. The final 400 models were clustered based on the fraction of common contacts (Rodrigues et al., 2012) (threshold 0.75) and each cluster scored on the average score of its best four models. The desolvation energy term was turned off for this final scoring step. The docking calculations were driven by mass spectrometry cross-link data. The cross-links between the RH domain of GRK5 and the receptor were excluded from the calculations, as well as those mapping to unresolved regions of either the receptor or the kinase structures. Each remaining BS3 cross-link was translated to an unambiguous distance restraint between terminal NZ atoms of the participating lysine residues, with a lower bound of 0 Å and an upper bound of 11.4 Å (fully extended cross-linker arm).
Normal mode analysis of GRK5
To assess a broad range of potential large conformational changes in GRK5, we performed normal mode analysis. We used the lowest-energy structural model with several unresolved N- and C-terminal residues added to the crystal structure, as described above. The normal modes were calculated in torsion-angle space, as implemented in the program STAND (Levitt et al., 1985 and M. Levitt, unpublished). We used a coarse-grained model (only Cα atoms) and a cutoff of 10 Å for the calculation of the elastic network model. To allow separation of the RH bundle and kinase domains (as observed in MD simulations and suggested by experiments), we deleted two ionic lock residues (K454 and R455) and their respective interactions from the elastic network model.
Quantification and Statistical Analysis
All statistical analyses were produced using Prism 6.0 (GraphPad Software) or SigmaPlot 11.0 (Systat Software). All data are expressed as the mean ± standard error of the mean (SEM), unless otherwise stated in the figure legend.
KEY RESOURCES TABLE
| REAGENT or RESOURCE | SOURCE | IDENTIFIER |
|---|---|---|
| Antibodies | ||
| Bacterial and Virus Strains | ||
| E. coli cells BL21(DE3)-Rosetta2 | Novagen | Cat# 71400 |
| Biological Samples | ||
| Chemicals, Peptides, and Recombinant Proteins | ||
| n-dodecyl-beta-D-maltopyranoside (DDM) | Anatrace | Cat# D310 |
| Lauryl maltose neopentyl glycol (MNG) | Anatrace | Cat# NG310 |
| Brain PI(4,5)P2 (natural PIP2) | Avanti | Cat# 840046X |
| 18:1 PI(4,5)P2 (synthetic PIP2) | Avanti | Cat# 850155P |
| 08:0 PI(4,5)P2 (C8-PIP2) | Avanti | Cat# 850185P |
| DMPC | Avanti | Cat# 850345P |
| CHAPSO | Avanti | Cat# 850501 |
| POPC | Avanti | Cat# 850457P |
| POPG | Avanti | Cat# 840457 |
| Cholesterol | Avanti | Cat# 840457 |
| FLAG peptide | Sigma-Aldrich | Cat# F3290 |
| Alprenolol | Sigma-Aldrich | Cat# A8676 |
| BI-167107 | Custom | N/A |
| Isoproterenol | Tocris | Cat# 1747 |
| ICI-118551 | Tocris | Cat# 0821 |
| Sangivamycin | Sigma-Aldrich | Cat# S5895 |
| ATP | Sigma-Aldrich | Cat# A2383 |
| ADP | Sigma-Aldrich | Cat# A2754 |
| Adenosine 5′-(β,γ-imido)triphosphate (AMP-PNP) | Sigma-Aldrich | Cat# A2647 |
| ESF921 culture medium | Expression Systems | Cat# 96-001 |
| Monobromobimane | Invitrogen | Cat# M1378 |
| BS3-d0/d4 | Pierce | Cat# 21590/5 |
| EDC | Pierce | Cat# 22980 |
| Sulfo-NHS | Pierce | Cat# 24510 |
| 2-Mercaptoethanol | Sigma-Aldrich | Cat# M7154 |
| Trypsin/LysC | Promega | Cat# V5072 |
| Chymotrypsin | Promega | Cat# V1062 |
| Protease Inhibitors | Roche | Cat# 4693159001 |
| Cholesteryl Hemisuccinate | Steraloids | Cat# C6823 |
| Potassium hexacyanoferrate (III) (K3Fe(CN)6) | Sigma-Aldrich | Cat# 244023 |
| PNGase F | New England Biolabs | Cat# P0708 |
| Lambda Protein Phosphatase (Lambda PP) | New England Biolabs | Cat# P0753 |
| Tubulin | Cytoskeleton | Cat# T238 |
| ATP, [γ-32P] | PerkinElmer | Cat# BLU002Z001MC |
| Gel Filtration Markers Kit for Protein Molecular Weights 12,000–200,000 Da | Sigma-Aldrich | Cat# MWGF200-KT |
| TCEP | Sigma-Aldrich | Cat# C4706 |
| Critical Commercial Assays | ||
| QuikChange XL-II site-directed mutagenesis kit | Agilent Technologies | Cat# 200521 |
| Deposited Data | ||
| Experimental Models: Cell Lines | ||
| Insect cell line Sf9 | Expression Systems | N/A |
| Insect cell line High Fives (Tni) | Expression Systems | N/A |
| Experimental Models: Organisms/Strains | ||
| Oligonucleotides | ||
| GRK5 K454A, R455A and M460A forward mutagenesis primer | IDT | CAGGAACATGAACTTCGCGGCCTTAGAAGCCGGGGCGTTGGACCCTCCC |
| GRK5 K454A, R455A and M460A reverse mutagenesis primer | IDT | GGGAGGGTCCAACGCCCCGGCTTCTAAGGCCGCGAAGTTCATGTTCCTG |
| GRK5 K139A forward mutagenesis primer | IDT | CTCCTACAGAAGCCGTGCGCAGAACTCTTTTCTGCCTG |
| GRK5 K139A reverse mutagenesis primer | IDT | CAGGCAGAAAAGAGTTCTGCGCACGGCTTCTGTAGGAG |
| GRK5 K454C forward mutagenesis primer | Stanford PAN facility | CATGAACTTCTGCCGCTTAGAAGCCG |
| GRK5 K454C reverse mutagenesis primer | Stanford PAN facility | TTCCTGAAGAAGGGGTGTC |
| GRK5 E91C forward mutagenesis primer | Stanford PAN facility | GGCAGAATATTGCGTTACTCCAGATGAAAAACTG |
| GRK5 E91C reverse mutagenesis primer | Stanford PAN facility | ACGGAGTCCAGGAACTGA |
| Recombinant DNA | ||
| pVL1392-wtβ2AR | This study | N/A |
| pVL1392-wtGRK5 | This study | N/A |
| pVL1392-mutGRK5 D91C/K454C | This study | N/A |
| pFastBac-mutGRK5 K139A/K454A/R455A/M460A | This study | N/A |
| pVL1392duet-Gαs/βγ | This study | N/A |
| pET26b-NB6B9 | This study | N/A |
| pET28a-ApoA1 | Addgene | Plasmid# 20060 |
| Software and Algorithms | ||
| Prism 6.0 | Graphpad | graphpad.com |
| PyMol 1.8 | Schrodinger | pymol.org |
| VMD | Humphrey et al., 1996 | www.ks.uiuc.edu/research/vmd/ |
| CPPTRAJ | AmberTools16 | ambermd.org |
| MODELLER 9.15 | Shen and Sali, 2006 | salilab.org/modeller/ |
| HADDOCK 2.2 | Van Zundert et al., 2016 | www.haddocking.org |
| Proteinlynx Global Server 2.4 | Waters | HDX-MS Toolbox |
| DynamX 2.0 | Waters | HDX-MS Toolbox |
| Byonic 2.6 | ProteinMetrics | http://www.proteinmetrics.com/products/byonic/ |
| Byologic 2.6 | ProteinMetrics | www.proteinmetrics.com/products/byologic/ |
| Preview | ProteinMetrics | www.proteinmetricscom/products/preview/. |
| Prime | Schrodinger | schrodinger.com/prime |
| CHARMM General Force Field | Vanommeslaeghe et al., 2010 | cgenff.paramchem.org |
| PMEMD | Case et al., 2016 | ambermd.org/ |
| CONCOORD | De Groot et al., 1997 | mpibpc.mpg.de |
| Reduce | MolProbity | molprobity.biochem.duke.edu/ |
| STAND | Levitt et al., 1985 | N/A |
| Other | ||
Supplementary Material
(A) GRK5/β2AR pull-down assay showing effect of different GRK5 ligands on GRK5 binding to β2AR. MNG solubilized receptor was immobilized on anti-FLAG resin, washed with buffer and incubated with ligand-bound GRK5. GRK5 binding was evaluated by intensity of GRK5 bands in a gel upon complex elution from antibody beads using low pH and the sample separation by SDS-PAGE. Addition of sangivamycin slightly increased GRK5 binding while ATP destabilized GRK5/β2AR interaction.
(B) Effect of natural PIP2 incorporation into bicelles on GRK5 coupling to β2AR. The effect was dose-dependent and required ~2 mol of PIP2/mol of β2AR which caused substantial increase in both binding of GRK5 (pull-down) and β2AR phosphorylation (32P). Additional increase of PIP2 concentration in bicelles didn’t cause additional increase of β2AR phosphorylation.
(C) Salt-dependence of β2AR phosphorylation. β2AR was reconstituted into bicelles with PIP2 and GRK5-mediated 32P incorporation was measured at different NaCl concentrations. A gradual drop in receptor phosphorylation was revealed at NaCl concentrations above 50 mM indicating electrostatic interaction is important for β2AR/GRK5 binding to occur.
(D) Direct binding (pull-down) and phosphorylation data comparing GRK5 binding to β2AR solubilized in MNG or reconstituted into lipid bilayer of HDL particles (nanodiscs). All values represent mean ± SEM from three independent experiments. (E) Lipids and detergents used in our studies. The number of carbons composing aliphatic chains of lipid and detergent molecules is denoted on the left. (F). Fluorescence emission spectra for monobromobimane-labeled β2AR. No change in fluorescence was detected upon addition of GRK5 to inverse agonist ICI bound β2AR, consistent with no GRK5 binding to inactive β2AR.
(A) Structural alignment of GRK5 complexes with inhibitor CCG215022 (4WNK) or AMP-PNP (4TND) illustrates conformational changes in RH and kinase domains of GRK5. The ionic lock between RH and kinase domains is disrupted in CCG215022 complex which correlates with more closed state of kinase domain in this structure as compared to AMP-PNP complex. Kinase domain closure is indicated by lowering of N-lobe’s P-loop (~3.5 Å) and αB/αC-helices (marked by blue arrow). Structural coordinates of the kinase domain C-lobe were superimposed to reveal conformational changes in the N-lobe and ionic lock contact.
(B) Structural alignment of GRK6 bound to sangivamycin (3NYN) or AMP-PNP (2ACX) also demonstrates the structural dynamics of the RH/kinase electrostatic contact. The distance between RH and kinase domains in the sangivamycin complex is increased as compared to AMP-PNP complex and corresponding closing of kinase active site and lowering of the P-loop is highlighted with a blue arrow. (C) Interdomain distances in MD simulations of GRK5 wild-type (blue) and the ionic lock mutant (red). Distance traces are as in Figure 3C, but all six simulations under each condition are shown.
Reference-free two-dimensional class averages were obtained using ISAC.
Time course of zero-length cross-linking reaction between β2AR(365N) and WT GRK5 as revealed by SDS-PAGE analysis. Control (β2AR alone) and time points are indicated above each lane. The position of 1:1 and 1:2 GRK5:β2AR complexes are shown on the right.
Lowest-frequency modes calculated on a GRK5 model derived from the crystal structure by addition of several N- and C-terminal residues and deletion of two ionic lock residues (K454 and R455). The first normal mode (not pictured here) exhibits twisting of the C-terminal tail of the GRK5 model; this mode is likely an artifact of the lack of the entire C-terminal lipid-binding domain in the model, and was therefore ignored. The next two modes are pictured here. The colors indicate different conformations sampled along each normal mode, from blue to orange, with the crystallographic conformation in red.
(A) Mode 2 shows separation of the RH and kinase C-lobe domains, similar to the motion seen in the MD simulations.
(B) Mode 3 shows a lateral swinging motion of the RH bundle subdomain.
(A) Sequence coverage of β2AR and GRK5. Blue bars represent the peptic peptides identified in this study.
(B–C) Deuterium uptake plots of GRK5 (B) and β2AR (C) regions that demonstrated reduced rate of HDX in the complex as compared to individual proteins. Values represent mean ± SEM from four independent experiments. P<0.05
(A) Two full-length β2AR constructs PN1 and GS3 with slight differences in primary sequence of C-terminal fragment (PN1 contains 3C protease recognition site inserted between Gly365 and Tyr366 while GS3 has wild type sequence of the C-terminus) were subjected to phosphoproteomics analysis following in vitro phosphorylation reaction with GRK5. Agonist-bound receptor was embedded into bicelles prepared using lipid mixture containing natural PIP2 and phosphorylated with GRK5 for 40 min. The samples were electrophoresed, protein bands were excised, digested with trypsin and analyzed by LC-MS/MS as described in STAR Methods.
(B) Mapping of GRK5 phosphorylation sites on β2AR. The sites were mapped on snake model of β2AR(PN1) also showing deuterium uptake data for this β2AR construct. Four out of seven major (Thr393, Ser401, Ser407 and Ser411) and two minor (Ser396 and Thr408) sites were located in two C-terminal regions showing reduced HDX rate in β2AR/GRK5 complex. This indicates a correlation between HDX-MS and phosphoproteomics studies. Two major phosphorylation sites (Thr360 and Ser364) were found in the regions not covered in HDX analysis. Presence of 3C protease recognition site at C-terminus of β2AR(PN1) (8 additional residues inserted between Gly365 and Tyr366) had a negligible effect on positions of phosphorylation sites and rate of phosphorylation as almost identical phosphorylation patterns were observed on β2AR(GS3) containing wild-type sequence of the C-terminus (not shown). Note that all GRK5 phosphorylation sites were mapped on cytoplasmic side of the receptor (the C-terminus and ICL3) though a few Ser/Thr residues were available for phosphorylation at extracellular side. It confirms that only binding of GRK5 to specific regions at cytoplasmic domain of β2AR results in receptor phosphorylation in a situation when both sides of the receptor are equally accessible for interaction.
Wild-type GRK5 favors a compact state in which the ionic lock tethers the RH bundle (blue) to the catalytic domain (green) in contact, and it remains in that state throughout the 740 ns of simulation shown in this movie. We do observe occasional separation between the two domains in other wild-type simulations. For clarity, water molecules and salt ions are not shown.
The ionic lock mutant of GRK5 shows remarkable conformational plasticity over the course of the simulation, with the RH bundle (blue) and catalytic domain (green) cycling between an open (elongated) and a closed (compact) state. This movie also shows 740 ns of simulation. For clarity, water molecules and salt ions are not shown.
HIGHLIGHTS.
GRK5-β2AR binding is enhanced by receptor and kinase ligands and acidic lipids
GRK5 binding to the β2AR involves a multi-site interaction
Receptor binding triggers substantial conformational changes in GRK5
RH/catalytic domain separation in GRK5 is essential for receptor phosphorylation
Acknowledgments
This research was supported by NIH awards R01GM068857 and P01HL114471 (to J.L.B) and R01GM083118 and R01NS028571 (to B.K.K.), the Mathers Foundation (to B.K.K), a Stanford University Terman Faculty Fellowship (to R.O.D.) and the National Research Foundation of Korea funded by the Korean government (NFR-2015R1A1A1A05027473 and NRF-2012R1A5A2A28671860) (to K.Y.C.).
Footnotes
AUTHOR CONTRIBUTIONS
K.E.K. performed cloning, expression and purification of GRK constructs, and conducted enzymatic, pull-down, domain proximity and zero-length cross-linking experiments. K.E.K. and Y.D. optimized conditions for generating a GRK/receptor complex. Y.D. performed receptor purification, bimane fluorescence assay, BS3 cross-linking experiments, generated the GRK5-DC mutant, and prepared samples for HDX-MS experiments. N.M.D. and K.Y.C. performed MS of the HDX-MS samples and data analysis. R.M.B. performed and analyzed MD simulations. J.P.G.L.M.R. and K.E.K performed computational modeling of the GRK5/β2AR complex. R.O.D. oversaw MD simulation and computational modeling. R.D.L. and C.M.A. analyzed the cross-linked complexes and the GRK5-DC protein by MS. D.P. and G.S. performed the EM experiments and analysis. B.K.K. and J.L.B. provided overall project supervision. K.E.K., Y.D., B.K.K. and J.L.B. wrote the manuscript with contributions from all authors.
Publisher's Disclaimer: This is a PDF file of an unedited manuscript that has been accepted for publication. As a service to our customers we are providing this early version of the manuscript. The manuscript will undergo copyediting, typesetting, and review of the resulting proof before it is published in its final citable form. Please note that during the production process errors may be discovered which could affect the content, and all legal disclaimers that apply to the journal pertain.
References
- Best RB, Zhu X, Shim J, Lopes PEM, Mittal J, Feig M, MacKerell AD. Optimization of the additive CHARMM all-atom protein force field targeting improved sampling of the backbone ϕ, ψ and side-chain χ 1 and χ 2 dihedral angles. J Chem Theory Comput. 2012;8:3257–3273. doi: 10.1021/ct300400x. [DOI] [PMC free article] [PubMed] [Google Scholar]
- Boguth CA, Singh P, Huang C, Tesmer JJG. Molecular basis for activation of G protein-coupled receptor kinases. EMBO J. 2010;29:3249–3259. doi: 10.1038/emboj.2010.206. [DOI] [PMC free article] [PubMed] [Google Scholar]
- Case DA, Betz RM, Cerutti DS, Cheatham TE, III , Darden TA, Duke RE, Giese TJ, Gohlke H, Goetz AW, Homeyer N, et al. AMBER 2016. University of California; San Francisco: 2016. [Google Scholar]
- Cox J, Mann M. MaxQuant enables high peptide identification rates, individualized p. p.b.-range mass accuracies and proteome-wide protein quantification. Nat Biotechnol. 2008;26:1367–1372. doi: 10.1038/nbt.1511. [DOI] [PubMed] [Google Scholar]
- Duc NM, Du Y, Thorsen TS, Lee SY, Zhang C, Kato H, Kobilka BK, Chung KY. Effective application of bicelles for conformational analysis of G protein-coupled receptors by hydrogen/deuterium exchange mass spectrometry. J Am Soc Mass Spectrom. 2015;26:808–817. doi: 10.1007/s13361-015-1083-4. [DOI] [PMC free article] [PubMed] [Google Scholar]
- De Groot BL, Van Aalten DMF, Scheek RM, Amadei A, Vriend G, Berendsen HJC. Prediction of protein conformational freedom from distance constraints. Proteins Struct Funct Genet. 1997;29:240–251. doi: 10.1002/(sici)1097-0134(199710)29:2<240::aid-prot11>3.0.co;2-o. [DOI] [PubMed] [Google Scholar]
- Hemmer W, McGlone M, Tsigelny I, Taylor SS. Role of the glycine triad in the ATP-binding site of cAMP-dependent protein kinase. J Biol Chem. 1997;272:16946–16954. doi: 10.1074/jbc.272.27.16946. [DOI] [PubMed] [Google Scholar]
- Homan KT, Tesmer JJ. Structural insights into G protein-coupled receptor kinase function. Curr Opin Cell Biol. 2014;27:25–31. doi: 10.1016/j.ceb.2013.10.009. [DOI] [PMC free article] [PubMed] [Google Scholar]
- Homan KT, Waldschmidt HV, Glukhova A, Cannavo A, Song J, Cheung JY, Koch WJ, Larsen SD, Tesmer JJG. Crystal structure of G protein-coupled receptor kinase 5 in complex with a rationally designed inhibitor. J Biol Chem. 2015;290:20649–20659. doi: 10.1074/jbc.M115.647370. [DOI] [PMC free article] [PubMed] [Google Scholar]
- Hopkins CW, Le Grand S, Walker RC, Roitberg AE. Long-time-step molecular dynamics through hydrogen mass repartitioning. J Chem Theory Comput. 2015;11:1864–1874. doi: 10.1021/ct5010406. [DOI] [PubMed] [Google Scholar]
- Huang CC, Orban T, Jastrzebska B, Palczewski K, Tesmer JJG. Activation of G protein-coupled receptor kinase 1 involves interactions between its N-terminal region and its kinase domain. Biochemistry. 2011;50:1940–1949. doi: 10.1021/bi101606e. [DOI] [PMC free article] [PubMed] [Google Scholar]
- Humphrey W, Dalke A, Schulten K. VMD: visual molecular dynamics. J Mol Graph. 1996;14:33–38. 27–28. doi: 10.1016/0263-7855(96)00018-5. [DOI] [PubMed] [Google Scholar]
- Johnson DA, Akamine P, Radzio-Andzelm E, Madhusudan M, Taylor SS. Dynamics of cAMP-dependent protein kinase. Chem Rev. 2001;101:2243–2270. doi: 10.1021/cr000226k. [DOI] [PubMed] [Google Scholar]
- Kang Y, Zhou XE, Gao X, He Y, Liu W, Ishchenko A, Barty A, White TA, Yefanov O, Han GW, et al. Crystal structure of rhodopsin bound to arrestin by femtosecond X-ray laser. Nature. 2015;523:561–567. doi: 10.1038/nature14656. [DOI] [PMC free article] [PubMed] [Google Scholar]
- Knighton DR, Zheng J, Ten Eyck LF, Xuong NH, Taylor SS, Sowadski JM. Structure of a peptide inhibitor bound to the catalytic subunit of cyclic AMP dependent protein kinase. Science. 1991;253:414–420. doi: 10.1126/science.1862343. [DOI] [PubMed] [Google Scholar]
- Komolov KE, Bhardwaj A, Benovic JL. Atomic structure of GRK5 reveals distinct structural features novel for G protein-coupled receptor kinases. J Biol Chem. 2015;290:20629–20647. doi: 10.1074/jbc.M115.647297. [DOI] [PMC free article] [PubMed] [Google Scholar]
- Lefkowitz RJ. Seven transmembrane receptors: something old, something new. Acta Physiol (Oxf) 2007;190:9–19. doi: 10.1111/j.1365-201X.2007.01693.x. [DOI] [PubMed] [Google Scholar]
- Levitt M, Sander C, Stern PS. Protein normal-mode dynamics: trypsin inhibitor, crambin, ribonuclease and lysozyme. J Mol Biol. 1985;181:423–447. doi: 10.1016/0022-2836(85)90230-x. [DOI] [PubMed] [Google Scholar]
- Ludtke SJ, Baldwin PR, Chiu W. EMAN: semiautomated software for high-resolution single-particle reconstructions. J Struct Biol. 1999;128:82–97. doi: 10.1006/jsbi.1999.4174. [DOI] [PubMed] [Google Scholar]
- Nobles KN, Xiao K, Ahn S, Shukla AK, Lam CM, Rajagopal S, Strachan RT, Huang T-Y, Bressler EA, Hara MR, et al. Distinct phosphorylation sites on the β2-adrenergic receptor establish a barcode that encodes differential functions of β-arrestin. Sci Signal. 2011;4:ra51. doi: 10.1126/scisignal.2001707. [DOI] [PMC free article] [PubMed] [Google Scholar]
- Pao CS, Barker B, Benovic JL. Role of the amino terminus of G protein-coupled receptor kinase 2 in receptor phosphorylation. Biochemistry. 2009;48:7325–7333. doi: 10.1021/bi900408g. [DOI] [PMC free article] [PubMed] [Google Scholar]
- Peisley A, Skiniotis G. 2D projection analysis of GPCR complexes by negative stain electron microscopy. Methods Mol Biol. 2015;1335:29–38. doi: 10.1007/978-1-4939-2914-6_3. [DOI] [PubMed] [Google Scholar]
- Pitcher JA, Fredericks ZL, Stone WC, Premont RT, Stoffel RH, Koch WJ, Lefkowitz RJ. Phosphatidylinositol 4,5-bisphosphate (PIP2)-enhanced G protein-coupled receptor kinase (GRK) activity. Location, structure, and regulation of the PIP2 binding site distinguishes the GRK subfamilies. J Biol Chem. 1996;271:24907–24913. doi: 10.1074/jbc.271.40.24907. [DOI] [PubMed] [Google Scholar]
- Pronin AN, Carman CV, Benovic JL. Structure-function analysis of G protein-coupled receptor kinase-5. Role of the carboxyl terminus in kinase regulation. J Biol Chem. 1998;273:31510–31518. doi: 10.1074/jbc.273.47.31510. [DOI] [PubMed] [Google Scholar]
- Rappsilber J. The beginning of a beautiful friendship: Cross-linking/mass spectrometry and modelling of proteins and multi-protein complexes. J Struct Biol. 2011;173:530–540. doi: 10.1016/j.jsb.2010.10.014. [DOI] [PMC free article] [PubMed] [Google Scholar]
- Rasmussen SGF, DeVree BT, Zou Y, Kruse AC, Chung KY, Kobilka TS, Thian FS, Chae PS, Pardon E, Calinski D, et al. Crystal structure of the β2 adrenergic receptor-Gs protein complex. Nature. 2011;477:549–555. doi: 10.1038/nature10361. [DOI] [PMC free article] [PubMed] [Google Scholar]
- Ring AM, Manglik A, Kruse AC, Enos MD, Weis WI, Garcia KC, Kobilka BK. Adrenaline-activated structure of β2-adrenoceptor stabilized by an engineered nanobody. Nature. 2013;502:575–579. doi: 10.1038/nature12572. [DOI] [PMC free article] [PubMed] [Google Scholar]
- Rodrigues JP, Trellet M, Schmitz C, Kastritis P, Karaca E, Melquiond AS, Bonvin AM. Clustering biomolecular complexes by residue contacts similarity. Proteins. 2012;80:1810–1817. doi: 10.1002/prot.24078. [DOI] [PubMed] [Google Scholar]
- Roe DR, Cheatham TE. PTRAJ and CPPTRAJ: Software for processing and analysis of molecular dynamics trajectory data. J Chem Theory Comput. 2013;9:3084–3095. doi: 10.1021/ct400341p. [DOI] [PubMed] [Google Scholar]
- Shen MY, Sali A. Statistical potential for assessment and prediction of protein structures. Protein Sci. 2006;15:2507–2524. doi: 10.1110/ps.062416606. [DOI] [PMC free article] [PubMed] [Google Scholar]
- Shi W, Osawa S, Dickerson CD, Weiss ER. Rhodopsin mutants discriminate sites important for the activation of rhodopsin kinase and Gt. J Biol Chem. 1995;270:2112–2119. doi: 10.1074/jbc.270.5.2112. [DOI] [PubMed] [Google Scholar]
- Vanommeslaeghe K, Hatcher E, Acharya C, Kundu S, Zhong S, Shim J, Darian E, Guvench O, Lopes P, Vorobyov I, et al. CHARMM general force field: A force field for drug-like molecules compatible with the CHARMM all-atom additive biological force fields. J Comput Chem. 2010;31:671–690. doi: 10.1002/jcc.21367. [DOI] [PMC free article] [PubMed] [Google Scholar]
- Whorton MR, Bokoch MP, Rasmussen SGF, Huang B, Zare RN, Kobilka BK, Sunahara RK. A monomeric G protein-coupled receptor isolated in a high-density lipoprotein particle efficiently activates its G protein. Proc Natl Acad Sci U S A. 2007;104:7682–7687. doi: 10.1073/pnas.0611448104. [DOI] [PMC free article] [PubMed] [Google Scholar]
- Yang Z, Fang J, Chittuluru J, Asturias FJ, Penczek PA. Iterative stable alignment and clustering of 2D transmission electron microscope images. Structure. 2012;20:237–247. doi: 10.1016/j.str.2011.12.007. [DOI] [PMC free article] [PubMed] [Google Scholar]
- Yao X, Parnot C, Deupi X, Ratnala VRP, Swaminath G, Farrens D, Kobilka B. Coupling ligand structure to specific conformational switches in the β2-adrenoceptor. Nat Chem Biol. 2006;2:417–422. doi: 10.1038/nchembio801. [DOI] [PubMed] [Google Scholar]
- Yao XJ, Vélez Ruiz G, Whorton MR, Rasmussen SGF, DeVree BT, Deupi X, Sunahara RK, Kobilka B. The effect of ligand efficacy on the formation and stability of a GPCR-G protein complex. Proc Natl Acad Sci U S A. 2009;106:9501–9506. doi: 10.1073/pnas.0811437106. [DOI] [PMC free article] [PubMed] [Google Scholar]
- Van Zundert GCP, Rodrigues JPGLM, Trellet M, Schmitz C, Kastritis PL, Karaca E, Melquiond ASJ, Van Dijk M, De Vries SJ, Bonvin AM. The HADDOCK2.2 web server: User-friendly integrative modeling of biomolecular complexes. J Mol Biol. 2016;428:720–725. doi: 10.1016/j.jmb.2015.09.014. [DOI] [PubMed] [Google Scholar]
Associated Data
This section collects any data citations, data availability statements, or supplementary materials included in this article.
Supplementary Materials
(A) GRK5/β2AR pull-down assay showing effect of different GRK5 ligands on GRK5 binding to β2AR. MNG solubilized receptor was immobilized on anti-FLAG resin, washed with buffer and incubated with ligand-bound GRK5. GRK5 binding was evaluated by intensity of GRK5 bands in a gel upon complex elution from antibody beads using low pH and the sample separation by SDS-PAGE. Addition of sangivamycin slightly increased GRK5 binding while ATP destabilized GRK5/β2AR interaction.
(B) Effect of natural PIP2 incorporation into bicelles on GRK5 coupling to β2AR. The effect was dose-dependent and required ~2 mol of PIP2/mol of β2AR which caused substantial increase in both binding of GRK5 (pull-down) and β2AR phosphorylation (32P). Additional increase of PIP2 concentration in bicelles didn’t cause additional increase of β2AR phosphorylation.
(C) Salt-dependence of β2AR phosphorylation. β2AR was reconstituted into bicelles with PIP2 and GRK5-mediated 32P incorporation was measured at different NaCl concentrations. A gradual drop in receptor phosphorylation was revealed at NaCl concentrations above 50 mM indicating electrostatic interaction is important for β2AR/GRK5 binding to occur.
(D) Direct binding (pull-down) and phosphorylation data comparing GRK5 binding to β2AR solubilized in MNG or reconstituted into lipid bilayer of HDL particles (nanodiscs). All values represent mean ± SEM from three independent experiments. (E) Lipids and detergents used in our studies. The number of carbons composing aliphatic chains of lipid and detergent molecules is denoted on the left. (F). Fluorescence emission spectra for monobromobimane-labeled β2AR. No change in fluorescence was detected upon addition of GRK5 to inverse agonist ICI bound β2AR, consistent with no GRK5 binding to inactive β2AR.
(A) Structural alignment of GRK5 complexes with inhibitor CCG215022 (4WNK) or AMP-PNP (4TND) illustrates conformational changes in RH and kinase domains of GRK5. The ionic lock between RH and kinase domains is disrupted in CCG215022 complex which correlates with more closed state of kinase domain in this structure as compared to AMP-PNP complex. Kinase domain closure is indicated by lowering of N-lobe’s P-loop (~3.5 Å) and αB/αC-helices (marked by blue arrow). Structural coordinates of the kinase domain C-lobe were superimposed to reveal conformational changes in the N-lobe and ionic lock contact.
(B) Structural alignment of GRK6 bound to sangivamycin (3NYN) or AMP-PNP (2ACX) also demonstrates the structural dynamics of the RH/kinase electrostatic contact. The distance between RH and kinase domains in the sangivamycin complex is increased as compared to AMP-PNP complex and corresponding closing of kinase active site and lowering of the P-loop is highlighted with a blue arrow. (C) Interdomain distances in MD simulations of GRK5 wild-type (blue) and the ionic lock mutant (red). Distance traces are as in Figure 3C, but all six simulations under each condition are shown.
Reference-free two-dimensional class averages were obtained using ISAC.
Time course of zero-length cross-linking reaction between β2AR(365N) and WT GRK5 as revealed by SDS-PAGE analysis. Control (β2AR alone) and time points are indicated above each lane. The position of 1:1 and 1:2 GRK5:β2AR complexes are shown on the right.
Lowest-frequency modes calculated on a GRK5 model derived from the crystal structure by addition of several N- and C-terminal residues and deletion of two ionic lock residues (K454 and R455). The first normal mode (not pictured here) exhibits twisting of the C-terminal tail of the GRK5 model; this mode is likely an artifact of the lack of the entire C-terminal lipid-binding domain in the model, and was therefore ignored. The next two modes are pictured here. The colors indicate different conformations sampled along each normal mode, from blue to orange, with the crystallographic conformation in red.
(A) Mode 2 shows separation of the RH and kinase C-lobe domains, similar to the motion seen in the MD simulations.
(B) Mode 3 shows a lateral swinging motion of the RH bundle subdomain.
(A) Sequence coverage of β2AR and GRK5. Blue bars represent the peptic peptides identified in this study.
(B–C) Deuterium uptake plots of GRK5 (B) and β2AR (C) regions that demonstrated reduced rate of HDX in the complex as compared to individual proteins. Values represent mean ± SEM from four independent experiments. P<0.05
(A) Two full-length β2AR constructs PN1 and GS3 with slight differences in primary sequence of C-terminal fragment (PN1 contains 3C protease recognition site inserted between Gly365 and Tyr366 while GS3 has wild type sequence of the C-terminus) were subjected to phosphoproteomics analysis following in vitro phosphorylation reaction with GRK5. Agonist-bound receptor was embedded into bicelles prepared using lipid mixture containing natural PIP2 and phosphorylated with GRK5 for 40 min. The samples were electrophoresed, protein bands were excised, digested with trypsin and analyzed by LC-MS/MS as described in STAR Methods.
(B) Mapping of GRK5 phosphorylation sites on β2AR. The sites were mapped on snake model of β2AR(PN1) also showing deuterium uptake data for this β2AR construct. Four out of seven major (Thr393, Ser401, Ser407 and Ser411) and two minor (Ser396 and Thr408) sites were located in two C-terminal regions showing reduced HDX rate in β2AR/GRK5 complex. This indicates a correlation between HDX-MS and phosphoproteomics studies. Two major phosphorylation sites (Thr360 and Ser364) were found in the regions not covered in HDX analysis. Presence of 3C protease recognition site at C-terminus of β2AR(PN1) (8 additional residues inserted between Gly365 and Tyr366) had a negligible effect on positions of phosphorylation sites and rate of phosphorylation as almost identical phosphorylation patterns were observed on β2AR(GS3) containing wild-type sequence of the C-terminus (not shown). Note that all GRK5 phosphorylation sites were mapped on cytoplasmic side of the receptor (the C-terminus and ICL3) though a few Ser/Thr residues were available for phosphorylation at extracellular side. It confirms that only binding of GRK5 to specific regions at cytoplasmic domain of β2AR results in receptor phosphorylation in a situation when both sides of the receptor are equally accessible for interaction.
Wild-type GRK5 favors a compact state in which the ionic lock tethers the RH bundle (blue) to the catalytic domain (green) in contact, and it remains in that state throughout the 740 ns of simulation shown in this movie. We do observe occasional separation between the two domains in other wild-type simulations. For clarity, water molecules and salt ions are not shown.
The ionic lock mutant of GRK5 shows remarkable conformational plasticity over the course of the simulation, with the RH bundle (blue) and catalytic domain (green) cycling between an open (elongated) and a closed (compact) state. This movie also shows 740 ns of simulation. For clarity, water molecules and salt ions are not shown.