Abstract
Myelodysplastic syndrome (MDS) predominantly occurs in aging people. Over the past decades, the cellular and molecular pathologies of MDS cells have been intensively investigated. However, how the bone marrow stromal niches are altered during MDS development remains elusive. In this study, we attempted to isolate and characterize mesenchymal stromal cells (MSCs) from 30 MDS patients. We observed that only 9/30 bone marrow aspirations from MDS patients successfully formed a monolayer in vitro, while 17/17 bone marrow aspirations from normal donors (median age 45 years, range: 22-73 years) succeeded in this process. Compared to normal MSCs, the MDS MSCs showed premature exhaustion, including reduced osteogenic differentiation ability, slower passage rate, and extremely limited passage times. These functional defects were associated with downregulation of Osterix and Runx2 genes and increased cell cycle arrest and apoptosis. However, the premature exhaustion of MDS MSCs did not correlate with patients’ ages, indicating that natural aging is not the cause of dysfunction in MDS MSCs. Our result provides a strong rational to target prematurely exhausting MSCs in future MDS treatment.
Keywords: Myelodysplastic syndrome, mesenchymal stromal cells, cell cycle, apoptosis
Introduction
Myelodysplastic syndrome (MDS) is a group of clonal diseases derived from hematopoietic stem cells, and is characterized by high heterogeneity, ineffective hematopoiesis and variable risk of progression to acute myeloid leukemia ranging from 5% to 65%) [1]. Over the past decades, the cellular and molecular pathologies of MDS cells have been broadly investigated in a cell autonomous manner [2,3], while the function of the bone marrow (BM) microenvironment in MDS patients remains elusive.
Mesenchymal stromal cells (MSCs) are a critical component of the BM microenvironment [4], which supports the normal hematopoiesis. Recently, BM microenvironment was demonstrated to contribute to MDS progression in a NUP98-HOXD13 model [5]. Co-culture analysis shows that human MDS blood cells directly convert normal MSCs to MDS MSCs [6]. Most strikingly, genetic disruption of stromal cells instead of hematopoietic cells induces a MDS-like disease in a murine model [7], supporting the important role of stromal cells in the initiation of MDS. However, it remains unclear how MDS MSCs are altered in vivo.
In this study, we attempted to isolate and characterize the MSCs from 30 MDS patients. In our experimental setting, only 30% (9/30) of MDS BM aspirations (9/30) formed a monolayer in an in vitro culture system, while 100% (17/17) of normal BM aspirations succeeded in this process. Moreover, all the cultured MSCs from nine MDS patients showed premature exhaustion, demonstrated by reduced potential of osteogenic differentiation, limited passages, slow growth rate, cell cycle arrest and increased apoptosis. Down regulation of Runx2 and Osterix genes associated with the phenotypes of MDS MSCs. Our study provides insights into the therapeutic potential of MSC treatment for MDS patients.
Materials and methods
Patient samples
Bone marrow specimens were obtained from 30 patients with newly diagnosed MDS (mean age 53 years, range 25-80 years). Based on the 2008 WHO classification of MDS, 13 patients had refractory cytopenia with multilineage dysplasia, 17 patients had refractory anemia with excess blasts. BM samples from 17 age- and sex-matched healthy individuals (median age 45 years, range: 22-73 years) served as controls. Signed informed agreements were obtained from all patients and donors, and the study was performed in accordance with the Declaration of Helsinki and approved by our local institutional review board.
Isolation and culture of MSCs
Mononuclear cells from fresh BM aspirations at the time of initial diagnosis were isolated by centrifugation (600 g. for 15 minutes) using Ficoll-Paque Plus density gradient (specific gravity 1.077 g/mL; Sigma Diagnostics, St. Louis, MO, USA). MNCs were seeded at an initial concentration of 1×10⁶ cells/mL in 25-cm2 culture flasks and cultured in Human Mesenchymal Stem Cell Growth Medium (Cyagen Biosciences Inc., Guangzhou, China) supplemented with 10% fetal bovine serum (FBS), 2 mM glutamine, 100 U/mL Penicillin-Streptomycin at 37°C with 5% CO2 in fully humidified atmosphere. After 72 h, the culture medium was replaced and non-adherent cells were removed. Since then, the culture medium was replaced twice a week. Upon reaching more than 70-80% confluence, cells were detached with 0.25% trypsin-EDTA (Gibico, Grand Island, NY, USA). At the second to fourth passage (P2 to P4), adherent MSCs were harvested and utilized for experimental analyses. The morphology of MSCs was examined every week under a phase-contrast microscope to identify structural differences between MDS and normal MSC cultures. To fulfill the criteria of the International Society for Cellular Therapy and to exclude contamination of hematopoietic cells from MSC cultures, MSCs were analyzed for the surface markers of CD34, CD45, CD73, CD166, CD90, and CD105 (BD Biosciences Pharmingen, San Diego, CA, USA) using flow cytometry.
MSC differentiation
Trypsinized MSCs from P2 were induced for adipogenic or osteogenic differentiation. To induce MSCs to differentiate into osteoblasts, MSCs were seeded at 2×10⁴ cells/well in six-well plates in the regular medium described above. When MSCs reached about 70% confluence, this medium was changed to Human Mesenchymal Stem Cell Osteogenic Differentiation Medium (Cyagen Biosciences Inc., Guangzhou, China) containing 10% FBS, 100 U/mL Penicillin-Streptomycin, 0.2 mM Ascorbate, 10 mM β-Glycerophosphate and 10-7 M Dexamethasone. The differentiation medium was replaced twice a week. After 2-week differentiation, cells were fixed and stained with Alizarin red. Adipogenic differentiation of MSCs was induced following a 14-day culture protocol, switching from adipogenic differentiation medium (ADM) (Cyagen Biosciences Inc., Guangzhou, China) containing 1 mM dexamethasone, 0.2 mM Rosiglitazone, 0.5 mM IBMX, 0.01 mg/ml insulin and 10% FBS for 72 hours to adipogenesis maintenance medium (AMM) (DMEM containing 0.01 mg/ml insulin and 10% FBS) for 24 hours. The treatment was repeated three times to achieve full adipogenic differentiation. The adipocytes were determined using OilRed O staining. Furthermore, the mRNA levels of Osterix, Runx2 and Dicer in MSCs were analyzed using quantitative real-time PCR.
Cell cycle assay
The P2 MSCs were fixed in 70% (w/v) ice-cold ethanol over night at 4°C, washed twice with PBS, and then treated with 50 μg/mL RNase for 30 min at 37°C followed by incubation in 10 μg/mL propidium iodine for 30 min in the dark at 4°C. DNA content was analyzed by a FACS Calibur (BD Biosciences, Mountain View, CA, USA) using the Cell quest software.
Apoptosis assay
The number of apoptotic cells in P3 MSCs was quantified using the Annexin-V-FITC Apoptosis Detection Kit (Invitrogen, Carlsbad, CA, USA) according to the manufacturer’s instructions. Earlyapoptotic cells were defined as Annexin-V+ 7-AAD- cells. The analyses were performed on a FACS flow cytometer (BD Biosciences, Sunnyvale, CA, USA).
Statistical analysis
Statistical Analysis was analyzed by student’s t-test method using SPSS statistical package software (IBM Corp., Armonk, NY, USA).
Results
Mesenchymal stromal cells derived from MDS patients are inefficient to form a monolayer in vitro
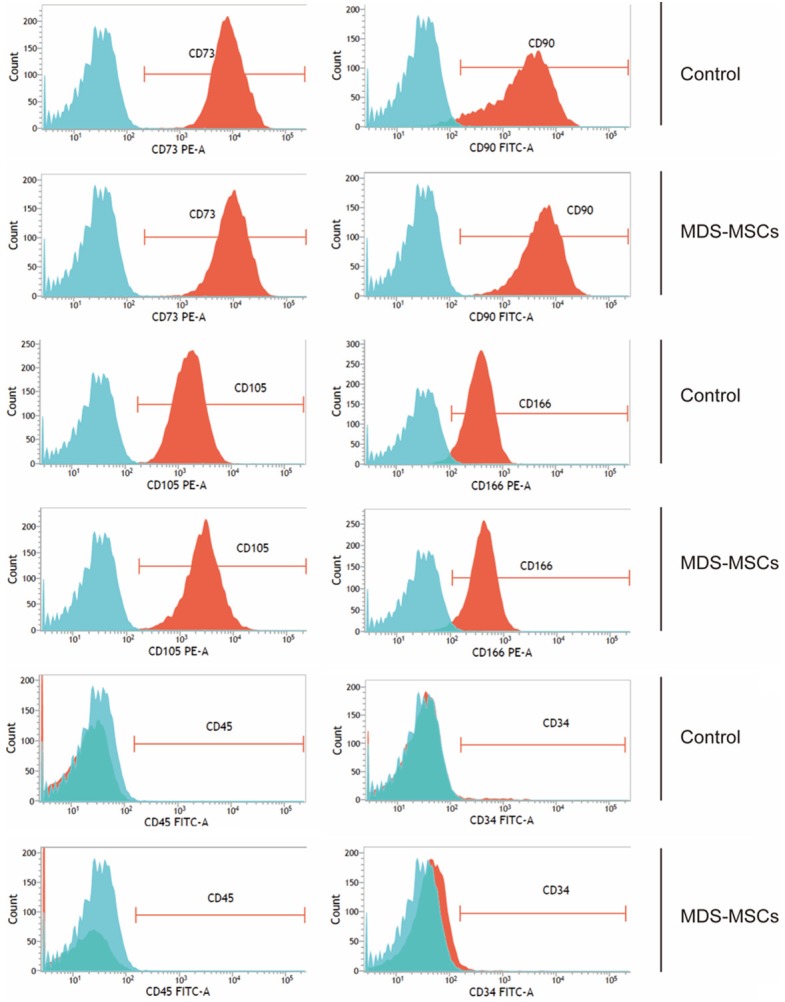
To characterize the MSCs from MDS bone marrows, we selected 30 MDS patients with an average age of 53 (ranging from 25 years old to 80 years old) and 17 age- and sex-matched people without MDS and other hematopoietic malignancies as controls. Only 30% (9 out of 30) of these MDS MSCs could form a monolayer in culture. In contrast, the control group achieved 100% (17 out of 17) successful rate (P<0.001). We further characterized these monolayer cells using flow cytometric analysis and found that monolayer cells from MDS patients shared the same immunophenotyes as control cells, which are CD73+CD90+CD105+CD166+CD45-CD34- (Figure 1).
Figure 1.

Phenotypic characterization of MSCs isolated from MDS patients and healthy donors. Total nucleated cells of bone marrows were obtained using Ficoll-Hypaque separation and plated into 25-cm2 culture flasks inHuman Mesenchymal Stem Cell Growth Medium as described in Materials and Methods. Cells from the third passage were used for flow cytometry analysis. Single live cells were gated. Representative plots from one MDS sample and one control sample were shown.
Downregulation of Osterix and Runx2 is associated with the reduced differentiation ability of MDS MSCs
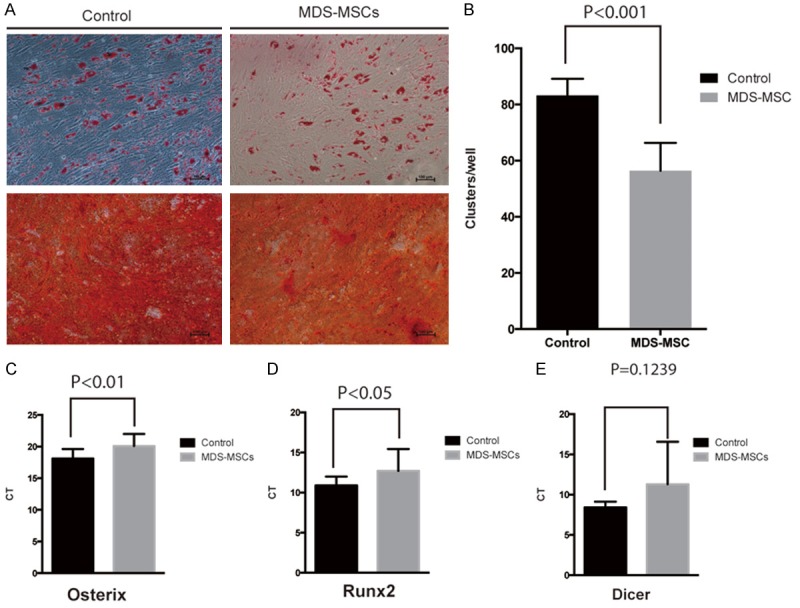
We examined the differentiation capacity of these MDS MSCs in adiopogenic and osteogenic differentiation assays. The results showed that although MDS MSCs could still undergo adiopogenic and osteogenic differentiation, the osteogenic differentiation ability significantly decreased compared with control MSCs (Figure 2A, 2B). To unravel the molecular mechanism underlying the decreased osteogenic differentiation ability of MDS MSCs, we analyzed the expression level of Osterix and Runx2, which are involved in osteogenic differentiation and stemness of MSCs [8]. Our results showed that the expression levels of Osterix and Runx2 in MDS MSCs were significantly decreased compared to those in control MSCs (P<0.05) (Figure 2B and 2C). Consistent with a previous report [9], the expression level of Dicer, which regulates aging process [10], was comparable between MDS and control MSCs (Figure 2D). Thus, the downregulation of Osterix and Runx2 is associated with the reduced osteogenic differentiation ability of MDS MSCs.
Figure 2.

MDS MSCs showed reduced osteogenic differentiation potential. A. Mineralization in treated cells was revealed by Alizarin Red S staining. Lipid vacuoles were stained with Oil Red O for adipogenic differentiation. Representative images from one MDS MSCs and control MSCs were shown. B. Statistical analysis of adipogenic clusters. Total adipogenic clusters per well (6 well pates) were counted from control MSCs and MDS MSCs. Five wells from each group were analyzed. P<0.001, student t-test. C. Quantitative PCR of Osterix gene in MDS MSCs and controls. D. Quantitative PCR of Runx2 gene in MDS MSCs and controls. E. Quantitative PCR of Dice gene in MDS patients derived MSCs and controls.
The premature exhaustion of MDS MSCs does not correlate to the age of MDS patients
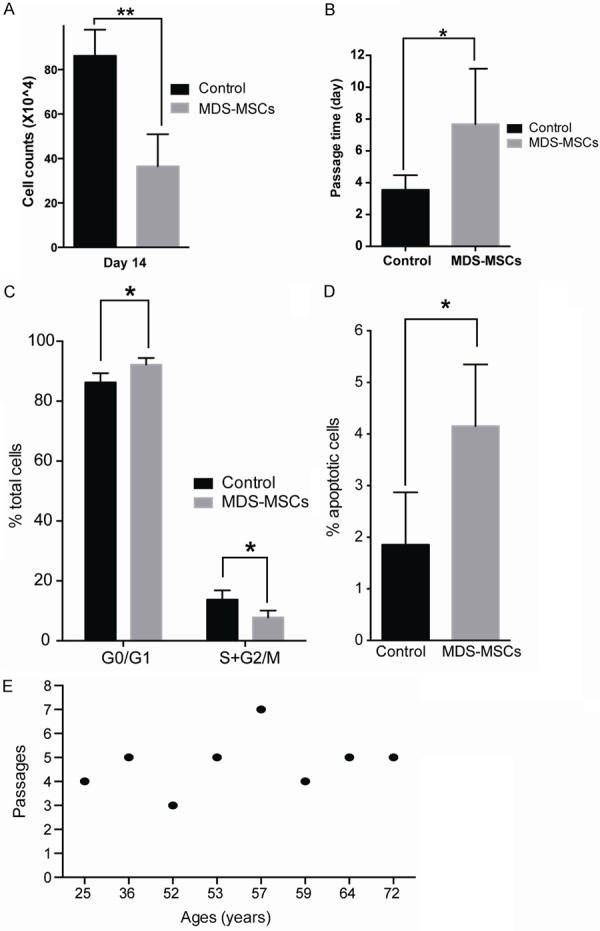
We further investigated the growth capacity of MDS MSCs in vitro. We started the culture with 50,000 live cells and cultured them for 14 days. The cell number of MDS MSCs increased 7.3 folds, while the control MSCs went up 17.3 folds (P<0.001) (Figure 3A). Consequently, the average passage time for MDS MSCs was significantly longer than that of control group (7.7 days versus 3.6 days) (Figure 3B). Moreover, MDS MSCs could not passage for more than 7 times; some of them became exhausted even at the third passage. In contrast, most control MSCs could be passaged for more than 15 times. The slower growth rate and limited passage times of MDS MSCs were associated with increased number of cells in G0/G1 phases (P<0.05) (Figure 3C) and increased apoptotic rate (Figure 3D). Together, our data suggest that MDS MSCs are prematurely exhausted.
Figure 3.

Proliferation assay showed much lower growth rates of MDS MSCs in vitro culture. A. The yields of MDS MSCs are significantly less than those from control counterparts. 50,000 cells were used as individual inputs. Cells were counted at day 14 by trypan blue staining. MDS MSCs samples, n=8, control samples, n=6, P<0.001, student t-test. B. Passage times of MDS MSCs are significantly longer than control counterparts. MDS MSCs samples, n=9, control samples, n=10, P<0.01, student t-test. C. Cell cycle analysis. MDS MSCs samples, n=5, control samples, n=7, P<0.01, student t-test. D. Apoptotic analysis. MDS MSCs samples, n=6, control samples, n=4, P<0.01, student t-test. E. Relation between patient ages and MSCs passages.
To determine whether natural aging is the cause of premature exhaustion of MDS MSCs, we analyzed the passage times of MDS MSCs and the corresponding patient age. No correlation could be established between the impaired passage ability and the age of MDS patients (Figure 3E). This result is consistent with our prior observation that the expression level of genes involved in aging (e.g. Dicer) in MDS MSCs is indistinguishable from that in control MSCs.
Discussion
In this study, we isolated and characterized MSCs from 30 patients diagnosed with MDS. We found that most of MDS MSCs lost the ability to proliferate in vitro, as 70% (21 out of 30) of these isolated primary MSCs failed to form a monolayer in the culture dish. For the 30% samples that could form a monolayer in vitro, they needed longer time to reach confluence and demonstrated impaired proliferation ability (Figure 3A-C). The MDS MSCs could hardly be passaged for more than 7 times. The exhaustion traits of these MDS MSCs are not associated with the ages of MDS patients (Figure 3E), indicating that additional pathological factors may account for this premature exhaustion. At the molecular level, genes regulating stemness and osteogenic differentiation were downregulated in MDS MSCs (Figure 2B and 2C). Our result is consistent with previous reports [11,12]. Based on previous studies that abnormal microenvironment could lead to MDS [7] and intervention of BM microenvironment could inhibit MDS in mouse [13], we favor the possibility that MDS blood cells promotes premature exhaustion of MDS MSCs, which in turn drive MDS progression. Since the primary MSCs were difficult to culture, we will run RNA-seq analysis using freshly isolated MDS MSCs in the future, which will allow us to determine the molecular signature of primary MSCs in the MDS background. This will pave the way for our understanding how the niche alterations impact on MDS development and how we can intervene this process in future MDS treatment.
Acknowledgements
This work was supported by a grant from National Natural Science Foundation of China (No. 81500102) to X.D. and R01 grants R01CA152108 and R01HL113066 as well as a Scholar Award from the Leukemia and Lymphoma Society to JZ.
Disclosure of conflict of interest
None.
References
- 1.Garcia-Manero G. Myelodysplastic syndromes: 2014 update on diagnosis, risk-stratification, and management. Am J Hematol. 2014;89:97–108. doi: 10.1002/ajh.23642. [DOI] [PubMed] [Google Scholar]
- 2.Tefferi A, Vardiman JW. Myelodysplastic syndromes. N Engl J Med. 2009;361:1872–1885. doi: 10.1056/NEJMra0902908. [DOI] [PubMed] [Google Scholar]
- 3.Papaemmanuil E, Gerstung M, Malcovati L, Tauro S, Gundem G, Van Loo P, Yoon CJ, Ellis P, Wedge DC, Pellagatti A, Shlien A, Groves MJ, Forbes SA, Raine K, Hinton J, Mudie LJ, McLaren S, Hardy C, Latimer C, Della Porta MG, O’Meara S, Ambaglio I, Galli A, Butler AP, Walldin G, Teague JW, Quek L, Sternberg A, Gambacorti-Passerini C, Cross NC, Green AR, Boultwood J, Vyas P, Hellstrom-Lindberg E, Bowen D, Cazzola M, Stratton MR, Campbell PJ Chronic Myeloid Disorders Working Group of the International Cancer Genome Consortium. Clinical and biological implications of driver mutations in myelodysplastic syndromes. Blood. 2013;122:3616–3627. doi: 10.1182/blood-2013-08-518886. quiz 3699. [DOI] [PMC free article] [PubMed] [Google Scholar]
- 4.Morrison SJ, Scadden DT. The bone marrow niche for haematopoietic stem cells. Nature. 2014;505:327–334. doi: 10.1038/nature12984. [DOI] [PMC free article] [PubMed] [Google Scholar]
- 5.Balderman SR, Li AJ, Hoffman CM, Frisch BJ, Goodman AN, LaMere MW, Georger MA, Evans AG, Liesveld JL, Becker MW, Calvi LM. Targeting of the bone marrow microenvironment improves outcome in a murine model of myelodysplastic syndrome. Blood. 2016;127:616–625. doi: 10.1182/blood-2015-06-653113. [DOI] [PMC free article] [PubMed] [Google Scholar]
- 6.Medyouf H, Mossner M, Jann JC, Nolte F, Raffel S, Herrmann C, Lier A, Eisen C, Nowak V, Zens B, Mudder K, Klein C, Oblander J, Fey S, Vogler J, Fabarius A, Riedl E, Roehl H, Kohlmann A, Staller M, Haferlach C, Muller N, John T, Platzbecker U, Metzgeroth G, Hofmann WK, Trumpp A, Nowak D. Myelodysplastic cells in patients reprogram mesenchymal stromal cells to establish a transplantable stem cell niche disease unit. Cell Stem Cell. 2014;14:824–837. doi: 10.1016/j.stem.2014.02.014. [DOI] [PubMed] [Google Scholar]
- 7.Walkley CR, Olsen GH, Dworkin S, Fabb SA, Swann J, McArthur GA, Westmoreland SV, Chambon P, Scadden DT, Purton LE. A microenvironment-induced myeloproliferative syndrome caused by retinoic acid receptor gamma deficiency. Cell. 2007;129:1097–1110. doi: 10.1016/j.cell.2007.05.014. [DOI] [PMC free article] [PubMed] [Google Scholar]
- 8.Zhao Z, Zhao M, Xiao G, Franceschi RT. Gene transfer of the Runx2 transcription factor enhances osteogenic activity of bone marrow stromal cells in vitro and in vivo. Mol Ther. 2005;12:247–253. doi: 10.1016/j.ymthe.2005.03.009. [DOI] [PubMed] [Google Scholar]
- 9.Zhao Y, Wu D, Fei C, Guo J, Gu S, Zhu Y, Xu F, Zhang Z, Wu L, Li X, Chang C. Downregulation of Dicer1 promotes cellular senescence and decreases the differentiation and stem cell-supporting capacities of mesenchymal stromal cells in patients with myelodysplastic syndrome. Haematologica. 2015;100:194–204. doi: 10.3324/haematol.2014.109769. [DOI] [PMC free article] [PubMed] [Google Scholar]
- 10.Raaijmakers MH, Mukherjee S, Guo S, Zhang S, Kobayashi T, Schoonmaker JA, Ebert BL, Al-Shahrour F, Hasserjian RP, Scadden EO, Aung Z, Matza M, Merkenschlager M, Lin C, Rommens JM, Scadden DT. Bone progenitor dysfunction induces myelodysplasia and secondary leukaemia. Nature. 2010;464:852–857. doi: 10.1038/nature08851. [DOI] [PMC free article] [PubMed] [Google Scholar]
- 11.Neve A, Corrado A, Cantatore FP. Osteoblast physiology in normal and pathological conditions. Cell Tissue Res. 2011;343:289–302. doi: 10.1007/s00441-010-1086-1. [DOI] [PubMed] [Google Scholar]
- 12.Nakashima K, Zhou X, Kunkel G, Zhang Z, Deng JM, Behringer RR, de Crombrugghe B. The novel zinc finger-containing transcription factor osterix is required for osteoblast differentiation and bone formation. Cell. 2002;108:17–29. doi: 10.1016/s0092-8674(01)00622-5. [DOI] [PubMed] [Google Scholar]
- 13.Henze G, Fengler R, Hartmann R, Dopfer R, Gobel U, Graf N, Jurgens H, Niethammer D, Ritter J, Schellong G, et al. Chemotherapy for bone marrow relapse of childhood acute lymphoblastic leukemia. Cancer Chemother Pharmacol. 1989;24(Suppl 1):S16–19. doi: 10.1007/BF00253232. [DOI] [PubMed] [Google Scholar]


