Abstract
We investigated the ability of microRNA-93 (miR-93) to influence proliferation, invasion, migration, and apoptosisofrenal cell carcinoma (RCC) cells via transforming growth factor-β/solvated metal atom dispersed (TGF-β/Smad) signaling by targeting runt-related transcription factor 3 (RUNX3). RCC tissues with corresponding adjacent normal tissues were collected from 249 RCC patients. And normal renal tissues were collected from patients without RCC who received nephrectomy. The RCC cell line ACHN was treated with miR-93 mimic, mimic-negative control (NC), miR-93 inhibitor, inhibitor-NC, and miR-93 inhibitor + small interfering RNA (siRNA) against RUNX3 (si-RUNX3). Expression of miR-93, RUNX3, TGF-β, and Smad4 were evaluated by quantitative real-time polymerase chain reaction (qRT-PCR) and Western blotting. Cell proliferation was assessed by the Metallothioneins (MTS) assay, cell invasion by the wound-healing assay, cell migration by the Transwell assay, and cell cycle and apoptosis by flow cytometry. Compared with normal renal tissues, the expression of miR-93 and TGF-β were higher while that of RUNX3 and Smad4 were low in RCC and adjacent normal tissues (all P<0.05). RUNX3 was confirmed as a target of miR-93 by the dual luciferase reporter gene assay. Compared with mimic-NC group, cell proliferation, invasion, migration and cells from G0/G1 to S phase enhanced but the apoptosis decreased in the miR-93 mimic group (all P<0.05). Compared with inhibitor-NC group, proliferation, invasion, and migration reduced, while apoptosis increased, and cells at G0/G1 phase arrested in the miR-93 inhibitor group (all P<0.05). Compared with miR-93 inhibitor group, cell proliferation, invasion, and migration increased with increasing cells from G1 to S phase while the apoptosis decreased, in miR-93 inhibitor + si-RUNX3 group (all P<0.05). In conclusion, miR-93 inhibits apoptosis and promotes proliferation, invasion, and migration of RCC cells via TGF-β/Smad signaling by inhibiting RUNX3.
Keywords: microRNA-93, runt-related transcription factor 3, transforming growth factor-β, Smad4, renal cell carcinoma, invasion, migration, proliferation
Introduction
In adults renal carcinoma or renal cell carcinoma (RCC) consists of malignant tumors rising from the renal parenchyma and renal pelvis, accounting for approximately 10% and 90% of kidney cancers, respectively. In children renal cancer is rare, and most common type is nephroblastoma (Wilms tumor), which accounts for 1.1% of kidney cancers [1]. The morbidity rate of RCC varies substantially worldwide but is high in the developed world. The incidence of RCC was twice as common in men as in women, rising sharply at age 30, and reaching a peak at 60 to 70 years of age [2]. Risk factors for RCC include tobacco use, obesity, and hypertension. Other factors such as diet, physical activity, and occupational exposure to specific carcinogens have been implicated, but more evidence is needed to be understood their effects on the development of RCC [3]. RCC is currently treated with surgery and systemic treatment with various drugs [4]. More recently, researchers have investigated the effects of inactivating mutations of tumor suppressor genes on the development of RCC [5].
MicroRNAs (miRNAs) are short endogenous RNAs approximately 22 nucleotides in length that inhibit the translation of target mRNAs by pairing to sites in the 3’ untranslated region (3’ UTR) [6]. In this way miRNAs regulate the expression of genes involved in developmental timing, hematopoiesis, patterning of the nervous system, and cell death and proliferation [7]. miRNA-93, an miRNA encoded by the miR-106b-25 cluster (a paralog of the miR-17-92 cluster), has been shown to increase cell survival, promote sphere formation, and augment tumor growth by facilitating angiogenesis [8]. A study by He et al. reported the upregulation of microRNAs from the miRNA-17-92 cluster in liver, lung, and kidney cancers and implicated the miRNA 17-92 cluster as a potential human oncogene [9]. Because miRNA scans imultaneously target several effectors of pathways involved in cell differentiation, proliferation, and survival, miRNA-based anticancer therapies have been developed to improve disease response and cure rate [10].
Runt-related transcription factor (RUNX) proteins (RUNX1/AML1, RUNX2/CBFA1 and RUNX3/PEBP2αC/AML2) form complexes with Smad2 and Smad3, which transmit transforming growth factor-beta (TGF-β)/activin signals [11]. RUNX3 resides on human chromosome 1p36.1 and mouse chromosome 4 and is highly expressed in the adult hematopoietic system [12]. RUNX3 appears to function as a tumor suppressor, and its overexpression could inhibit proliferation, tumorigenic potential, and invasiveness of cancers [13,14]. The TGF-β superfamily includes soluble extracellular proteins (e.g., TGF-β1 and isoforms TGF-β2 and TGF-β3), activins, inhibins, growth differentiation factors, and bone morphogenetic proteins, and its essential biological and pathological activities are mediated by Smad signaling pathways [15]. TGF-β is a key mediator in renal disease through Smad2/3 and Smad7 and can inhibit renal fibrosis and inflammation [16-18]. In this study we explored the ability of miR-93 to regulate apoptosis, proliferation, invasion, and migration of RCC cells through the TGF-β/Smad signaling pathway by targeting RUNX3.
Materials and methods
Ethical statements
The study was approved by the Institutional Review Board of Shanghai Jiao Tong University Affiliated Sixth People’s Hospital. Written informed consent was obtained from each participant.
Subjects
From January 2012 to January 2016, a total of 249 resected specimens and pathologically confirmed as renal clear cell cancer were collected by the Oncology Department of Shanghai Jiao Tong University Affiliated Sixth People’s Hospital. All 249 patients provided their complete medical histories and follow-up information. None of the patients received antitumor treatment before the operation. The mean age of patients was 53.94 years (ranging from 20-85 years). The tumors were categorized according to the Fuhrman classification recommended by World Health Organization in 1997 and the 2002 American Joint Committee on Cancer tumor classification as follows: high differentiation, n=78; moderate differentiation, n=136; low differentiation, n=35; stage I, n=88; stage II, n=104; stage III + IV, n=57 [19,20]. Adjacent normal tissues (5 cm) from the carcinomas were collected to serve as the control group, and normal renal tissues from patients without RCC who received nephrectomy were collected as the normal group. All tissues were stored in liquid nitrogen for further use.
Cell culture
Normal kidney cells (HK-2) and RCC cells (SN12PM6, 786-O, ACHN, and Caki-1) were purchased from American Type Culture Collection (ATCC, VA, USA). The cells were cultured at 37°C in a humidified atmosphere of 5% CO2 (Forma Series II 3110 Water-Jacketed CO2 Incubator, Thermo Fisher Scientific Inc., USA) in Dulbecco’s modified Eagle’s medium (31600-034, HyClone Company, Logan, UT, USA) containing 10% heat-inactivated fetal bovine serum (FBS) (16000-044, Gibco Company, Grand Island, NY, USA) and 100 U/mL penicillin-streptomycin (15140122, GibcoCompany, Grand Island, NY, USA). After evaluating miR-93 expression in the RCC cell lines, those with the highest expression of miR-93 were selected for subsequent experiments. When cells reached 80% confluence, they were detached from the culture surface with 0.25% trypsin (25200-056, Gibco Company, Grand Island, NY, USA) and then re-plated and cultured for the further experiments.
Oligonucleotide synthesis and vector construction
The following oligonucleotides were synthetized by Shanghai GenePharma Co., Ltd., Shanghai, China as follows: miR-93 mimic, miR-93 inhibitor, and negative controls (mimic-NC and inhibitor-NC) (Table 1). To investigate the mechanism the way in which miR-93 regulates RUNX3 expression, human RUNX3 3’-untranslated region (3’-UTR) fragments were amplified and inserted into pGL3 vectors to construct the wild type plasmid pGL3-RUNX3-3’-UTR-wt (RUNX3-wt) and mutant plasmid pGL3-RUNX3-3’-UTR-mut (RUNX3-mut).
Table 1.
Oligonucleotidessequences
| Nucleotide | Sequence (5’-3’) |
|---|---|
| miR-93 mimic | CAAAGUGCUGUUCGUGCAGGUAG |
| mimic-NC | UUCUCCGAACGUGUCACGUTT |
| miR-93 inhibitor | CUACCUGCACGAACAGCACUUUG |
| Inhibitor-NC | CAGUACUUUUGUGUAGUCAA |
Notes: MiR-93, microRNA-93; NC, negative control.
Dual luciferase reporter assay
ACHN cells were seeded in a 96-well plate for 24 h before transfection (1 × 10⁵ cells/well, 4 wells/sample). The cell culture medium was replaced with fresh medium 1 h before transfection using Lipofectamine 2000 reagent (11668-027, Invitrogen Inc., Carlsbad, CA, USA), according to the manufacturer’s instructions. After removing the culture medium, the transfection reagent was added, and the cells were incubated at 37°C. After 24 h of incubaion, transcriptional activity was detected using the Dual Luciferase Reporter Assay System (Promega Corp., Madison, Wisconsin, USA). The following oligonucleotide/plasmid combinations were co-transfected: miR-93 mimic + RUNX3-wt, mimic-NC + RUNX3-wt, miR-93 inhibitor + RUNX3-wt, inhibitor-NC + RUNX3-wt; miR-93 mimic + RUNX3-mut, mimic-NC + RUNX3-mut, miR-93 inhibitor + RUNX3-mut, and inhibitor-NC + RUNX3-mut. Transfection was confirmed before the cells were used for subsequent assays.
Cell transfection and grouping
Cells were divided into the miR-93 mimic, mimic-NC, miR-93 inhibitor, inhibitor-NC, ormiR-93 inhibitor + siRNA-RUNX3 groups (si-RUNX3 purchased from Shanghai Genechem Co., Ltd.). Before 24 h of transfection, the culture medium was replaced with fresh medium (2 mL/well), and 1 h later transfection was carried out using Lipofectamine 2000 reagent (11668-027, Invitrogen), according the manufacturer’s instructions. Cells in the control group were cultured in medium without serum and double-antibody. In the experimental groups, cells were cultured in medium containing the oligonucleotides (final concentration of 300 pmol/well) packaged into liposomes (Invitrogen Inc., Carlsbad, CA, USA). The transfected cells were cultured in serum-free culture medium for 4 h. After adding 10% FBS, the cells were further cultured at 37°C and 5% CO2.
Quantitative real-time polymerase chain reaction (qRT-PCR)
Total RNA was extracted from RCC tissues, adjacent normal tissues, normal renal tissues and cells grown in culture using TRIzol (15596026, Invitrogen Inc., Carlsbad, CA, USA). RNA concentrations and purity were evaluated using a NanoDrop2000 spectrophotometer (Thermo Fisher Scientific, San Jose, CA, USA), and the RNA was stored at -80°C. The miR-93 and U6 cDNA were synthesized by using specific stem-loop reverse transcription primers (RT primer, 0.15 μM) shown in Table 2. Using the gene sequences published in the GenBank database, PCR primers (Table 2) were designed by Shanghai GenePharma Co., Ltd. using Primer5.0 software, and PCR amplification was carried out using an ABI PRISM 7500 Real-Time PCR System (ABI Company, Oyster Bay, NY, USA) and SYBR Green I qRT-PCR kit (DRR041A, Takara Biotechnology Ltd., Dalian, China) with U6/glyceraldehyde-3-phosphate dehydrogenase (U6/GAPDH) as the internal control. The specificity of the PCR reactions was evaluated by melting curve analysis. The threshold cycle (Ct) values were set, and relative expression of the target gene was calculated based on the 2-ΔΔCt method, in which ΔCt = Ct (target gene) - Ct (internal control), and ΔΔCt = ΔCt (experiment group) - ΔCt (control group) [21].
Table 2.
Primer sequences for qRT-PCR
| Gene | Sequence (5’-3’) | |
|---|---|---|
| miR-93 | RT Primer | GTCGTATCCAGTGCAGGGTCCGAGGTATTCGCACTGGATACGACCTACCT |
| U6 | RT Primer | CGCTTCACGAATTTGCGTGTCAT |
| miR-93 | Forward | AGTCTCTGGGCTGACTACATCACAG |
| Reverse | CTACTCACAAAACAGGAGTGGAATC | |
| U6 | Forward | CTCGCTTCGGCAGCACA |
| Reverse | AAGGCTTCACGAATTTGCGT | |
| RUNX3 | Forward | TGGCAGGCAATGACG |
| Reverse | CAGGGAACGGCTTGGT | |
| TGF-β | Forward | GCAGTAAGACATGATTCAGCCACAG |
| Reverse | CAATGGAACATCGTCGAGCAA | |
| Smad4 | Forward | GCCCAGGATCAGTAGGTGGAATAG |
| Reverse | CCTGAGTATGCATAAGCGACGAAG | |
| GAPDH | Forward | CCCACTCCTCCACCTTTGAC |
| Reverse | TGTTGCTGTAGCCAAATTCGT |
Notes: miR-93, microRNA-93; RUNX3, runt-related transcription factor 3; TGF-β, transforming growth factor-β; GAPDH, glyceraldehyde-3-phosphate dehydrogenase; qRT-PCR, quantitative real-time polyemrace chain reaction.
Western blotting
The concentrations of proteins extracted from tissues and cells were determined using the BCA Protein AssayKit (Wuhan Boster Biological Technology, Ltd., China) according to the manufacturer’s instructions. Extracted proteins were mixed with the loading buffer, boiled at 95°C for 10 min, and then 30 μg protein was added to each well with 10% polyacrylamide gel (Wuhan Boster Biological Technology, Ltd., China). After electrophoresis at 80 V to 120 V, the protein was transferred to a polyvinylidene fluoride membrane (PVDF, 100 mV for 45-70 min). The membrane was blocked with 5% bovine serum albumin (BSA) for 1 h and then incubated with the following primary antibodies (diluted 1:1000) overnight at 4°C: TGF-β (ab25121), Smad4 (ab40759), RUNX3 (ab40278) and β-actin (ab8226) all provided from Abcam Inc., Cambridge, MA, USA. After washing with Tris-buffered saline with Tweene (TBST) for three times (5 min each), the membrane was incubated with secondary antibodies for 1 h and then washed with TBST for three times (5 min each). Proteins were detected by chemiluminescence, and images were acquired using the Gel Doc EZ system (Bio-Rad, Inc., Hercules, CA, USA). Target protein bands were quantified using ImageJ software, and β-actin served as the internal control.
Metallothioneins (MTS) assay
The transfected ACHN cells were seeded in a 96-well plate (5 × 10⁵ cells/well) and cultured in a CO2 incubator at 37°C for 24 h, 48 h, and 72 h. After adding 20 μL MTS reagent (G3582, Promega Corp., Madison, Wisconsin, USA) to each well, the cells were incubated for 4 h. Optical density (OD) at 490 nm was determined by using a multi-function microplate reader (SpectraMax M5, Molecular Devices, USA) and cell proliferation was calculated as follows: number of cells = (ODexperimental group - ODblank group)/(ODcontrol group - ODblank group), and cell proliferation rate = number of cells/number of cells at 0 h).
Wound-healing assay
After transfection, cells were seeded in a 6-well plate and cultured at 37°C. When cells grew to confluence, a thin wound was created along the center of each well with a sterile pipette tip (the width of each scratch was same). Images were acquired (0 h) using an inverted microscope (Olympus CKX31, Japan). After incubation at 37°C for 24 h, the culture medium was removed, and the cells were washed with PBS for three times to remove cellular debris. Serum-free medium was then added to the wells, and images were acquired (24 h). To evaluate wound closure, six fields were selected, and cells in the wound area were counted and analyzed by counting software.
Transwell assay
Transwell chambers (140629, Thermo Fisher Scientific Inc., Waltham, MA) were coated with Matrigel (3.9 mg/mL, 60-80 μL) and incubated at 37°C for 30 min until the Matrigel solidified. Pre-warmed medium was then added to the wells, and the plate was placed in a 37°C incubator. After 2 h, cell suspension (0.5 mL, 5 × 10⁴ cells/mL) was added to each Transwell chamber. After incubation at 37°C for 24 h, cells on the upper surface of the Transwell chamber were removed. The chamber was washed with PBS, soaked in pre-cooled methanol for 30 min to fix the cells that reached the bottom of the chamber, and then stained with 0.1% crystal violet for 10 min. Images were acquired with an Olympus inverted microscope. The cells that had transferred to the bottom chamber were counted in six fields and analyzed.
Flow cytometry
After transfection for 24 h, cells were detached from the culture surface with trypsin, centrifuged, and washed with cold PBS. The cells were re-suspended in PBS containing calciumto create a single-cell suspension (1 × 10⁶ cells/mL). The cell suspension (100 μL), 10 mg/Ml propidium iodide (PI, P4170, Sigma-Aldrich Chemical Company, St Louis MO, USA), and 10 mg/mL RNase A (P4170, Sigma-Aldrich Chemical Company, St Louis MO, USA) were mixed and then incubated at 4°C for 30 min. After adding 400 μL staining buffer, the samples were analyzed immediately using a flow cytometer (BD Bioscience, USA), with 104 cells selected each time. Cell Quest software was used to acquire and analyze the data. Annexin V+ cells were considered as apoptotic cells, and Annexin V-PI+ cells were considered as necrotic cells. The apoptosis rate = (number of Annexin V+PI+ cells + number of Annexin V+PI- cells)/104 × 100%. Forcell cycle analysis, 100 μL cell suspension and 1 mL PI/TritonX-100 staining solution (containing 0.2 mg RNase A, 20 μg PI, and 0.1% TritonX-100) were mixed uniformly in a tube and incubated at 4°C for 30 min using flow cytometry.
Statistical analysis
Statistical analyses were conducted by using SPSS21.0 (SPSS Inc., Chicago, IL, USA) and GraphPad Prism (GraphPad Software Inc., CA, USA). Each experiment was carried out at least three times. Results are expressed as mean ± standard deviation. Differences between two groups were compared by t test. Multiple groups were compared by one-way analysis of variance when there was equal variance across groups and by the Wilcoxon rank-sum test when variances were heterogeneous. P<0.05 was considered significant.
Results
MiR-9 and RUNX3 expression in RCC tissues, adjacent normal tissues and normal renal tissues
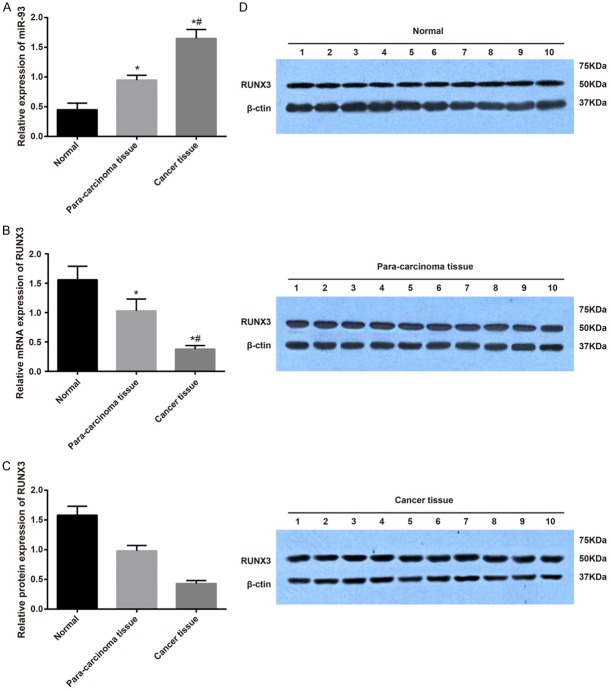
The expression of miR-93 and RUNX3 mRNA and protein was determined in RCC tissues, adjacent normal tissues and normal renal tissues by qRT-PCR and Western blotting. The results showed that the expression of miR-93 mRNA was significantly higher in RCC and adjacent normal tissues than in normal renal tissues, and the expression in RCC tissues remarkably increased compared with adjacent normal tissues (all P<0.05). The expression of RUNX3 mRNA and protein was significantly lower in RCC and adjacent normal tissues compared with normal renal tissues, and the expression remarkably decreased in RCC tissues compared with adjacent normal tissues (all P<0.05, Figure 1).
Figure 1.
Expression of miR-93 and RUNX3 mRNA and protein in RCC tissues, adjacent normal tissues and normal renal tissues. Note: (A) Expression of miR-9 mRNA and protein in RCC tissues, adjacent normal tissues and normal renal tissues using qRT-PCR; (B) The expression of RUNX3 mRNA in RCC tissues, adjacent normal tissues and normal renal tissues; (C) The protein expression of RUNX3 in RCC tissues, adjacent normal tissues and normal renal tissues using western blotting; (D) Grey value of target protein bands from (C). *Refers to compare with the Normal group, P<0.05; #Refers to compare with Para-carcinoma tissue group, P<0.05; RCC, renal cell carcinoma; qRT-PCR, quantitative real-time polymerace chain reaction; RUNX3, runt-related transcription factor 3; miR-93, microRNA-93.
TGF-β and Smad4 expression in RCC tissues, adjacent normal tissues and normal renal tissues
Results of qRT-PCR and Western blotting showed that the expression of TGF-β mRNA and protein was significantly higher in RCC and adjacent normal tissues than in normal renal tissues, and the expression was significantly higher in RCC tissues than in adjacent normal tissues. The expression of Smad4 mRNA and protein was substantially lower in RCC tissues and adjacent normal tissues than in normal renal tissues, and the expression was significantly decreased in RCC tissues compared with adjacent normal tissues (both P<0.05, Figure 2).
Figure 2.
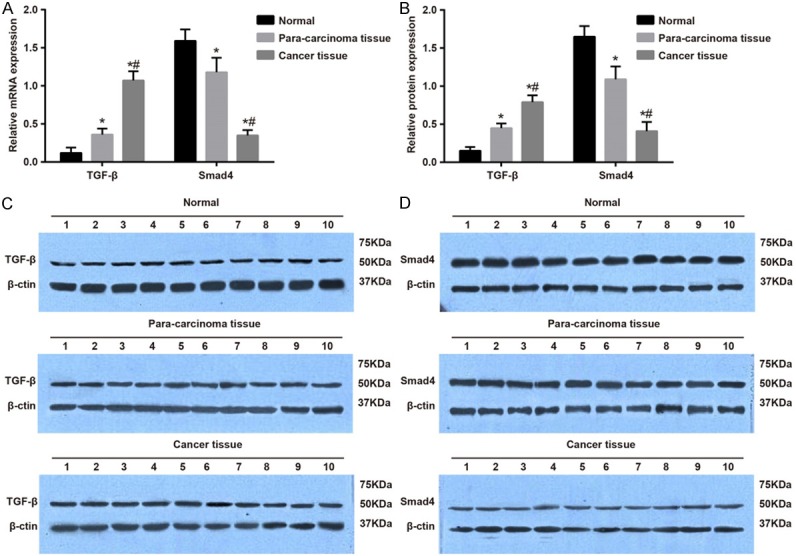
Expression of TGF-β and Smad4 mRNA and protein in RCC tissues, adjacent normal tissues and normal renal tissues. Notes: A. The expression of TGF-β and Smad4 mRNA in RCC tissues, adjacent normal tissues and normal renal tissues using qRT-PCR; B. The protein expression of TGF-β and Smad4 in RCC tissues, adjacent normal tissues and normal renal tissues using western blotting; C. Grey value of target proteins of Smad4; D. Grey value of target proteins of TGF-β; *Refers to compare with the Normal group, P<0.05; #Refers to compare with the Paracarcinoma tissue group, P<0.05; RCC, renal cell carcinoma; qRT-PCR, quantitative real-time polymerace chain reaction; TGF-β, transforming growth factor-β; Smad, solvated metal atom dispersed.
RUNX3 is a direct target gene of miR-93
According to the online bioinformation analysis software (microRNA.org), RUNX3 is a downstream target gene of miR-93 (Figure 3A). Results of the dual luciferase reporter assay showed that in cells carrying the RUNX3-wt plasmid, luciferase activity was significantly decreased in the miR-93 mimic group as compared with the mimic-NC group. In addition, luciferase activity was substantially higher in the miR-93 inhibitor group than in the inhibitor-NC group (all P<0.05). However, in cells carrying the RUNX3-mut plasmid, luciferase activity did not differ significantly between groups (Figure 3B). These findings provide evidence that RUNX3 is a direct target gene of miR-93.
Figure 3.
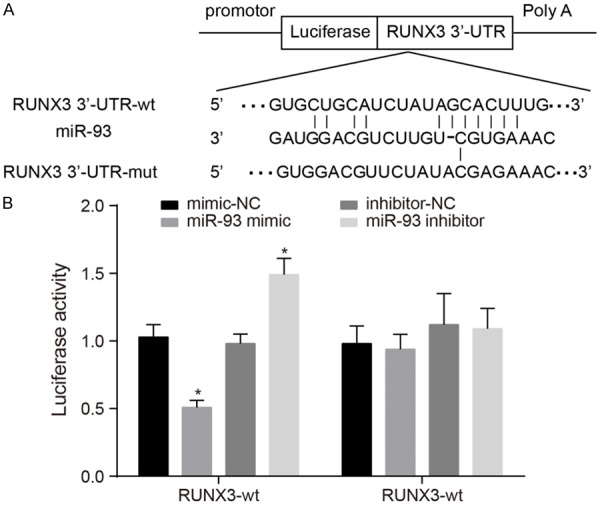
RUNX3 confirmed as a target gene of miR-93. Notes: A. Predicted binding sites on the miR-93 and RUNX3 3’ UTR; B. Results of the dual luciferase reporter assay showed that miR-93 regulates the expression of RUNX3; *Refers to compare with the mimic-NC group, P<0.05; miR-93, microRNA-93; RUNX3, runt-related transcription factor 3.
Effect of miR-93 and miR-93 inhibition on RUNX3 expression
The expression of miR-93 inHK-2 cells and RCC cells (SN12PM6, 786-O, ACHN, and Caki-1) was determined by qRT-PCR. The results showed that miR-93 levels were lower in HK-2 cells than in RCC cells, and ACHN cells showed the highest miR-93 expression (all P<0.05) (Figure 4A). Therefore, ACHN cells were selected for the subsequent experiments. Results of qRT-PCR showed that no significant difference was found in ACHN cells transfected with mimic-NC and inhibitor-NC (P>0.05); compared with ACHN cells transfected with mimic-NC, miR-93 expression was higher in cells transfected with miR-93 mimic; but compared with ACHN cells transfected with inhibitor-NC, lowermiR-93 expression was found in cells transfected with miR-93 inhibitor or miR-93 inhibitor + si-RUNX3 (all P<0.05). Expression of miR-93 was not significantly different between cells transfected with inhibitor-NC or miR-93 inhibitor + si-RUNX3 (P>0.05) (Figure 4B). Results of Western blotting showed that protein levels of RUNX3 did not differ significantly between the mimic-NC and inhibitor-NC groups but were significantly lower in the miR-93 mimic group compared with the mimic-NC group and substantially increased in the miR-93 inhibitor group compared with the inhibitor-NC group. Moreover, RUNX3 protein levels were marked decreased in the miR-93 inhibitor + si-RUNX3 group compared with the miR-93 inhibitor group (all P<0.05), and no significant difference was observed between the miR-93 inhibitor group and the miR-93 inhibitor + si-RUNX3 group (Figure 4C-E).
Figure 4.
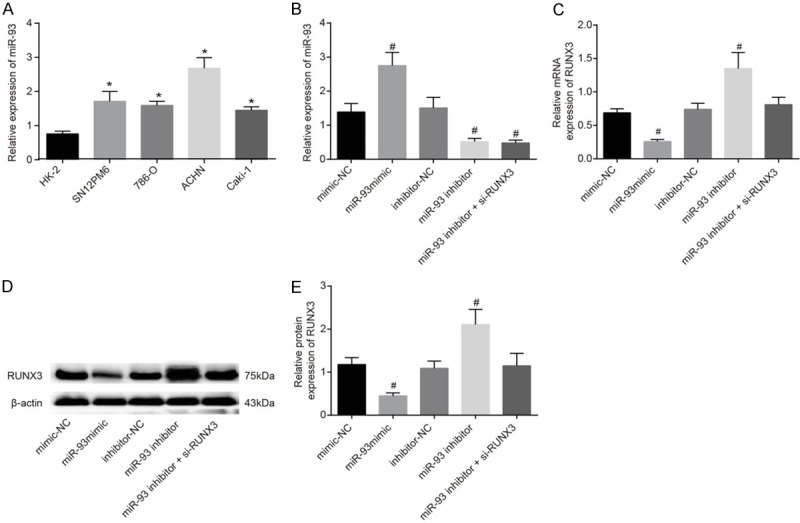
Expression of miR-93 and RUNX3 mRNA and protein in the miminc-NC, miR-93 mimic, inhibitor-NC, miR-93 inhibitor and miR-93 inhibitor + si-RUNX3 groups. Notes: A. Expression of miR-93 in HK-2 cells and RCC cells (SN12PM6, 786-O, ACHN, and Caki-1); B. Expression of miR-93 in the miminc-NC, miR-93 mimic, inhibitor-NC, miR-93 inhibitor and miR-93 inhibitor + si-RUNX3 groups; C. The expression of RUNX3 mRNA in each groups by qRT-PCR; D. The protein expression of RUNX3 in each groups using western blotting; E. Grey value of target protein of RUNX3 in each groups; *Refers to compare with HK-2 cells, P<0.01; #Refers to compare with the mimic-NC group, P<0.05; RCC, renal cell carcinoma; miR-93, microRNA-93; NC, negative control; RUNX3, runt-related transcription factor 3; qRT-PCR, quantitative real-time polymerace chain reaction.
Effect of miR-93 and miR-93 inhibition on TGF-β and Smad4 expression
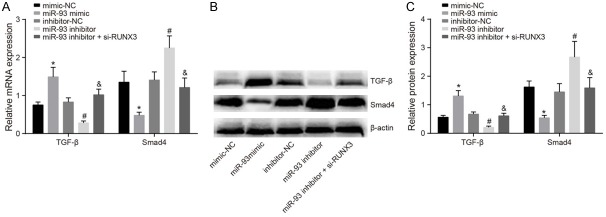
Results of qPCR and Western blotting show that TGF-β and Smad4 expression did not differ significantly between the mimic-NC, inhibitor-NC group, and miR-93 inhibitor + si-RUNX3 groups (all P>0.05). Compared with the mimic-NC group, TGF-β expression increased but Smad4 expression decreased in the miR-93 mimic group, and TGF-β expression decreased significantly in the miR-93 inhibitor group. Compared with the miR-93 inhibitor group, TGF-β expression increased and Smad4 expression decreased in the miR-93 inhibitor + si-RUNX3 group (all P<0.05) (Figure 5).
Figure 5.
Expression of TGF-β and Smad4 mRNA and protein in the miminc-NC, miR-93 mimic, inhibitor-NC, miR-93 inhibitor and miR-93 inhibitor + si-RUNX3 groups. Notes: (A) The expression of TGF-β and Smad4 mRNA using qRTPCR; (B) The protein expression of TGF-β and Smad4 using western blotting; (C) Grey value of target protein bands from (B); *Refers to compare with the mimic NC group, P<0.05; #Refers to compare with the inhibitor NC group, P<0.05; &Refers to compare with the miR-93 inhibitor group, P<0.05; qRT-PCR, quantitative real-time polymerace chain reaction; miR-93, microRNA-93; TGF-β, transforming growth factor-β; Smad, solvated metal atom dispersed; NC, negative control.
MiR-93 promoted RCC cell proliferation
The results of the MTS assay showed that cell proliferation did not differ significantly in cells transfected with mimic-NC, inhibitor-NC, or miR-93 inhibitor + si-RUNX3. However, compared with the mimic-NC group, cell proliferation was markedly increased in the miR-93 mimic group. Compared with the inhibitor-NC group, cell proliferation was significantly decreased in the miR-93 inhibitor group. In addition, cell proliferation was significantly increased in the miR-93 inhibitor + si-RUNX3 group compared with the miR-93 inhibitor group (all P<0.05) (Figure 6). Taken together, these results suggest that miR-93 promotes RCC cell proliferation.
Figure 6.
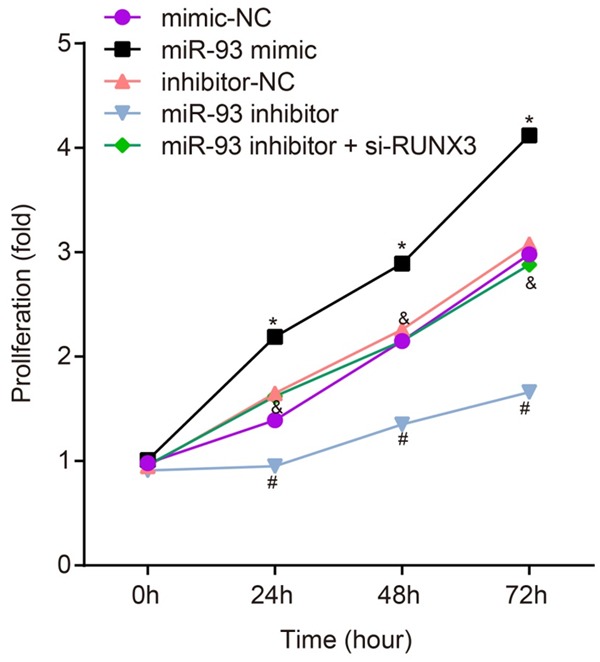
Proliferation of RCC cells in the miminc-NC, miR-93 mimic, inhibitor-NC, miR-93 inhibitor and miR-93 inhibitor + si-RUNX3 groups. Notes: cell proliferation was evaluated at 0, 24, 48, and 72 h; *Refers to compare with the mimic NC group, P<0.05; #Refers to compare with the inhibitor NC group, P<0.05; &Refers to compare with the miR-93 inhibitor group, P<0.05; RCC, renal cell carcinoma; NC, negative control; miR-93, microRNA-93; RUNX3, runt-related transcription factor 3.
MiR-93 enhanced RCC cell invasion and migration
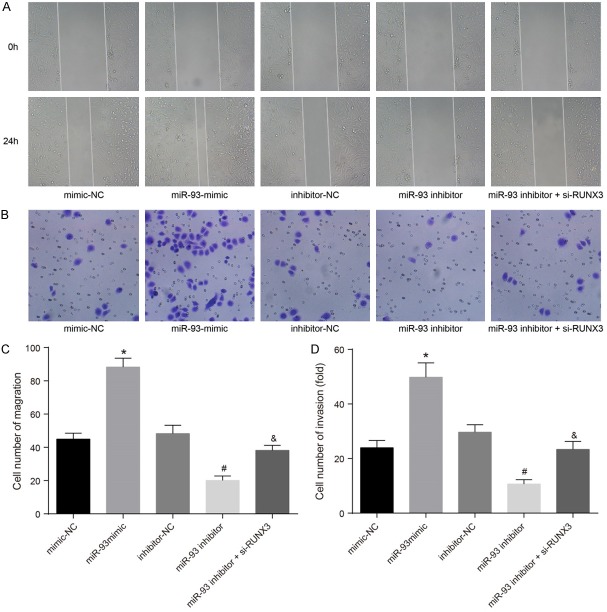
Results of the Transwell invasion and the wound-healing assays (Figure 7) showed that cell invasion and migration did not differ significantly between cells transfected with mimic-NC, inhibitor-NC, or miR-93 inhibitor + si-RUNX3 (P>0.05). Compared with the mimic-NC group, cell invasion and migration increased significantly in the miR-93 mimic group. Cell invasion and migration in the miR-93 inhibitor group was decreased compared with the inhibitor-NC group, whereas cell invasion and migration were increased in the miR-93 inhibitor + si-RUNX3 group compared with the miR-93 inhibitor group (P<0.05). These results suggest that miR-93 promotes invasion and migration of RCC cells.
Figure 7.
Effects of miR-93 on invasion and migration of RCC cells in the miminc-NC, miR-93 mimic, inhibitor-NC, miR-93 inhibitor and miR-93 inhibitor + si-RUNX3 groups. Notes: (A) Effect of miR-93 on migration of RCC cells using wound-healing assay; (B) Effect of miR-93 on invasion of RCC cells using Transwell assay; (C) Statistical analysis of Transwell results from (A); (D) statistical analysis of Transwell results from (B); *Refers to compare with the mimic NC group, P<0.05; #Refers to compare with the inhibitor NC group, P<0.05; &Refers to compare with the miR-93 inhibitor group, P<0.05; RCC, renal cell carcinoma; miR-93, microRNA-93; NC, negative control; RUNX3, runt-related transcription factor 3.
MiR-93 promoted cell cycle progression in RCC cells
Results of flow cytometry (Table 3) showed that the number of cells in G1, S, and G2 phase did not differ significantly among the mimic-NC group, inhibitor-NC group, and miR-93 inhibitor + si-RUNX3 group (P>0.05). However, compared with the mimic-NC group, the miR-93 mimic group had fewer cells in G1 phase but more cells in S phase and G2 phase (P<0.05). Compared with the inhibitor-NC group, the miR-93 inhibitor group had more cells arrested in G1 phase and substantially fewer cells in S phase and G2 phase (P<0.05). The miR-93 inhibitor + si-RUNX3 group had significantly fewer cells in G1 phase and more cells arrested in S phase and G2 phase compared with the miR-93 inhibitor group (P<0.05). These results suggest that miR-93 promotes transition from G1 to S phase.
Table 3.
Cell cycle distribution after cell transfection among five groups (%)
| Group | mimic-NC | miR-93 mimic | Inhibitor-NC | miR-93 inhibitor | miR-93 inhibitor + si-RUNX3 |
|---|---|---|---|---|---|
| G0/G1 phase | 55.95 ± 4.86 | 35.58 ± 3.54# | 54.63 ± 4.92 | 70.78 ± 5.67# | 54.82 ± 0.86 |
| S phase | 24.98 ± 1.81 | 39.93 ± 2.53# | 25.39 ± 2.27 | 16.93 ± 1.98# | 25.13 ± 1.94 |
| G2/M phase | 19.07 ± 1.04 | 24.49 ± 1.67# | 18.18 ± 1.55 | 12.29 ± 0.53# | 20.05 ± 1.38 |
P<0.05, compared with the mimic-NC group;
miR-93, microRNA-93; NC, negative control.
MiR-93 suppressed the apoptosis of RCC cells
Flow cytometry was also used to assess the effects of miR-93 on apoptosis. The results showed that apoptosis did not differ significantly between the mimic-NC group, inhibitor-NC group, and miR-93 inhibitor + si-RUNX3 group (P>0.05). However, the rate of apoptosis was lower in the miR-93 mimic group than in the mimic-NC group (P<0.05) and higher in the miR-93 inhibitor group than in the inhibitor-NC group (P<0.05). In addition, the number of apoptotic cells in the miR-93 inhibitor + si-RUNX3 group was markedly decreased compared with the miR-93 inhibitor group (P<0.05). These results indicate that miR-93 inhibits cell apoptosis (Figure 8).
Figure 8.
Effect of miR-93 on apoptosis of RCC cells in the miminc-NC, miR-93 mimic, inhibitor-NC, miR-93 inhibitor and miR-93 inhibitor + si-RUNX3 groups. Notes: RCC, renal cell carcinoma; miR-93, microRNA-93; NC, negative control; RUNX3, runt-related transcription factor 3.
Discussion
Recent studies have shown that miRNAs play important roles in tumor progression, functioning as tumor suppressors or oncogenes by regulating signaling pathways [22-24]. The present study investigated the effects of miR-93 on the regulation of cell invasion and migration in RCC. Our findings provided evidence that miR-93 influences TGF-β/Smad signaling by inhibiting RUNX3, thereby promoting the invasion and migration of RCC cells.
We found that miR-93 and TGF-β expression were elevated in RCC tissues and adjacent normal tissues compared with normal renal tissues, whereas RUNX3 and Smad4 expression were decreased. Previous studies have shown that miR-93 is strongly expressed in various cancers and may be function as an oncomiR, regulating tumor growth, cell survival, migration, apoptosis, cell-cycle distribution, and angiogenesis [25]. Zhu et al. observed that high expression of miR-93 in non-small cell lung cancer tissues [26], and Du et al. showed that miR-93 overexpression promotes cell growth in lung cancer, primarily by downregulating the expression of disabled homolog-2 [27]. TGF-β is a multifunctional protein that plays a crucial role in mediating basic cellular functions including cell proliferation, apoptosis, and differentiation and immunosuppression [28]. The TGF-β/Smad signaling pathway is involved in growth regulation of cancer and normal cells [29]. RUNX3 is a transcription factor in the TGF-β superfamily [30] and appears to be a tumor suppressor that is inactivated in diverse cancers [31]. Smad4 involved in invasion and lymph node migration of various cancers [32,33]. Smad4 represses heparanase expression, and its downregulation contributes to gastric cancer development [34].
In this study, we showed that miR-93 inhibits cell apoptosis and promotes cell proliferation, invasion, and migration by targeting RUNX3. Singh et al. demonstrated that enhanced miR-93 expression decreases apoptosis but increases mammosphere formation, colony formation, cell migration, and DNA damage in breast epithelial cells, and miR-93 silencing suppresses these carcinogenic processes [35]. Increased miR-93 expression also significantly stimulate in vitro cell proliferation, invasion, and migration through the cellular-mesenchymal to epithelial transition factor (c-Met)/phosphoinositide 3-kinase (PI3K)/protein kinase B (Akt) pathway and repress apoptosis by suppressing phosphatase and tensin homolog (PTEN) and cyclin-dependent kinase inhibitor 1A(CDKN1A) expression in human hepatocellular carcinoma [36]. Aberrant activation of the Wnt/β-catenin pathway contributes to tumor progression [37], and miR-93 involved in zinc and ring finger 3 (ZNRF3)/Wnt/β-catenin signaling, contributing to lung carcinoma [38]. Jiang et al. demonstrated that miR-93 upregulation in glioma cells increases cell proliferation through PI3K/Akt signaling pathway [39], and constitutive activation of Akt and elevated expression of RUNX maybe a major driving force in the progression of gliomas [40]. TGF-β binds to TGF-β receptor type II, which recruits TGF-β receptor type I to form aheterodimeric receptor. TGF-β receptor type II phosphorylates TGF-β receptor type I, which in turn phosphorylates receptor-regulated Smads [29]. Zhao and his colleagues report that long non-coding RNA (LncRNA) in the INK4 locus contributes to cell invasion and migration in thyroid cancer by inhibiting TGF-β/Smad signaling pathway [41]. RUNX3 has been proposed as a gatekeeper which is able to link tumor suppressive TGF-β signaling in intestinal carcinogenesis [42]. According to Zeng et al. miR-205 overexpression decreases Smad4 expression, there by repressing TGF-β/Smad4-induced epithelial-mesenchymal transition and ultimately inhibiting cell invasion and migration in lung cancer [43]. Similarly, we found that compared with the miR-93 inhibitor group, there showed increased proliferation, invasion, and migration, decreased apoptosis, and more cells progressing from G1 to S stage in the miR-93 inhibitor + siRNA-RUNX3 group.
In conclusion, the present study suggests that miR-93 regulates TGF-β/Smad signaling by inhibiting RUNX3, thus promoting cell invasion and migration in RCC. These findings may open novel avenues for future RCC therapies.
Acknowledgements
We would like to thank our researchers for their hard work and reviewers for their valuable advice.
Disclosure of conflict of interest
None.
References
- 1.Chow WH, Dong LM, Devesa SS. Epidemiology and risk factors for kidney cancer. Nat Rev Urol. 2010;7:245–257. doi: 10.1038/nrurol.2010.46. [DOI] [PMC free article] [PubMed] [Google Scholar]
- 2.Janout V, Janoutova G. Epidemiology and risk factors of kidney cancer. Biomed Pap Med Fac Univ Palacky Olomouc Czech Repub. 2004;148:95–101. [PubMed] [Google Scholar]
- 3.Chow WH, Devesa SS. Contemporary epidemiology of renal cell cancer. Cancer J. 2008;14:288–301. doi: 10.1097/PPO.0b013e3181867628. [DOI] [PMC free article] [PubMed] [Google Scholar]
- 4.Escudier B, Porta C, Schmidinger M, Rioux-Leclercq N, Bex A, Khoo V, Gruenvald V, Horwich A ESMO Guidelines Committee. Renal cell carcinoma: ESMO Clinical Practice Guidelines for diagnosis, treatment and followup. Ann Oncol. 2016;27(Suppl 5):v58–v68. doi: 10.1093/annonc/mdw328. [DOI] [PubMed] [Google Scholar]
- 5.Brugarolas J. Renal-cell carcinoma--molecular pathways and therapies. N Engl J Med. 2007;356:185–187. doi: 10.1056/NEJMe068263. [DOI] [PubMed] [Google Scholar]
- 6.Djuranovic S, Nahvi A, Green R. miRNAmediated gene silencing by translational repression followed by mRNA deadenylation and decay. Science. 2012;336:237–240. doi: 10.1126/science.1215691. [DOI] [PMC free article] [PubMed] [Google Scholar]
- 7.Ambros V. The functions of animal microRNAs. Nature. 2004;431:350–355. doi: 10.1038/nature02871. [DOI] [PubMed] [Google Scholar]
- 8.Fang L, Deng Z, Shatseva T, Yang J, Peng C, Du WW, Yee AJ, Ang LC, He C, Shan SW, Yang BB. MicroRNA miR-93 promotes tumor growth and angiogenesis by targeting integrin-beta8. Oncogene. 2011;30:806–821. doi: 10.1038/onc.2010.465. [DOI] [PubMed] [Google Scholar]
- 9.He L, Thomson JM, Hemann MT, Hernando-Monge E, Mu D, Goodson S, Powers S, Cordon-Cardo C, Lowe SW, Hannon GJ, Hammond SM. A microRNA polycistron as a potential human oncogene. Nature. 2005;435:828–833. doi: 10.1038/nature03552. [DOI] [PMC free article] [PubMed] [Google Scholar]
- 10.Garzon R, Marcucci G, Croce CM. Targeting microRNAs in cancer: rationale, strategies and challenges. Nat Rev Drug Discov. 2010;9:775–789. doi: 10.1038/nrd3179. [DOI] [PMC free article] [PubMed] [Google Scholar]
- 11.Li QL, Ito K, Sakakura C, Fukamachi H, Inoue K, Chi XZ, Lee KY, Nomura S, Lee CW, Han SB, Kim HM, Kim WJ, Yamamoto H, Yamashita N, Yano T, Ikeda T, Itohara S, Inazawa J, Abe T, Hagiwara A, Yamagishi H, Ooe A, Kaneda A, Sugimura T, Ushijima T, Bae SC, Ito Y. Causal relationship between the loss of RUNX3 expression and gastric cancer. Cell. 2002;109:113–124. doi: 10.1016/s0092-8674(02)00690-6. [DOI] [PubMed] [Google Scholar]
- 12.Levanon D, Bettoun D, Harris-Cerruti C, Woolf E, Negreanu V, Eilam R, Bernstein Y, Goldenberg D, Xiao C, Fliegauf M, Kremer E, Otto F, Brenner O, Lev-Tov A, Groner Y. The Runx3 transcription factor regulates development and survival of TrkC dorsal root ganglia neurons. EMBO J. 2002;21:3454–3463. doi: 10.1093/emboj/cdf370. [DOI] [PMC free article] [PubMed] [Google Scholar]
- 13.Chen LF. Tumor suppressor function of RUNX3 in breast cancer. J Cell Biochem. 2012;113:1470–1477. doi: 10.1002/jcb.24074. [DOI] [PMC free article] [PubMed] [Google Scholar]
- 14.Ito Y. Oncogenic potential of the RUNX gene family: ‘overview’. Oncogene. 2004;23:4198–4208. doi: 10.1038/sj.onc.1207755. [DOI] [PubMed] [Google Scholar]
- 15.Lan HY. Diverse roles of TGF-beta/Smads in renal fibrosis and inflammation. Int J Biol Sci. 2011;7:1056–1067. doi: 10.7150/ijbs.7.1056. [DOI] [PMC free article] [PubMed] [Google Scholar]
- 16.Vesey DA, Cheung C, Endre Z, Gobe G, Johnson DW. Role of protein kinase C and oxidative stress in interleukin-1beta-induced human proximal tubule cell injury and fibrogenesis. Nephrology (Carlton) 2005;10:73–80. doi: 10.1111/j.1440-1797.2005.00363.x. [DOI] [PubMed] [Google Scholar]
- 17.Bottinger EP. TGF-beta in renal injury and disease. Semin Nephrol. 2007;27:309–320. doi: 10.1016/j.semnephrol.2007.02.009. [DOI] [PubMed] [Google Scholar]
- 18.Wang W, Koka V, Lan HY. Transforming growth factor-beta and Smad signalling in kidney diseases. Nephrology (Carlton) 2005;10:48–56. doi: 10.1111/j.1440-1797.2005.00334.x. [DOI] [PubMed] [Google Scholar]
- 19.Pierorazio PM, Johnson MH, Patel HD, Sozio SM, Sharma R, Iyoha E, Bass EB, Allaf ME. Management of renal masses and localized renal cancer. Rockville (MD): Agency for Healthcare Research and Quality (US); 2016. [PubMed] [Google Scholar]
- 20.Margulis V, Tamboli P, Matin SF, Meisner M, Swanson DA, Wood CG. Redefining pT3 renal cell carcinoma in the modern era: a proposal for a revision of the current TNM primary tumor classification system. Cancer. 2007;109:2439–2444. doi: 10.1002/cncr.22713. [DOI] [PubMed] [Google Scholar]
- 21.Tuo YL, Li XM, Luo J. Long noncoding RNA UCA1 modulates breast cancer cell growth and apoptosis through decreasing tumor suppressive miR-143. Eur Rev Med Pharmacol Sci. 2015;19:3403–3411. [PubMed] [Google Scholar]
- 22.Tusong H, Maolakuerban N, Guan J, Rexiati M, Wang WG, Azhati B, Nuerrula Y, Wang YJ. Functional analysis of serum microRNAs miR-21 and miR-106a in renal cell carcinoma. Cancer Biomark. 2017;18:79–85. doi: 10.3233/CBM-160676. [DOI] [PubMed] [Google Scholar]
- 23.Liang T, Hu XY, Li YH, Tian BQ, Li ZW, Fu Q. MicroRNA-21 regulates the proliferation, differentiation, and apoptosis of human renal cell carcinoma cells by the mTOR-STAT3 signaling pathway. Oncol Res. 2016;24:371–380. doi: 10.3727/096504016X14685034103356. [DOI] [PMC free article] [PubMed] [Google Scholar]
- 24.Zhou W, Bi X, Gao G, Sun L. miRNA-133b and miRNA-135a induce apoptosis via the JAK2/STAT3 signaling pathway in human renal carcinoma cells. Biomed Pharmacother. 2016;84:722–729. doi: 10.1016/j.biopha.2016.09.074. [DOI] [PubMed] [Google Scholar]
- 25.Liang H, Wang F, Chu D, Zhang W, Liao Z, Fu Z, Yan X, Zhu H, Guo W, Zhang Y, Guan W, Chen X. miR-93 functions as an oncomiR for the downregulation of PDCD4 in gastric carcinoma. Sci Rep. 2016;6:23772. doi: 10.1038/srep23772. [DOI] [PMC free article] [PubMed] [Google Scholar]
- 26.Zhu W, He J, Chen D, Zhang B, Xu L, Ma H, Liu X, Zhang Y, Le H. Expression of miR-29c, miR-93, and miR-429 as potential biomarkers for detection of early stage non-small lung cancer. PLoS One. 2014;9:e87780. doi: 10.1371/journal.pone.0087780. [DOI] [PMC free article] [PubMed] [Google Scholar]
- 27.Du L, Zhao Z, Ma X, Hsiao TH, Chen Y, Young E, Suraokar M, Wistuba I, Minna JD, Pertsemlidis A. miR-93-directed downregulation of DAB2 defines a novel oncogenic pathway in lung cancer. Oncogene. 2014;33:4307–4315. doi: 10.1038/onc.2013.381. [DOI] [PMC free article] [PubMed] [Google Scholar]
- 28.Ki KD, Tong SY, Huh CY, Lee JM, Lee SK, Chi SG. Expression and mutational analysis of TGF-beta/Smads signaling in human cervical cancers. J Gynecol Oncol. 2009;20:117–121. doi: 10.3802/jgo.2009.20.2.117. [DOI] [PMC free article] [PubMed] [Google Scholar]
- 29.Fang J, Xu H, Yang C, Kayarthodi S, Matthews R, Rao VN, Reddy ES. Molecular mechanism of activation of transforming growth factor beta/smads signaling pathway in Ets related gene-positive prostate cancers. J Pharm Sci Pharmacol. 2014;1:82–85. doi: 10.1166/jpsp.2014.1008. [DOI] [PMC free article] [PubMed] [Google Scholar]
- 30.Sasahira T, Kurihara M, Yamamoto K, Bhawal UK, Kirita T, Kuniyasu H. Downregulation of runt-related transcription factor 3 associated with poor prognosis of adenoid cystic and mucoepidermoid carcinomas of the salivary gland. Cancer Sci. 2011;102:492–497. doi: 10.1111/j.1349-7006.2010.01787.x. [DOI] [PMC free article] [PubMed] [Google Scholar]
- 31.Lai KW, Koh KX, Loh M, Tada K, Subramaniam MM, Lim XY, Vaithilingam A, Salto-Tellez M, Iacopetta B, Ito Y, Soong R Singapore Gastric Cancer Consortium. MicroRNA-130b regulates the tumour suppressor RUNX3 in gastric cancer. Eur J Cancer. 2010;46:1456–1463. doi: 10.1016/j.ejca.2010.01.036. [DOI] [PubMed] [Google Scholar]
- 32.Wang H, Chen Y, Wu G. SDHB deficiency promotes TGFbeta-mediated invasion and metastasis of colorectal cancer through transcriptional repression complex SNAIL1-SMAD3/4. Transl Oncol. 2016;9:512–520. doi: 10.1016/j.tranon.2016.09.009. [DOI] [PMC free article] [PubMed] [Google Scholar]
- 33.Su F, Li X, You K, Chen M, Xiao J, Zhang Y, Ma J, Liu B. Expression of VEGF-D, SMAD4, and SMAD7 and their relationship with lymphangiogenesis and prognosis in colon cancer. J Gastrointest Surg. 2016;20:2074–2082. doi: 10.1007/s11605-016-3294-9. [DOI] [PubMed] [Google Scholar]
- 34.Zheng L, Jiao W, Song H, Qu H, Li D, Mei H, Chen Y, Yang F, Li H, Huang K, Tong Q. miRNA-558 promotes gastric cancer progression through attenuating Smad4-mediated repression of heparanase expression. Cell Death Dis. 2016;7:e2382. doi: 10.1038/cddis.2016.293. [DOI] [PMC free article] [PubMed] [Google Scholar]
- 35.Singh B, Ronghe AM, Chatterjee A, Bhat NK, Bhat HK. MicroRNA-93 regulates NRF2 expression and is associated with breast carcinogenesis. Carcinogenesis. 2013;34:1165–1172. doi: 10.1093/carcin/bgt026. [DOI] [PMC free article] [PubMed] [Google Scholar]
- 36.Ohta K, Hoshino H, Wang J, Ono S, Iida Y, Hata K, Huang SK, Colquhoun S, Hoon DS. MicroRNA-93 activates c-Met/PI3K/Akt pathway activity in hepatocellular carcinoma by directly inhibiting PTEN and CDKN1A. Oncotarget. 2015;6:3211–3224. doi: 10.18632/oncotarget.3085. [DOI] [PMC free article] [PubMed] [Google Scholar]
- 37.He F, Chen H, Yang P, Wu Q, Zhang T, Wang C, Wei J, Chen Z, Hu H, Li W, Cao J. Gankyrin sustains PI3K/GSK-3beta/beta-catenin signal activation and promotes colorectal cancer aggressiveness and progression. Oncotarget. 2016;7:81156–81171. doi: 10.18632/oncotarget.13215. [DOI] [PMC free article] [PubMed] [Google Scholar]
- 38.Shi J, Jiang X, Yu Z, He G, Ning H, Wu Z, Cai Y, Yu H, Chen A. ZNRF3 contributes to the growth of lung carcinoma via inhibiting Wnt/beta-catenin pathway and is regulated by miR-93. Tumour Biol. 2016;37:3051–3057. doi: 10.1007/s13277-015-3949-2. [DOI] [PubMed] [Google Scholar]
- 39.Jiang L, Wang C, Lei F, Zhang L, Zhang X, Liu A, Wu G, Zhu J, Song L. miR-93 promotes cell proliferation in gliomas through activation of PI3K/Akt signaling pathway. Oncotarget. 2015;6:8286–8299. doi: 10.18632/oncotarget.3221. [DOI] [PMC free article] [PubMed] [Google Scholar]
- 40.Cohen-Solal KA, Boregowda RK, Lasfar A. RUNX2 and the PI3K/AKT axis reciprocal activation as a driving force for tumor progression. Mol Cancer. 2015;14:137. doi: 10.1186/s12943-015-0404-3. [DOI] [PMC free article] [PubMed] [Google Scholar]
- 41.Zhao JJ, Hao S, Wang LL, Hu CY, Zhang S, Guo LJ, Zhang G, Gao B, Jiang Y, Tian WG, Luo DL. Long non-coding RNA ANRIL promotes the invasion and metastasis of thyroid cancer cells through TGF-beta/Smad signaling pathway. Oncotarget. 2016;7:57903–57918. doi: 10.18632/oncotarget.11087. [DOI] [PMC free article] [PubMed] [Google Scholar] [Retracted]
- 42.Ito K. RUNX3 in oncogenic and anti-oncogenic signaling in gastrointestinal cancers. J Cell Biochem. 2011;112:1243–1249. doi: 10.1002/jcb.23047. [DOI] [PubMed] [Google Scholar]
- 43.Zeng Y, Zhu J, Shen D, Qin H, Lei Z, Li W, Huang JA, Liu Z. Repression of Smad4 by miR205 moderates TGF-beta-induced epithelial-mesenchymal transition in A549 cell lines. Int J Oncol. 2016;49:700–708. doi: 10.3892/ijo.2016.3547. [DOI] [PubMed] [Google Scholar]


