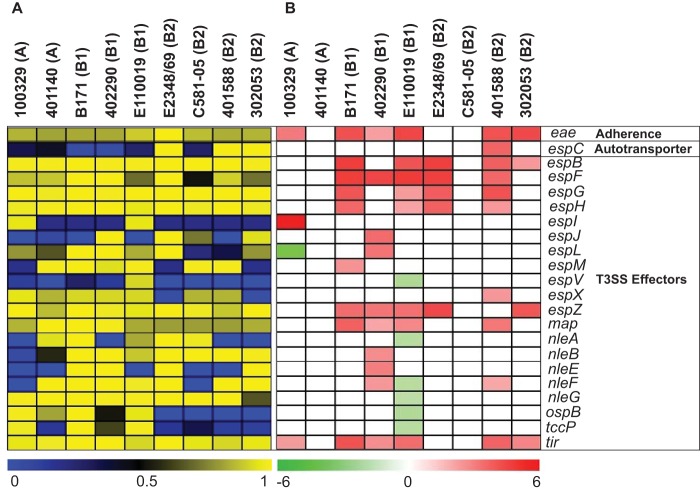
FIG 6 .
Differential expression analysis of known virulence genes of EPEC. The phylogroup that each EPEC isolate belongs to is indicated in parentheses. (A) Heatmap of LS-BSR values indicating the presence or absence of known EPEC virulence genes in the genomes of each of the EPEC isolates analyzed. Genes present with significant similarity are indicated by yellow, genes with divergent similarity are indicated by black, and genes that are absent are indicated by blue. (B) Heatmap of the log2-fold-change (LFC) values for known virulence genes of EPEC that exhibited significant differential expression during exponential growth in DMEM compared to LB. The color gradient indicates decreased expression (green) or increased expression (red) of the virulence genes, while white indicates a gene that either was not present in the isolate or did not exhibit significant differential expression.

