

Abstract
The aim of this study was to investigate immune response and its prognostic significance in colon carcinomas using the previously described Immunoscore (IS). A population‐based series of 779 colorectal cancers, operated on between 2000 and 2010, were classified according to tumour, node, metastasis (TNM) status, mismatch repair (MMR), and BRAF mutation status. Rectal cancer cases (n = 203) were excluded as a high proportion of these patients received preoperative neoadjuvant chemoradiotherapy. Tissue microarray (TMA) samples collected from the tumour centre and invasive front were immunostained for CD3 and CD8. Lymphocytes were then digitally calculated to categorize IS from grade 0 to 4. Samples adequate for IS were available from 510 tumours. IS was significantly associated with AJCC/UICC stage, T stage, lymph node and distant metastases, perineural and lymphovascular invasion, MMR status, and BRAF mutation status. For IS0, IS1, IS2, IS3 and IS4, respectively, the 5‐year disease‐free survival (DFS) rates were 59, 68, 78, 83 and 94% (p < 0.001); 5‐year disease‐specific survival (DSS) rates were 47, 55, 75, 80, and 89% (p < 0.001); and 5‐year overall survival (OS) rates were 40, 44, 66, 61, and 76% (p < 0.001). IS was also prognostic for DFS, DSS, and OS within subsets of microsatellite‐stable (MSS) and microsatellite‐instable (MSI) disease. Multivariable analysis showed that IS, AJCC/UICC stage, lymphovascular invasion, and lymph node ratio in AJCC/UICC stage III disease were independent prognostic factors for DFS, DSS, and OS. Age was an independent prognostic factor for DSS and OS. Gender and BRAF mutation were independent prognostic factors for OS. In conclusion, IS differentiated patients with poor versus improved prognosis in MSS and MSI disease and across AJCC/UICC stages. IS, AJCC/UICC stage, lymphovascular invasion, and lymph node ratio in AJCC/UICC stage III disease were independent prognostic factors for DFS, DSS, and OS.
Keywords: immunoscore, mismatch repair status, BRAF, AJCC/UICC stage, colon cancer
Introduction
Colorectal cancer (CRC) is the fourth most common malignancy worldwide, occurring with an estimated annual incidence of approximately 1.3 million cases and causing over 600 000 deaths per year 1. The American Joint Committee on Cancer/Union for International Cancer Control (AJCC/UICC) has published the most reliable histopathological method for CRC staging, which shows great prognostic significance even though prognosis can vary substantially even among patients within the same stage 2. It is estimated that 30 to 50% of colon cancers recur during follow‐up despite optimal primary treatment 3. Biological differences reportedly influence tumour behaviour and prognosis 4.
Recent findings indicate that CD3+, CD8+, and CD45RO+ lymphocytes play important roles in tumour growth suppression, both in the tumour centre and at the invasive front of primary and metastatic CRCs 5, 6, 7, 8. Therefore, investigations of immune responses may provide more detailed information regarding CRC prognosis.
The Immunoscore (IS) has been developed to describe immune responses in CRC. The IS classification is based on CD3+ and CD8+ lymphocyte cell counts in representative areas of the tumour centre and invasive front. The Immunoscore is reportedly a significant prognostic factor for colon and rectal cancer 7, 8, 9. It has been suggested that use of the IS in combination with AJCC/UICC staging could lead to better determination of tumour prognosis 10.
CRCs can also be classified according to their mismatch repair (MMR) capacity into MMR‐deficient and MMR‐proficient tumours, also termed microsatellite‐instable (MSI) or microsatellite‐stable (MSS) cancers. The MMR deficiency pathway induces hypermutated MSI cancers that differ from MSS cancers in their mutation profile and biological behaviour 11. MSI colorectal cancers show improved prognosis compared to MSS cancers 12, 13, 14. Due to their abundant mutations, MSI tumours exhibit aberrant neoantigens that can induce immune responses against cancer cells 15. BRAF mutation plays a specific role in several tumour types and has been associated with worse prognosis in MSS colon carcinoma 16, 17, 18. Other factors also reportedly have prognostic significance in CRC, such as perineural and lymphovascular invasion 19, 20, as well as lymph node ratio (LNR) in stage III disease 21.
The aim of our study was to define the prognostic significance of IS in a large population‐based cohort of colon cancer patients classified into four AJCC/UICC stages using current histopathological criteria. We particularly wanted to assess the association of IS with other known prognostic factors, such as MMR/BRAF mutation status, perineural or lymphovascular invasion, and lymph node ratio.
Material and methods
Patients
This study was performed at the Central Hospital of Central Finland, which serves a defined catchment area of about 274 000 people. Tissue microarray (TMA) data were available for representative tumour samples from 799 patients who underwent operations at our hospital from 2000 to 2010. For 779 of these cases, good quality immunohistochemical (IHC) staining of a representative tumour sample for MSI was also available. Patients with rectal cancer (n = 203) were excluded as a high proportion of these patients underwent preoperative neoadjuvant chemoradiotherapy, which may influence immune response. Tissue cores adequate for IS determination were available from 510 colon cancers.
We reviewed hospital records to extract information regarding treatment and tumour recurrence. Causes of death were reviewed and updated in December 2015 from the Finnish Cause of Death Registry. Macroscopic and histological examination of tumour tissue was performed by an experienced histopathologist following AJCC guidelines (5th and 6th edition). The lymph node ratio (LNR) was calculated as the proportion of metastatic lymph nodes from the total number of lymph nodes examined. AJCC/UICC stage III patients were divided into three similar‐sized groups based on LNR: <0.12, 0.12 to 0.30, and >0.30. A 6‐month course of adjuvant postoperative chemotherapy with either 5‐fluorouracil (FU) and oral folinic acid, oral capecitabine with or without oxaliplatin, or the FOLFOX regimen was prescribed to medically fit patients having stage III tumours or high‐risk stage II disease (T4 or T3 with perineural or lymphovascular invasion).
Tumour sampling
TMA blocks were prepared from formalin‐fixed paraffin‐embedded tissue (FFPE) samples. Tissue cores (diameter, 0.6 mm) were punched out and were set into a recipient paraffin block using the Manual Tissue Microarrayer MTA‐1 (Beecher Instruments, Inc.). We obtained one core from normal tissue, two cores from the tumour centre, and two cores from the tumour invasive front. The TMA blocks were cut into 2‐μm‐thick sections.
Immunohistochemistry
For all included tumours, we performed a universal IHC screening for loss of MMR protein expression and BRAF mutation, as previously described 12. For 21 cases, the BRAF staining was unsuccessful or left indifferent. The following monoclonal antibodies for were used immunohistochemical staining: MLH1 (Novocastra NCL‐L‐MLH1, clone ES05), MSH2 (Oncogene Research Products NA27, clone FE11), MSH6 (Cell Marque 287M‐16, clone 44), PMS2 (BD Pharmingen 556415, clone A16–4), BRAF V600E monoclonal antibody (Spring Bioscience E19292, clone VE1).
TMA block sections were immunohistochemically stained using CD3 (Novocastra, NCL‐L‐CD3, clone PS1) and CD8 (Thermo Scientific, RM‐9116, clone SP16) antibodies, both diluted 1:100, following standard procedures using the BOND‐III staining instrument (Leica Biosystems) and Bond Polymer Refine Detection Kit (Leica Biosystems). Samples were incubated with antibody dilutions for 30 min at room temperature. CD3 and CD8 antigen retrieval was performed for 20 min using Bond Epitope Retrieval Solution 2 (Leica Biosystems). Example of CD8 and CD3 staining are shown in Figure 1.
Figure 1.
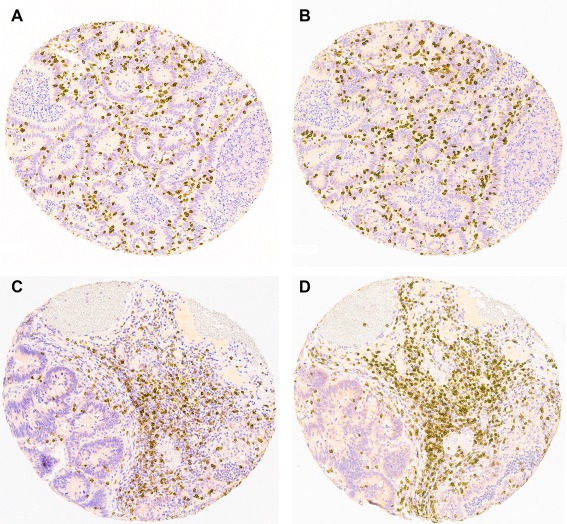
Examples of (A) CD8 staining from tumour centre, (B) CD3 staining from tumour centre, (C) CD8 staining from tumour invasive front, and (D) CD3 staining from tumour invasive front.
Immunoscore determination
CD3+ and CD8+ cells were assessed by digital image analysis. Stained TMA block sections from representative areas of the tumour centre and invasive front were scanned using an Aperio digital slide scanner (Leica Biosystems), followed by analysis using an ImageJ‐based program to count the numbers of CD3+ and CD8+ cells. Cells were identified based on their size, shape, and staining intensity as described earlier by Väyrynen et al 22. In order to minimize selection bias as well as the number of discarded patients from the study because of unrepresentative or inadequate samples (tissue cores), we took two cores from the tumour centre and two cores from the invasive front. From each core, we had one section cut for both lymphocyte stains. If the sample taken from the original tumour tissue block did not represent tissue area that was targeted (eg, core taken from invasion front) it was considered unrepresentative. Inadequate means that majority of the tissue core was for example torn off from the TMA section. Each tissue core was 600 μm in diameter and from each patient we had a minimum of four representative core sections (one core section from tumour centre and one from invasive front for both stains). Eighty‐nine and eighty‐eight tumour centre core sections were abandoned for CD8 and CD3, and 38 and 42 invasive front core sections were abandoned for CD8 and CD3, respectively, as they were either unrepresentative or inadequate. The average area analyzed from each patient was 0.52 mm2 for CD8 and CD3 at the tumour centre and 0.54 mm2 for CD8 and CD3 at the invasive front, giving a total analyzed area of 2.12 mm2 for each patient. All of the automatically analyzed sections were individually reviewed and values were corrected manually in cases with inaccurate results. Of the four acquired section pairs (two core sections from the tumour centre and two from the invasive front for both stains), we selected the sections with the highest lymphocyte count in order to minimize the number of false negative results. IHC stains were always assessed without knowledge of the clinical data.
The immunoscore was generated from four samples: one core section from the tumour centre and one core section from the invasive front for both lymphocyte stains (CD3 and CD8). The sections were determined to have either high or low lymphocyte count (number of cells/mm2). The cut‐off values were obtained from receiver operating characteristic (ROC)‐curves drawn for each group in relation to disease‐specific 3‐year mortality. ROC‐curves give a likelihood ratio for disease‐specific mortality for each lymphocyte count, so we can select the value with optimal sensitivity and specificity to separate patients into those who are more likely to have the end point and those who would not. Table 1 shows the cut‐off values with likelihood ratios and area under the curve (AUC) for the CD8 and CD3 tumour centre and CD8 and CD3 invasive front ROC‐curves. One Immunoscore point is given for each section with a high lymphocyte count so that in IS 4 all the sections had a high lymphocyte count and in IS 0 none of the sections had a high count.
Table 1.
Immunoscore cut‐off values
| Cut‐off value (cells/mm2) | AUC (95% CI) | Sensitivity (95% CI) | Specificity (95% CI) | Likelihood Ratio | |
|---|---|---|---|---|---|
| CD8 Tumour centre: | |||||
| 3‐year DSS | 226 | 0.64 (0.57 to 0.70) | 0.74 (0.64 to 0.82) | 0.53 (0.48 to 0.58) | 1.57 (1.34 to 1.83) |
| 5‐year DSS | 226 | 0.64 (0.58 to 0.69) | 0.72 (0.64 to 0.80) | 0.54 (0.49 to 0.59) | 1.57 (1.34 to 1.83) |
| CD3 Tumour centre | |||||
| 3‐year DSS | 339 | 0.64 (0.59 to 0.70) | 0.50 (0.40 to 0.60) | 0.74 (0.69 to 0.78) | 1.93 (1.50 to 2.48) |
| 5‐year DSS | 339 | 0.64 (0.58 to 0.70) | 0.50 (0.41 to 0.59) | 0.75 (0.70 to 0.79) | 1.98 (1.54 to 2.54) |
| CD8 Tumour invasive margin: | |||||
| 3‐year DSS | 286 | 0.65 (0.59 to 0.71) | 0.59 (0.49 to 0.69) | 0.68 (0.63 to 0.73) | 1.85 (1.49 to 2.29) |
| 5‐year DSS | 290 | 0.65 (0.58 to 0.70) | 0.58 (0.49 to 0.67) | 0.68 (0.63 to 0.73) | 1.83 (1.48 to 2.26) |
| CD3 Tumour invasive margin: | |||||
| 3‐year DSS | 618 | 0.65 (0.59 to 0.70) | 0.65 (0.55 to 0.74) | 0.63 (0.58 to 0.67) | 1.74 (1.44 to 2.10) |
| 5‐year DSS | 618 | 0.65 (0.59 to 0.71) | 0.63 (0.54 to 0.72) | 0.63 (0.58 to 0.68) | 1.73 (1.43 to 2.09) |
Cut‐off values for the tumour centre and invasive margin were selected from 3‐year disease‐specific survival (DSS) ROC curves to identify the most aggressive tumours. Only a few cancer deaths occurred between 3 and 5 years, and the cut‐off values from the 5‐year ROC curve did not significantly differ from the 3‐year cut‐off values. AUC, area under the curve; CI, confidence interval.
Statistical analyses
Categorical data were compared using Pearson's chi‐square or Mantel‐Haenszel tests. The Kaplan‐Meier method was used to calculate disease‐free survival (DFS), disease‐specific survival (DSS), and overall survival (OS), and the log‐rank test was used to compare differences. Survival times for DSS and OS were calculated from the date of surgery to the time of death or the end of follow‐up. For DFS, the endpoint was the date of cancer recurrence after radical surgery or the end of follow‐up. Death within 30 days following surgery was considered postoperative, and metastasis within 6 months after surgery was considered synchronous. Univariable and multivariable Cox proportional hazards regression models were used to analyze prognostic factors for DFS, DSS, and OS. Only variables with a P value of < 0.20 in univariable analysis were included in the multivariable analysis with age and gender. Among AJCC/UICC stage I patients there were no cancer deaths; thus, these patients were excluded from multivariable analysis for DSS. P values of < 0.05 were considered significant. Statistical analyses were conducted using SPSS Statistics for Windows (release 23.0.0.0; SPSS, Inc.).
Ethical aspects
The study was approved by the ethical committee of the Central Finland Central Hospital. Authorization for use of the patient registry was obtained from the National Supervisory Authority for Welfare and Health (Valvira).
Results
Clinicopathological characteristics
Table 2 shows the patients' clinicopathological details including AJCC/UICC stage and MMR/BRAF mutation status distribution. Within the study population, the median follow‐up time was 6.0 years (IQR, 1.7 to 9.0 years) and the median age at the time of surgery was 73 years (IQR, 64 to 79 years). R0 resection of the primary tumour was achieved in 435 of the 510 patients (85%). Non‐radical operation was performed in 75 patients (15%), including 63 with stage IV disease with carcinosis or unresectable distant metastasis, nine with stage II or III disease showing local invasion to adjacent tissues, and one patient with abdominal wound recurrence. The median number of examined lymph nodes was 11 (IQR, 6 to 17). Postoperative death was recorded for 27 patients (5%). Of the 483 patients alive after surgery, 162 (34%) received adjuvant chemotherapy.
Table 2.
Clinicopathological variables and their associations with Immunoscore
|
Immunoscore 0 & 1 (N = 142) N (% of row) |
Immunoscore 2 & 3 (N = 208) N (% of row) |
Immunoscore 4 (n = 160) N (% of row) |
Total (n = 510) N (% of column) |
p | |
|---|---|---|---|---|---|
| Age: | |||||
| <65 years | 44 (31) | 55 (39) | 43 (30) | 142 (28) | 0.913a |
| 65 to 75 years | 32 (22) | 67 (46) | 48 (33) | 147 (29) | |
| >75 years | 66 (30) | 86 (40) | 69 (31) | 221 (43) | |
| Gender: | |||||
| Male | 66 (29) | 95 (42) | 65 (29) | 226 (44) | 0.520 |
| Female | 76 (27) | 113 (40) | 95 (34) | 284 (56) | |
| Tumour location: | |||||
| Right hemicolon | 73 (25) | 113 (39) | 101 (35) | 287 (56) | 0.094 |
| Left hemicolon | 69 (31) | 95 (43) | 59 (27) | 223 (44) | |
| T stage | |||||
| 1 | 5 (21) | 10 (42) | 9 (38) | 24 (5) | 0.001a |
| 2 | 15 (20) | 32 (43) | 28 (37) | 75 (15) | |
| 3 | 77 (24) | 136 (43) | 104 (33) | 317 (62) | |
| 4 | 45 (48) | 30 (32) | 19 (20) | 94 (18) | |
| Lymph node metastasis: | |||||
| No | 59 (20) | 121 (41) | 113 (39) | 293 (58) | <0.001 |
| Yes | 83 (38) | 87 (40) | 47 (22) | 217 (42) | |
| Distant Metastasis: | |||||
| No | 112 (25) | 184 (41) | 150 (34) | 446 (88) | <0.001 |
| Yes | 30 (47) | 24 (38) | 10 (16) | 64 (12) | |
| AJCC/UICC Stage: | |||||
| I | 16 (21) | 32 (41) | 30 (39) | 78 (15) | <0.001a |
| II | 40 (20) | 83 (41) | 79 (39) | 202 (40) | |
| III | 55 (34) | 68 (42) | 38 (24) | 161 (32) | |
| IV | 31 (45) | 25 (36) | 13 (19) | 69 (14) | |
| Lymph node ratio: | |||||
| <0.12 | 11 (20) | 28 (52) | 15 (28) | 54 (11) | 0.127a |
| 0.12 to 0.30 | 23 (42) | 20 (36) | 12 (22) | 55 (11) | |
| >0.30 | 21 (40) | 20 (39) | 11 (21) | 52 (10) | |
| Perineural invasion: | |||||
| No | 116 (25) | 193 (42) | 151 (33) | 460 (90) | <0.001 |
| Yes | 26 (52) | 15 (30) | 9 (18) | 50 (10) | |
| Lymphovascular invasion: | |||||
| No | 110 (26) | 178 (41) | 144 (33) | 432 (85) | 0.009 |
| Yes | 32 (41) | 30 (38) | 16 (21) | 78 (15) | |
| MMR status: | |||||
| MSS | 129 (31) | 181 (43) | 109 (26) | 419 (82) | <0.001 |
| MSI | 13 (14) | 27 (30) | 51 (56) | 91 (18) | |
| BRAF status: | |||||
| BRAF wild‐type | 122 (30) | 180 (44) | 108 (27) | 410 (80) | <0.001 |
| BRAF mutation | 17 (22) | 21 (27) | 41 (53) | 79 (15) | |
| MMR/BRAF combinations | |||||
| MSS/BRAFwt | 118 (31) | 168 (44) | 96 (25) | 382 (75) | <0.001 |
| MSS/BRAFmut | 9 (38) | 8 (33) | 7 (29) | 24 (5) | |
| MSI/BRAFwt | 4 (14) | 12 (43) | 12 (43) | 28 (5) | |
| MSI/BRAFmut | 8 (15) | 13 (24) | 34 (62) | 55 (11) |
Mantel‐Haenszel test used.
MMR, mismatch repair; MSS, micro‐satellite stable; MSI, micro‐satellite instable; AJCC, The American Joint Committee on Cancer; UICC, Union for International Cancer Control; BRAFwt, BRAF wild‐type; BRAFmut, BRAF mutation.
Immunoscore and association with other clinicopathological parameters
IS distribution in our series was as follows: IS0, 16%; IS1, 12%; IS2, 20%; IS3, 21%; and IS4, 31%. Lower IS was associated with increasing AJCC/UICC stage, as well as with increasing T stage, presence of lymph node and distant metastasis, and perineural or lymphovascular invasion (Table 2, Figure 2A). IS was not significantly associated with LNR, age, sex, or tumour location. IS distribution is shown in relation to MMR status and in relation to MMR/BRAF mutation sub‐classification in Table 2 and Figure 2B, respectively. Most MSI tumours had high IS, with 56% belonging to the IS4 group. BRAF mutation occurred predominantly in MSI tumours with IS4 (Table 2).
Figure 2.
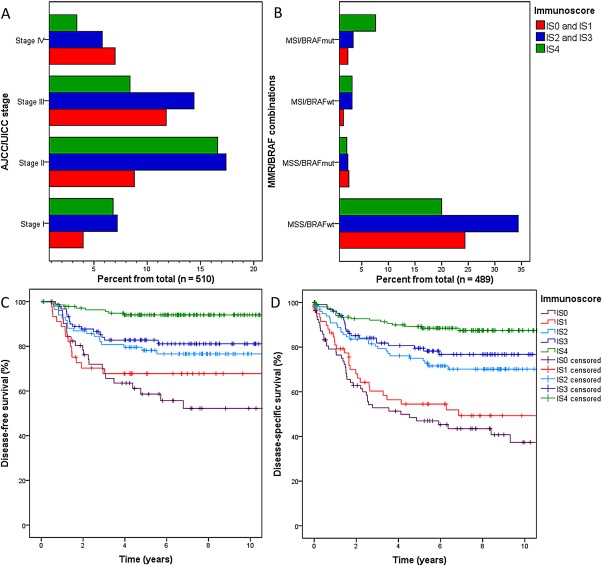
Distributions of (A) AJCC/UICC stage and (B) MMR/BRAF mutation status between different Immunoscore (IS) classes; and (C) disease‐free survival and (D) disease‐specific survival for different IS classes.
Survival
Higher IS was related to improved 5‐year DFS, DSS, and OS (Table 3, Figure 2C,D) within the entire study population and in both the MSS and MSI subgroups. Among MSS cases (n = 419), 5‐year DFS was 61% for IS0 and IS1, 79% for IS2, and IS3 and 92% for IS4 (p < 0.001). For these respective IS groups, 5‐year DSS was 49, 76, and 89% (p < 0.001), and 5‐year OS was 42, 64, and 77% (p = 0.001). Among MSI cases (n = 91), 5‐year DFS was 75% for IS0 and IS1, 90% for IS2 and IS3, and 98% for IS4 (p = 0.047). For these respective IS groups, 5‐year DSS was 71, 88, and 89% (p = 0.029) and 5‐year OS was 39, 63, and 75% (p = 0.008). MMR status was a prognostic factor according to Kaplan‐Meier survival analyses, with MSI patients showing better DFS and DSS (Table 3).
Table 3.
Survival according to clinicopathological variables and Immunoscore
|
Disease‐free survival (N = 417) |
Disease‐specific survival (N = 510) |
Overall survival (N = 510) |
|||||||
|---|---|---|---|---|---|---|---|---|---|
| Total N | 5‐year survival | p | Total N | 5‐year survival | p | Total N | 5‐year survival | p | |
| Age: | |||||||||
| <65 years | 117 | 77% | 0.103 | 142 | 74% | 0.102 | 142 | 71% | <0.001 |
| 65 to 75 years | 125 | 87% | 147 | 80% | 147 | 71% | |||
| >75 years | 175 | 78% | 221 | 68% | 221 | 48% | |||
| Gender: | |||||||||
| Male | 183 | 82% | 0.925 | 226 | 71% | 0.415 | 226 | 56% | 0.047 |
| Female | 234 | 80% | 284 | 76% | 284 | 66% | |||
| AJCC/UICC stage: | |||||||||
| I | 75 | 99% | <0.001 | 78 | 100% | <0.001 | 78 | 77% | <0.001 |
| II | 190 | 84% | 202 | 89% | 202 | 73% | |||
| III | 146 | 69% | 161 | 71% | 161 | 62% | |||
| IV | 6 | 33% | 69 | 9% | 69 | 7% | |||
| Lymph node ratio: | |||||||||
| <0.12 | 54 | 83% | <0.001 | 54 | 89% | <0.001 | 54 | 80% | <0.001 |
| 0.12 to 0.30 | 49 | 75% | 55 | 77% | 55 | 69% | |||
| >0.30 | 43 | 43% | 52 | 45% | 52 | 37% | |||
| Perineural invasion: | |||||||||
| No | 390 | 83% | <0.001 | 460 | 78% | <0.001 | 460 | 64% | <0.001 |
| Yes | 27 | 44% | 50 | 39% | 50 | 36% | |||
| Lymphovascular invasion: | |||||||||
| No | 374 | 84% | <0.001 | 432 | 81% | <0.001 | 432 | 68% | <0.001 |
| Yes | 43 | 52% | 78 | 32% | 78 | 24% | |||
| Immunoscore: | |||||||||
| 0 | 54 | 58% | <0.001 | 81 | 47% | <0.001 | 81 | 40% | <0.001 |
| 1 | 45 | 68% | 61 | 55% | 61 | 44% | |||
| 2 | 86 | 78% | 102 | 75% | 102 | 66% | |||
| 3 | 92 | 82% | 106 | 80% | 106 | 61% | |||
| 4 | 140 | 94% | 160 | 89% | 160 | 76% | |||
| IS within adjuvant chemotherapy group: | |||||||||
| 0 to 1 | 45 | 51% | 0.003 | 47 | 55% | <0.001 | 47 | 55% | 0.009 |
| 2 to 3 | 72 | 72% | 73 | 82% | 73 | 77% | |||
| 4 | 40 | 84% | 42 | 85% | 42 | 76% | |||
| MMR status: | |||||||||
| MSS | 337 | 78% | 0.003 | 419 | 71% | 0.003 | 419 | 60% | 0.558 |
| MSI | 80 | 93% | 91 | 86% | 91 | 66% | |||
| BRAF status: | |||||||||
| BRAF wild‐type | 339 | 78% | 0.029 | 410 | 74% | 0.941 | 410 | 62% | 0.037 |
| BRAF mutation | 61 | 91% | 79 | 72% | 79 | 54% | |||
| MMR/BRAF mutation status: | |||||||||
| MSS/BRAFwt | 315 | 77% | 0.043 | 382 | 73% | <0.001 | 382 | 62% | <0.001 |
| MSS/BRAFmut | 11 | 82% | 24 | 42% | 24 | 29% | |||
| MSI/BRAFwt | 24 | 90% | 28 | 88% | 28 | 68% | |||
| MSI/BRAFmut | 50 | 93% | 55 | 85% | 55 | 66% | |||
Immunoscore (IS) includes all the patients from the study.
The IS within the adjuvant chemotherapy group includes patients who received adjuvant chemotherapy (medically fit patients having stage III tumours or high‐risk stage II disease). Stage IV patients are excluded because they had chemotherapy that differs from standard adjuvant treatment.
The Kaplan‐Meier method was used to calculate disease‐free survival (DFS), disease‐specific survival (DSS), and overall survival (OS), and the log‐rank test was used to compare differences.
CI, confidence interval; HR, hazard ratio; MMR, mismatch repair; MSI, microsatellite instability; MSS, microsatellite stable; AJCC, The American Joint Committee on Cancer; UICC, Union for International Cancer Control; BRAFwt, BRAF wild‐type; BRAFmut, BRAF mutation.
Table 3 shows DFS, DSS, and OS according to AJCC/UICC stage. In AJCC/UICC stages II and III, higher IS was associated with improved DFS (Figure 3A,B) and DSS (Figure 3C,D). IS was also prognostic within the patient group with AJCC/UICC stage IIa disease (T3, N0; n = 171), with 5‐year DFS rates of 73% for IS0 and IS1, 88% for IS2 and IS3, and 95% for IS4 (p = 0.002), and respective 5‐year DSS rates of 82, 94, and 97% (p = 0.018). Moreover, IS was prognostic for DFS, DSS, and OS among those patients with stage II or III disease who received adjuvant chemotherapy after surgery (n = 162). In AJCC/UICC stage IV disease (n = 69), higher IS was related to improved DSS (Figure 3E). The effect of IS by AJCC/UICC stage on DFS and DSS was not investigated in stage I disease due to the low number of events (one recurrence, no cancer deaths). Increasing lymph node ratio was associated with lower DFS, DSS, and OS rates, but was not significantly associated with IS.
Figure 3.
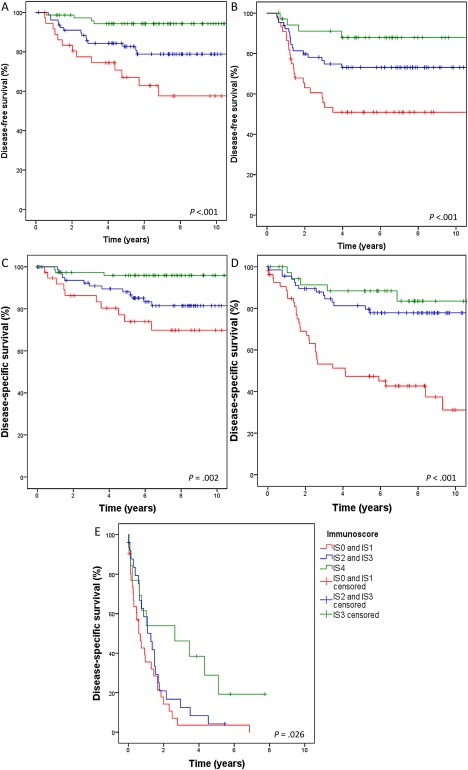
Disease‐free survival according to Immunoscore (IS) in AJCC/UICC stage II (A) and stage III (B) disease. Disease‐specific survival according to IS in AJCC/UICC stage II (C) and stage III (D) disease. (E) Disease‐specific survival according to IS in AJCC/UICC stage IV disease.
Prognostic factors for survival
Multivariable regression analyses revealed that IS, AJCC/UICC stage, and lymphovascular invasion were independent prognostic factors for DFS, DSS, and OS (Table 4). Additionally, age was independent prognostic factor for DSS and OS. Gender and BRAF mutation were independent prognostic factors for OS (Table 4).
Table 4.
Multivariable analysis with Cox proportional hazard model
| Univariable analysis |
Disease‐free survival (DFS) (n = 396) |
Disease‐specific survival (DSS) (n = 432) |
Overall survival (OS) (n = 489) |
||||
|---|---|---|---|---|---|---|---|
| p | HR (95% CI) | p | HR (95% CI) | p | HR (95% CI) | p | |
| Age: | |||||||
| <65 years | DFS: 0.109a | 1 | 0.195a | 1 | 0.023a | 1 | <0.001a |
| 65 to 75 years | DSS: 0.105a | 0.73 (0.39–1.39) | 1.14 (0.70–1.87) | 1.41 (0.96–2.06) | |||
| >75 years | OS: <0.001a | 1.27 (0.76–2.12) | 1.72 (1.14–2.59) | 3.14 (2.26–4.35) | |||
| Gender: | DFS: 0.925 | ||||||
| Male | DSS: 0.416 | 0.93 (0.59–1.49) | 0.769 | 0.98 (0.69–1.39) | 0.891 | 1.29 (1.00–1.65) | 0.049 |
| Female | OS: 0.048 | 1 | 1 | 1 | |||
| AJCC/UICC stage: | |||||||
| I | DFS: <0.001a | 1 | 0.004a | Excluded | <0.001a | 1 | <0.001a |
| II | DSS: <0.001a | 11.72 (1.60–86.08) | 1 | 0.86 (0.58–1.29) | |||
| III | OS: <0.001a | 18.27 (2.48–134.37) | 1.99 (1.22–3.25) | 0.99 (0.65–1.53) | |||
| IV | 39.18 (4.18–367.28) | 14.80 (8.88–24.67) | 5.51 (3.45–8.80) | ||||
| Perineural invasion: | |||||||
| No | DFS: <0.001 | 1 | 0.092 | 1 | 0.588 | 1 | 0.737 |
| Yes | DSS: <0.001 | 1.74 (0.91–3.30) | 1.12 (0.74–1.72) | 1.07 (0.73–1.56) | |||
| OS: <0.001 | |||||||
| Lymphovascular invasion: | |||||||
| No | DFS: <0.001 | 1 | 0.023 | 1 | <0.001 | 1 | <0.001 |
| Yes | DSS: <0.001 | 1.90 (1.09–3.29) | 2.72 (1.86–3.97) | 2.30 (1.68–3.14) | |||
| OS: <0.001 | |||||||
| Immunoscore: | |||||||
| 0 | DFS: <0.001a | 5.68 (2.43–13,31) | 0.001a | 4.48 (2.49–8.05) | <0.001a | 2.47 (1.66–3.67) | <0.001a |
| 1 | DSS: <0.001a | 4.05 (1.64–9.97) | 3.00 (1.58–5.70) | 2.00 (1.29–3.08) | |||
| 2 | OS: <0.001a | 3.28 (1.41–7.64) | 2.18 (1.19–4.02) | 1.44 (0.98–2.12) | |||
| 3 | 2.51 (1.05–6.00) | 1.44 (0.75–2.75) | 1.41 (0.95–2.07) | ||||
| 4 | 1 | 1 | 1 | ||||
| MMR‐status: | DFS: 0.005 | Excluded | |||||
| MSS | DSS: 0.003 | 1 | 0.126 | 1 | 0.271 | ||
| MSI | OS: 0.558 | 0.42 (0.14–1.27) | 0.70 (0.37–1.33) | ||||
| BRAF‐status: | DFS: 0.036 | Excluded | |||||
| BRAF wild‐type | DSS: 0.941 | 1 | 0.760 | 1 | 0.031 | ||
| BRAF mutation | OS: 0.038 | 0.84 (0.28–2.53) | 1.46 (1.04–2.07) | ||||
| Tumour location: | DFS: 0.733 | Excluded from all analyses | |||||
| Right hemicolon | DSS: 0.332 | ||||||
| Left hemicolon | OS: 0.345 | ||||||
Univariate analyses were performed with the following reference categories: 65 years, male gender, Stage 1, no perineural invasion, no lymphovascular invasion, Immunoscore 4, MSS‐status, BRAF wild type and tumour location in the left hemicolon. Only variables with a P value of <0.20 in univariable analysis were included in the multivariable analysis with age and gender. There were 396 cases available for analysis of DFS, 432 for DSS, and 489 for OS. Patients with pTNM stage I disease (n = 78) were discarded from DSS analysis because there was no disease‐specific mortality. Ninety‐three cases were excluded from DFS analysis due to either existing metastasis or non‐radical surgery, 4 patients died before earliest event (recurrence) in a stratum, and an additional 17 cases had undetermined BRAF status. Due to missing data (BRAF status) 21 cases were excluded from OS analysis.
p for linearity.
CI, confidence interval; HR, hazard ratio; MMR, mismatch repair; MSI, microsatellite instability; MSS, microsatellite stable; AJCC, The American Joint Committee on Cancer; UICC, Union for International Cancer Control.
In stage III disease, and with adjustment for age, gender, perineural, and lymphovascular invasion, IS, MMR status (in DFS and DSS), BRAF mutation status (in DFS and OS), we found that increasing LNR was an independent prognostic factor for worse DFS, DSS, and OS. With LNR < 0.12 used as the reference, the hazard ratio (HR) for DFS was 6.05 for LNR > 0.30 (95% CI, 2.52 to 14.49; p < 0.001), the HR for DSS was 4.06 for LNR > 0.30 (95% CI, 1.82 to 9.09; p = 0.001), and the HR for OS was 3.33 for LNR > 0.30 was (95% CI, 1.77 to 6.27; p < 0.001).
Discussion
Our present results reveal that Immunoscore is an independent prognostic factor for DFS, DSS, and OS regardless of tumour MMR status. This finding is in accordance with previous data 9. The prognostic significance of IS for both DFS and DSS was evident in stages II and III. Importantly, among stage IIa patients who do not usually receive adjuvant chemotherapy, IS could identify patients with higher risk of recurrence and cancer‐related death. Even among stage IV patients, higher IS was associated with improved DSS. We also found that high IS was significantly associated with a less invasive tumour phenotype (including reduced perineural and lymphovascular invasion rates) and with decreased risk of lymph node and distant metastases. This suggests that an improved cytotoxic immune response against tumour cells may also constrain metastatic progression. Among patients who received adjuvant chemotherapy, low IS corresponded with poor prognosis and high IS with good prognosis despite additional treatments.
There are two different aetiopathological pathways in CRC development: the MSI pathway that induces hypermutated cancers, and the chromosome instable pathway that generates MSS non‐hypermutated cancers. In our study, IS was a prognostic factor for MSS colon cancer lacking the highly immunogenic response caused by MSI. IS was also prognostic for better survival in MSI disease. These findings are similar to previously reported data 9. Although CRCs with microsatellite instability generate more DNA mutations than stable CRCs 11, they have a better prognosis 11, 12, 13, 14, 23, 24. Our current results indicate that MSI induces enhanced cytotoxic immunogenic reactions. This improved immune response is likely explained by the high abnormal protein burden caused by hundreds of unpredictable mutations, and this strengthened host immune response may explain the survival benefits seen with MSI CRCs.
When categorizing IS, the selection of repeatable cut‐off values is an important practical issue. In their preliminary study, Galon et al selected cut‐off values with the smallest P value method, and found that the proportion of IS 0 cases was only 4% 7. In our study, we determined cut‐off values with optimal sensitivity and specificity based on ROC curves related to disease‐specific 3‐year mortality. This resulted in a more balanced distribution of patients among the five IS groups, and still demonstrated substantial predictive significance of IS. Several other factors may impact the distribution of IS categories and, therefore, cut‐off values are case dependent to some extent. For example, the section thickness, representativeness of punch areas and immunohistochemical staining platforms may vary between different studies, potentially hindering the creation of universal standardized cut‐off values.
To date, AJCC/UICC staging is the best CRC prognostic indicator. However, while it reflects tumour burden at the time of diagnosis, it does not provide information about the biological features of the cancer. In our study, IS was not superior to AJCC/UICC staging as an independent prognostic factor, but the lowest and highest IS groups could clearly differentiate the patients with the worst and best prognosis in each AJCC/UICC‐stage. Thus, a combination of AJCC/UICC staging and IS might provide more exact prognostic information, allowing clinicians to better tailor treatment 10. It has also been proposed that lymph node ratio may be an additional prognostic tool for stage III CRC patients 21. Our results support the earlier findings on this subject; lymph node ratio was not associated with IS and could offer additional prognostic information.
As suggested in earlier studies, BRAF mutation is not associated with worse prognosis in MSI tumours 12, 25, 26, but is an independent risk factor for decreased survival in MSS disease 12, 16, 17, 18. In our study, most BRAF mutations (70%) were found in MSI tumours. High IS was associated with BRAF mutations in MSI tumours, but it is possible that immunogenicity develops due to the hypermutability of MSI tumours. It remains unclear whether BRAF itself is immunogenic, since IS distribution was not influenced by BRAF mutation in MSS tumours.
In conclusion, our data demonstrate the use of IS in the classification of colon cancer prognosis across AJCC/UICC stages. Particularly among stage IIa colon cancer patients, IS may prove to be an important prognostic marker for identifying patients who are likely to benefit from adjuvant treatments. A strength of our study is that patients with colon cancers were classified and treated used a contemporary multidisciplinary approach. Moreover, the follow‐up time was long and complete for each patient. Future randomized studies are needed to examine the combined use of AJCC/UICC stage and IS to select colon cancer patients for individualized adjuvant therapy.
Author contributions statement
EVW, TS, TK, IK, JPM, JB: conception and design; EVW, TS, MF, MA, JB: acquisition of data; EVW, JV, HK, TK, IK, JPM, JB: analysis and interpretation of data. All authors were involved in writing the paper and had final approval of the submitted version.
Acknowledgements
This study received funding from the Finnish Cancer Foundation, Jane and Aatos Erkko Foundation, the State Research Funding (Kuopio University Hospital Research Center) and the Finnish Medical Foundation.
We would like to thank Mr. Reino Pitkänen for technical assintance.
No conflicts of interest were declared.
Preliminary results were presented at the annual Finnish HNPCC meeting on 4.3.2016 and as a poster at a symposium of the Foundation for the Finnish Cancer Institute: CANCER AND THE IMMUNE SYSTEM 16.6.2016.
References
- 1. Ferlay J, Soerjomataram I, Dikshit R, et al Cancer incidence and mortality worldwide: sources, methods and major patterns in GLOBOCAN 2012. Int J Cancer 2015; 136: 359–386. [DOI] [PubMed] [Google Scholar]
- 2. Nagtegaal ID, Quirke P, Schmoll HJ. Has the new TNM classification for colorectal cancer improved care? Nat Rev Clin Oncol 2011; 9: 119–123. [DOI] [PubMed] [Google Scholar]
- 3. Labianca R, Nordlinger B, Beretta GD, et al Early colon cancer: ESMO Clinical Practice Guidelines for diagnosis, treatment and follow‐up. Ann Oncol 2013; 24(6): 64–72. [DOI] [PubMed] [Google Scholar]
- 4. Carethers JM, Jung BH. Genetics and genetic biomarkers in sporadic colorectal cancer. Gastroenterology 2015; 149: 1177–1190. [DOI] [PMC free article] [PubMed] [Google Scholar]
- 5. Galon J, Costes A, Sanchez‐Cabo F, et al Type, density, and location of immune cells within human colorectal tumors predict clinical outcome. Science 2006; 313: 1960–1964. [DOI] [PubMed] [Google Scholar]
- 6. Mlecnik B, Bindea G, Kirilovsky A, et al The tumor microenvironment and immunoscore are critical determinants of dissemination to distant metastasis. Sci Transl Med 2016; 8: 327ra26. [DOI] [PubMed] [Google Scholar]
- 7. Pages F, Kirilovsky A, Mlecnik B, et al In situ cytotoxic and memory T cells predict outcome in patients with early‐stage colorectal cancer. J Clin Oncol 2009; 27: 5944–5951. [DOI] [PubMed] [Google Scholar]
- 8. Anitei MG, Zeitoun G, Mlecnik B, et al Prognostic and predictive values of the immunoscore in patients with rectal cancer. Clin Cancer Res 2014; 20: 1891–1899. [DOI] [PubMed] [Google Scholar]
- 9. Mlecnik B, Bindea G, Angell HK, et al Integrative analyses of colorectal cancer show immunoscore is a stronger predictor of patient survival than microsatellite instability. Immunity 2016; 44: 698–711. [DOI] [PubMed] [Google Scholar]
- 10. Galon J, Mlecnik B, Bindea G, et al Towards the introduction of the ‘Immunoscore’ in the classification of malignant tumours. J Pathol 2014; 232: 199–209. [DOI] [PMC free article] [PubMed] [Google Scholar]
- 11. Boland CR, Goel A. Microsatellite instability in colorectal cancer. Gastroenterology 2010; 138: 2073–2087. [DOI] [PMC free article] [PubMed] [Google Scholar]
- 12. Seppälä TT, Böhm JP, Friman M, et al Combination of microsatellite instability and BRAF mutation status for subtyping colorectal cancer. Br J Cancer 2015; 112: 1966–1975. [DOI] [PMC free article] [PubMed] [Google Scholar]
- 13. Benatti P. Microsatellite instability and colorectal cancer prognosis. Clin Cancer Res 2005; 11: 8332–8340. [DOI] [PubMed] [Google Scholar]
- 14. Popat S. Systematic review of microsatellite instability and colorectal cancer prognosis. J Clin Oncol 2004; 23: 609–618. [DOI] [PubMed] [Google Scholar]
- 15. Tran E, Ahmadzadeh M, Lu YC, et al Immunogenicity of somatic mutations in human gastrointestinal cancers. Science 2015; 350: 1387–1390. [DOI] [PMC free article] [PubMed] [Google Scholar]
- 16. Ogino S, Shima K, Meyerhardt JA, et al Predictive and prognostic roles of BRAF mutation in stage III colon cancer: results from intergroup trial CALGB 89803. Clin Cancer Res 2012; 18: 890–900. [DOI] [PMC free article] [PubMed] [Google Scholar]
- 17. Samowitz WS, Sweeney C, Herrick J, et al Poor survival associated with the BRAF V600E mutation in microsatellite‐stable colon cancers. Cancer Res 2005; 65: 6063–6069. [DOI] [PubMed] [Google Scholar]
- 18. Phipps AI, Buchanan DD, Makar KW, et al BRAF mutation status and survival after colorectal cancer diagnosis according to patient and tumor characteristics. Cancer Epidemiol Biomarkers Prev 2012; 21: 1792–1798. [DOI] [PMC free article] [PubMed] [Google Scholar]
- 19. Yang Y, Huang X, Sun J, et al Prognostic value of perineural invasion in colorectal cancer: a meta‐analysis. J Gastrointest Surg 2015; 19: 1113. [DOI] [PubMed] [Google Scholar]
- 20. Al‐Sukhni E, Attwood K, Gabriel EM, et al Lymphovascular and perineural invasion are associated with poor prognostic features and outcomes in colorectal cancer: a retrospective cohort study. Int J Surg 2017; 37: 42–49. [DOI] [PubMed] [Google Scholar]
- 21. Ceelen W, Van Nieuwenhove Y, Pattyn P. Prognostic value of the lymph node ratio in stage III colorectal cancer: a systematic review. Ann Surg Oncol 2010; 17: 2847–2855. [DOI] [PubMed] [Google Scholar]
- 22. Väyrynen JP, Vornanen JO, Sajanti S, et al An improved image analysis method for cell counting lends credibility to the prognostic significance of T cells in colorectal cancer. Virchows Arch 2012; 460: 455–465. [DOI] [PubMed] [Google Scholar]
- 23. Gryfe R, Kim H, Hsieh ET, et al Tumor microsatellite instability and clinical outcome in young patients with colorectal cancer. N Engl J Med 2000; 342: 69–77. [DOI] [PubMed] [Google Scholar]
- 24. Malesci A, Laghi L, Bianchi P, et al Reduced likelihood of metastases in patients with microsatellite‐unstable colorectal cancer. Clin Cancer Res 2007; 13: 3831–3839. [DOI] [PubMed] [Google Scholar]
- 25. Hamilton SR. BRAF mutation and microsatellite instability status in colonic and rectal carcinoma: context really does matter. J Natl Cancer Inst 2013; 105: 1075–1077. [DOI] [PubMed] [Google Scholar]
- 26. Lochhead P, Kuchiba A, Imamura Y, et al Microsatellite instability and BRAF mutation testing in colorectal cancer prognostication. J Natl Cancer Inst 2013; 105: 1151–1156. [DOI] [PMC free article] [PubMed] [Google Scholar]