

Abstract
Sorafenib displays a limited efficacy for advanced hepatocellular carcinoma (HCC). Some patients with HCC initially respond to sorafenib, but eventually succumb to the disease, indicating that the acquired resistance to sorafenib reduces its beneficial effects. No alternative drugs are available after the failure of sorafenib therapy. Therefore, investigation of the mechanisms underlying the acquired resistance and development of second‐line treatments for sorafenib‐resistant HCC are urgently required. In this study, sorafenib‐resistant HCC cells generated from sorafenib‐sensitive human HCC cells were shown to overproduce hepatocyte growth factor (HGF) and overexpress c‐Met kinase and its phosphorylated form, leading to the activation of Akt and ERK (extracellular signaling‐regulated kinase) pathways. Use of specific c‐Met inhibitors enhanced the effects of sorafenib by inhibiting the growth of sorafenib‐resistant HCC cells. Akt inhibitors, a class of second‐line therapeutic drugs under investigation for treating HCC in clinical trials, enhanced the effects of sorafenib, but also activated the c‐Met pathway in sorafenib‐resistant cells. Dual inhibition of Akt and c‐Met by their respective inhibitors, MK2206 and capmatinib, additively or synergistically suppressed sorafenib‐resistant HCC cells in vitro and sorafenib‐resistant HCC xenografts in mice. The anticancer activities of MK2206 mainly rely on its ability to induce cell apoptosis and autophagic death, while capmatinib treatment leads to cell cycle arrest at phase G1. These results provide strong evidence for further investigation on the clinical utility of dual inhibition of Akt and c‐Met, particularly MK2206 and capmatinib, as a second‐line therapy for advanced HCC that has acquired resistance to sorafenib.
Keywords: acquired resistance, Akt, cellular signaling pathway, c‐Met, hepatocellular carcinoma, sorafenib
Abbreviations
- 4EBP1
initiation factor 4E‐binding protein 1
- ERK
extracellular signaling‐regulated kinase
- GSK3β
glycogen synthase kinase‐3β
- HCC
hepatocellular carcinoma
- HGF
hepatocyte growth factor
- mTOR
mammalian target of rapamycin
- PDGFR
platelet‐derived growth factor receptor
- VEGFR
vascular endothelial growth factor receptor
1. Introduction
Hepatocellular carcinoma (HCC) is the third leading cause of cancer‐related death worldwide (Bruix et al., 2016). Sorafenib remains the unique systematic drug approved for the treatment of advanced HCC, although it prolongs the overall survival for only 2~3 months compared to placebo (Cheng et al., 2009; Llovet et al., 2008). Some patients with HCC initially respond to sorafenib, but eventually succumb to the disease, indicating that the acquired resistance to sorafenib greatly limits its beneficial effects (Waidmann and Trojan, 2015). Therefore, investigating the mechanisms underlying the acquired resistance to sorafenib and seeking second‐line therapies are urgently required. Unfortunately, until now no alternative agents have been demonstrated to be effective in treating HCC after the failure of sorafenib (Chan et al., 2016).
The hepatocyte growth factor (HGF)/c‐Met signaling axis is a potential target for cancer therapy. HGF is the known ligand of c‐Met (also called Met, hepatocyte growth factor receptor [HGFR]) and a paracrine factor, secreted predominantly by mesenchymal cells (Moran‐Jones et al., 2015). Binding of HGF to c‐Met leads to its homodimerization and autophosphorylation and subsequent activation of the ERK (extracellular signaling‐regulated kinase) and Akt pathways (Peters and Adjei, 2012). Activation of c‐Met promotes the proliferation, survival, and invasion of cells from various types of cancer (Blumenschein et al., 2012) including HCC (Giordano and Columbano, 2014). Although the HGF/c‐Met pathway remains idle in livers under physiological conditions, it is activated in HCC tissues and contributes to tumor biological aggressiveness and poor prognosis (Bupathi et al., 2015; Giordano and Columbano, 2014).
In particular, c‐Met activation confers chemotherapeutic resistance (Gherardi et al., 2012), and its inhibition reverses cisplatin resistance in ovarian cancer cells (Li et al., 2016). The c‐Met pathway is activated by small‐molecule inhibitors targeting anaplastic lymphoma kinase (Kogita et al., 2015) and epidermal growth factor receptor (Dulak et al., 2011) in non‐small‐cell lung cancer cells. The expression of c‐Met is elevated in trastuzumab‐ and vinorelbine‐resistant breast cancer tissues (Ho‐Yen et al., 2015). Sorafenib treatment also increases c‐Met expression, and inhibition of c‐Met synergizes with sorafenib to suppress HCC cells (Jiang et al., 2015). Specific c‐Met inhibitors, such as tivantinib (Rota Caremoli and Labianca, 2014; Santoro et al., 2013) and foretinib (Yau et al., 2012), have been clinically trialed in the treatment for HCC.
The Akt pathway is critically implicated in HCC progression by regulating myriad downstream targets (Hu et al., 2016; Manning and Cantley, 2007). We and others have previously reported that Akt activation contributes to sorafenib resistance of HCC cells (Piguet et al., 2011; Zhai et al., 2014; Zhang et al., 2016). Chronic exposure of HCC cells to sorafenib activates Akt, resulting in upregulation and/or activation of its downstream factors including ribosomal protein S6 kinase (S6K) and eukaryotic translation initiation factor 4E‐binding protein 1 (4EBP1) (He et al., 2015; Zhai et al., 2014). A number of Akt inhibitors have been developed and evaluated as a second‐line therapy for HCC (Yap et al., 2011). However, none of them have proven superior to sorafenib in treating HCC (Llovet and Hernandez‐Gea, 2014). Treatment of Akt inhibitors leads to tumor stasis instead of regression in preclinical models, and most patients either have partial or minimal responses from Akt inhibition in clinical trials (Llovet and Hernandez‐Gea, 2014). More disappointingly, partial inhibition of Akt even promotes the survival of cells from nonautonomous cancer through non‐cell‐autonomous communication (Salony et al., 2016).
Although Akt is regarded as a downstream factor of the c‐Met pathway (Peters and Adjei, 2012), co‐activation of Akt and c‐Met triggers in the progression of HCC (Hu et al., 2016). Here, we hypothesize that they could also cooperatively contribute to the mechanisms of the acquired resistance to sorafenib and their dual inhibition may represent a potential therapeutic strategy for advanced HCC, particularly as a second‐line treatment for those that are initially responsive, but eventually become resistant to sorafenib.
2. Materials and methods
2.1. Cells, antibodies, and reagents
Human HCC HepG2 cells were obtained from the American Type Culture Collection, and Huh7, MHCC‐7721, and MHCC‐3M cells from Chinese Academy of Sciences Cell Bank (Shanghai, China). Cells were cultured at 37 °C in Dulbecco's modified Eagle medium (DMEM) (Gibco BRL, Grand Island, NY, USA) supplemented with 10% fetal bovine serum. For details of antibodies and reagents, please refer to Appendix S1.
2.2. Sorafenib‐resistant cells
Sorafenib‐resistant HepG2 and Huh7 cells have been established previously (Zhai et al., 2014) and stored in liquid nitrogen. After resuscitation, cells were incubated with sorafenib at a starting concentration of 5 μm. The concentration of sorafenib was slowly increased by 1 μm per week. Cell viability was monitored weekly. After 1–2 months, two sorafenib‐resistant cell lines, termed HepG2‐SR and Huh7‐SR, were reobtained and continuously maintained by culturing them in the presence of sorafenib.
2.3. RT² Profiler™ PCR Array
The Human liver cancer RT² Profiler™ PCR Array (SABiosciences, Frederick, MD, USA) was employed to analyze the expression profiles of 84 key genes involved in HCC. The analysis was completed by KangChen Bio‐tech (Shanghai, China). Each assay was conducted in triplicate.
2.4. Quantitative reverse‐transcription polymerase chain reaction
Methods have been described in details previously (He et al., 2015; Zhai et al., 2014). Briefly, total RNA was extracted from cells, and cDNA was synthesized. The reaction mixtures for quantitative reverse‐transcription polymerase chain reaction (qRT‐PCR) were prepared with the primers for c‐Met mRNA (forward: 5′‐CTAGACACATTTCAATTGGT‐3′ and reverse: 5′‐TGTTGCAGGGAAGGAGTGGT‐3′, corresponding to nt 2262–2625 of human c‐Met [GenBank NM_000245.3]); HGF mRNA (forward: 5′‐ACCATGTGGGTGACCAAACT‐3′, reverse: 5′‐TGTGTTCGTGTGGTATCATGG‐3′, corresponding to nt 225–708 of human HGF [GenBank NM_001010932.2]); and an internal control GAPDH mRNA (forward: 5′‐ CACCCATGGCAAATTCCATGGCA‐3′ and reverse: 5′‐TCTAGACGGCAGGTCAGGTCCACC‐3′). The PCR products were analyzed by MX3000P Real‐time PCR systems (Stratagen, La Jolla, CA, USA). Experiments were performed in triplicate, and data were calculated by ∆∆Ct methods.
2.5. Animal experiments
Six‐ to eight‐week male BALB/c‐nu/nu mice were obtained from SLAC laboratory Animal Co., Ltd. (Shanghai, China). This study had been approved by the Animal Ethics Committee of Harbin Medical University, in compliance with the Experimental Animal Regulations by the National Science and Technology Commission, China (Permit SYXK20020009). The protocol has been described previously (He et al., 2015; Ma et al., 2014; Zhai et al., 2014). To examine whether Huh7‐SR cells continued to be sorafenib‐resistant in vivo, Huh7 or Huh7‐SR cells (5 × 10⁶) were subcutaneously inoculated into mice. Two weeks later when tumors grew to ~100 mm3, mice were assigned to vehicle or sorafenib groups. For second‐line therapy experiments, Huh7‐SR cells (5 × 10⁶) were subcutaneously inoculated into mice, which received daily oral administration of 10 mg·kg−1 sorafenib to maintain the sorafenib‐resistant ability of Huh7‐SR cells. The appearance of subcutaneous tumors was monitored. Twenty‐five days after cell inoculation, the mice bearing tumors of similar volumes (~100 mm3) were assigned to four groups: control, capmatinib, MK2206, and the combination therapy. Capmatinib and MK2206 were orally administered daily at a dose of 30 mg·kg−1 and 20 mg·kg−1, respectively. Mice in the control group received oral administration of vehicle. Tumors were measured every 4 days and harvested 20 days after the commencement of treatments.
2.6. Cell proliferation analysis, assessment of cell cycle and apoptosis in vitro, autophagy assays, transfection of Akt‐siRNA, enzyme‐linked immunosorbent assay, immunoblotting analysis, immunohistochemistry, in situ Ki‐67 proliferation index, and in situ detection of apoptotic cells
Above methods have been described previously (He et al., 2015; Ma et al., 2014; Zhai et al., 2014). Please refer to Appendix S1.
2.7. Statistical analysis
The data were expressed as mean values ± standard deviation. Comparisons were made using one‐way ANOVA followed by Dunnett's t‐test. P < 0.05 was considered significant.
3. Results
3.1. The c‐Met pathway is activated in sorafenib‐resistant HCC cells
Sorafenib‐resistant HCC cells generated from sorafenib‐sensitive human HCC cells were shown to be refractory to sorafenib‐induced growth inhibition and apoptosis in vitro (Fig. S1), in agreement with our previous studies (He et al., 2015; Zhai et al., 2014). The alterations of gene expression were screened by a Human liver cancer RT² Profiler™ PCR Array, which showed that the expression of c‐Met mRNA was highly upregulated in Huh7‐SR cells compared with Huh7 cells (Fig. 1A). The raised levels of c‐Met mRNA were verified by qRT‐PCR (Fig. 1B) and conventional RT‐PCR (Fig. 1C) in Huh7‐SR and HepG2‐SR cells, compared with Huh7 and HepG2 cells, respectively. The expression of c‐Met and phosphorylated c‐Met (p‐Met) proteins showed a similar pattern to c‐Met mRNA (Fig. 1D). The expression levels of p‐Akt and p‐ERK, two major downstream factors of the c‐Met pathway (Peters and Adjei, 2012), were also elevated in sorafenib‐resistant cells (Fig. 1D).
Figure 1.
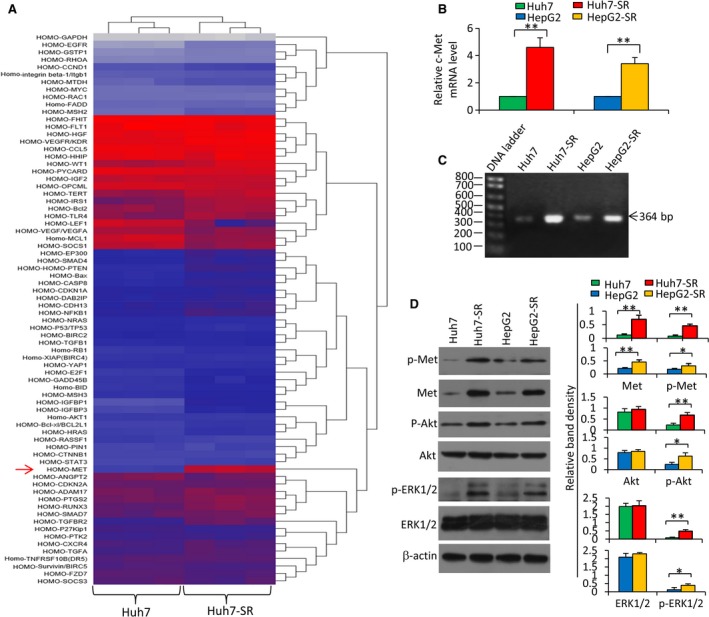
Sorafenib‐resistant HCC cells express higher levels of c‐Met. Huh7, Huh7‐SR, HepG2, and HepG2‐SR cells were cultured for 48 h and harvested for analysis. (A) The hierarchical clustering analysis of differentially expressed genes was performed by using a Human liver cancer RT² Profiler™ PCR Array on Huh7 and Huh7‐SR cells. (B) The expression of c‐Met mRNA was measured by qRT‐PCR. The level of mRNA from parental cells was defined as 1. (C) PCR products (364 bp) generated from RT‐PCR for detecting c‐Met mRNA underwent a 2% agarose gel electrophoresis. (D) The above cells were immunoblotted. The density of each band was normalized to β‐actin. ‘*’ (P < 0.05) and ‘**’ (P < 0.001) indicate a significant difference.
3.2. Sorafenib activates the HGF/c‐Met and PTEN/Akt pathways in HCC cells
Sorafenib‐resistant HCC cells expressed higher levels of HGF than parental cells as detected by immunocytochemistry (Fig. 2A). Exposure of sorafenib (2.5 μm) for 48 h increased the expression of HGF mRNA (Fig. 2B) and the secretion of HGF protein (Fig. 2C) of both parental and sorafenib‐resistant cells. The elevated HGF production was confirmed by immunoblotting analysis (Fig. 2D). Sorafenib exposure resulted in upregulation of p‐Met, c‐Met, p‐Akt, and p‐ERK, and downregulation of PTEN, in both parental and sorafenib‐resistant HCC cells (Fig. 2D). Similar expression patterns of the above proteins were also observed in another two human HCC cell lines, MHCC‐7721 and MHCC‐3M (Fig. 2E,F).
Figure 2.
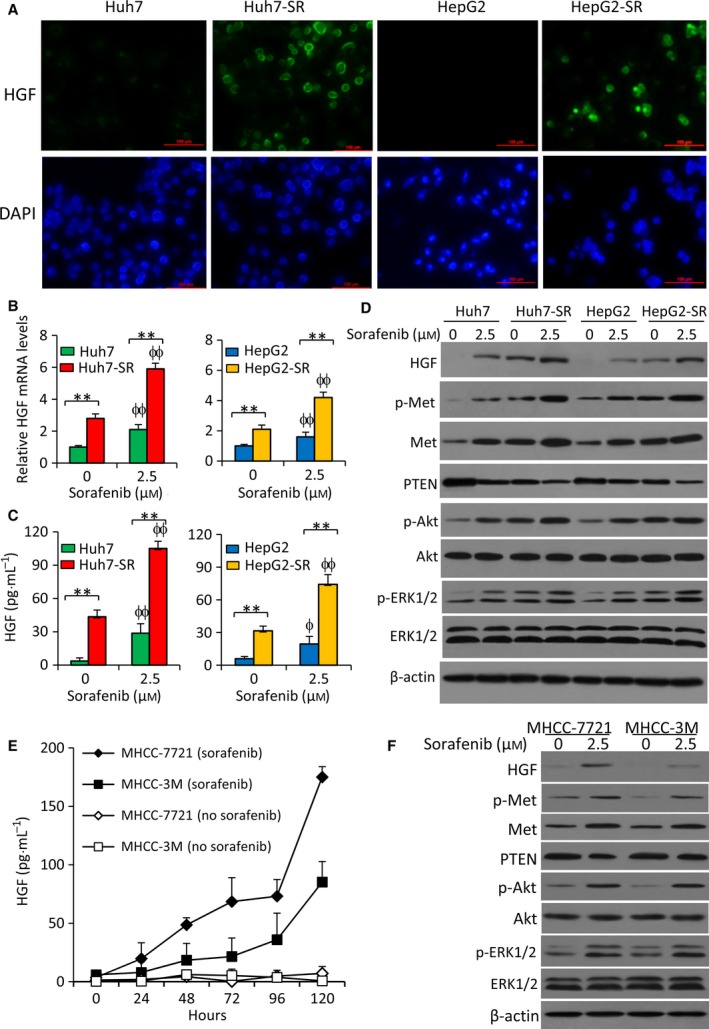
Exposure to sorafenib activates the HGF/c‐Met and PTEN/Akt pathways in HCC cells. (A) Cellular expression of HGF was detected by immunofluorescence microscopy. HGF protein was stained by an anti‐HGF antibody (green), and the cell nuclei were stained blue by DAPI. (B–D) Cells were incubated in the absence or presence of sorafenib (2.5 μm) for 48 h. (B) The expression of HGF mRNA was measured by qRT‐PCR. The level of mRNA from untreated parental cells was defined as 1. (C) The levels of HGF protein in the culture media were measured by ELISA. (D) The above cells were subjected to immunoblotting. (E, F) MHCC‐7721 and MHCC‐3M cells were incubated in the absence or presence of sorafenib (2.5 μm) and harvested at indicated time points. (E) The levels of HGF protein in the culture media were measured by ELISA. (F) Cells harvested at 48 h were immunoblotted. ‘**’ (P < 0.001) indicates a significant difference. ‘ϕ’ (P < 0.05) and ‘ϕϕ’ (P < 0.001) indicate a significant difference from respective untreated cells.
3.3. Inhibition of c‐Met enhanced the effects of sorafenib to suppress sorafenib‐resistant HCC cells
Incubation of capmatinib, a specific c‐Met inhibitor (Krepler et al., 2016), significantly downregulated the expression of p‐Met in a concentration‐dependent manner, but had no effect on c‐Met expression, in sorafenib‐resistant cells (Fig. 3A). Capmatinib significantly reduced the viability and strengthened the effects of sorafenib on sorafenib‐resistant cells in concentration‐ and time‐dependent manners (Fig. 3B,C), but only showed weaker effects on parental cells compared with respective sorafenib‐resistant cells (Fig. S2A). Capmatinib also enhanced the proapoptotic activity of sorafenib (Fig. 3D,E). The above results were supported by the experiments with cabozantinib, another c‐Met inhibitor (Fig. S3). Capmatinib was shown to correct the upregulated p‐Met and p‐Akt induced by sorafenib, and displayed an additive effect with sorafenib in downregulating p‐ERK1/2, cyclin D1, and activated caspase‐3 (Fig. 3F).
Figure 3.
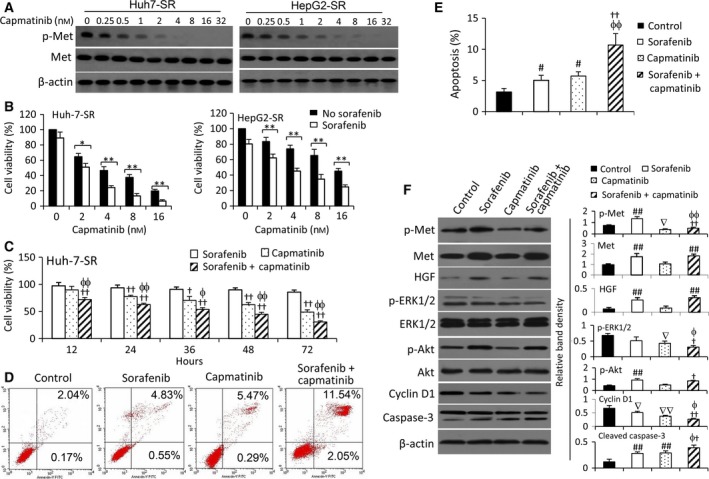
Inhibition of c‐Met by capmatinib enhances the sensitivity of sorafenib‐resistant HCC cells to sorafenib. (A, B) Huh7‐SR and HepG2‐SR cells were incubated for 48 h with various concentrations of capmatinib and subjected to immunoblotting (A) or cell viability assays (B). (C) Cells were incubated for 48 h with various concentrations of capmatinib in the presence or absence of sorafenib (5 μm). (D) Huh7‐SR cells were incubated with sorafenib (5 μm), capmatinib (2 nm), or the combination, and harvested at indicated time points. (B–D) Cell viability (%) was normalized to the respective untreated cells. (E–G) Huh7‐SR cells were incubated for 48 h with sorafenib (5 μm), capmatinib (2 nm), or the combination, and subjected to cytometry for measuring cell apoptosis (%) (E, F), or to immunoblotting analysis (G). The density of each band was normalized to β‐actin. ‘*’ (P < 0.05) and ‘**’ (P < 0.001) indicate a significant difference. ‘†’ (P < 0.05) and ‘††’ (P < 0.001) vs. sorafenib alone; ‘ϕ’ (P < 0.05) and ‘ϕϕ’ (P < 0.001) vs. capmatinib alone. ‘#’ (P < 0.05) and ‘##’ (P < 0.001) indicate a significant increase, while ‘∇’ (P < 0.05) and ‘∇∇’ (P < 0.001), a significant reduction, versus controls.
3.4. Inhibition of Akt activates the c‐Met pathway in sorafenib‐resistant HCC cells
GDC0068, an ATP‐competitive pan‐Akt inhibitor, has been shown to enhance the efficacy of sorafenib to suppress sorafenib‐resistant HCC cells (Zhai et al., 2014). MK2206, a novel selective inhibitor of pan‐Akt (Stottrup et al., 2016), was tested in the present study. In concentration‐dependent manners, MK2206 significantly increased the activity of sorafenib in reducing the viability (Fig. 4A) and inducing the apoptosis (Fig. 4B) of sorafenib‐resistant HCC cells, but only showed weaker effects on parental cells compared to respective sorafenib‐resistant cells (Fig. S2B). Interestingly, MK2206 did not show an inhibitory effect on the viability of Huh7‐SR cells in a time‐dependent manner. The inhibitory effect of MK2206 reached a peak at 24 h and prolonged incubation did not further reduce cell viability (Fig. 4C). The viability of cells incubated with 0.5 μm of MK2206 for 72 and 84 h was even slightly higher than that for the 24‐h incubation (Fig. 4C). A similar trend was found with GDC0068 (0.5 μm) (Fig. 4C). These results suggested that sorafenib‐resistant HCC cells became resistant to Akt inhibitors. In exploring the mechanisms, we found that MK2206 downregulated p‐Akt expression as expected, but also upregulated p‐Met expression in a time‐dependent manner (Fig. 4D). Supportively, depletion of Akt by siRNA also upregulated the expression of p‐Met, but had no effect on the expression of HGF and Met, in sorafenib‐resistant cells (Fig. 4E).
Figure 4.

Inhibition of Akt suppresses sorafenib‐resistant HCC cells and activates the c‐Met pathway. (A) Huh7‐SR and HepG2‐SR cells were incubated for 48 h with various concentrations of MK2206 in the presence or absence of sorafenib (5 μm). Cell viability (%) was normalized to the respective untreated cells. (B) Cells were incubated for 48 h with sorafenib (5 μm), MK2206 (1 μm), or the combination. Untreated cells served as controls. Cell apoptosis (%) was measured by cytometry. (C) Huh7‐SR cells were incubated in media containing MK2206 (0.5 μm) or GDC0068 (5 μm), which were refreshed every 24 h. Cell viability (%) was measured at indicated time points and normalized to untreated cells. (D) Cells treated with MK2206 in (C) were immunoblotted. (E) Huh7‐SR cells were transfected with scrambled siRNA or Akt‐siRNA for 48 h and then subjected to immunoblotting. ‘*’ (P < 0.05) and ‘**’ (P < 0.001) indicate a significant difference. ‘††’ (P < 0.001) vs. sorafenib alone; ‘ϕϕ’ (P < 0.001) vs. MK2206 alone. ‘##’ (P < 0.001) indicates a significant increase, while ‘∇’ (P < 0.05) and ‘∇∇’ (P < 0.001), a significant reduction, versus controls.
3.5. Dual inhibition of Akt and c‐Met suppresses sorafenib‐resistant HCC cells in vitro
The above results had driven us to investigate whether dual inhibition of c‐Met and Akt could suppress sorafenib‐resistant HCC cells. Both capmatinib and MK2206 induced apoptosis, but MK2206 exhibited a stronger proapoptotic activity than capmatinib, in sorafenib‐resistant cells (Fig. 5A–C). The values for the coefficient of drug interaction (CDI) (Wang et al., 2011; Zhai et al., 2014) for HepG2‐SR and Huh7‐SR cells were 0.67 and 0.61, respectively, indicating that two agents had a synergistic effect in inducing apoptosis (Fig. 5A–C). In addition, capmatinib, MK2206, or their combination showed weaker effects in inducing apoptosis of parental cells compared to respective sorafenib‐resistant cells (Fig. S2C). Autophagy plays a death‐promoting role in sorafenib‐resistant HCC cells (He et al., 2015; Zhai et al., 2014). Here, we showed that MK2206 treatment resulted in significantly more acridine orange‐stained acidic vesicular organelles (AVOs), while capmatinib induced a slight increase in AVOs (Fig. 5D). Quantitative analysis confirmed that MK2206‐treated cells had significantly higher fluorescence intensity (FL3), and the two agents showed an addictive effect as the values of CDI were 0.91 and 0.85 for Huh7‐SR and HepG2‐SR cells, respectively (Fig. 5E). The autophagic results were further supported by staining the above cells with monodansylcadaverine (MDC), a marker for autophagic vacuoles (Fig. S4). With regard to cell proliferation, capmatinib displayed a stronger inhibitory activity than MK2206 for both parental and sorafenib‐resistant cells, and they also showed weaker inhibitory effects on parental cells than on sorafenib‐resistant cells (Fig. S5A). In addition, capmatinib induced cell cycle arrest at phase G1 in sorafenib‐resistant cells (Fig. S5B,C).
Figure 5.
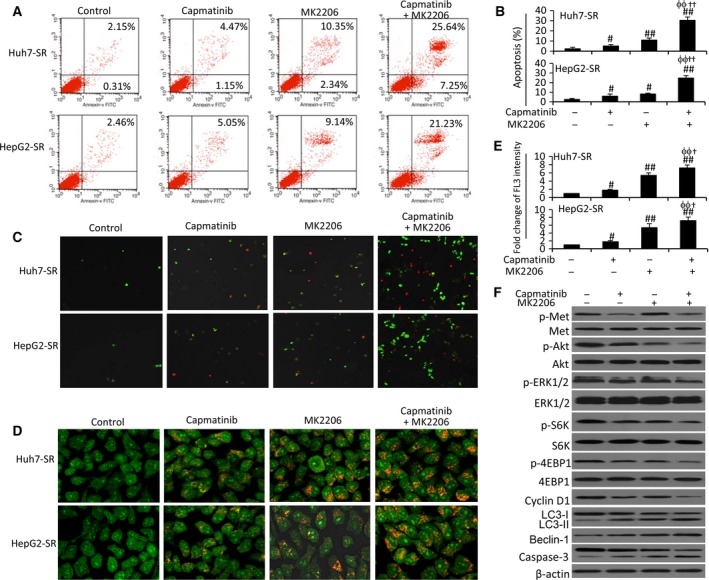
Dual inhibition of Akt and c‐Met induces apoptosis and autophagy of sorafenib‐resistant HCC cells. Huh7‐SR and HepG2‐SR cells were incubated for 48 h with capmatinib (2 nm), or MK2206 (1 μm), or the combination. (A, B) Cell apoptosis (%) was measured by cytometry. (C) Representative images were taken from cells stained with annexin V/propidium iodide (magnification ×100). (D) Representative images were taken from acridine orange‐stained cells (magnification ×400). (E) The fold change of acridine orange fluorescence intensity (FL3) versus untreated controls was calculated. The FL3 in untreated controls was defined as 1. (F) Lysates of the above Huh7‐SR cells were immunoblotted. ‘#’ (P < 0.05) and ‘##’ (P < 0.001) indicate a significant increase from controls. ‘ϕϕ’ (P < 0.001) vs. capmatinib alone; ‘†’ (P < 0.05) and ‘††’ (P < 0.001) vs. MK2206 alone.
Capmatinib treatment reduced the expression of p‐Met, p‐Akt, p‐ERK1/2, p‐S6K, p‐4EBP1, and cyclin D1, and increased caspase‐3 activation, but had little effect on the conversion of LC3‐1 to LC3‐II and Beclin‐1 expression (Fig. 5F). On the other hand, MK2206 reduced the expression of p‐Akt, p‐S6K, and p‐4EBP1, increased the conversion of LC3‐1 to LC3‐II, caspase‐3 activation, and p‐Met expression, but had a slight effect on the expression of p‐ERK1/2 and cyclin D1 (Fig. 5F). In cells treated with the combination of the two agents, capmatinib corrected MK2206‐induced p‐Met upregulation, and further reduced the expression of p‐Akt, p‐S6K, and p‐4EBP1 and increased caspase‐3 activation (Fig. 5F).
3.6. Dual inhibition of Akt and c‐Met suppresses sorafenib‐resistant tumors in vivo
Sorafenib‐resistant HCC cells were shown to be resistant to sorafenib in vivo (Fig. S6A), in agreement with our previous study (Zhai et al., 2014). For second‐line therapies, Huh7‐SR cells were inoculated into mice, which received daily administration of 10 mg·kg−1 sorafenib until tumors reached ~100 mm3, and were then assigned to different treatments (Fig. 6A). Huh7‐SR tumors continued to be insensitive to sorafenib treatment (Fig. S6B). However, administration of capmatinib and MK2206 significantly reduced the size of tumors by 34.5% and 55.8%, respectively, while the combination therapy resulted in a further reduction by 78.1%, compared with control tumors, 20 days after the commencement of treatments (Fig. 6B). The results were supported by the weights (Fig. 6C) and photographs (Fig. 6D) of tumors, which were harvested at the end of experiments. Either capmatinib or MK2206 or their combination showed little effects on bodyweight of mice (Fig. 6E).
Figure 6.
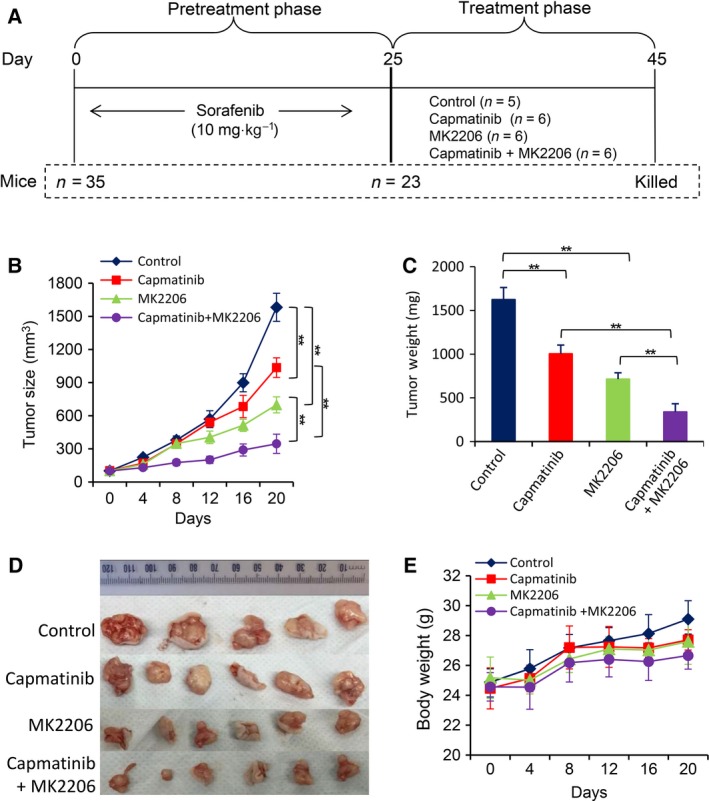
Dual inhibition of Akt and c‐Met as a second‐line therapy suppresses sorafenib‐resistant HCC tumors. (A) Animal experimental schedule was described in Materials and Methods. (B) The size (mm3) of tumors was recorded. Tumors harvested at the end of experiments were weighed (C) and photographed (D). (E) The bodyweights of mice were monitored ‘**’ (P < 0.001) indicates a significant difference.
The results were supported by in situ detection of cell proliferation by immunohistochemistry with an anti‐Ki67 antibody, and apoptosis by TUNEL staining (Fig. S7A,B). Capmatinib exhibited a stronger proliferation inhibitory ability than MK2206, while MK2206 had a more powerful proapoptotic activity than capmatinib. The two agents showed an additive effect in inhibiting cell proliferation, and a synergistic effect in promoting apoptosis in situ, as the values of CDI for proliferation and apoptosis indexes were 0.81 and 0.67, respectively. Immunohistochemical analyses of tumor tissues demonstrated similar alterations in the expression of p‐Met, p‐Akt, and cleaved caspase‐3 proteins (Fig. S7A), compared with that shown in vitro (Fig. 5F).
4. Discussion
Most patients with HCC have lost the opportunity for curative treatments at the time of diagnosis. Although several adjuvant therapeutic options are available, none of them are able to significantly improve the survival of patients with HCC after surgery according to a retrospective analysis from Cochrane databases (Samuel et al., 2009), indicating that drug therapy is irreplaceable in the treatment for HCC. Unfortunately, HCC is extremely resistant to conventional chemotherapy, and no standard chemotherapeutic regimens are available so far (Ang et al., 2013). The launch of sorafenib in 2007 opened a new era of molecular targeted therapy for HCC (Cheng et al., 2009; Llovet et al., 2008). Since then, 25 molecular targeted drugs have been investigated for HCC in phase III clinical trials, according to Medical Information Database (www.thomson-pharma.com). However, none of these drugs apart from sorafenib have reached the primary endpoints (Chan et al., 2016).
Increased expression of c‐Met is observed in over 80% of HCC tissues, and correlates with poor prognosis (Firtina Karagonlar et al., 2016; Jiang et al., 2015). Importantly, more evidence has indicated that the c‐Met signaling pathway might be a common mechanism of resistance to antiangiogenic drugs, such as sorafenib (Maroun and Rowlands, 2014). The activation of c‐Met is associated with chemoresistance in several types of cancer (Huang et al., 2016; Li et al., 2016) and participates in conferring the resistance to molecular targeted therapies (Firtina Karagonlar et al., 2016; Gou et al., 2016; Heynen et al., 2014; Kogita et al., 2015; Phan et al., 2015; Wilson et al., 2012). In the present study, we found that c‐Met was markedly upregulated in sorafenib‐resistant HCC cells, and sorafenib exposure increased the production of HGF and phosphorylation of c‐Met, leading to the activation of Akt and ERK pathways. Phosphatidylinositol 3‐kinase (PI3K), a downstream molecule of c‐Met and an upstream factor for Akt, is shown to be involved in sorafenib resistance of HCC (Ohta et al., 2015; Serova et al., 2013; Zhang et al., 2016), indicating that c‐Met may also regulate Akt activation through PI3K, but it needs further investigation. In support of our results, sorafenib was shown to upregulate c‐Met (Jiang et al., 2015), and long‐term sorafenib exposure increased the synthesis and secretin of HGF (Firtina Karagonlar et al., 2016). Inhibition of c‐Met by capmatinib (Krepler et al., 2016) and cabozantinib (Xiang et al., 2014) resulted in proliferation inhibition and apoptosis by downregulating cyclin D1 and activating caspase‐3. DE605, a c‐Met inhibitor, acts synergistically with sorafenib to suppress HCC cells (Jiang et al., 2015); SU11274, another c‐Met inhibitor, and HGF‐neutralizing antibody reversed the invasion properties of sorafenib‐resistant HCC cells (Firtina Karagonlar et al., 2016).
The Akt pathway plays a critical role in the mechanisms of sorafenib resistance by cross‐talking with the major sorafenib‐targeted ERK pathway (Aksamitiene et al., 2012). Although a number of Akt inhibitors have been developed and clinically evaluated (Yap et al., 2011), their clinical benefits are likely very limited due to the development of acquired resistance (Llovet and Hernandez‐Gea, 2014). Activation of receptor tyrosine kinases is implicated in acquisition of resistance to Akt inhibitors by relieving mTOR‐mediated feedback (Chandarlapaty et al., 2011). Compensatory feedback activation of ERK has been observed in tumor biopsies from patients treated with GDC0068 (Yan et al., 2013). Inhibition of Akt by either GDC0068 (Zhai et al., 2014) or MK2206 was able to transiently inhibit sorafenib‐resistant HCC cells, but also upregulated the expression of p‐Met. Therefore, co‐application of c‐Met inhibitors could enhance the effects of Akt inhibition in suppressing sorafenib‐resistant HCC cells. This proposal is supported by previous findings that co‐activation of Akt and c‐Met triggers the rapid development of HCC (Hu et al., 2016).
Unfortunately, the overexpression of Akt and c‐Met has not been confirmed in clinical sorafenib‐resistant HCC specimens, and the therapeutic effects of dual inhibition of Akt and Met have not been evaluated in patient‐derived xenografts, which are the limitations of the present study. As indicated in the guideline of American Association for the Study of Liver Diseases (AASLD), sorafenib is administered to patients with advanced HCC (Bruix et al., 2016). Those patients with late‐stage HCC have lost the chance for curative treatments, and cannot benefit from either laparotomy or needle biopsy, making it very difficult to collect clinical sorafenib‐resistant HCC tissues. We have not been fortune to collect these precious tissues by postmortem, which may be a possible way.
The mechanisms for the acquired resistance to sorafenib remain highly complex (Berasain, 2013). The signaling pathways and their interactions in sorafenib‐resistant HCC cells, and the interventions with agents used in the present study, are depicted in Fig. 7. Sorafenib targets the ERK pathway and a number of tyrosine kinase receptors including VEGFR (vascular endothelial growth factor receptor), PDGFR (platelet‐derived growth factor receptor), and c‐Kit (Llovet et al., 2008). Sustained sorafenib exposure induces the production of HGF, and upregulation of c‐Met and p‐Met, which in turn activates its downstream factors, Akt and ERK (Peters and Adjei, 2012). Exposure of HCC cells to sorafenib results in an increase in miR‐21 expression, a decrease in PTEN expression, and sequential Akt activation, leading to upregulation and activation of mammalian target of rapamycin (mTOR) and glycogen synthase kinase‐3β (GSK3β) (He et al., 2015; Zhai et al., 2014). GSK3β regulates apoptotic proteins (Serova et al., 2013), while mTOR controls autophagy by regulating autophagic proteins LC3 and Beclin‐1 (Sini et al., 2010). Autophagy switches from a cytoprotective role to a death‐promoting mechanism, and therefore, promoting autophagy leads to increased apoptosis in sorafenib‐resistant HCC cells (Zhai et al., 2014). Inhibition of Akt by MK2206 or GDC0068 induces autophagic cell death (Zhai et al., 2014), but also upregulates p‐Met via a negative feedback mechanism (Chandarlapaty et al., 2011). Capmatinib or cabozantinib inhibits c‐Met, thus leading to the inhibition of the ERK and Akt pathways (Peters and Adjei, 2012) and sequential downregulation of downstream factors controlling cell apoptosis, autophagy, and cell cycle arrest. The c‐Met inhibitors also block the compensatory feedback activation induced by Akt inhibition and cooperate with Akt inhibitors to suppress sorafenib‐resistant HCC cells. In the present study, MK2206 exhibited a stronger proapoptotic effect than capmatinib, while capmatinib displayed a more powerful inhibitory activity on cell proliferation than MK2206. This could be explained by the fact that Akt directly regulates apoptotic proteins, while c‐Met indirectly regulates apoptosis via the Akt pathway. On the other hand, c‐Met regulates proteins involved in cell proliferation via the ERK pathway (Fig. 7).
Figure 7.
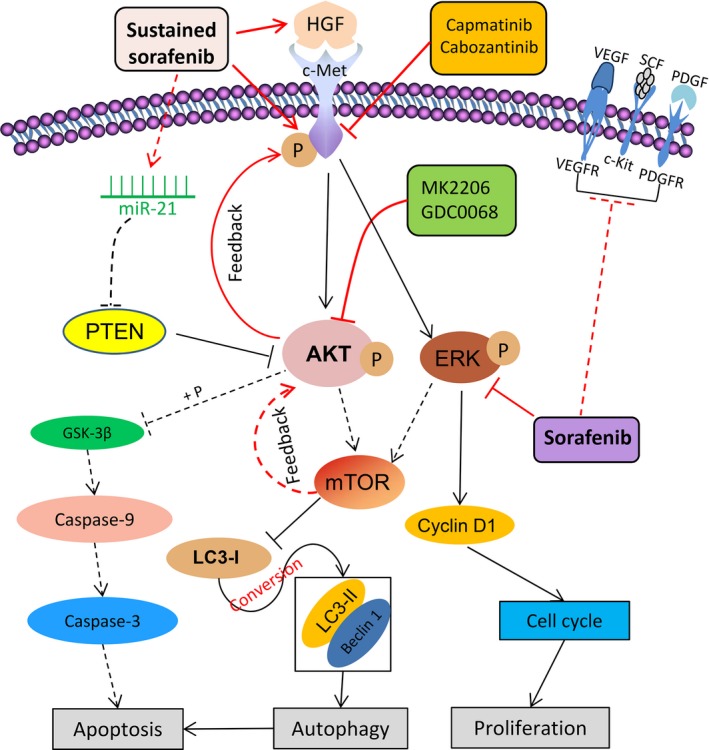
Proposed molecular mechanisms by which dual inhibition suppresses sorafenib‐resistant HCC cells by targeting the Akt and c‐Met pathways. ‘→’ indicates positive regulation or activation; ‘⊥’, negative regulation or blockade. Solid lines ‘____’ indicate mechanisms examined in the present study, while dotted lines ‘‐‐‐‐‐‐’, mechanisms in previous studies (He et al., 2015; Llovet et al., 2008; Zhai et al., 2014). Abbreviations and explanations: c‐Kit, also called stem cell growth factor receptor or CD117; c‐Met, also called hepatocyte growth factor receptor [HGFR]; ERK, extracellular signaling‐regulated kinase; GSK‐3β, glycogen synthase kinase‐3β; HGF, hepatocyte growth factor; LC3, microtubule‐associated protein 1 light chain 3; mTOR, mammalian target of rapamycin; PDGF, platelet‐derived growth factor; PDGFR, platelet‐derived growth factor receptor; PTEN, phosphatase and tensin homolog; SCF, stem cell factor; VEGF, vascular endothelial growth factor; VEGFR, vascular endothelial growth factor receptor.
MK2206 and capmatinib were selected as respective Akt and c‐Met inhibitors based on the promising in vitro results, and their favorable activities, potency, selectivity, and tolerance. MK2206 is a highly selective inhibitor of pan‐Akt and is being evaluated in clinical trials for treating solid tumors including HCC and shown reasonably well tolerated (Gupta et al., 2015). Capmatinib (formerly known as INC280) is an oral c‐Met inhibitor by selectively disrupting c‐Met via competing reversibly for the ATP‐binding site with more than 10 000‐fold selectivity over other kinases (Krepler et al., 2016). Capmatinib is also being evaluated in clinical trials for several types of advanced solid tumors including HCC (http://clinicaltrials.gov).
Despite recent progress in the anticancer campaign, the development of molecular targeted drugs for HCC has lagged behind the greater efficacy achieved in some other forms of cancer. Up to now, no distinctive ‘driver gene’ for HCC cells has been identified, and as a result, no drug targeting a single molecule has resulted in significant benefits for patients with HCC (Bruix and Sherman, 2011). Therefore, present strategies to combat HCC have to target the network of a few molecules or pathways. This may explain that sorafenib, a multitargeted tyrosine kinase inhibitor, could stand out as the first effective drug for the treatment of HCC (Cheng et al., 2009; Llovet et al., 2008). Given that no second‐line drugs are available after the failure of sorafenib (Chan et al., 2016), the results presented herein warrant clinical investigation of dual inhibition of c‐Met and Akt pathways, such as the combination of MK2206 and capmatinib, particularly as a second‐line therapy for advanced HCC that becomes acquired resistant to sorafenib.
Author contributions
XS and HL designed the project, supervised the study and finalized the manuscript; PH performed experiments, analyzed the data and drafted the manuscript. XJ, BZ, GT and DZ participated in experiments, acquired and analyzed the data; HQ, BL and HJ interpreted the data, and contributed to study design and manuscript revision; PH and HL contributed equally to this work.
Supporting information
Appendix S1. Supplementary materials and methods.
Fig. S1. Sorafenib‐resistant HCC cells are refractory to sorafenib‐induced growth inhibition and apoptosis.
Fig. S2. Inhibition of c‐Met by capmatinib and Akt inhibition by MK2206 are less effective in suppressing parental HCC cells.
Fig. S3. Inhibition of c‐Met by cabozantinib enhances the sensitivity of sorafenib‐resistant HCC cells to sorafenib.
Fig. S4. Autophagy assay by monodansycadaverine (MDC) staining. Huh7‐SR and HepG2‐SR cells were incubated for 48 h with capmatinib (2 nm), or MK2206 (1 μm) or the combination.
Fig. S5. Dual inhibition of Akt and c‐Met inhibits the proliferation of sorafenib‐resistant HCC cells. Huh7, Huh7‐SR, HepG2 and HepG2‐SR cells were incubated for 48 h with capmatinib (2 nm), or MK2206 (1 μm) or the combination.
Fig. S6. Sorafenib‐resistant tumors responded poorly to sorafenib treatment. (A) Huh7 or Huh7‐SR cells (5 × 10⁶) were subcutaneously inoculated into mice.
Fig. S7. Cell proliferation, apoptosis and gene expression in vivo.
Acknowledgements
This work was supported by grants from the National Natural Scientific Foundation of China (81472321, 81272467, and 81401975), General Financial Grant from China Postdoctoral Science Foundation (2016M591564), and Scientific Fund for Youths (QC2013C098 and QC2013C103), Postdoctoral Science Foundation (LBH‐Q13118), and Natural Scientific Foundation (H201307) of Heilongjiang Province. We thank Dr Shiva Reddy (University of Auckland, New Zealand) for revising the manuscript.
References
- Aksamitiene E, Kiyatkin A and Kholodenko BN (2012) Cross‐talk between mitogenic Ras/MAPK and survival PI3K/Akt pathways: a fine balance. Biochem Soc Trans 40, 139–146. [DOI] [PubMed] [Google Scholar]
- Ang C, O'Reilly EM and Abou‐Alfa GK (2013) Targeted agents and systemic therapy in hepatocellular carcinoma. Recent results in cancer research. Fortschritte der Krebsforschung. Progres dans les recherches sur le cancer 190, 225–246. [DOI] [PubMed] [Google Scholar]
- Berasain C (2013) Hepatocellular carcinoma and sorafenib: too many resistance mechanisms? Gut 62, 1674–1675. [DOI] [PubMed] [Google Scholar]
- Blumenschein GR Jr, Mills GB and Gonzalez‐Angulo AM (2012) Targeting the hepatocyte growth factor‐cMET axis in cancer therapy. J Clin Oncol 30, 3287–3296. [DOI] [PMC free article] [PubMed] [Google Scholar]
- Bruix J, Reig M and Sherman M (2016) Evidence‐based diagnosis, staging, and treatment of patients with hepatocellular carcinoma. Gastroenterology 150, 835–853. [DOI] [PubMed] [Google Scholar]
- Bruix J, Sherman M (2011) Management of hepatocellular carcinoma: an update. Hepatology (Baltimore, MD) 53, 1020–1022. [DOI] [PMC free article] [PubMed] [Google Scholar]
- Bupathi M, Kaseb A, Meric‐Bernstam F and Naing A (2015) Hepatocellular carcinoma: where there is unmet need. Mol Oncol 9, 1501–1509. [DOI] [PMC free article] [PubMed] [Google Scholar]
- Chan SL, Wong AM, Lee K, Wong N and Chan AK (2016) Personalized therapy for hepatocellular carcinoma: where are we now? Cancer Treat Rev 45, 77–86. [DOI] [PubMed] [Google Scholar]
- Chandarlapaty S, Sawai A, Scaltriti M, Rodrik‐Outmezguine V, Grbovic‐Huezo O, Serra V, Majumder PK, Baselga J and Rosen N (2011) AKT inhibition relieves feedback suppression of receptor tyrosine kinase expression and activity. Cancer Cell 19, 58–71. [DOI] [PMC free article] [PubMed] [Google Scholar]
- Cheng AL, Kang YK, Chen Z, Tsao CJ, Qin S, Kim JS, Luo R, Feng J, Ye S, Yang TS et al (2009) Efficacy and safety of sorafenib in patients in the Asia‐Pacific region with advanced hepatocellular carcinoma: a phase III randomised, double‐blind, placebo‐controlled trial. Lancet Oncol 10, 25–34. [DOI] [PubMed] [Google Scholar]
- Dulak AM, Gubish CT, Stabile LP, Henry C and Siegfried JM (2011) HGF‐independent potentiation of EGFR action by c‐Met. Oncogene 30, 3625–3635. [DOI] [PMC free article] [PubMed] [Google Scholar]
- Firtina Karagonlar Z, Koc D, Iscan E, Erdal E and Atabey N (2016) Elevated hepatocyte growth factor expression as an autocrine c‐Met activation mechanism in acquired resistance to sorafenib in hepatocellular carcinoma cells. Cancer Sci 107, 407–416. [DOI] [PMC free article] [PubMed] [Google Scholar]
- Gherardi E, Birchmeier W, Birchmeier C and Vande Woude G (2012) Targeting MET in cancer: rationale and progress. Nat Rev Cancer 12, 89–103. [DOI] [PubMed] [Google Scholar]
- Giordano S and Columbano A (2014) Met as a therapeutic target in HCC: facts and hopes. J Hepatol 60, 442–452. [DOI] [PubMed] [Google Scholar]
- Gou LY, Li AN, Yang JJ, Zhang XC, Su J, Yan HH, Xie Z, Lou NN, Liu SY, Dong ZY et al (2016) The coexistence of MET over‐expression and an EGFR T790M mutation is related to acquired resistance to EGFR tyrosine kinase inhibitors in advanced non‐small cell lung cancer. Oncotarget 7, 51311–51319. [DOI] [PMC free article] [PubMed] [Google Scholar]
- Gupta S, Argiles G, Munster PN, Hollebecque A, Dajani O, Cheng JD, Wang R, Swift A, Tosolini A and Piha‐Paul SA (2015) A phase I trial of combined ridaforolimus and MK‐2206 in patients with advanced malignancies. Clin Cancer Res 21, 5235–5244. [DOI] [PubMed] [Google Scholar]
- He C, Dong X, Zhai B, Jiang X, Dong D, Li B, Jiang H, Xu S and Sun X (2015) MiR‐21 mediates sorafenib resistance of hepatocellular carcinoma cells by inhibiting autophagy via the PTEN/Akt pathway. Oncotarget 6, 28867–28881. [DOI] [PMC free article] [PubMed] [Google Scholar]
- Heynen GJ, Fonfara A, Bernards R (2014) Resistance to targeted cancer drugs through hepatocyte growth factor signaling. Cell Cycle (Georgetown, Tex) 13, 3808–3817. [DOI] [PMC free article] [PubMed] [Google Scholar]
- Ho‐Yen CM, Jones JL and Kermorgant S (2015) The clinical and functional significance of c‐Met in breast cancer: a review. Breast Cancer Res 17, 52. [DOI] [PMC free article] [PubMed] [Google Scholar]
- Hu J, Che L, Li L, Pilo MG, Cigliano A, Ribback S, Li X, Latte G, Mela M, Evert M et al (2016) Co‐activation of AKT and c‐Met triggers rapid hepatocellular carcinoma development via the mTORC1/FASN pathway in mice. Sci Rep 6, 20484. [DOI] [PMC free article] [PubMed] [Google Scholar]
- Huang M, Liu T, Ma P, Mitteer RA Jr, Zhang Z, Kim HJ, Yeo E, Zhang D, Cai P, Li C et al (2016) c‐Met‐mediated endothelial plasticity drives aberrant vascularization and chemoresistance in glioblastoma. J Clin Investig 126, 1801–1814. [DOI] [PMC free article] [PubMed] [Google Scholar]
- Jiang X, Feng K, Zhang Y, Li Z, Zhou F, Dou H and Wang T (2015) Sorafenib and DE605, a novel c‐Met inhibitor, synergistically suppress hepatocellular carcinoma. Oncotarget 6, 12340–12356. [DOI] [PMC free article] [PubMed] [Google Scholar]
- Kogita A, Togashi Y, Hayashi H, Banno E, Terashima M, De Velasco MA, Sakai K, Fujita Y, Tomida S, Takeyama Y et al (2015) Activated MET acts as a salvage signal after treatment with alectinib, a selective ALK inhibitor, in ALK‐positive non‐small cell lung cancer. Int J Oncol 46, 1025–1030. [DOI] [PubMed] [Google Scholar]
- Krepler C, Xiao M, Sproesser K, Brafford PA, Shannan B, Beqiri M, Liu Q, Xu W, Garman B, Nathanson KL et al (2016) Personalized preclinical trials in BRAF inhibitor‐resistant patient‐derived xenograft models identify second‐line combination therapies. Clin Cancer Res 22, 1592–1602. [DOI] [PMC free article] [PubMed] [Google Scholar]
- Li E, Hu Z, Sun Y, Zhou Q, Yang B, Zhang Z and Cao W (2016) Small molecule inhibitor of c‐Met (PHA665752) suppresses the growth of ovarian cancer cells and reverses cisplatin resistance. Tum Biol 37, 7843–7852. [DOI] [PubMed] [Google Scholar]
- Llovet JM and Hernandez‐Gea V (2014) Hepatocellular carcinoma: reasons for phase III failure and novel perspectives on trial design. Clin Cancer Res 20, 2072–2079. [DOI] [PubMed] [Google Scholar]
- Llovet JM, Ricci S, Mazzaferro V, Hilgard P, Gane E, Blanc JF, de Oliveira AC, Santoro A, Raoul JL, Forner A et al (2008) Sorafenib in advanced hepatocellular carcinoma. New Engl J Med 359, 378–390. [DOI] [PubMed] [Google Scholar]
- Ma L, Li G, Zhu H, Dong X, Zhao D, Jiang X, Li J, Qiao H, Ni S and Sun X (2014) 2‐Methoxyestradiol synergizes with sorafenib to suppress hepatocellular carcinoma by simultaneously dysregulating hypoxia‐inducible factor‐1 and ‐2. Cancer Lett 355, 96–105. [DOI] [PubMed] [Google Scholar]
- Manning BD and Cantley LC (2007) AKT/PKB signaling: navigating downstream. Cell 129, 1261–1274. [DOI] [PMC free article] [PubMed] [Google Scholar]
- Maroun CR and Rowlands T (2014) The Met receptor tyrosine kinase: a key player in oncogenesis and drug resistance. Pharmacol Ther 142, 316–338. [DOI] [PubMed] [Google Scholar]
- Moran‐Jones K, Brown LM and Samimi G (2015) INC280, an orally available small molecule inhibitor of c‐MET, reduces migration and adhesion in ovarian cancer cell models. Sci Rep 5, 11749. [DOI] [PMC free article] [PubMed] [Google Scholar]
- Ohta K, Hoshino H, Wang J, Ono S, Iida Y, Hata K, Huang SK, Colquhoun S and Hoon DS (2015) MicroRNA‐93 activates c‐Met/PI3K/Akt pathway activity in hepatocellular carcinoma by directly inhibiting PTEN and CDKN1A. Oncotarget 6, 3211–3224. [DOI] [PMC free article] [PubMed] [Google Scholar]
- Peters S and Adjei AA (2012) MET: a promising anticancer therapeutic target. Nat Rev Clin Oncol 9, 314–326. [DOI] [PubMed] [Google Scholar]
- Phan LM, Fuentes‐Mattei E, Wu W, Velazquez‐Torres G, Sircar K, Wood CG, Hai T, Jimenez C, Cote GJ, Ozsari L et al (2015) Hepatocyte growth factor/cMET pathway activation enhances cancer Hallmarks in adrenocortical carcinoma. Cancer Res 75, 4131–4142. [DOI] [PMC free article] [PubMed] [Google Scholar]
- Piguet AC, Saar B, Hlushchuk R, St‐Pierre MV, McSheehy PM, Radojevic V, Afthinos M, Terracciano L, Djonov V and Dufour JF (2011) Everolimus augments the effects of sorafenib in a syngeneic orthotopic model of hepatocellular carcinoma. Mol Cancer Ther 10, 1007–1017. [DOI] [PubMed] [Google Scholar]
- Rota Caremoli E and Labianca R (2014) Tivantinib: critical review with a focus on hepatocellular carcinoma. Expert Opin Investig Drugs 23, 1563–1574. [DOI] [PubMed] [Google Scholar]
- Salony, Sole X, Alves CP, Dey‐Guha I, Ritsma L, Boukhali M, Lee JH, Chowdhury J, Ross KN, Haas W et al (2016) AKT inhibition promotes nonautonomous cancer cell survival. Mol Cancer Ther 15, 142–153. [DOI] [PMC free article] [PubMed] [Google Scholar]
- Samuel M, Chow PK, Chan Shih‐Yen E, Machin D, Soo KC (2009) Neoadjuvant and adjuvant therapy for surgical resection of hepatocellular carcinoma. Cochrane Database Syst Rev Cd001199. [DOI] [PMC free article] [PubMed] [Google Scholar]
- Santoro A, Rimassa L, Borbath I, Daniele B, Salvagni S, Van Laethem JL, Van Vlierberghe H, Trojan J, Kolligs FT, Weiss A et al (2013) Tivantinib for second‐line treatment of advanced hepatocellular carcinoma: a randomised, placebo‐controlled phase 2 study. Lancet Oncol 14, 55–63. [DOI] [PubMed] [Google Scholar]
- Serova M, de Gramont A, Tijeras‐Raballand A, Dos Santos C, Riveiro ME, Slimane K, Faivre S and Raymond E (2013) Benchmarking effects of mTOR, PI3K, and dual PI3K/mTOR inhibitors in hepatocellular and renal cell carcinoma models developing resistance to sunitinib and sorafenib. Cancer Chemother Pharmacol 71, 1297–1307. [DOI] [PubMed] [Google Scholar]
- Sini P, James D, Chresta C and Guichard S (2010) Simultaneous inhibition of mTORC1 and mTORC2 by mTOR kinase inhibitor AZD8055 induces autophagy and cell death in cancer cells. Autophagy 6, 553–554. [DOI] [PubMed] [Google Scholar]
- Stottrup C, Tsang T and Chin YR (2016) Upregulation of AKT3 confers resistance to the AKT inhibitor MK2206 in breast cancer. Mol Cancer Ther 15, 1964–1974. [DOI] [PMC free article] [PubMed] [Google Scholar]
- Waidmann O and Trojan J (2015) Novel drugs in clinical development for hepatocellular carcinoma. Expert Opin Investig Drugs 24, 1075–1082. [DOI] [PubMed] [Google Scholar]
- Wang J, Ma Y, Jiang H, Zhu H, Liu L, Sun B, Pan S, Krissansen GW and Sun X (2011) Overexpression of von Hippel‐Lindau protein synergizes with doxorubicin to suppress hepatocellular carcinoma in mice. J Hepatol 55, 359–368. [DOI] [PubMed] [Google Scholar]
- Wilson TR, Fridlyand J, Yan Y, Penuel E, Burton L, Chan E, Peng J, Lin E, Wang Y, Sosman J et al (2012) Widespread potential for growth‐factor‐driven resistance to anticancer kinase inhibitors. Nature 487, 505–509. [DOI] [PMC free article] [PubMed] [Google Scholar]
- Xiang Q, Chen W, Ren M, Wang J, Zhang H, Deng DY, Zhang L, Shang C and Chen Y (2014) Cabozantinib suppresses tumor growth and metastasis in hepatocellular carcinoma by a dual blockade of VEGFR2 and MET. Clin Cancer Res 20, 2959–2970. [DOI] [PubMed] [Google Scholar]
- Yan Y, Serra V, Prudkin L, Scaltriti M, Murli S, Rodriguez O, Guzman M, Sampath D, Nannini M, Xiao Y et al (2013) Evaluation and clinical analyses of downstream targets of the Akt inhibitor GDC‐0068. Clin Cancer Res 19, 6976–6986. [DOI] [PubMed] [Google Scholar]
- Yap TA, Yan L, Patnaik A, Fearen I, Olmos D, Papadopoulos K, Baird RD, Delgado L, Taylor A, Lupinacci L et al (2011) First‐in‐man clinical trial of the oral pan‐AKT inhibitor MK‐2206 in patients with advanced solid tumors. J Clin Oncol 29, 4688–4695. [DOI] [PubMed] [Google Scholar]
- Yau TC, Sukeepaisarnjaroen W, Chao Y, Yen C, Lausoontornsiri W, Chen PJ, Sanpajit T, Lencioni R, Camp AC, Cox DS et al (2012) A phase I/II study of foretinib, an oral multikinase inhibitor targeting MET, RON, AXL, TIE‐2, and VEGFR in advanced hepatocellular carcinoma (HCC). J Clin Oncol 30, Suppl; abstr 4108. [Google Scholar]
- Zhai B, Hu F, Jiang X, Xu J, Zhao D, Liu B, Pan S, Dong X, Tan G, Wei Z et al (2014) Inhibition of Akt reverses the acquired resistance to sorafenib by switching protective autophagy to autophagic cell death in hepatocellular carcinoma. Mol Cancer Ther 13, 1589–1598. [DOI] [PubMed] [Google Scholar]
- Zhang PF, Li KS, Shen YH, Gao PT, Dong ZR, Cai JB, Zhang C, Huang XY, Tian MX, Hu ZQ et al (2016) Galectin‐1 induces hepatocellular carcinoma EMT and sorafenib resistance by activating FAK/PI3K/AKT signaling. Cell Death Dis 7, e2201. [DOI] [PMC free article] [PubMed] [Google Scholar]
Associated Data
This section collects any data citations, data availability statements, or supplementary materials included in this article.
Supplementary Materials
Appendix S1. Supplementary materials and methods.
Fig. S1. Sorafenib‐resistant HCC cells are refractory to sorafenib‐induced growth inhibition and apoptosis.
Fig. S2. Inhibition of c‐Met by capmatinib and Akt inhibition by MK2206 are less effective in suppressing parental HCC cells.
Fig. S3. Inhibition of c‐Met by cabozantinib enhances the sensitivity of sorafenib‐resistant HCC cells to sorafenib.
Fig. S4. Autophagy assay by monodansycadaverine (MDC) staining. Huh7‐SR and HepG2‐SR cells were incubated for 48 h with capmatinib (2 nm), or MK2206 (1 μm) or the combination.
Fig. S5. Dual inhibition of Akt and c‐Met inhibits the proliferation of sorafenib‐resistant HCC cells. Huh7, Huh7‐SR, HepG2 and HepG2‐SR cells were incubated for 48 h with capmatinib (2 nm), or MK2206 (1 μm) or the combination.
Fig. S6. Sorafenib‐resistant tumors responded poorly to sorafenib treatment. (A) Huh7 or Huh7‐SR cells (5 × 10⁶) were subcutaneously inoculated into mice.
Fig. S7. Cell proliferation, apoptosis and gene expression in vivo.