

ABSTRACT
We sought to describe the population pharmacokinetics of tigecycline in critically ill patients and to determine optimized dosing regimens of tigecycline for different bacterial infections. This prospective study included 10 critically ill patients given a standard dose of tigecycline. Blood samples were collected during one dosing interval and were analyzed using validated chromatography. Population pharmacokinetics and Monte Carlo dosing simulations were undertaken using Pmetrics. Three target exposures, expressed as ratios of the 24-h area under the curve to MICs (AUC0–24/MIC), were evaluated (≥17.9 for skin infections, ≥6.96 for intra-abdominal infections, ≥4.5 for hospital-acquired pneumonia). The median age, total body weight, and body mass index (BMI) were 67 years, 69.1 kg, and 24.7 kg/m2, respectively. A two-compartment linear model best described the time course of tigecycline concentrations. The parameter estimates (expressed as means ± standard deviations [SD]) from the final model were as follows: clearance (CL), 7.50 ± 1.11 liters/h; volume in the central compartment, 72.50 ± 21.18 liters; rate constant for tigecycline distribution from the central to the peripheral compartment, 0.31 ± 0.16 h−1; and rate constant for tigecycline distribution from the peripheral to the central compartment, 0.29 ± 0.30 h−1. A larger BMI was associated with increased CL of tigecycline. Licensed doses were found to be sufficient for Enterobacter cloacae, Escherichia coli, Klebsiella pneumoniae, and methicillin-resistant Staphylococcus aureus for an AUC0–24/MIC target of 4.5 or 6.96. For a therapeutic target of 17.9, an increased tigecycline dose is required, especially for patients with higher BMI. The dosing requirements of tigecycline differ with the indication, with pathogen susceptibility, and potentially with patient BMI.
KEYWORDS: tigecycline, population pharmacokinetics, critically ill patients, severe infections
INTRODUCTION
Critically ill patients are at high risk of developing severe infections, resulting in prolonged hospital stays, higher treatment costs, and increased mortality. The choice of appropriate antimicrobial therapy can be limited by the high rates of bacterial resistance. Increased knowledge of antimicrobial pharmacokinetics can guide dose optimization.
Tigecycline, the first member of the glycylcycline class of antimicrobial agents, was approved by the U.S. Food and Drug Administration (FDA) for the treatment of complicated intra-abdominal infections (cIAI), complicated skin and skin structure infections (cSSSI), and community-acquired pneumonia (CAP) (1). Given its expanded spectrum of in vitro antibacterial activity, tigecycline is also considered an agent suitable for difficult-to-treat infections in critically ill patients, although published data on its pharmacokinetics in this population are very limited.
The FDA issued a black box warning on the increased risk of mortality with tigecycline treatment for hospital-acquired pneumonia (HAP) and especially ventilator-associated pneumonia (2). After further analysis of the available trials, Freire et al. postulated that suboptimal tigecycline dosing was associated with an increased risk of death (3). As such, several clinical studies have evaluated the efficacy of increasing tigecycline dosing regimens (4, 5). For critically ill patients, high-dose tigecycline may be a desirable treatment strategy, although the appropriateness of a fixed high dose has not been determined, and it is unlikely to be appropriate given the wide range of patients and indications for which it may be used.
Early efficacy studies with animal models indicated that the ratio of the 24-h area under the curve to the MIC of the pathogen (AUC0–24/MIC) was the preferred pharmacokinetic/pharmacodynamic (PK/PD) index for tigecycline (6). However, the specific PK/PD target differs depending on the type of infection. Various exposure-response analyses have now been performed for tigecycline. Using a classification and regression tree approach, investigators have identified AUC0–24/MIC breakpoints of 17.9 in the treatment of cSSSI, 6.96 for cIAI, and 4.5 for HAP (7–9). However, which dose is required to achieve these targets in critically ill patients has not been studied in detail.
The aims of this study were to describe the population pharmacokinetics (pop-PK) of tigecycline in critically ill patients with severe infections, identify the patient factors influencing pharmacokinetics, and utilize the resultant model to describe optimized tigecycline dosage regimens for different bacterial infections.
RESULTS
Demographic data.
The characteristics of the 10 critically ill patients with severe infections included in this study are provided in Table 1. No severe hepatic insufficiency was observed in the study. The infections were pulmonary (n = 6), cIAI (n = 1), cSSSI (n = 1), and multiple infections (pulmonary plus urinary tract infection; cSSSI plus urinary tract infection) (n = 2). Microbiological samples for one Staphylococcus aureus, one Stenotrophomonas maltophilia, two Escherichia coli, two Pseudomonas aeruginosa, two Enterococcus faecalis, two Klebsiella pneumoniae, three Enterococcus faecium, and four Acinetobacter baumannii strains were isolated from these patients.
TABLE 1.
Demographic characteristics of 10 critically ill patients treated with tigecycline for severe infections
| Descriptive dataa | No. of patients or median value (IQR)b |
|---|---|
| Female/male | 4/6 |
| Age (yr) | 64 (36.5–73) |
| Weight (kg) | 69.1 (59.7–70.8) |
| BMI (kg/m2) | 24.7 (24.3–25.6) |
| APACHE II score at admission | 20 (13–22) |
| Length of hospital stay (days) | 24 (13–40.5) |
| Creatinine concn at admission (mg/dl) | 0.7 (0.6–1.85) |
| Albumin concn at admission (g/dl) | 2.8 (2.7–2.9) |
| Comorbid conditions | |
| AKI | 1 |
| Hypertension | 5 |
| CRRT | 2 |
| COPD | 2 |
| MODS | 2 |
| Chronic renal failure | 1 |
| Diabetes mellitus | 2 |
APACHE II score, Acute Physiology and Chronic Health Evaluation II score; AKI, acute kidney injury as defined per RIFLE criteria; CRRT, continuous renal replacement therapy; COPD, chronic obstructive pulmonary diseases; MODS, multiple organ dysfunction syndrome.
IQR, interquartile range.
Tigecycline pharmacokinetics.
A two-compartment linear model adequately described the time course of serum tigecycline concentrations. The goodness-of-fit plots of the model were considered acceptable, and the parameter estimates (given as means and standard deviations [SD]) from the final covariate model are shown in Table 2. Plots of the observed versus population-predicted concentrations and individual-predicted concentrations are shown in Fig. 1. The r2, bias, and imprecision values for prediction were 0.733, 0.391 mg/liter, and 4.54 mg2/liter2 for the population predictive model and 0.944, −0.0768 mg/liter, and 0.975 mg2/liter2 for the posterior Bayesian prediction, respectively. In the final model, only body mass index (BMI) was supported as a covariate for tigecycline clearance (CL) with a linear relationship. The decision to include BMI was based on biological plausibility, and the addition resulted in a visual improvement of the observed and population-predicted concentration goodness-of-fit plot, as well as the visual predictive check plot (Fig. 2). No significant improvement in the log-likelihood value was observed as a result of adding BMI as a covariate. Although no obese patients were sampled in this study (BMI range, 22.4 to 26.0), increasing BMI was found to be associated with increasing CL in the final model, and patients were then categorized into the following two groups for simulation according to BMI values: normal weight (BMI, 18.5 to 29.9 kg/m2) and obesity (BMI, ≥30 kg/m2). The simulations for some of these patients are beyond the BMI of the patients included, and subsequent dosing recommendations should be considered advisory only.
TABLE 2.
Parameter estimates for tigecycline from the final covariate two-compartment population pharmacokinetic model
| Parametera | Mean | SD | Coefficient of variation (%) | Median |
|---|---|---|---|---|
| V | 72.49 | 21.18 | 29.22 | 71.83 |
| CLc | 7.50 | 1.11 | 14.80 | 7.73 |
| Kcp | 0.31 | 0.16 | 51.85 | 0.28 |
| Kpc | 0.29 | 0.30 | 104.41 | 0.18 |
CLc, population clearance of tigecycline in the central compartment; V, population volume of distribution in the central compartment; Kcp, rate constant for tigecycline distribution from the central to the peripheral compartment; Kpc, rate constant for tigecycline distribution from the peripheral to the central compartment.
FIG 1.

Diagnostic plot for the final population pharmacokinetic covariate model. (Bottom) Observed tigecycline concentrations versus population-predicted tigecycline concentration. (The r2, bias, and imprecision values were 0.733, 0.391 mg/liter, and 4.54 mg2/liter2.) (Top) Observed tigecycline concentrations versus individual-predicted tigecycline concentration (the r2, bias, and imprecision values were 0.944, −0.0768 mg/liter, and 0.975 mg2/liter2).
FIG 2.

Visual predictive check of tigecycline serum data.
Monte Carlo simulations. (i) Probability of target attainment (PTA) for the loading dose.
We found that the 100- to 400-mg loading doses of tigecycline achieved AUC0–24/MIC ratios of >4.5 at MICs of 0.5, 1, and 2 mg/liter on day 1. A loading dose of 200 or 300 mg leads to a suboptimal tigecycline target value, and the AUC0–24/MIC ratio is lower than 17.9 at a MIC of 2 mg/liter. Loading doses of ≥400 mg tigecycline appear necessary to achieve an AUC0–24/MIC ratio of >17.9 at a MIC of 2 mg/liter, while at a MIC of 0.5 mg/liter, 100 mg is sufficient to achieve an AUC0–24/MIC ratio of >17.9 during the first 24 h of treatment (Fig. 3).
FIG 3.

Probability of target attainment for various loading doses. Dashed lines represent different AUC0–24/MIC targets of 4.5, 6.96, and 17.9.
(ii) Probability of target attainment for the maintenance dose.
Table 3 and Fig. 4 present dosing simulations for various maintenance doses and their relative probabilities of achieving AUC0–24/MIC ratios of 4.5, 6.96, and 17.9 for a range of MICs (0.25 to 8 mg/liter) in patients with normal weight or obesity. These data confirm that obese patients are associated with reduced PTA, while increases in tigecycline dosing regimens are associated with increased PTA. Among simulated patients achieving a target AUC0–24/MIC ratio of 6.96, the PTA with a tigecycline dose of 150 mg every 12 h was 96.6% at a MIC of 4 mg/liter in normal-weight patients but 43.1% in obese patients. When the target was an AUC0–24/MIC ratio of 17.9, PTA of >90%, indicating successful target attainment, were achieved for normal-weight patients for MICs of 0.5, 1, and 2 mg/liter and corresponding dosing regimens of 50, 100, and 200 mg every 12 h, but PTA were lower than 60% for obese patients.
TABLE 3.
Probabilities of target attainment on day 5 for different BMI groups, target values, and tigecycline dosage regimensa
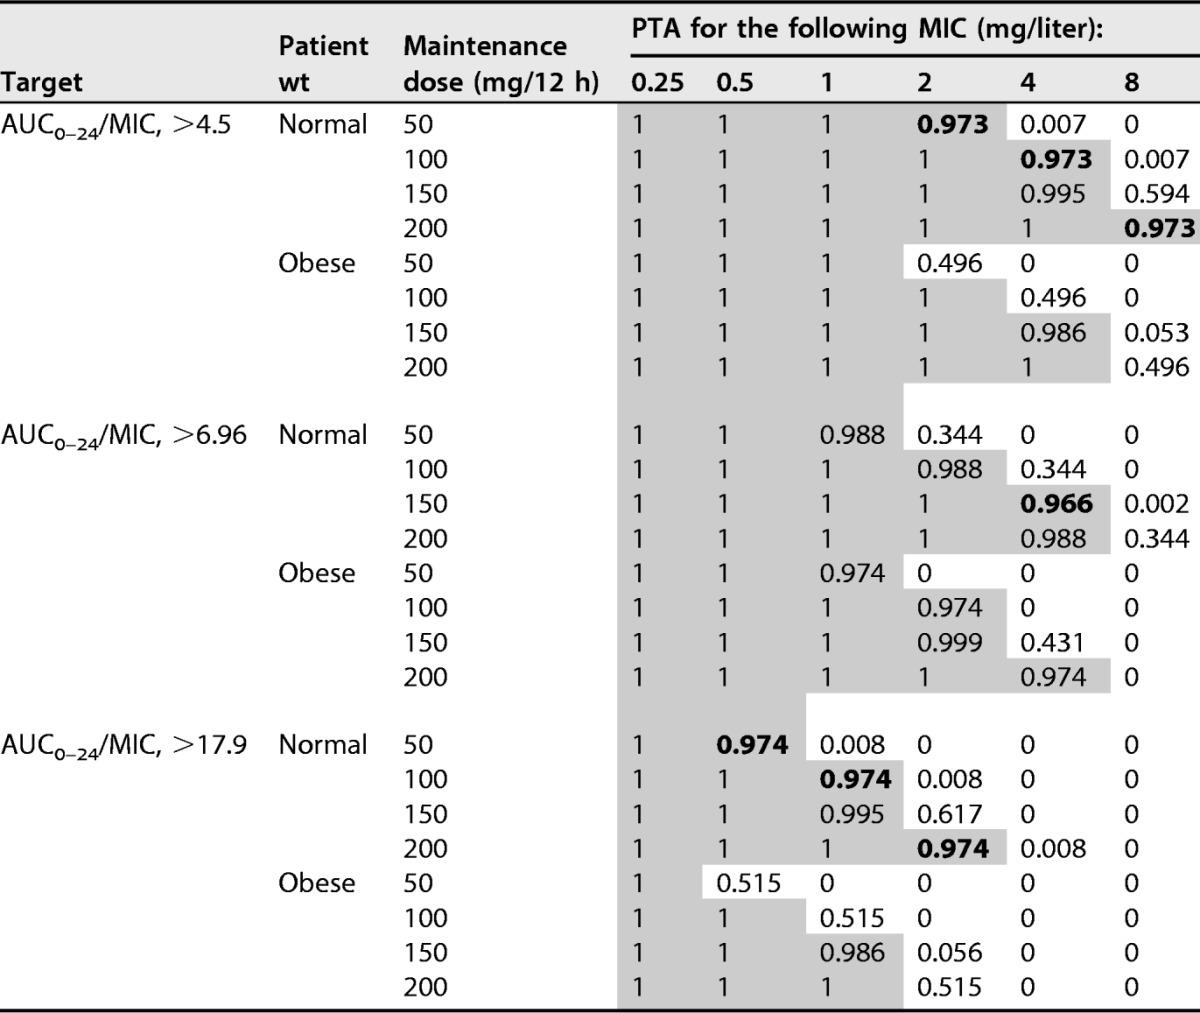
Shading indicates successful target attainment (PTA, >90%). BMI, body mass index; AUC0–24/MIC, ratio of the 24-h area under the curve to the MIC; PTA, probability of target attainment.
FIG 4.

Probability of target attainment from 120 to 144 h for a patient with normal weight or obesity administered different tigecycline maintenance doses of 50 mg/12 h, 100 mg/12 h, 150 mg/12 h, and 200 mg/12 h. The PK/PD target is achieved when the PTA value is 90% coverage. The targets for which results are shown are AUC0–24/MIC ratios of 4.5 (A), 6.96 (B), and 17.9 (C).
(iii) Fractional target attainment.
Table 4 shows the fractional target attainment for simulated PTA for a range of tigecycline doses, patient BMI values, and MIC distributions (expressed as various AUC0–24/MIC targets) for five pathogens. These data show that differences in BMI and different pathogen infections had large effects on fractional target attainment. In all the obese patients, serum PK/PD targets are rarely achieved with a dosage of 50 mg every 12 h for A. baumannii, even though the optimal fractional attainment is achievable for methicillin-resistant Staphylococcus aureus (MRSA) at the same dosage. A regimen of 100 mg every 12 h is generally required for A. baumannii at an AUC0–24/MIC target of 6.96, a regimen of 200 mg/12 h for an AUC0–24/MIC target of 17.9, and no dose adjustment for an AUC0–24/MIC target of 4.5 among normal-weight patients. For obese patients, suboptimal fractional target attainment may still be retained with increasing doses. No dose adjustment is needed for Enterobacter cloacae, E. coli, K. pneumoniae, or MRSA for an AUC0–24/MIC target of 6.96. For a therapeutic AUC0–24/MIC target of 17.9, increased dosing needs to be considered, especially for obese patients, in treating infections with A. baumannii, E. cloacae, E. coli, or K. pneumoniae.
TABLE 4.
Fractional target attainment across the European Committee on Antimicrobial Susceptibility Testing MIC distributions for each of the selected pathogensa
| Pathogen (n) | Dose regimen (mg/12 h) | Probability of target attainment (%) with the indicated patient wt |
|||||
|---|---|---|---|---|---|---|---|
| AUC0–24/MIC, >4.5 |
AUC0–24/MIC, >6.96 |
AUC0–24/MIC, >17.9 |
|||||
| Normal | Obese | Normal | Obese | Normal | Obese | ||
| Acinetobacter baumannii (399) | 50 | 95.8 | 87.1 | 84.1 | 77.5 | 51.9 | 40.5 |
| 100 | 99.9 | 98.1 | 97.3 | 95.8 | 77.7 | 65.7 | |
| 150 | 100.0 | 99.9 | 99.9 | 97.8 | 89.2 | 78.8 | |
| 200 | 100.0 | 100.0 | 100.0 | 99.9 | 95.8 | 87.5 | |
| Enterobacter cloacae (6,365) | 50 | 98.5 | 96.7 | 96.0 | 94.6 | 86.8 | 78.2 |
| 100 | 99.7 | 99.2 | 99.0 | 98.5 | 94.6 | 91.1 | |
| 150 | 99.9 | 99.7 | 99.7 | 99.1 | 97.1 | 94.9 | |
| 200 | 100.0 | 99.8 | 99.8 | 99.7 | 98.5 | 96.8 | |
| Escherichia coli (4,789) | 50 | 99.7 | 99.5 | 99.4 | 99.2 | 95.3 | 87.5 |
| 100 | 99.9 | 99.8 | 99.8 | 99.7 | 99.2 | 97.5 | |
| 150 | 99.9 | 99.9 | 99.9 | 99.8 | 99.5 | 99.2 | |
| 200 | 99.9 | 99.9 | 99.9 | 99.9 | 99.7 | 99.5 | |
| Klebsiella pneumoniae (12,530) | 50 | 98.7 | 96.8 | 96.0 | 94.5 | 85.7 | 76.1 |
| 100 | 99.9 | 99.4 | 99.2 | 98.7 | 94.5 | 90.6 | |
| 150 | 99.9 | 99.9 | 99.9 | 99.3 | 97.2 | 94.8 | |
| 200 | 99.9 | 99.9 | 99.9 | 99.9 | 98.8 | 96.9 | |
| MRSA (2,426) | 50 | 100.0 | 99.9 | 99.8 | 99.7 | 99.5 | 98.2 |
| 100 | 100.0 | 100.0 | 100.0 | 100.0 | 99.7 | 99.7 | |
| 150 | 100.0 | 100.0 | 100.0 | 100.0 | 99.9 | 99.8 | |
| 200 | 100.0 | 100.0 | 100.0 | 100.0 | 100.0 | 99.9 | |
A dosing regimen is considered successful if the probability of fractional target attainment is >90% (boldface values). AUC0–24/MIC, ratio of the 24-h area under the curve to the MIC.
DISCUSSION
Key findings.
The population pharmacokinetic parameters of tigecycline for critically ill patients were first described in this study. We observed that BMI was an important descriptor of total CL of tigecycline. We also observed that the licensed dose of tigecycline is sufficient for E. cloacae, E. coli, K. pneumoniae, and MRSA at AUC0–24/MIC targets of 4.5 and 6.96 in both obese and normal-weight patients. A maintenance dosing regimen of 200 mg every 12 h is required for A. baumannii at the AUC0–24/MIC target of 17.9, and 100 mg/12 h at the AUC0–24/MIC target of 6.96 among normal-weight patients. For obese patients, suboptimal fractional attainment may still be present despite increasing doses.
Relationship with previous papers.
Previously, Van Wart et al. (10) developed a tigecycline population pharmacokinetic model with patients with cIAI or cSSSI and identified total body weight, creatinine clearance (CLcr), and male sex as covariates of CL. Rubino et al. (11) observed an association between tigecycline CL, body surface area (BSA), and CLcr in community- and hospital-acquired pneumonia. Pai (12) characterized the concentration profiles of tigecycline in the serum and urine of obese class III (obese-C3) and normal-weight healthy adults. The serum and urine PK of tigecycline are similar in obese-C3 and normal-weight healthy adults. In the current study, we also observed an association between tigecycline CL and patient body size—in our case, BMI. However, the mean tigecycline CL and the volume in the central compartment (Vc) of 15.7 liters/h and 115 liters from the data of community- and hospital-acquired pneumonia patients, and 19.2 liters/h and 65.2 liters from patients with cIAI or cSSSI, were comparable to the mean estimates we found for the present critically ill patient population. In contrast, the study of Pai et al. found no difference in the mean parameters of CL and Vc between the obese-C3 and normal-weight healthy adults. Those authors found that tigecycline clearance in the various populations studied (cIAI, cSSSI, CAP, and HAP) was associated with patient body size (weight or BSA). In our study, the patient's estimated weight was not significantly associated with changes in clearance. All patients received resuscitation fluids as part of standard therapy, but fluid balance was not found to affect the volume of distribution or clearance. Given the large volume of distribution of tigecycline, we believe that a relationship between increased fluid balance and altered volume of distribution is less likely (as with ciprofloxacin). The two subjects who received continuous renal replacement therapy (CRRT) did so prior to tigecycline treatment. If CRRT was present during the PK sampling, this may have been an important covariate, and a study of the effect of CRRT on tigecycline clearance is lacking now and necessary in the future. Importantly, we acknowledge that the sample size in this study is small, and the lack of inclusion of obese patients (as a consequence of which we have provided dosing recommendations for patients with characteristics different from those used in the modeling process) means that studies of critically ill obese patients are necessary in the future.
We also assessed the attainment of three AUC0–24/MIC targets that have been derived from different types of infections (≥17.9 for cSSSI, ≥6.96 for cIAI, and ≥4.5 for pneumonia) according to MIC distributions from EUCAST. The use of the third target value (≥4.5) in this analysis was derived from a phase III clinical trial evaluating PK/PD relationships for efficacy in pneumonia. In that analysis, the final multivariable logistic regression model used the ratio of the free-drug area under the concentration-time curve from 0 to 24 h (fAUC0–24) to the MIC (fAUC0–24/MIC). The fAUC0–24/MIC breakpoint for efficacy was >0.9, but fAUC0–24 was calculated as AUC0–24 × fu, where fu is the fraction of unbound tigecycline, which was assumed to be 0.2 (9). However, tigecycline shows atypical nonlinear plasma protein-binding behavior, so assuming a fixed plasma protein-binding value may be problematic, when this value may range from 71% to 89% (13). Therefore, we used total AUC0–24/MIC targets in this study, although we concede that it would have been preferable to measure unbound concentrations.
Concerns about increased mortality associated with tigecycline have led to the addition of a black box warning to the label by the FDA. The increased risk of death is believed to be due to therapeutic failure. However, some researchers have proposed that these therapeutic failures, as well as the rising resistance rates of pathogenic strains, may be due to tigecycline underdosing (14). A randomized, controlled phase II trial compared the clinical efficacies of two high doses of tigecycline (150 mg followed by 75 mg every 12 h and 200 mg followed by 100 mg every 12 h) versus imipenem-cilastatin (1 g every 8 h) for the treatment of HAP (4). The results revealed no adverse effects in the high-dose tigecycline patients but a significantly increased clinical cure rate in the 100-mg maintenance dose group (17/20 [85.0%]) relative to those for the other two groups (16/23 [69.6%] and 18/24 [75.0%]; P < 0.05). Another retrospective study of 54 critically ill patients also described the efficacy and safety of a high-dose compared with a standard-dose regimen of tigecycline (100 mg every 12 h versus 50 mg every 12 h) in patients with severe infections. Ultimately, all of the patients tolerated the high doses of tigecycline well, and no adverse reactions were observed relative to the standard dosing group. The clinical cure rate was significantly higher among patients with ventilator-associated pneumonia on high doses of tigecycline than in the group on the standard dose (57.5% versus 33.3%; P = 0.05) (5). The simulation results of this study also support the view that in addition to MRSA, other bacterial infections require higher doses, which appear to be safe, based on existing literature.
Study limitations.
Our study had several limitations. First, the small sample size may have meant that all clinically relevant covariates could not be sufficiently described. The likely underestimation of the overall interindividual variability needs to be considered based on the small population. Unfortunately, there were no obese subjects with PK data available for inclusion in our analysis, and further study on the effect of obesity on tigecycline PK in the critically ill is still warranted, to further characterize the effect of BMI on clearance. The latter point is important when one considers that the associated dosing regimens have been extrapolated from the data used to build the final model. Second, the sample size was not sufficient to measure the impacts of different drug exposures on clinical outcomes. Finally, we measured concentrations in plasma, which may not necessarily reflect concentrations at the target site, although the PK/PD targets we used have been demonstrated to be appropriate in previous studies.
Conclusions.
In summary, this study described the first population pharmacokinetics of tigecycline in critically ill patients. Increases in tigecycline doses appear to be necessary for Gram-negative pathogens in these patients. Increasing BMI is associated with increasing CL of tigecycline and necessitates higher doses. Further clinical studies of tigecycline are still warranted to determine the effect of optimized dosing on clinical outcome, and these proposed dosing regimens need to be validated by a larger PK study, because we included simulations of BMI that exceeded the range used in the model-building process. However, in the absence of any data, ours is useful as an initial guide to assist clinicians.
MATERIALS AND METHODS
Setting.
This was a prospective study performed in a tertiary intensive care unit (ICU). The study was conducted according to the Declaration of Helsinki and was approved by institutional review boards of the First Affiliated Hospital of Xi'an Jiaotong University. Written informed consent to participate was obtained from all patients after they had been given detailed information about the study. If a subject was unable to provide legally effective consent, written informed consent was obtained from a close relative.
Study population and protocol.
The criteria for patient inclusion were as follows: critically ill hospitalized males or nonpregnant females aged ≥18 years with severe infections which the treating clinician was treating with tigecycline. All patients enrolled in the study were given an intermittent intravenous 100-mg loading dose of tigecycline, followed by 50 mg every 12 h for at least 5 days. Venous blood samples (1 ml) were collected before the seventh dose of tigecycline (time point 0; presumed pharmacokinetic steady state) and at 0.5, 1, 2, 3, 4, 6, 8, and 12 h after that dose. All antimicrobial prescription and routine examination data are available from the hospital electronic information systems. All the patient body weights were recorded on admission to the ICU; they were obtained from recent health records, parental knowledge, or direct measurement. Safety and adverse events were determined through the biochemical abnormalities documented in medical records.
Blood sample handling, storage, and assay.
The blood samples were collected into Vacutainer tubes (Becton Dickinson, Franklin Lakes, NJ, USA) and were immediately centrifuged at 3,500 rpm for 5 min; the resultant supernatants were stored frozen at −80°C until analysis. The serum tigecycline concentrations of blood samples were measured by an established liquid chromatography–tandem mass spectrometry method (15). The assay was linear over the concentration range of 0.005 to 2 mg/liter. The mean recovery ranged from 94.3% to 105.6%, and the matrix effect ranged from 92.1% to 97.6%.
Population pharmacokinetic modeling.
One- and two-compartment models were fitted with the nonparametric adaptive grid (NPAG) algorithm by the Pmetrics package for R (Laboratory of Applied Pharmacokinetics and Bioinformatics, Children's Hospital Los Angeles, University of Southern California, Los Angeles, CA, USA) (16). Biologically plausible demographic and clinical characteristics were tested as covariates for model inclusion. Data, including age, sex, height, total body weight, body mass index (BMI), body surface area, serum creatinine concentration, estimated clearance of creatinine (CLcr), albumin concentrations, and Acute Physiology and Chronic Health Evaluation II (APACHE II) scores (17), were tested by plotting with the pharmacokinetic parameter estimates to assess correlation. Covariates were included in the model if they significantly improved the log likelihood (P < 0.05) and/or improved the goodness-of-fit plots.
Model diagnostics.
The goodness of fit was assessed by visual inspection of the population observed-predicted and individual observed-predicted concentration scatter plots, coefficient of determination of linear regression, and log-likelihood values from each run. Predictive performance was evaluated based on mean prediction error (bias) and the mean bias-adjusted squared prediction error (imprecision) of the population and individual prediction models in the central compartment.
The suitability of the final covariate model was evaluated by a visual predictive check using 1,000 simulations.
Probability of target attainment.
Monte Carlo simulations (n = 1,000) were employed using Pmetrics to determine the probability of target attainment (PTA) for AUC0–24/MIC targets of 4.5, 6.96, and 17.9 for various MICs (0.25 to 8 mg/liter) in patients with normal weight (BMI, 18.5 to 29.9 kg/m2) or obesity (BMI, 30 kg/m2).
Fixed intravenous tigecycline loading doses of 100 mg, 200 mg, 300 mg, and 400 mg (0.5-h infusion) were simulated from 0 to 12 h. Simulated AUC0–24/MIC values were compared with PK/PD targets of 4.5, 6.96, and 17.9. Maintenance doses of 50 mg/12 h, 100 mg/12 h, 150 mg/12 h, and 200 mg/12 h from 120 to 144 h were also simulated for the three PK/PD targets.
Fractional target attainment calculation.
MIC data for Acinetobacter baumannii (n = 399), Enterobacter cloacae (n = 6,365), Escherichia coli (n = 4,789), Klebsiella pneumoniae (n = 12,530), and methicillin-resistant Staphylococcus aureus (MRSA) (n = 2,426) strains from the European Committee on Antimicrobial Susceptibility Testing (EUCAST) database were used to determine fractional target attainment (http://www.eucast.org; last accessed, 31 October 2016). Fractional target attainment was defined as the expected population PTA for tigecycline against a MIC distribution. A priori, a dosing regimen was considered successful if the fractional target attainment was >90%.
ACKNOWLEDGMENTS
We acknowledge the support provided by the China Scholarship Council to this work. This work was supported by the National Natural Science Foundation of China (grants 81473177 and 81672954) and the Natural Science Foundation of Shaanxi Province (grant 2016JM8015). Jason Roberts would like to recognize funding from the Australian National Health and Medical Research Council for a Centre of Research Excellence grant (APP1099452) and a Practitioner Fellowship (APP1117065).
On behalf of all authors, the corresponding authors state that there is no competing interest.
REFERENCES
- 1.Pankey GA. 2005. Tigecycline. J Antimicrob Chemother 56:470–480. doi: 10.1093/jac/dki248. [DOI] [PubMed] [Google Scholar]
- 2.Dixit D, Madduri RP, Sharma R. 2014. The role of tigecycline in the treatment of infections in light of the new black box warning. Expert Rev Anti Infect Ther 12:397–400. doi: 10.1586/14787210.2014.894882. [DOI] [PubMed] [Google Scholar]
- 3.Freire AT, Melnyk V, Kim MJ, Datsenko O, Dzyublik O, Glumcher F, Chuang Y-C, Maroko RT, Dukart G, Cooper CA. 2010. Comparison of tigecycline with imipenem/cilastatin for the treatment of hospital-acquired pneumonia. Diagn Microbiol Infect Dis 68:140–151. doi: 10.1016/j.diagmicrobio.2010.05.012. [DOI] [PubMed] [Google Scholar]
- 4.Ramirez J, Dartois N, Gandjini H, Yan JL, Korth-Bradley J, McGovern PC. 2013. Randomized phase 2 trial to evaluate the clinical efficacy of two high-dosage tigecycline regimens versus imipenem-cilastatin for treatment of hospital-acquired pneumonia. Antimicrob Agents Chemother 57:1756–1762. doi: 10.1128/AAC.01232-12. [DOI] [PMC free article] [PubMed] [Google Scholar]
- 5.De Pascale G, Montini L, Pennisi M, Bernini V, Maviglia R, Bello G, Spanu T, Tumbarello M, Antonelli M. 2014. High dose tigecycline in critically ill patients with severe infections due to multidrug-resistant bacteria. Crit Care 18:R90. doi: 10.1186/cc13858. [DOI] [PMC free article] [PubMed] [Google Scholar]
- 6.Koomanachai P, Kim A, Nicolau DP. 2009. Pharmacodynamic evaluation of tigecycline against Acinetobacter baumannii in a murine pneumonia model. J Antimicrob Chemother 63:982–987. doi: 10.1093/jac/dkp056. [DOI] [PubMed] [Google Scholar]
- 7.Passarell JA, Meagher AK, Liolios K, Cirincione BB, Van Wart SA, Babinchak T, Ellis-Grosse EJ, Ambrose PG. 2008. Exposure-response analyses of tigecycline efficacy in patients with complicated intra-abdominal infections. Antimicrob Agents Chemother 52:204–210. doi: 10.1128/AAC.00813-07. [DOI] [PMC free article] [PubMed] [Google Scholar]
- 8.Meagher AK, Passarell JA, Cirincione BB, Van Wart SA, Liolios K, Babinchak T, Ellis-Grosse EJ, Ambrose PG. 2007. Exposure-response analyses of tigecycline efficacy in patients with complicated skin and skin-structure infections. Antimicrob Agents Chemother 51:1939–1945. doi: 10.1128/AAC.01084-06. [DOI] [PMC free article] [PubMed] [Google Scholar]
- 9.Bhavnani SM, Rubino CM, Hammel JP, Forrest A, Dartois N, Cooper CA, Korth-Bradley J, Ambrose PG. 2012. Pharmacological and patient-specific response determinants in patients with hospital-acquired pneumonia treated with tigecycline. Antimicrob Agents Chemother 56:1065–1072. doi: 10.1128/AAC.01615-10. [DOI] [PMC free article] [PubMed] [Google Scholar]
- 10.Van Wart SA, Owen JS, Ludwig EA, Meagher AK, Korth-Bradley JM, Cirincione BB. 2006. Population pharmacokinetics of tigecycline in patients with complicated intra-abdominal or skin and skin structure infections. Antimicrob Agents Chemother 50:3701–3707. doi: 10.1128/AAC.01636-05. [DOI] [PMC free article] [PubMed] [Google Scholar]
- 11.Rubino CM, Forrest A, Bhavnani SM, Dukart G, Cooper A, Korth-Bradley J, Ambrose PG. 2010. Tigecycline population pharmacokinetics in patients with community- or hospital-acquired pneumonia. Antimicrob Agents Chemother 54:5180–5186. doi: 10.1128/AAC.01414-09. [DOI] [PMC free article] [PubMed] [Google Scholar]
- 12.Pai MP. 2014. Serum and urine pharmacokinetics of tigecycline in obese class III and normal weight adults. J Antimicrob Chemother 69:190–199. doi: 10.1093/jac/dkt299. [DOI] [PubMed] [Google Scholar]
- 13.Barbour A, Schmidt S, Ma B, Schiefelbein L, Rand KH, Burkhardt O, Derendorf H. 2009. Clinical pharmacokinetics and pharmacodynamics of tigecycline. Clin Pharmacokinet 48:575–584. doi: 10.2165/11317100-000000000-00000. [DOI] [PubMed] [Google Scholar]
- 14.Burkhardt O, Rauch K, Kaever V, Hadem J, Kielstein JT, Welte T. 2009. Tigecycline possibly underdosed for the treatment of pneumonia: a pharmacokinetic viewpoint. Int J Antimicrob Agents 34:101–102. doi: 10.1016/j.ijantimicag.2009.01.015. [DOI] [PubMed] [Google Scholar]
- 15.Xie J, Wang T, Wang X, Cheng X, Dong H, Wang Y, Zheng X, Zhou L, Xing J, Dong Y. 2014. Quantitative analysis and pharmacokinetics study of tigecycline in human serum using a validated sensitive liquid chromatography with tandem mass spectrometry method. J Sep Sci 37:1396–1403. doi: 10.1002/jssc.201400152. [DOI] [PubMed] [Google Scholar]
- 16.Tatarinova T, Neely M, Bartroff J, van Guilder M, Yamada W, Bayard D, Jelliffe R, Leary R, Chubatiuk A, Schumitzky A. 2013. Two general methods for population pharmacokinetic modeling: non-parametric adaptive grid and non-parametric Bayesian. J Pharmacokinet Pharmacodyn 40:189–199. doi: 10.1007/s10928-013-9302-8. [DOI] [PMC free article] [PubMed] [Google Scholar]
- 17.Knaus WA, Zimmerman JE, Wagner DP, Draper EA, Lawrence DE. 1981. APACHE—acute physiology and chronic health evaluation: a physiologically based classification system. Crit Care Med 9:591–597. doi: 10.1097/00003246-198108000-00008. [DOI] [PubMed] [Google Scholar]