

Abstract
Introduction
Relationships between apolipoprotein L1 gene (APOL1) renal-risk variants (RRVs) and cardiovascular disease (CVD) remain controversial. To clarify associations between APOL1 and CVD, a total of 2568 African American Systolic Blood Pressure Intervention Trial (SPRINT) participants were assessed for the incidence of CVD events (primary composite including nonfatal myocardial infarction, acute coronary syndrome not resulting in myocardial infarction, nonfatal stroke, nonfatal acute decompensated heart failure, and CVD death), renal outcomes, and all-cause mortality.
Methods
Cox proportional hazards regression models were used, adjusting for age, sex, African ancestry proportion, and treatment group (systolic blood pressure target of <120 mm Hg vs. <140 mm Hg).
Results
Of the participants, 14% had 2 APOL1 RRVs; these individuals also had lower baseline estimated GFR and higher levels of albuminuria and BMI. After a median follow-up of 39 months, no significant association was observed between APOL1 RRVs and the primary composite CVD outcome, any of its components, or all-cause mortality (recessive or additive genetic models). APOL1 demonstrated a trend toward association with sustained 30% reduction in estimated GFR to <60 ml/min/1.73 m2 in those with normal kidney function at baseline (hazard ratio 1.64; 95% confidence interval = 0.85−2.93; P = 0.114, recessive model).
Discussion
APOL1 RRVs were not associated with incident CVD in high-risk hypertensive, nondiabetic African American participants in SPRINT.
Keywords: African Americans, albuminuria, APOL1, cardiovascular disease, chronic kidney disease, SPRINT
Apolipoprotein L1 gene (APOL1) G1 and G2 renal-risk variants (RRVs) are powerfully associated with a spectrum of progressive nondiabetic forms of nephropathy in individuals who possess recent African ancestry.1, 2 These primary kidney diseases reside in the focal segmental glomerulosclerosis spectrum and contribute to approximately 40% of end-stage kidney disease in African Americans.3, 4 APOL1 is expressed in podocytes, glomerular endothelial cells, and renal tubular cells.5, 6 Several lines of evidence support intrinsic kidney APOL1 gene expression and not circulating APOL1 protein as underlying the development of kidney disease.7, 8, 9, 10, 11 APOL1 expression is increased by interferons and other inflammatory mediators12; these factors may be the second hits required to cause kidney disease.13 Postulated mechanisms whereby APOL1 may cause kidney disease include APOL1 RRV proteins damaging cell membranes with loss of intracellular potassium and secondary activation of stress-activated protein kinases and mitochondrial dysfunction even prior to intracellular potassium depletion.14, 15
In addition to the kidney, APOL1 is expressed in the vasculature and its RRVs associate with high-density lipoprotein cholesterol particle concentrations.5, 6, 16 Therefore, APOL1 could be involved in the susceptibility to (or protection from) cardiovascular disease (CVD). Three studies have detected increased risk for CVD in individuals with 2 APOL1 RRVs; however, paradoxically lower levels of subclinical CVD (based on coronary artery calcium) were detected, and these results could have been confounded by APOL1 association with chronic kidney disease (CKD), a known contributor to CVD.17, 18 In contrast, several studies have reported protective effects of APOL1 renal-risk variants on subclinical atherosclerosis, cerebrovascular disease, and all-cause mortality, and other studies saw no relationship between APOL1 with CVD or survival.19, 20, 21, 22, 23, 24
Potential therapeutic targets for preventing nephropathy include the APOL1 gene and its protein products. Therefore, it is critical to determine whether APOL1 RRVs protect from CVD, because inhibiting this gene to prevent kidney disease could accelerate atherosclerosis. The present analyses assessed relationships between APOL1 RRVs with incident CVD outcomes, incident renal outcomes, and mortality in African Americans participating in the Systolic Blood Pressure Intervention Trial (SPRINT).
Materials and Methods
Participants and Genotyping
SPRINT is a multicenter, randomized clinical trial of blood pressure control in individuals ≥ 50 years old at increased risk for CVD.25 The high risk of CVD in SPRINT was based on Framingham Risk Score, prior CVD events, age ≥ 75 years, or CKD. Details of the intervention and outcomes have previously been reported.26 Exclusion criteria included participants taking medications for diabetes mellitus at any time in the 12 months prior to baseline, urine albumin > 600 mg/d or urine protein levels > 1000 mg/d, or an eGFR < 25 ml/min/1.73 m2. Participants were randomized to systolic blood pressure control targets of <140 mm Hg (standard treatment) versus <120 mm Hg (intensive treatment).
Outcomes
The primary study outcome was a composite of CVD events; all were adjudicated, and they included myocardial infarction (MI), non-MI acute coronary syndrome, stroke, heart failure, and CVD death. A predefined participant subgroup included CKD, defined as eGFR < 60 ml/min per 1.73 m2 based on the 4-variable Modification of Diet in Renal Disease (MDRD) equation. Secondary outcomes in the CKD subgroup included the rate of development of ESRD and a 50% decline from baseline eGFR. Secondary outcomes in the non-CKD subgroup included the rate of ESRD and a 30% decrease from baseline eGFR with an end value < 60 ml/min per 1.73 m2. It should be noted that, because of when SPRINT was designed, the CKD subgroup and renal outcomes definitions were based on the MDRD eGFR equation. However, in the present analysis, all eGFRs are based on the Chronic Kidney Disease Epidemiology Collaboration (CKD-EPI) equation.27 Spot urine samples were collected for albumin and creatinine concentration to compute the urine albumin:creatinine ratio (UACR) at specified study visits. Incident albuminuria was defined as a doubling of UACR from < 10 mg/g to ≥ 10 mg/g, confirmed by a subsequent laboratory test ≥ 90 days later.
Participants were recruited from approximately 100 clinics in the United States, and each had institutional review board approval. Written informed consent was obtained from all participants. The present analyses were limited to self-reported African American participants; of all 2802 African American SPRINT participants, 2568 (91.6%) consented to participation in genetics studies. Genotyping methods for APOL1, ancestry informative markers, and results of quality control have been reported.20
Statistical Analyses
The incidence of CVD events and all-cause mortality was estimated using standard Kaplan−Meier techniques, with log-rank tests to compare the incidence of these events by APOL1 genotype within each treatment group. The time to first occurrence of CVD outcomes, all-cause mortality, and renal outcomes were compared by APOL1 risk genotype using Cox proportional hazards regression models. Follow-up time was censored as of the National Heart, Lung, and Blood Institute Director decision to stop the SPRINT intervention on 20 August 2015. We considered both an additive (0, 1, or 2 APOL1 RRVs) and recessive (2 APOL1 RRVs vs. 0 or 1) coding of APOL1 risk genotype. All models included age, sex, proportion of African ancestry, and treatment group as covariates. Baseline eGFR and log(UACR) were also included as covariates for the CVD outcomes and all-cause mortality. We used multiple imputation (100 datasets) to address the small amount of missing data with baseline eGFR (n = 7, 0.3%) and UACR (n = 91, 3.5%). The imputation models included age, sex, smoking status, history of cardiovascular disease, systolic and diastolic blood pressure, use of angiotensin-converting enzyme inhibitors, use of angiotensin receptor blockers, body mass index, total cholesterol, high-densisty lipoprotein cholesterol, and log triglycerides as predictors. In addition, eGFR was included as a predictor in the imputation model for log(UACR).
The power to detect an association between being a carrier of 2 APOL1 RRVs (recessive model) and incident events was estimated a priori assuming an α level of 0.05, 3 years of follow-up, and a loss to follow-up rate of 2% per year.28 Assuming overall annual incidence rates of 0.5%, 1.0%, 1.5%, and 2.0% per year, we estimated that we would have at least 80% power provided that the hazard ratio associated with carrying 2 APOL1 RRVs was at least 3.3, 2.3, 2.0, and 1.9, respectively.
Linear mixed-effect models were used to compare longitudinal trajectories for eGFR by APOL1 risk genotype and treatment group, assuming an unstructured covariance matrix. For each combination of APOL1 genotype and treatment group, we assumed a 2-slope linear model with a change-point at ≤6 months or >6 months postrandomization. The change-point in the slope of eGFR was designed to reflect mean trajectories in the acute phase of the intervention that were potentially due to hemodynamic effects (≤6 mo postrandomization) versus trajectories in the chronic phase (>6 mo postrandomization). Slopes for eGFR were compared using Wald tests based on the estimated model coefficients and SEs. Baseline eGFR, age, sex, history of CVD, and proportion of African ancestry were included in the model as covariates. Finally, because small (but statistically significant) changes in mean eGFR were observed in SPRINT when comparing fasting to nonfasting study visits, we included indicators denoting fasting visits as covariates, assuming separate effects for each of the 4 combinations of APOL1 risk genotype and treatment group. All analyses were performed using SAS v9.4 (SAS Institute, Inc., Cary, NC) or the R Statistical Computing Environment (R Foundation for Statistical Computing; Vienna, Austria).
Results
A total of 2568 African American SPRINT participants were included; 360 (14.0%) had 2 APOL1 RRVs and 2208 (86%) had <2 RRVs. Table 1 displays baseline demographic and laboratory characteristics of individuals based on APOL1 high-risk genotype. Participants with 2 APOL1 RRVs had significantly higher body mass index, higher UACR, and lower eGFR but were otherwise similar to those with <2 APOL1 RRVs. A significant (cross-sectional) association between APOL1 RRVs with baseline UACR, serum creatinine concentration, and eGFR in SPRINT have previously been reported (recessive model).20
Table 1.
Baseline demographic and laboratory data for African American participants with APOL1 genotyping in Systolic Blood Pressure Intervention Trial (SPRINT)
| Variable | APOL1 G1+G2 2 risk variants n = 360 |
APOL1 G1+G2 0/1 risk variants n = 2208 |
P value |
|---|---|---|---|
| Randomized to intensive treatment | 190 (52.8) | 1,074 (48.6) | 0.162 |
| Age (yr), mean ± SD | 63.5 ± 9.0 | 64.4 ± 9.0 | 0.053 |
| Female sex | 169 (46.9) | 997 (45.2) | 0.565 |
| Education | 0.105 | ||
| Less than high school | 66 (18.3) | 320 (14.5) | |
| High school | 228 (63.3) | 1,372 (62.1) | |
| College graduate | 46 (12.8) | 332 (15.0) | |
| Graduate degree | 20 (5.6) | 183 (8.3) | |
| Missing | 0 (0.0) | 1 (0.0) | |
| Alcohol consumption | 0.663 | ||
| Nondrinker | 200 (55.6) | 1,203 (54.5) | |
| Light drinker | 72 (20.0) | 415 (18.8) | |
| Moderate drinker | 42 (11.7) | 308 (13.9) | |
| Heavy drinker | 22 (6.1) | 156 (7.1) | |
| Missing | 24 (6.7) | 126 (5.7) | |
| Smoking status | 0.167 | ||
| Never smoker | 169 (46.9) | 950 (43.1) | |
| Former smoker | 105 (29.2) | 754 (34.2) | |
| Current smoker | 86 (23.9) | 501 (22.7) | |
| Pack-yr in smokers, mean ± SD | 16.1 ± 18.9 | 16.2 ± 17.5 | 0.214 |
| Body mass index (kg/m2), mean ± SD | 31.5 ± 6.7 | 30.8 ± 6.3 | 0.044 |
| History of CVD | 60 (16.7) | 359 (16.3) | 0.907 |
| Systolic BP (mm Hg), mean ± SD | 139.4 ± 15.8 | 139.8 ± 16.4 | 0.653 |
| Diastolic BP (mm Hg), mean ± SD | 82.3 ± 12.6 | 81.1 ± 12.4 | 0.081 |
| eGFR (ml/min/1.73 m2), mean ± SD | 73.3 ± 24.6 | 76.8 ± 22.6 | 0.008 |
| eGFR < 60 ml/min/1.73 m2 | 102 (28.4) | 524 (23.8) | 0.069 |
| UACR (mg/g), median (IQR) | 12.2 (6.5−32.8) | 8.7 (5.0−21.5) | <0.001 |
| Albuminuria | <0.001 | ||
| UACR ≤ 30 mg/g | 255 (72.9) | 1,707 (80.3) | |
| UACR >30 to ≤ 300 mg/g | 71 (20.3) | 354 (16.6) | |
| UACR > 300 mg/g | 24 (6.9) | 66 (3.1) | |
| Fasting glucose (mg/dl), mean ± SD | 96.8 ± 13.9 | 97.9 ± 16.0 | 0.213 |
| Total cholesterol (mg/dl), mean ± SD | 195.8 ± 42.3 | 196.2 ± 40.6 | 0.837 |
| HDL cholesterol (mg/dl), mean ± SD | 54.4 ± 13.8 | 55.3 ± 15.2 | 0.280 |
| No. of antihypertensive medications, mean ± SD | 2.1 ± 1.1 | 2.0 ± 1.0 | 0.062 |
| ACEi/ARB use | 202 (56.1) | 1,151 (52.1) | 0.178 |
| Statin use | 123 (34.3) | 744 (33.9) | 0.944 |
ACEi, angiotensin-converting enzyme inhibitor; ARB, angiotensin receptor blocker; BP, blood pressure; CVD, cardiovascular disease; eGFR, estimated glomerular filtration rate, based on Chronic Kidney Disease Epidemiology Collaboration (CKD-EPI) equation; HDL, high-density lipoprotein; IQR, interquartile range; UACR, urine albumin:creatinine ratio.
Data in parentheses reflect %, unless otherwise noted. Other rows display mean ± SD or median (IQR).
Kaplan−Meier curves by treatment group and APOL1 risk genotype for the primary composite CVD outcome (nonfatal MI, acute coronary syndrome not resulting in MI, stroke, acute decompensated heart failure, and death from CVD) and the primary CVD composite plus all-cause mortality are shown in Figure 1 and Figure 2, respectively. Within each treatment group, there were no significant differences by APOL1 genotype for either outcome (all P > 0.15). Table 2 displays hazard ratios (HRs) for the composite CVD outcome, its component events, all-cause mortality, and renal outcomes. After a median follow-up of 39.0 months (interquartile range = 33.8−45.5 mo), there were 22 adjudicated CVD events in the 360 participants with 2 APOL1 RRVs versus 106 in the 2208 participants with < 2 APOL1 RRVs (HR = 1.20, 95% confidence interval [CI] = 0.76−1.92, P = 0.435 recessive model; HR = 1.10, 95% CI = 0.86−1.41, P = 0.458 additive model). The HR for all-cause mortality, MI, and all CVD events comprising the primary SPRINT CVD outcome did not differ based on APOL1 RRVs in either the additive or recessive model.
Figure 1.

Kaplan−Meier curves for the primary cardiovascular disease (CVD) outcome in Systolic Blood Pressure Intervention Trial (SPRINT) for African American participants by treatment group and APOL1 risk genotype.
Figure 2.

Kaplan−Meier curves for the primary cardiovascular disease (CVD) outcome plus all-cause mortality in Systolic Blood Pressure Intervention Trial (SPRINT) for African American participants by treatment group and APOL1 risk genotype.
Table 2.
Incidence of CVD, renal, and mortality outcomes by APOL1 renal-risk genotype in African American SPRINT participants
|
APOL1 G1+G2 = 2 |
APOL1 G1+G2 = 0/1 |
Recessive model |
Additive model |
|||||
|---|---|---|---|---|---|---|---|---|
| No. with events n = 360 |
% With events per yr (95% CI) |
No. with events n = 2208 |
% With events per yr (95% CI) |
HR (95% CI) | P value | HR (95% CI) | P value | |
| All participants | ||||||||
| CVD primary outcomea | 22 | 1.97 (1.30, 2.99) | 106 | 1.53 (1.26, 1.85) | 1.20 (0.76, 1.92) | 0.435 | 1.10 (0.86, 1.41) | 0.458 |
| MI | 6 | 0.53 (0.24, 1.18) | 39 | 0.56 (0.41, 0.76) | 1.02 (0.43, 2.45) | 0.961 | 1.12 (0.73, 1.72) | 0.607 |
| ACS not resulting in MI | 2 | 0.18 (0.04, 0.70) | 12 | 0.17 (0.10, 0.30) | 1.04 (0.23, 4.79) | 0.958 | 1.02 (0.47, 2.20) | 0.957 |
| Stroke | 7 | 0.62 (0.30, 1.30) | 23 | 0.33 (0.22, 0.49) | 1.66 (0.70, 3.92) | 0.251 | 1.26 (0.77, 2.08) | 0.359 |
| Heart failure | 7 | 0.62 (0.30, 1.30) | 39 | 0.55 (0.41, 0.76) | 0.98 (0.43, 2.23) | 0.970 | 0.83 (0.54, 1.28) | 0.403 |
| CVD death | 4 | 0.35 (0.13, 0.94) | 22 | 0.31 (0.20, 0.47) | 0.94 (0.32, 2.75) | 0.905 | 1.27 (0.74, 2.16) | 0.384 |
| Nonfatal MI | 6 | 0.53 (0.24, 1.18) | 38 | 0.54 (0.39, 0.74) | 1.07 (0.45, 2.57) | 0.879 | 1.12 (0.72, 1.72) | 0.618 |
| Nonfatal stroke | 7 | 0.62 (0.30, 1.30) | 22 | 0.31 (0.21, 0.48) | 1.76 (0.74, 4.18) | 0.202 | 1.26 (0.76, 2.09) | 0.379 |
| Nonfatal heart failure | 7 | 0.62 (0.30, 1.30) | 37 | 0.53 (0.38, 0.73) | 1.05 (0.46, 2.39) | 0.905 | 0.89 (0.58, 1.38) | 0.609 |
| All-cause mortality | 16 | 1.40 (0.86, 2.29) | 79 | 1.11 (0.89, 1.39) | 1.19 (0.69, 2.05) | 0.530 | 1.10 (0.82, 1.46) | 0.529 |
| Primary + all-cause mortality | 32 | 2.85 (2.02, 4.04) | 145 | 2.09 (1.77, 2.46) | 1.28 (0.87, 1.89) | 0.212 | 1.10 (0.89, 1.36) | 0.361 |
| eGFR< 60 ml/min/1.73 m2 | ||||||||
| Primary CKD outcomeb | 1 / 102 | 0.29 (0.04, 2.09) | 10 / 524 | 0.59 (0.32, 1.09) | 0.48 (0.03, 2.51) | 0.482 | 0.56 (0.19, 1.33) | 0.228 |
| Incident albuminuriac | 0 / 21 | — | 23 / 201 | 3.87 (2.57, 5.83) | — | — | 0.70 (0.35, 1.34) | 0.301 |
| eGFR ≥ 60 ml/min/1.73 m2 | ||||||||
| Secondary CKD outcomed | 13 / 257 | 1.66 (0.97, 2.86) | 53 / 1,678 | 0.99 (0.76, 1.29) | 1.64 (0.85, 2.93) | 0.114 | 1.06 (0.73, 1.50) | 0.766 |
| Incident albuminuriac | 10 / 128 | 2.73 (1.47, 5.07) | 61 / 961 | 2.08 (1.62, 2.67) | 1.32 (0.63, 2.50) | 0.417 | 1.41 (1.00, 1.99) | 0.051 |
ACS, acute coronary syndrome; CKD, chronic kidney disease; CI, confidence interval; CVD, cardiovascular disease; eGFR, estimated glomerular filtration rate; HR, hazard ratio; MI, myocardial infarction; SPRINT = Systolic Blood Pressure Intervention Trial.
HRs for CKD and albuminuria outcomes adjusted for age, sex, African admixture, and treatment group. HRs for CVD outcomes and all-cause mortality additionally adjusted for eGFR and log (urine albumin:creatinine ratio).
Includes nonfatal MI, ACS not resulting in MI, nonfatal stroke, nonfatal acute decompensated heart failure, and cardiovascular disease death.
Includes a 50% reduction in eGFR (measured twice ≥90 days apart), dialysis, or kidney transplantation.
Applies only to participants with urine albumin:creatinine ratio <10 mg/g at baseline, and required a doubling from < 10 mg/g to ≥ 10 mg/g (measured twice ≥90 days apart).
Includes a 30% reduction in eGFR (measured twice ≥90 days apart) to an eGFR < 60 ml/min/1.73 m2, dialysis, or kidney transplantation.
In contrast to significant relationships between APOL1 RRVs and baseline (prevalent) kidney disease,20 no significant APOL1 associations were seen with the prespecified renal outcomes of: (i) 50% reduction in eGFR (measured twice ≥90 days apart), initiation of dialysis, or kidney transplantation; or (ii) proteinuria assessed as doubling of UACR from < 10 to ≥ 10 mg/g (measured twice ≥90 days apart in participants with CKD and baseline UACR < 10 mg/g) in the CKD subgroup (those with an initial eGFR < 60 ml/min per 1.73 m2). In the subgroup without CKD at baseline, a nonsignificant trend was observed for the prespecified end-point of a 30% reduction in eGFR (measured twice ≥90 days apart) to an eGFR < 60 ml/min per 1.73 m2, initiation of dialysis, or kidney transplantation (HR = 1.64, 95% CI = 0.85−2.93, P = 0.114 recessive model), but not for incident proteinuria.
Table 3 displays the slopes for eGFR decline using linear mixed models over the course of follow-up in African American SPRINT participants by treatment group and APOL1 risk genotypes. Graphical depictions of eGFR group means over time and time estimated slopes from the mixed model analyses are presented in Supplementary Figure S1 (entire cohort), Supplementary Figure S2 (eGFR < 60 ml/min/1.73 m2 at randomization), and Supplementary Figure S3 (eGFR ≥ 60 ml/min per 1.73 m2 at randomization). Whether assessing eGFR slope during the initial 6 months following randomization or after 6 months, APOL1 risk genotypes did not significantly affect the rate of decline in kidney function in the standard or intensive treatment groups.
Table 3.
Slopes from linear mixed model for estimated glomerular filtration rate (eGFR) over the course of follow-up in African American SPRINT participants by treatment group and APOL1 risk genotype
|
Group |
Time perioda | Treatment group |
APOL1 G1+G2=2 Slope (95% CI)b |
APOL1 G1+G2=0/1 Slope (95% CI)b |
APOL1 G1+G2: 2 − 0/1 Difference (95% CI) |
P value |
|---|---|---|---|---|---|---|
| All | Acute (≤6 mo) | Standard | –0.31 (–2.87, 2.26) | 0.80 (–0.46, 2.07) | –1.11 (–3.69, 1.47) | 0.398 |
| All | Acute (≤6 mo) | Intensive | –4.18 (–6.57, –1.79) | –3.53 (–4.82, –2.25) | –0.65 (–3.06, 1.77) | 0.600 |
| All | Chronic (>6 mo) | Standard | –1.13 (–2.34, 0.08) | –0.97 (–1.42, –0.52) | –0.16 (–1.45, 1.12) | 0.806 |
| All | Chronic (>6 mo) | Intensive | –1.36 (–2.46, –0.26) | –1.01 (–1.47, –0.54) | –0.35 (–1.54, 0.84) | 0.564 |
| CKD (eGFR < 60 ml/min/1.73 m2) | Acute (≤6 mo) | Standard | 0.85 (–2.22, 3.91) | 2.07 (0.48, 3.67) | –1.23 (–4.46, 2.00) | 0.457 |
| CKD (eGFR < 60 ml/min/1.73 m2) | Acute (≤6 mo) | Intensive | 0.06 (–2.93, 3.05) | –1.97 (–3.49, –0.45) | 2.03 (–1.10, 5.16) | 0.204 |
| CKD (eGFR < 60 ml/min/1.73 m2) | Chronic (>6 mo) | Standard | –1.41 (–2.50, –0.32) | –0.60 (–1.13, –0.06) | –0.81 (–2.03, 0.40) | 0.190 |
| CKD (eGFR < 60 ml/min/1.73 m2) | Chronic (>6 mo) | Intensive | –0.82 (–1.91, 0.27) | –0.75 (–1.24, –0.26) | –0.07 (–1.26, 1.12) | 0.908 |
| Non-CKD (eGFR ≥ 60 ml/min/1.73 m2) | Acute (≤6 mo) | Standard | –0.18 (–3.29, 2.93) | 0.48 (–0.98, 1.94) | –0.66 (–3.77, 2.45) | 0.679 |
| Non-CKD (eGFR ≥ 60 ml/min/1.73 m2) | Acute (≤6 mo) | Intensive | –5.44 (–8.27, –2.60) | –3.99 (–5.49, –2.48) | –1.45 (–4.31, 1.42) | 0.322 |
| Non-CKD (eGFR ≥ 60 ml/min/1.73 m2) | Chronic (>6 mo) | Standard | –1.17 (–2.71, 0.36) | –1.20 (–1.72, –0.69) | 0.03 (–1.59, 1.64) | 0.975 |
| Non-CKD (eGFR ≥ 60 ml/min/1.73 m2) | Chronic (>6 mo) | Intensive | –1.83 (–3.18, –0.49) | –1.20 (–1.75, –0.64) | –0.64 (–2.09, 0.81) | 0.388 |
CI, confidence interval; CKI, chronic kidney disease; SPRINT, Systolic Blood Pressure Intervention Trial.
For acute time period (≤6 mo postrandomization), slopes reflect mean change in eGFR (in ml/min/1.73 m2) over 6 mo. For chronic time period (>6 mo postrandomization), slopes reflect mean change in eGFR per 1 yr.
Adjusted for baseline eGFR, age, sex, history of cardiovascular disease, proportion of African admixture, and whether or not measurement occurred at a fasting study visit.
Discussion
The present report assessed APOL1 RRV associations with incident CVD and mortality in 2568 hypertensive, nondiabetic, African American SPRINT participants. After a median follow-up of 39 months and 177 total CVD events and deaths, no significant association was observed between APOL1 RRVs and all-cause mortality, incident nonfatal MI, acute coronary syndrome without MI, stroke, heart failure, or the primary SPRINT composite CVD outcome. There were advantages to performing these analyses in SPRINT. The sample was relatively large, and CKD was generally mild. This cohort was also at high risk for CVD based on age and prior CVD events, yet only 14% possessed 2 APOL1 RRVs. This is similar to the 13% frequency of 2 APOL1 RRVs in the general population and should limit confounding of CKD with CVD.1 Small numbers of CVD events may have limited study power. As such, meta-analyses including several studies are needed to help clarify the CVD effects of APOL1.
SPRINT results are similar to those reported in the Atherosclerosis Risk In Communities (ARIC) and African American Study of Kidney Disease and Hypertension (AASK), in which no association between APOL1 RRVs and survival or CVD events was observed.23, 24 However, SPRINT, AASK, and ARIC results contrast with higher rates of CVD with APOL1 RRVs in the Jackson Heart Study (JHS), Women’s Health Initiative (WHI), and Cardiovascular Health Study (CHS).17, 18 APOL1 RRVs were associated with baseline CKD, incident CKD, CKD progression, or albuminuria in all of these studies, so confounding between CKD and CVD is not likely to fully explain the differences in results. Confounding should be least likely in SPRINT and CHS, in which mild kidney disease was present and APOL1 RRVs were associated only with baseline CKD or UACR, not with incident reductions in eGFR.18 There were relatively few kidney disease events in SPRINT participants, an effect that reduced power to detect associations with renal outcomes. A trend toward sustained 30% reductions in eGFR to < 60 ml/min/1.73 m2, need for dialysis, or kidney transplantation was seen with APOL1 (recessive model) in the non-CKD subgroup (P = 0.11) (Table 2). No association was seen between APOL1 genotypes and all-cause mortality; 95 deaths occurred during study follow-up. Several other studies reported protective effects of APOL1 RRVs on related outcomes, including improved survival in nondiabetic patients on hemodialysis and in African American−Diabetes Heart Study (AA-DHS) participants, less calcified atherosclerotic plaque in AA-DHS, and less cerebrovascular disease (larger gray matter and smaller white matter lesion volumes) in AA-DHS MIND and SPRINT MND.19, 21, 22
It remains important to determine whether APOL1 RRVs are associated with CVD, because targeting APOL1 G1 and G2 variants to treat CKD could influence CVD outcomes. If APOL1 RRVs are protective against CVD, there is a risk that atherosclerotic complications might develop from targeting this gene. If APOL1 RRVs are associated with risk for CVD, targeting them could simultaneously reduce CVD and CKD. APOL1 relationships with incident CVD outcomes in SPRINT, AASK, and ARIC suggest that significant associations do not exist.23, 24 In contrast, JHS, WHI, and CHS reported positive relationships between APOL1 RRVs and incident CVD.17, 18 It should be noted that JHS compared only African Americans with 2 versus no APOL1 RRVs; results in participants with a single RRV (or in additive models) were not reported.17 Furthermore, 2 APOL1 RRVs in JHS was associated with lower levels of coronary artery calcified plaque (less subclinical CVD).17 This was a paradoxical observation, given the higher reported risk for CVD in this group.29
As in prior reports assessing the effects of APOL1 on CVD, SPRINT has strengths and limitations. Strengths included adjudication of CVD outcomes, renal outcomes, and deaths by an expert panel. Despite the relatively large sample of African Americans in SPRINT, we observed relatively few CVD events and deaths during a median of 39 months of follow-up. We were adequately powered to detect only strong associations between APOL1 RRVs and incident CVD. As such, our data do not preclude effects of the magnitude reported, for example, in CHS, which had longer follow-up and more events.
In conclusion, results in SPRINT add to the expanding literature assessing relationships between renal-risk variants in the APOL1 nephropathy gene and incident cardiovascular outcomes. Significant relationships were not observed between APOL1 RRVs and incident nonfatal MI, stroke, heart failure, non-MI acute coronary syndrome, or CVD-related death in African American SPRINT participants. Significant relationships were also not observed with the composite of these outcomes or with all-cause mortality. Given the limitations of the current study and the existing conflicting reports in the literature, additional research is required in this important area.
Disclosure
Wake Forest University Health Sciences and BIF have filed for a patent related to APOL1 genetic testing. BIF receives research support from Novartis Pharmaceuticals and is a consultant for AstraZeneca and Ionis Pharmaceuticals. All the other authors declared no competing interests.
Acknowledgments
The authors thank the study participants and study coordinators in SPRINT. The Systolic Blood Pressure Intervention Trial is funded with Federal funds from the National Institutes of Health (NIH), including the National Heart, Lung, and Blood Institute (NHLBI), the National Institute of Diabetes and Digestive and Kidney Diseases (NIDDK), the National Institute on Aging (NIA), and the National Institute of Neurological Disorders and Stroke (NINDS), under Contract Numbers HHSN268200900040C, HHSN268200900046C, HHSN268200900047C, HHSN268200900048C, HHSN268200900049C, and Inter-Agency Agreement Number A-HL-13-002-001. It was also supported in part with resources and use of facilities through the Department of Veterans Affairs. The SPRINT investigators acknowledge the contribution of study medications (azilsartan and azilsartan combined with chlorthalidone) from Takeda Pharmaceuticals International, Inc. All components of the SPRINT study protocol were designed and implemented by the investigators. The investigative team collected, analyzed, and interpreted the data. All aspects of manuscript writing and revision were carried out by the coauthors. The content is solely the responsibility of the authors and does not necessarily represent the official views of the NIH, the U.S. Department of Veterans Affairs, or the United States Government. For a full list of contributors to SPRINT, please see the supplementary acknowledgement list.
We also acknowledge the support from the following CTSAs funded by NCATS:
CWRU: UL1TR000439, OSU: UL1RR025755, U Penn: UL1RR024134& UL1TR000003, Boston: UL1RR025771, Stanford: UL1TR000093, Tufts: UL1RR025752, UL1TR000073 & UL1TR001064, University of Illinois: UL1TR000050, University of Pittsburgh: UL1TR000005, UT Southwestern: 9U54TR000017-06, University of Utah: UL1TR000105-05, Vanderbilt University: UL1 TR000445, George Washington University: UL1TR000075, University of CA, Davis: UL1 TR000002, University of Florida: UL1 TR000064, University of Michigan: UL1TR000433, Tulane University: P30GM103337 COBRE Award NIGMS.
ClinicalTrials.gov Identifier NCT0120602.
Footnotes
Figure S1. Estimated glomerular filtration rate (eGFR) over the course of follow-up in African American SPRINT participants by treatment group and APOL1 risk genotype. X-axis denotes study visits in months. Points and error bars reflect mean for eGFR (CKD-EPI equation) at each study visit with associated 95% confidence intervals. Lines represent estimated slopes from linear mixed model with change-point at 6-month study visit, assuming all visits were nonfasting visits (12-, 24-, and 48-month study visits were planned fasting visits). Counts below x-axis denote number of participants measured for each combination of treatment group and APOL1 risk genotype.
Figure S2. Estimated glomerular filtration rate (eGFR) over the course of follow-up in African American SPRINT participants with eGFR < 60 ml/min/1.73 m2 at randomization by treatment group and APOL1 risk genotype. X-axis denotes study visits in months. Points and error bars reflect mean for eGFR (CKD-EPI equation) at each study visit with associated 95% confidence intervals. Lines represent estimated slopes from linear mixed model with change-point at 6-month study visit, assuming all visits were nonfasting visits (12-, 24-, and 48-month study visits were planned fasting visits). Counts below x-axis denote number of participants measured for each combination of treatment group and APOL1 risk genotype.
Figure S3. Estimated glomerular filtration rate (eGFR) over the course of follow-up in African American SPRINT participants with eGFR ≥ 60 ml/min per 1.73 m2 at randomization by treatment group and APOL1 risk genotype. X-axis denotes study visits in months. Points and error bars reflect mean for eGFR (CKD-EPI equation) at each study visit with associated 95% confidence intervals. Lines represent estimated slopes from linear mixed model with change-point at 6 month study visit, assuming all visits were nonfasting visits (12-, 24-, and 48-month study visits were planned fasting visits). Counts below x-axis denote number of participants measured for each combination of treatment group and APOL1 risk genotype.
Supplementary material is linked to the online version of the paper at http://www.kireports.org.
Supplementary Material
Figure S1.
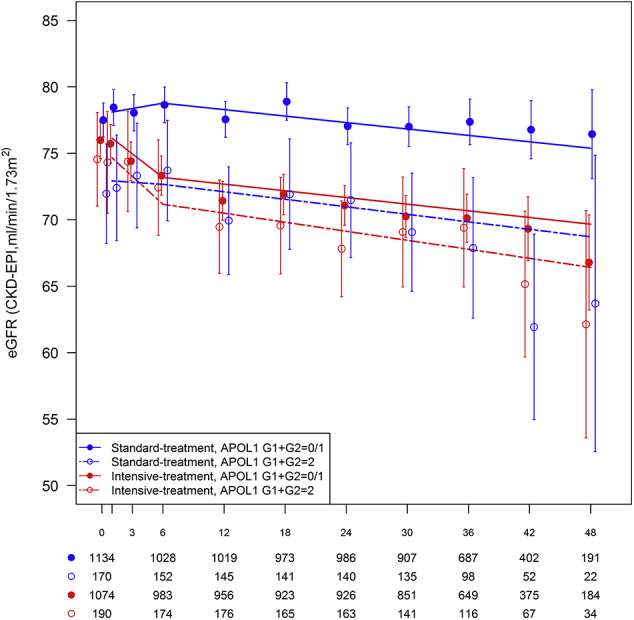
Estimated glomerular filtration rate (eGFR) over the course of follow-up in African American SPRINT participants by treatment group and APOL1 risk genotype. X-axis denotes study visits in months. Points and error bars reflect mean for eGFR (CKD-EPI equation) at each study visit with associated 95% confidence intervals. Lines represent estimated slopes from linear mixed model with change-point at 6-month study visit, assuming all visits were nonfasting visits (12-, 24-, and 48-month study visits were planned fasting visits). Counts below x-axis denote number of participants measured for each combination of treatment group and APOL1 risk genotype.
Figure S2.
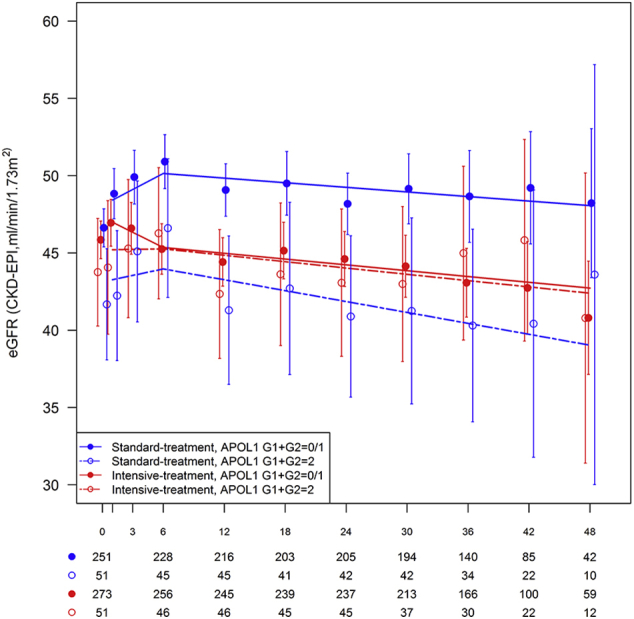
Estimated glomerular filtration rate (eGFR) over the course of follow-up in African American SPRINT participants with eGFR < 60 ml/min/1.73 m2 at randomization by treatment group and APOL1 risk genotype. X-axis denotes study visits in months. Points and error bars reflect mean for eGFR (CKD-EPI equation) at each study visit with associated 95% confidence intervals. Lines represent estimated slopes from linear mixed model with change-point at 6-month study visit, assuming all visits were nonfasting visits (12-, 24-, and 48-month study visits were planned fasting visits). Counts below x-axis denote number of participants measured for each combination of treatment group and APOL1 risk genotype.
Figure S3.
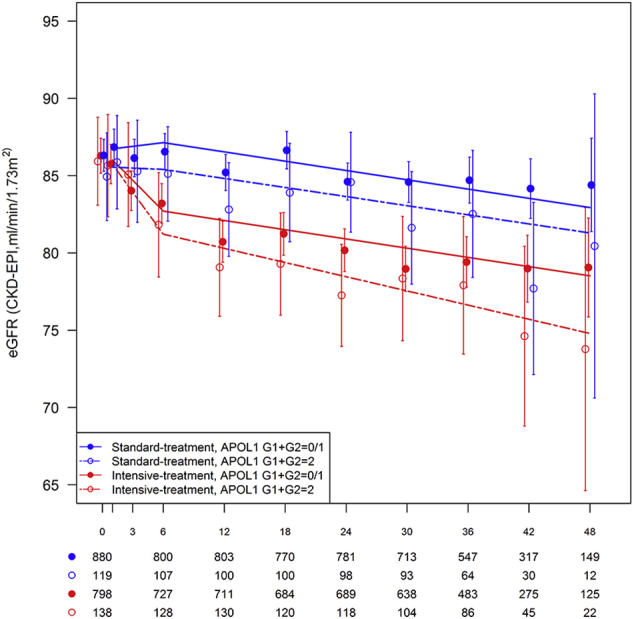
Estimated glomerular filtration rate (eGFR) over the course of follow-up in African American SPRINT participants with eGFR ≥ 60 ml/min per 1.73 m2 at randomization by treatment group and APOL1 risk genotype. X-axis denotes study visits in months. Points and error bars reflect mean for eGFR (CKD-EPI equation) at each study visit with associated 95% confidence intervals. Lines represent estimated slopes from linear mixed model with change-point at 6 month study visit, assuming all visits were nonfasting visits (12-, 24-, and 48-month study visits were planned fasting visits). Counts below x-axis denote number of participants measured for each combination of treatment group and APOL1 risk genotype.
References
- 1.Genovese G., Friedman D.J., Ross M.D. Association of trypanolytic ApoL1 variants with kidney disease in African Americans. Science. 2010;329:841–845. doi: 10.1126/science.1193032. [DOI] [PMC free article] [PubMed] [Google Scholar]
- 2.Tzur S., Rosset S., Shemer R. Missense mutations in the APOL1 gene are highly associated with end stage kidney disease risk previously attributed to the MYH9 gene. Hum Genet. 2010;128:345–350. doi: 10.1007/s00439-010-0861-0. [DOI] [PMC free article] [PubMed] [Google Scholar]
- 3.Kruzel-Davila E., Wasser W.G., Aviram S., Skorecki K. APOL1 nephropathy: from gene to mechanisms of kidney injury. Nephrol Dial Transplant. 2016;31:349–358. doi: 10.1093/ndt/gfu391. [DOI] [PubMed] [Google Scholar]
- 4.Freedman B.I., Cohen A.H. Hypertension-attributed nephropathy: what's in a name? Nat Rev Nephrol. 2016;12:27–36. doi: 10.1038/nrneph.2015.172. [DOI] [PubMed] [Google Scholar]
- 5.Madhavan S.M., O'Toole J.F., Konieczkowski M. APOL1 localization in normal kidney and nondiabetic kidney disease. J Am Soc Nephrol. 2011;22:2119–2128. doi: 10.1681/ASN.2011010069. [DOI] [PMC free article] [PubMed] [Google Scholar]
- 6.Ma L., Shelness G.S., Snipes J.A. Localization of APOL1 protein and mRNA in the human kidney: nondiseased tissue, primary cells, and immortalized cell lines. J Am Soc Nephrol. 2015;26:339–348. doi: 10.1681/ASN.2013091017. [DOI] [PMC free article] [PubMed] [Google Scholar]
- 7.Reeves-Daniel A.M., Depalma J.A., Bleyer A.J. The APOL1 Gene and Allograft Survival after Kidney Transplantation. Am J Transplant. 2011;11:1025–1030. doi: 10.1111/j.1600-6143.2011.03513.x. [DOI] [PMC free article] [PubMed] [Google Scholar]
- 8.Lee B.T., Kumar V., Williams T.A. The APOL1 genotype of African American kidney transplant recipients does not impact 5-year allograft survival. Am J Transplant. 2012;12:1924–1928. doi: 10.1111/j.1600-6143.2012.04033.x. [DOI] [PMC free article] [PubMed] [Google Scholar]
- 9.Freedman B.I., Pastan S.O., Israni A.K. APOL1 genotype and kidney transplantation outcomes from deceased African American donors. Transplantation. 2016;100:194–202. doi: 10.1097/TP.0000000000000969. [DOI] [PMC free article] [PubMed] [Google Scholar]
- 10.Bruggeman L.A., O'Toole J.F., Ross M.D. Plasma apolipoprotein L1 levels do not correlate with CKD. J Am Soc Nephrol. 2014;25:634–644. doi: 10.1681/ASN.2013070700. [DOI] [PMC free article] [PubMed] [Google Scholar]
- 11.Weckerle A., Snipes J.A., Cheng D. Characterization of circulating APOL1 protein complexes in African Americans. J Lipid Res. 2016;57:120–130. doi: 10.1194/jlr.M063453. [DOI] [PMC free article] [PubMed] [Google Scholar]
- 12.Nichols B., Jog P., Lee J.H. Innate immunity pathways regulate the nephropathy gene Apolipoprotein L1. Kidney Int. 2015;87:332–342. doi: 10.1038/ki.2014.270. [DOI] [PMC free article] [PubMed] [Google Scholar]
- 13.Freedman B.I., Skorecki K. Gene-gene and gene-environment interactions in apolipoprotein L1 gene-associated nephropathy. Clin J Am Soc Nephrol. 2014;9:2006–2013. doi: 10.2215/CJN.01330214. [DOI] [PMC free article] [PubMed] [Google Scholar]
- 14.Olabisi O.A., Zhang J.Y., VerPlank L. APOL1 kidney disease risk variants cause cytotoxicity by depleting cellular potassium and inducing stress-activated protein kinases. Proc Natl Acad Sci U S A. 2016;113:830–837. doi: 10.1073/pnas.1522913113. [DOI] [PMC free article] [PubMed] [Google Scholar]
- 15.Ma L., Chou J.W., Snipes J.A. APOL1 renal-risk variants induce mitochondrial dysfunction. J Am Soc Nephrol. 2017;28:1093–1105. doi: 10.1681/ASN.2016050567. [DOI] [PMC free article] [PubMed] [Google Scholar]
- 16.Gutierrez O.M., Judd S.E., Irvin M.R. APOL1 nephropathy risk variants are associated with altered high-density lipoprotein profiles in African Americans. Nephrol Dial Transplant. 2016;31:602–608. doi: 10.1093/ndt/gfv229. [DOI] [PMC free article] [PubMed] [Google Scholar]
- 17.Ito K., Bick A.G., Flannick J. Increased burden of cardiovascular disease in carriers of APOL1 genetic variants. Circ Res. 2014;114:845–850. doi: 10.1161/CIRCRESAHA.114.302347. [DOI] [PMC free article] [PubMed] [Google Scholar]
- 18.Mukamal K.J., Tremaglio J., Friedman D.J. APOL1 Genotype, kidney and cardiovascular disease, and death in older adults. Arterioscler Thromb Vasc Biol. 2016;36:398–403. doi: 10.1161/ATVBAHA.115.305970. [DOI] [PMC free article] [PubMed] [Google Scholar]
- 19.Freedman B.I., Langefeld C.D., Lu L. APOL1 associations with nephropathy, atherosclerosis, and all-cause mortality in African Americans with type 2 diabetes. Kidney Int. 2015;87:176–181. doi: 10.1038/ki.2014.255. [DOI] [PMC free article] [PubMed] [Google Scholar]
- 20.Langefeld C.D., Divers J., Pajewski N.M. Apolipoprotein L1 gene variants associate with prevalent kidney but not prevalent cardiovascular disease in the Systolic Blood Pressure Intervention Trial. Kidney Int. 2015;87:169–175. doi: 10.1038/ki.2014.254. [DOI] [PMC free article] [PubMed] [Google Scholar]
- 21.Ma L., Langefeld C.D., Comeau M.E. APOL1 renal-risk genotypes associate with longer hemodialysis survival in prevalent nondiabetic African American patients with end-stage renal disease. Kidney Int. 2016;90:389–395. doi: 10.1016/j.kint.2016.02.032. [DOI] [PMC free article] [PubMed] [Google Scholar]
- 22.Freedman B.I., Gadegbeku C.A., Bryan R.N. APOL1 renal-risk variants associate with reduced cerebral white matter lesion volume and increased gray matter volume. Kidney Int. 2016;90:440–449. doi: 10.1016/j.kint.2016.04.027. [DOI] [PMC free article] [PubMed] [Google Scholar]
- 23.Grams M.E., Rebholz C.M., Chen Y. Race, APOL1 risk, and eGFR decline in the general population. J Am Soc Nephrol. 2016;27:2842–2850. doi: 10.1681/ASN.2015070763. [DOI] [PMC free article] [PubMed] [Google Scholar]
- 24.Ku E., Lipkowitz M.S., Appel L.J. Strict blood pressure control and mortality risk by APOL1 genotype. Kidney Int. 2017;91:443–450. doi: 10.1016/j.kint.2016.09.033. [DOI] [PMC free article] [PubMed] [Google Scholar]
- 25.Wright J.T., Jr., Williamson J.D., Whelton P.K. A randomized trial of intensive versus standard blood-pressure control. N Engl J Med. 2015;373:2103–2116. doi: 10.1056/NEJMoa1511939. [DOI] [PMC free article] [PubMed] [Google Scholar]
- 26.Ambrosius W.T., Sink K.M., Foy C.G. The design and rationale of a multicenter clinical trial comparing two strategies for control of systolic blood pressure: the Systolic Blood Pressure Intervention Trial (SPRINT) Clin Trials. 2014;11:532–546. doi: 10.1177/1740774514537404. [DOI] [PMC free article] [PubMed] [Google Scholar]
- 27.Levey A.S., Stevens L.A., Schmid C.H. A new equation to estimate glomerular filtration rate. Ann Intern Med. 2009;150:604–612. doi: 10.7326/0003-4819-150-9-200905050-00006. [DOI] [PMC free article] [PubMed] [Google Scholar]
- 28.Hsieh F.Y., Lavori P.W. Sample-size calculations for the Cox proportional hazards regression model with nonbinary covariates. Control Clin Trials. 2000;21:552–560. doi: 10.1016/s0197-2456(00)00104-5. [DOI] [PubMed] [Google Scholar]
- 29.Detrano R., Guerci A.D., Carr J.J. Coronary calcium as a predictor of coronary events in four racial or ethnic groups. N Engl J Med. 2008;358:1336–1345. doi: 10.1056/NEJMoa072100. [DOI] [PubMed] [Google Scholar]