

Abstract
Cancer, being a major healthcare concern worldwide, is one of the main targets for the application of emerging proteomic technologies and these tools promise to revolutionize the way cancer will be diagnosed and treated in the near future. Today, as a result of the unprecedented advances that have taken place in molecular biology, cell biology and genomics there is a pressing need to accelerate the translation of basic discoveries into clinical applications. This need, compounded by mounting evidence that cellular model systems are unable to fully recapitulate all biological aspects of human dissease, is driving scientists to increasingly use clinically relevant samples for biomarker and target discovery. Tissues are heterogeneous and as a result optimization of sample preparation is critical for generating accurate, representative, and highly reproducible quantitative data. Although a large number of protocols for preparation of tissue lysates has been published, so far no single recipe is able to provide a “one‐size fits all” solubilization procedure that can be used to analyse the same lysate using different proteomics technologies. Here we present evidence showing that cell lysis buffer 1 (CLB1), a lysis solution commercialized by Zeptosens [a division of Bayer (Schweiz) AG], provides excellent sample solubilization and very high 2D PAGE protein resolution both when using carrier ampholytes and immobilized pH gradient strips. Moreover, this buffer can also be used for array‐based proteomics (reverse‐phase lysate arrays or direct antibody arrays), allowing the direct comparison of qualitative and quantitative data yielded by these technologies when applied to the same samples. The usefulness of the CLB1 solution for gel‐based proteomics was further established by 2D PAGE analysis of a number of technically demanding specimens such as breast carcinoma core needle biopsies and problematic tissues such as brain cortex, cerebellum, skeletal muscle, kidney cortex and tongue. This solution when combined with a specific sample preparation technique – cryostat sectioning of frozen specimens – simplifies tissue sample preparation and solves most of the difficulties associated with the integration of data generated by different proteomic technologies.
Keywords: Tissue sample preparation, Gel-based proteomics, Protein arrays, Systems biology
1. Introduction
Proteomic technologies allow the identification and analysis of proteins that are differentially expressed in health and disease and, as a consequence, they are rapidly becoming a mainstay of clinical research (Aebersold and Mann, 2003, 2003, 2004, 2008, 2007, 2008, 2008, 2003, 2003). There is a great expectation that clinical proteomic studies will contribute significantly to the development of better diagnostic and prognostic tools, the identification of novel therapeutic targets, and eventually enable patient‐individualized therapy (Celis et al., 2003, 2005, 2005, 2007, 2007, 2006, 2008; Geho et al., 2005; Dominguez et al., 2007; Reymond and Schlegel, 2007; Simpson et al., 2008; Kruse et al., 2008; Koomen et al., 2008; Ben‐Kasus et al., 2007). As a growing number of scientists redirect their research from the study of cellular models to the analysis of clinically relevant samples (Celis et al., 1999; Ornstein et al., 2000; Kenny et al., 2007) – and even though proteomic analysis of whole tissue extracts provides a sufficient benefit in terms of uncovering tissue/disease‐specific markers to more than justify this change – previously seemingly unimportant technical issues take on a new dimension and can become insurmountable problems. Clinical proteomic approaches that use human specimens require dedicated protocols for sample collection, handling, and preservation in order to generate reliable data (Riegman et al., 2008). One issue in particular ‐sample preparation‐ is becoming one of the major hurdles in any clinical proteomic study using tissue specimens.
In our laboratory we are interested in identifying novel diagnostic/prognostic breast cancer biomarkers, molecular markers that can subdivide breast tumors to greater molecular detail, and proteins that may serve as potential targets for novel targeted therapies and chemoprevention strategies. For this purpose we analyze clinically relevant samples using multiplatform technologies from proteomics, functional genomics, and cellular and molecular biology in an integrated approach (Celis et al., 2003, 2004, 2005, 2005, 2007, 2007, 2008). The concept underlying our research approach is the application of various experimental paradigms to the analysis of clinically relevant samples underpinned by the systematic integration of all biological data generated by the various experimental methods with the clinical data available for each patient.
The use of complementary proteomic technologies to the analysis of tumor samples, although conceptually sound, carries with it a number of technical difficulties. First, the inherent heterogeneity of cancerous tissues makes the comparison of data generated from pieces of tissue collected from different areas, even if contiguous, of any given tumor a complex, and often futile, effort. For example some breast tumors exhibit areas that contain multiple and closely located ductal in situ elements as well as areas with invasion intermingled with numerous premalignant lesions (Celis et al., 2007, 2007). The breast tissue around the tumor may also contain hyperplasia, fibroadenoma, adenosis, and other benign changes. As a result, to effectively interpret and compare the data generated by different technologies one needs to know the cellular composition of the biological specimens used to generate that data (Celis et al., 2007, 2007, 2008, [Link]). Second, although surgical excision of large tumors can provide sufficient biological material to allow the use of classical tissue homogenization procedures for sample preparation, other specimens of interest such as clinical samples collected through minimally invasive procedures (e.g. core needle biopsies) or premalignant and early breast lesions (e.g. carcinoma in situ) are only available as minute pieces and as a result their use in studies involving multiple technologies is a challenging task. Third, although a large number of tissue lysis protocols has been published, no single recipe exists that can provide ideal solubilization of a tissue sample for any given proteomic application. For instance the most popular sample solubilization solutions in use for 2D PAGE analysis are based on O'Farrell's protocol and modifications thereof (O'Farrell, 1975; Görg et al., 2004; Weiss and Görg, 2008 and references therein), but these solutions are not optimal for solubilization of all protein classes, and are not appropriate for use in array‐based proteomics. Hence, sample preparation in most proteomic studies is end‐application specific, a serious drawback for multiplatform studies.
In short, currently available methods for extracting proteins from whole tissues tend to require a significant amount of biological starting material and, in general, are end‐application specific, which in combination with tumor heterogeneity makes them unsuitable for clinical proteomic studies that make use of various complementary technological platforms. Here, we report a comparative study of a lysis buffer – cell lysis buffer 1 (CLB1) – commercialized by Zeptosens [a division of Bayer (Schweiz) AG] that can be used for gel and array‐based proteomics, and that, when combined with a specific sample preparation technique – cryostat sectioning of frozen specimens – solves the sample preparation issues associated with proteomic analysis of tissue specimens as stated above.
2. Materials and methods
2.1. Tissue sample collection and handling
Tissue biopsies were collected from breast cancer patients that underwent surgical excision of tumors at the Copenhagen University Hospital. All samples, following macroscopic dissection and evaluation by a pathologist, were frozen in liquid nitrogen and rapidly transported to the Institute of Cancer Biology where they were stored at −80°C. Samples were routinely collected within a maximum of 30–45min from the time of surgical excision. The project was approved by the Scientific and Ethical Committee of the Copenhagen and Frederiksberg Municipalities (KF 01‐ 069/03). Post‐mortem human tissues were obtained from Aarhus University Hospital. Use of post‐mortem human tissue was approved by the local institutional review board.
2.2. Sample preparation
Twenty to 30, 6‐μm cryostat sections were cut from tissue blocks of roughly 100mm3 embedded in OCT medium (optimum cutting temperature medium; Sakura Finetek, USA, Inc.). Sections were resuspended immediately in 0.1ml of one of the following lysis solutions: O'Farrell lysis buffer (O'Farrell, 1975), IPG lysis buffer (Bio‐Rad Laboratories, Hercules CA, USA), or CLB1 buffer [Zeptosens, a division of Bayer (Schweiz) AG]. Protein extraction was carried out on a shaker during 15min at room temperature. No detectable protein degradation was observable by 2D PAGE analysis with up to 1h of extraction time. Protein extracts were either used immediately or stored at −20°C for short‐term storing (Celis et al., 2005a).
2.3. Two dimensional polyacrylamide gel electrophoresis (2D PAGE)
The first dimension in 2D PAGE‐based analyses was carried out using two basic electrofocusing formats: carrier ampholytes (isoelectrofocusing, IEF) and immobilized pH gradient (IPG). IEF was carried out using broad‐range carrier ampholytes as previously described (Celis et al., 2006a). A total of 40μl of sample were applied to the gel of the first dimension. IPG‐based isoelectrofocusing was performed using IPG strips 4–7 or 5–8 pI range using the Bio‐Rad PROTEAN IEF focusing tray essentially as described in the manufacturer's Instruction Manual (Bio‐Rad, USA). Typically, the IPG strips were actively rehydrated in 300μl of sample solution, CLB1 or IPG lysis buffer (Bio‐Rad Laboratories, USA). IEF was then carried out for 18,000Vhr. The second dimension was carried out following manufacturer's instructions. All tissue specimens were sampled and ran by 2D PAGE at least twice.
2.4. Gel staining and imaging
Gels used for quantification were fixed in 7.5% acetic acid, 50% ethanol, 0.05% formalin for 1h, stained with SYPRO® Ruby Protein Gel Stain (Molecular Probes) overnight, rinsed twice briefly in 7.5% acetic acid/10% ethanol, and destained in the same solution for 30min. For all gels, imaging was done using a Typhoon 9410 image system equipped with a 457nm laser and 580nm filterset. Fluorescent intensities of scanned 2D images were analyzed using PDQUEST 8.0.1 software (Bio‐Rad, USA). The albumin spot was excluded from the matchset due to intensity saturation. The spot volumes were normalized to the total density of detected spots on the image.
2.5. Protein identification by mass spectrometry
After image acquisition, the gels were placed in 7.5% acetic acid, 50% ethanol, 0.05% formalin for 1h, washed 3×30min in 7.5% acetic acid, 10% ethanol and stained with silver nitrate according to procedures compatible with mass spectrometry (Gromova and Celis, 2006). Protein spots were excised from dry gels and the gel pieces were re‐hydrated in water. Gel pieces were detached from the cellophane film and cut into 1mm2 pieces followed by “in‐gel” digestion as previously described (Celis et al., 2004). Samples were prepared for analysis by applying 2μl of digested and extracted peptides on the surface of a 400/384 AnchorChip target (Bruker Daltonik, GmbH), followed by co‐crystallization with α‐cyano matrix (Schevchenko et al., 1996). Mass spectrometry was performed using a Reflex IV matrix assisted laser desorption ionization time‐of‐flight mass spectrometer (MALDI‐TOF MS) equipped with a Scout 384 ion source. All spectra were obtained in positive reflector mode with delayed extraction using an acceleration voltage of 28kV. The resulting mass spectra were internally calibrated using the auto‐digested tryptic mass values visible in all the spectra. Calibrated spectra were processed by the Xmass 5.1.1 and BioTools 2.1 software packages (Bruker Daltonik, GmbH). Irrelevant masses (matrix, metal adducts, auto‐digested tryptic masses as well as masses of tryptic peptides from keratins) were excluded from the analysis by manual examination of all spectra by pair‐wise comparison. The spectrum of interest was superimposed with the spectrum obtained from the negative control (set of peptides from an empty gel piece treated in parallel) to exclude the most common contaminations. For protein identification, peptide masses were transferred to the BioTools 2.1 interface (Bruker Daltonik, GmbH) to search in the National Center for Biotechnology non‐redundant NCBInr (version 15.05.2008, 685787 mammalian entries) database using the MASCOT search engine (version 2.2, released 28.01.2008, Matrix Science Ltd.). No restriction on the protein molecular mass and taxonomy was applied. A number of fixed (acrylamide modified cystein, i.e. propionamide/carbamidomethylation) and variable modifications (methionine oxidation and protein N‐terminus acetylation) were included in the search parameters. The peptide tolerance did not exceed 50ppm and a maximum of one trypsin missed cleavage was allowed. Protein identifications were considered to be confident when the protein score of the hit exceeded the threshold significance score of 70 (p<0.05) and no less than six peptides were recognized. Often the peptides identified matched equally well to multiple database entries using the non‐redundant NCBInr database that is why the second/final search was performed using the same parameters but the UniProtKB/Swiss‐Prot 55.3 (19,372 human entries) database, and if the number and the sequence of the recognized peptides were identical to the first search, the SwissProt accession number was assigned for the identified protein.
2.6. Western blotting
Immunoblotting was performed as previously described (Celis et al., 2006b). Proteins resolved by 2D PAGE were electroblotted onto Nitrocellulose C membranes (Amersham) and probed with antibodies raised against CK19 and vimentin (clones RCK108 and Vim 3B4, DAKO, Denmark).
2.7. Reverse‐phase protein lysate microarray
Breast tissue lysates were prepared in CLB1 buffer using the cryostat sectioning method. Protein concentration ratios were determined by total spot quantification of the 2D PAGE images obtained for each sample and protein concentration of lysates was normalized by dilution with CLB1 buffer. The resulting lysate solutions were then serially 2‐fold diluted three times with CLB1 buffer and transferred onto FAST nitrocellulose microarray slides (Schleicher & Schuell BioScience, Germany) in quintuplicates using a MicroCaster™ Hand‐Held Microarrayer System (Schleicher & Schuell BioScience, Germany) according to manufacturer's instructions. Detection of proteins was done using an anti‐CK19 mouse monoclonal antibody (DAKO, Denmark) and an Alexa Fluor® 633 conjugated anti‐mouse secondary antibody (Molecular Probes, Invitrogen, Carlsbad, USA). Total protein staining of arrayed slides was done using a luminescent europium‐based metal chelate stain (SYPRO® Rose Plus Protein Blot Stain; Molecular Probes, Invitrogen, Carlsbad, USA). Imaging of stained slides was done using a Typhoon Scanner model 9410.
2.8. Antibody array
The Panorama® Antibody Microarray‐Cell Signaling kit (Sigma‐Aldrich, St. Louis, MO, USA) was used for comparing protein expression profiles of a bladder tumor biopsy using CLB1 buffer or Panorama® Antibody Microarray Extraction/Labeling buffer for preparation of protein extracts. Briefly, 60 6‐μm cryostat sections of frozen tissue specimen were resuspended in an alternating manner in 0.1ml of either CLB1 buffer or Panorama® Antibody Microarray Extraction buffer and frozen at −80°C until used. For sample labeling, extracts were diluted at least 10‐fold into Panorama® Antibody Microarray Buffer A to enable adequate protein labeling. Each sample was labeled with a different Cy™ dye (Cy™3 or Cy™5) according to manufacturer's instructions, and the two samples were applied simultaneously at equal protein concentrations on the array. Imaging of stained slides was done using a Typhoon Scanner model 9410 using appropriate filterset settings for multichannel acquisition of Cy™3 and Cy™5 signals.
3. Results and discussion
Most protocols for extraction and solubilization of total protein from tissue specimens consist in fact of a two‐step process: tissue disintegration (e.g. manual homogenization, grinding in liquid nitrogen, or ball mill grinding) followed by protein extraction and solubilization in an appropriate buffer (Rabilloud et al., 2007; Bodzon‐Kulakowska et al., 2007; Weiss and Görg, 2008 and references therein). In order to optimize our procedures for sample preparation we evaluated different methods of specimen disintegration/disaggregation in combination with different lysis solutions. We found, and have reported elsewhere, that cryostat sectioning of frozen specimens (Celis et al., 2005, 2007, 2007, 2008) greatly facilitates the preparation of tissue samples for gel‐based proteomic studies as compared to traditional homogenization methods (e.g. manual homogenization). This procedure has also been used in the isolation of total RNA for various genomics applications (see for example, Dumur et al., 2004; Suzuki and Tarin, 2007). Serial cryostat sectioning of snap‐frozen tissue specimens is also an excellent sample breakdown procedure when only relatively small tissue biopsies are available and has the added‐value that one can collect and store tissue section(s) along the process, thus creating a histological record for any sample that allows the determination of a rough estimate of the cellular ratios present in each sample (Figure 1). These benefits lead us to adopt cryostat sectioning of frozen specimens as the standard sample preparation procedure in our laboratory.
Figure 1.
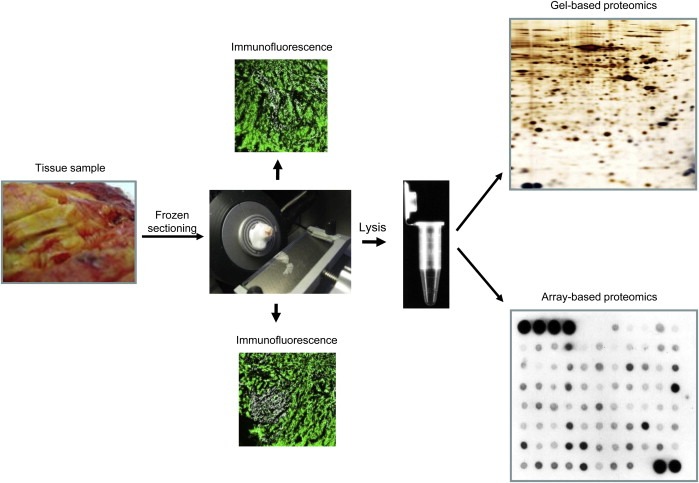
Frozen tissue biopsy sample preparation workflow for gel‐based and array‐based proteomics.
Of the lysis solutions we have tested, one in particular ‐CLB1‐ performed remarkably well in combination with the cryostat sectioning sample preparation method. We have used this lysis solution in previously reported proteomic studies as a suitable alternative to O'Farrell buffer in gel‐based proteomics experiments (Celis et al., 2005, 2007b, 2008).
3.1. Two‐dimensional gel electrophoresis
To further investigate the solubilization potential of CLB1 solution for 2D PAGE‐based analyses we performed confirmatory studies using a variety of human tissues. Whole protein extracts were prepared in both the O'Farrell and the CLB1 solutions, subjected to IEF 2D PAGE using carrier ampholytes, and stained with silver nitrate as described in Section 2. Figure 2 shows representative 2D gel images of protein lysates obtained from direct solubilization of roughly one third (4–5mm2) of a standard 14‐gauge breast tumor core needle biopsy (Helbich et al., 1998). As can be seen, both lysis solutions provide comparable protein patterns (Figure 2) suggesting that the components of the CLB1 solution do not cause artifactual protein modifications during sample extraction that alter the original pI and M r of the solubilized proteins. In general, 2D protein maps of samples solubilized in CLB1 showed resolutions that were at least as good, and in many cases superior to those of samples prepared in O'Farrell solution. However, we also observed that several proteins exhibited differences in intensity. In the case of the sample presented here, 11 protein spots were more intensive in the sample prepared with the CLB1 solution and two spots less intensive (indicated by arrows, Figure 2). We were able to determine the identity of these proteins by MALDI‐MS (Table 1), a fact that is indicative of the compatibility of the CLB1 solution with mass spectrometry. We were unable, however, to reveal any obvious common feature of these proteins that could explain their differential behavior. The compatibility of the CLB1 lysis solution with Western blotting was also verified by 2D blot immunodetection using antibodies against a number of selected proteins (data not shown).
Figure 2.
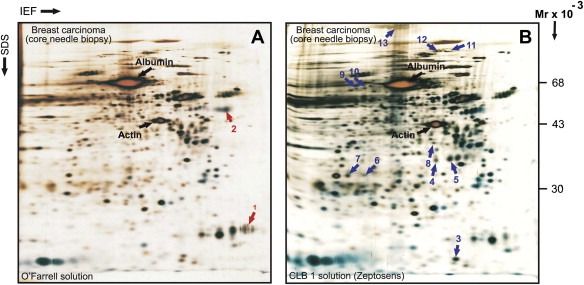
Two‐dimensional gel electrophoresis protein patterns of whole protein extracts prepared from a needle core biopsy collected from a breast ductal carcinoma. Proteins were solubilized in O'Farrell lysis solution (A) or in CLB1 solution (B). Proteins were separated by 2D PAGE‐IEF and gels stained with silver nitrate. Several proteins that are differentially represented in the two samples are indicated by red arrows (lower expression in CLB1 lysis reagent) or blue arrows (higher expression in CLB1 lysis reagent). The identities of these proteins were ascertained by MALDI‐TOF and are presented in Table 1. The location of actin and albumin are also indicated for reference.
Table 1.
Proteins identified in needle core biopsy from breast carcinoma that are differently resolved by 2D PAGE using O'Farrell lysis buffer and CLB1 (Zeptosens) buffer
| Protein number | Protein name | Effect of solubilization solution | Acc. number (SwissProt) | Gene name (UniGene) | M r.10−3/pI | Score | Coverage (%) | Number of recognized peptides |
|---|---|---|---|---|---|---|---|---|
| 1 | Prolactin‐inducible protein | Up in O'Farrell lysis solution | P12273 | PIP | 17/8.2 | 138 | 54 | 7/10 |
| 2 | Alpha‐1‐antitrypsin precursor (Alpha‐1 protease inhibitor) | Up in O'Farrell lysis solution | Q86U19 | SERPINA1 | 47/5.3 | 181 | 33 | 11/12 |
| 3 | Galectin‐1 | Up in CLB1 solution | P09382 | LGALS1 | 15/5.3 | 158 | 55 | 7/7 |
| 4 | Mimecan (Osteoglycin, Osteoinductive factor) | Up in CLB1 solution | P20774 | OGN | 34/5.4 | 109 | 18 | 6/6 |
| 5 | Mimecan (Osteoglycin, Osteoinductive factor) | Up in CLB1 solution | P20774 | OGN | 34/5.4 | 100 | 18 | 6/7 |
| 6 | Proteasome subunit alpha type‐1 (Proteasome nu chain) | Up in CLB1 solution | P25786 | PSMA1 | 29/6.1 | 90 | 20 | 6/7 |
| 7 | Carbonic anhydrase 1 | Up in CLB1solution | P00915 | CA1 | 28/6.6 | 163 | 53 | 8/8 |
| 8 | Guanine nucleotide‐binding protein G(i), alpha‐2 subunit | Up in CLB1 solution | P04899 | GNAI2 | 41/5.3 | 142 | 29 | 8/8 |
| 9 | Bifunctional purine biosynthesis protein PURH | Up in CLB1 solution | P31939 | ATIC | 65/6.3 | 200 | 23 | 14/16 |
| 10 | Succinate dehydrogenase [ubiquinone] flavoprotein subunit, mitochondrial | Up in CLB1 solution | P31040 | SDHA | 74/7.0 | 150 | 22 | 14/17 |
| 11 | Heat shock 70kDa protein 4 (Heat shock 70‐related protein APG‐2) | Up in CLB1 solution | P34932 | HSPA4 | 95/5.1 | 165 | 23 | 16/23 |
| 12 | Fibrinogen gamma chain | Up in CLB1 solution | P02679 | FGG | 52/5.3 | 115 | 22 | 10/15 |
| 13 | Alpha‐2‐macroglobulin precursor | Up in CLB1 solution | P01023 | A2M | 165/6.0 | 120 | 16 | 17/30 |
Figure 3 shows 2D gel images of paired protein samples prepared from various human tissues: brain cortex, cerebellum, kidney cortex, skeletal muscle, and tongue. These tissues are characterized by poor solubility due to the presence of considerable amounts of stroma, in some cases lipids, and other components which exhibit poor solubility and that may interfere with protein profiling by 2D PAGE analysis. Visual comparison of the corresponding 2D gels showed that 2D maps of extracts prepared with the CLB1 solution were comparable to those obtained with the O'Farrell solution for all tissues analyzed. A substantial variation in the levels of some abundant proteins was however observed (see Figure 3). In particular, the tubulin alpha 1B chain and alpha‐1‐antichemotrypsin focused sharply in the samples solubilized in the CBL1 solution, a fact that greatly improves the detection of polypeptides migrating close to these proteins.
Figure 3.
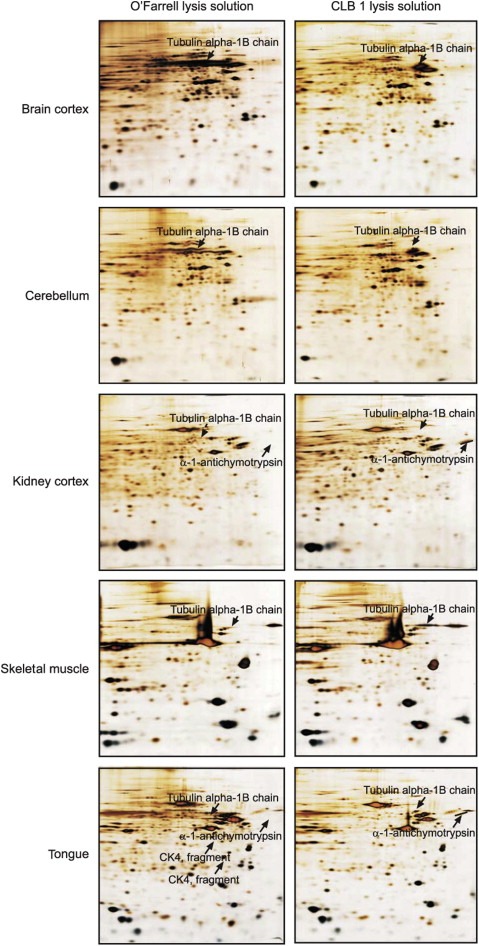
IEF 2D gel of whole tissue proteins extracted with O'Farrell lysis solution (left‐hand images) or CLB1 lysis solution (right‐hand images) from human brain cortex, cerebellum, kidney cortex, skeletal muscle and tongue. Solubilization of tissue specimens was carried out as described in Section 2.
We also investigated the effect of the CLB1 solution on protein separation using immobilized pH gradients as first dimension. In these experiments proteins were extracted from breast tumor specimens and separated using IPG strips pH 4–7 and 5–8 (BioRad), respectively. Re‐swelling of IPG strips was carried out in 300μl of tissue lysate prepared in CLB1 or IPG rehydration buffer (BioRad), with the proteins actively entering the gels during strip rehydration. The results presented in Figure 4 demonstrate that solubilization of tissue specimens in CLB1 followed by rehydration of IPG strips in the same solution remarkably improved the number of proteins detected. In general, nearly 1400 protein spots were detected using the PDQUEST 8.0.1 software package in a 2D gel ran with the CLB1 whereas only about 1100 spots were detected in a matched gel ran using a standard reagent set (BioRad). As seen in Figure 4 some areas displayed a significantly enhanced protein separation in the presence of CLB1, providing definite improvements in the detection of specific proteins in the more basic pI range. Taken together these results indicate that CLB1 is an IEF compatible, efficient protein extracting solution able to maintain protein solubility throughout loading onto IPG strips and the subsequent first dimension IEF separation.
Figure 4.
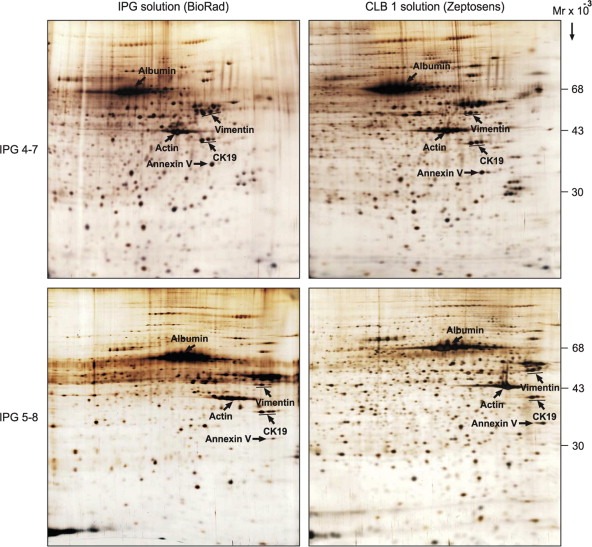
IPG‐2D PAGE of whole protein extracts from a breast carcinoma sample run using IPG 4–7 (A) and 5–8 (B) strips. Proteins were solubilized in IPG lysis solution (BioRad) (left‐hand panel) or in CLB1 solution (right‐hand panel). The first dimension was carried out with IPG strips (BioRad) rehydrated in either IPG rehydration solution (BioRad) or in CLB1 solution (left‐ and right‐hand panels, respectively). The gels were stained with silver nitrate. The identity of a few proteins is indicated for reference.
3.2. Reverse‐phase lysate arrays
The CLB1 lysis solution is a commercial reagent that was originally designed and optimized to ensure the reproducible preparation of cell lysates from cultured cells or tissue samples and compatibility with cell and tissue lysate array applications (Weissenstein et al., 2006).
To determine if tissue samples solubilized with CLB1 could be used to compare quantitative levels of selected proteins using various proteomic technologies, we evaluated by 2D gel and reverse‐phase lysate array analysis the levels of cytokeratin 19 expression in three breast tumor samples that showed different levels of protein expression as ascertained by IHC. 2D IEF gels of the three samples were imaged with SYPRO Ruby staining followed by quantification of the relevant protein spots (Figure 5A). The same samples were then normalized to their total protein concentration as determined by 2D gel quantification, spotted onto FAST slides in three serial dilutions, probed with an anti‐CK19 antibody and the signals quantified as described in Section 2 (Figure 5B). As seen from the corresponding bar graph plots (low right panels of the Figures 5A,B), the relative ratio of CK19 expression levels in the three tumors as determined by reverse‐phase lysate arrays was comparable to the results obtained by 2D PAGE analysis supporting the contention that the CLB1 solution can be used as a single lysis solution for both 2D PAGE and protein array experiments allowing the comparison of quantitative data derived by these proteomic technologies.
Figure 5.
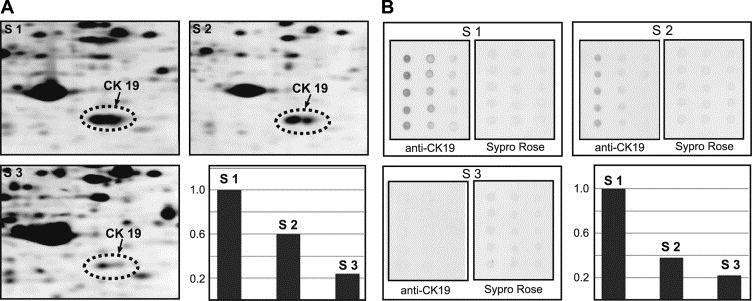
Quantification of the levels of CK19 in three breast cancer samples using (A) 2D PAGE and (B) reverse‐phase lysate arrays. The bar graph plots (low right panels) show the ratio of the levels of CK19 normalized to the level in sample 1 (S1).
3.3. Antibody protein microarrays
Malignant transformation of cells can be the result of defective regulation in the network of intracellular and extracellular signaling cascades that control cell behavior (Blume‐Jensen and Hunter, 2001). One of the key processes that modulates the state of signaling pathways is the reversible phosphorylation of proteins. Anomalous phosphorylation of an effector protein may cause deregulated tissue growth or invasion (Hunter and Sefton, 1980). It is therefore important to profile the activation state of signaling pathways, as identification of a critical node or interactions within a pathway is a potential target for drug development or individual therapy regimen. Although several technologies have been developed to characterize the phosphoproteome of cells most of them require relatively large amounts of starting material and in some cases in vitro manipulations (e.g. enrichment of phosphopeptides by chromatography or SILAC) that are impractical in the case of patient tissue biopsies. One method that has been proposed to address these limitations is the antibody protein microarray format (Gembitsky et al., 2004; Celis et al., 2005). Due to its high sensitivity and low sample consumption (Haab et al., 2001; Wingren and Borrebaeck, 2006) the antibody microarray technology platform is ideal for the analysis of clinical samples. We tested the compatibility of the CLB1 solution with antibody protein arrays by using the Panorama® Cell Signaling Antibody Microarray (Sigma‐Aldrich, St. Louis, MO, USA), which is designed for studying signaling protein expression in tissue extracts. This array contains 224 different antibodies, many of which are activation‐state specific, probing several biological pathways, with each antibody spotted in two equal concentrations on nitrocellulose coated glass slides. The array was used for comparing protein expression profiles of whole protein extracts from a bladder tumor biopsy prepared using the CLB1 solution or Panorama® Antibody Microarray Extraction/Labeling buffer. A frozen tumor specimen was sectioned, and sections were solubilized alternating in the CLB1 solution (Zeptosens) or Panorama® Antibody Microarray Extraction/Labeling buffer (Sigma‐Aldrich), an application specific reagent. Lysates were labeled with a different Cy™ dye (Cy™3 or Cy™5, respectively) and competitively hybridized to a Panorama® antibody microarray slide. A representative image of a Panorama® array is presented in Figure 6 clearly demonstrating the equivalent efficiency of protein solubilization in both lysis solutions for all signaling proteins spotted on the array. This result indicates that CLB1 is also compatible with the antibody protein microarray format.
Figure 6.
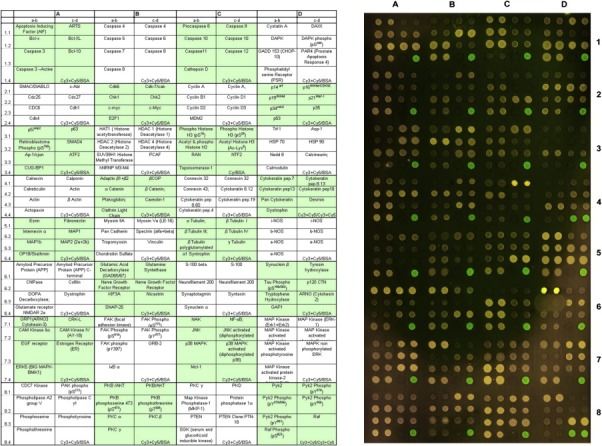
Compatibility of the CLB1 solution with the antibody protein microarray format. The tissue sample was frozen‐sectioned and solubilized in either Panorama® Antibody Microarray Extraction buffer or in CLB1 lysis solution and labeled with Cy3™ or Cy5™ dyes, respectively. The labeled samples were mixed and probed with the Panorama® signaling antibody array (Sigma‐Aldrich).
4. Conclusions
As the field of proteomics moves forward, the application of novel enabling technologies to the analysis of pathological conditions heralds a potential for discoveries in molecular medicine that is expected to have a major impact in the clinical management of human disease. At present, researchers use essentially two types of proteomic approaches to investigate the expression of proteins in cells, tissues and biofluids: (i) 2D PAGE coupled with MS (Gorg et al., 2004; Carrette et al., 2006; Issaq and Veenstra, 2008; and references therein) and non‐gel shotgun methods coupled with MS (McDonald and Yates, 2003; Cravatt et al., 2007 and references therein); and (ii) array‐based proteomics (Liotta et al., 2003; Wulfkuhle et al., 2003; Loch et al., 2007; Forrester et al., 2007; Jaras et al., 2007; Rapkiewicz et al., 2007). Gel or non‐gel‐based proteomics coupled with MS compares expression profiles of proteins of unknown identity in a set of samples with the aim of identifying deregulated polypeptides – a discovery tool. Protein and antibody microarrays, on the other hand, are based on the profiling of a discrete number of known biomolecules in a sample or samples of interest – a knowledge‐based tool, ideal for validation studies. Because they are based on different a priori assumptions these technologies are highly complementary. However, as a result of the lack of standardization in sample preparation, for most clinical proteomic studies comparing data generated on the same samples is seldom realistic and as a consequence the identification of disease‐associated proteins by clinical proteomics is still very much in its infancy.
Here we have shown that a commercially available solution, cell lysis buffer 1 (CBL1, Zeptosens), in combination with a specific sample preparation technique – cryostat sectioning of frozen specimens – addresses a number of issues normally associated with proteomic analysis of tissue specimens:
-
–
It enables the preparation of minute amounts of sample material at a time, a crucial issue in the analysis of clinical samples in particular when investigating cancer at an earlier stage. In addition, the histological imaging of sections adjacent to those underlying each sample provides an estimate of tissue cell heterogeneity and ameliorates sampling problems.
-
–
Same sample can be comparatively analyzed using different complementary proteomic platforms: (i) gel‐based proteomics; (ii) reverse‐phase lysate microarrays; and (iii) antibody‐based protein microarrays. In addition, it is conceivable that this method can be used for other proteomic technologies. From the results we obtained with the Panorama® Cell Signaling Antibody Microarray and 2D gels one can surmise that CLB1 lysates may be compatible with two‐dimensional differential gel electrophoresis (2D DIGE) technology.
-
–
Another technical advantage of the CLB1 buffer is that it does not pose the problem of evaporation/crystallization that is observed with urea‐based solutions during low‐temperature long‐term storage of small volumes of tissue lysates (personal observation, data not shown).
In short, the method we describe here simplifies tissue sample preparation in a standard procedure that can be applied to comparative studies of clinical samples by multiple proteomic technologies providing the possibility of a more holistic insight into the proteome of cancer cells.
Acknowledgments
We would like to thank Peter Oroszlan and Zeptosens for providing reagents. We would also like to thank Dorte Holm, Hanne Nors, Sofia Svensson, and Signe Trentemøller for expert technical assistance. This work was supported by the Danish Cancer Society and by grants from the John and Birthe Meyer Foundation, the Race against Breast Cancer Foundation, the Novo Nordisk Fund, the Lise og Gudmund Jørgensens Fund, and the Danish Medical Research Council. The support of the Marketing Department at the Danish Cancer Society is also greatly appreciated.
Gromov Pavel, Celis Julio E., Gromova Irina, Rank Fritz, Timmermans-Wielenga Vera, Moreira José M.A., (2008), A single lysis solution for the analysis of tissue samples by different proteomic technologies, Molecular Oncology, 2, doi: 10.1016/j.molonc.2008.09.003.
Contributor Information
Pavel Gromov, Email: psg@cancer.dk.
José M.A. Moreira, Email: jom@cancer.dk
References
- Aebersold, R. , Mann, M. , 2003. Mass spectrometry-based proteomics. Nature 422, 198–207. [DOI] [PubMed] [Google Scholar]
- Ben-Kasus, T. , Schechter, B. , Sela, M. , Yarden, Y. , 2007. Cancer therapeutic antibodies come of age: targeting minimal residual disease. Mol. Oncol 1, 42–54. [DOI] [PMC free article] [PubMed] [Google Scholar]
- Blume-Jensen, P. , Hunter, T. , 2001. Oncogenic kinase signaling. Nature 411, 355–365. [DOI] [PubMed] [Google Scholar]
- Bodzon-Kulakowska, A. , Bierczynska-Krzysik, A. , Dylag, T. , Drabik, A. , Suder, P. , Noga, M. , Jarzebinska, J. , Silberring, J. , 2007. Methods for samples preparation in proteomic research. J. Chromatogr. B Analyt. Technol. Biomed. Life Sci. 849, 1–31. [DOI] [PubMed] [Google Scholar]
- Carrette, O. , Burkhard, P.R. , Sanchez, J.C. , Hochstrasser, D.F. , 2006. State-of-the-art two-dimensional gel electrophoresis: a key tool of proteomics research. Nat. Protoc 1, 812–823. [DOI] [PubMed] [Google Scholar]
- Celis, J.E. , Gromov, P. , 2003. Proteomics in translational cancer research: toward an integrated approach. Cancer Cell 3, 9–15. [DOI] [PubMed] [Google Scholar]
- Celis, A. , Rasmussen, H.H. , Celis, P. , Basse, B. , Lauridsen, J.B. , Ratz, G. , Hein, B. , Ostergaard, M. , Wolf, H. , Orntoft, T. , Celis, J.E. , 1999. Short-term culturing of low-grade superficial bladder transitional cell carcinomas leads to changes in the expression levels of several proteins involved in key cellular activities. Electrophoresis 20, 355–361. [DOI] [PubMed] [Google Scholar]
- Celis, J.E. , Gromov, P. , Gromova, I. , Moreira, J.M. , Cabezón, T. , Ambartsumian, N. , Grigorian, M. , Lukanidin, E. , Thor Straten, P. , Guldberg, P. , Bartkova, J. , Bartek, J. , Lukas, J. , Lukas, C. , Lykkesfeldt, A. , Jäättelä, M. , Roepstorff, P. , Bolund, L. , Ørntoft, T. , Brünner, N. , Overgaard, J. , Sandelin, K. , Blichert-Toft, M. , Mouridsen, H. , Rank, F.E. , 2003. Integrating proteomic and functional genomic technologies in discovery-driven translational breast cancer research. Mol. Cell. Proteomics 2, 369–377. [DOI] [PubMed] [Google Scholar]
- Celis, J.E. , Gromov, P. , Cabezón, T. , Moreira, J.M. , Ambartsumian, N. , Sandelin, K. , Rank, F. , Gromova, I. , 2004. Proteomic characterization of the interstitial fluid perfusing the breast tumor microenvironment: a novel resource for biomarker and therapeutic target discovery. Mol. Cell. Proteomics 3, 327–344. [DOI] [PubMed] [Google Scholar]
- Celis, J.E. , Moreira, J.M. , Gromova, I. , Cabezon, T. , Ralfkiaer, U. , Guldberg, P. , Straten, P.T. , Mouridsen, H. , Friis, E. , Holm, D. , Rank, F. , Gromov, P. , 2005. Towards discovery-driven translational research in breast cancer. FEBS J 272, 2–15. [DOI] [PubMed] [Google Scholar]
- Celis, J.E. , Moreira, J.M. , Cabezon, T. , Gromov, P. , Friis, E. , Rank, F. , Gromova, I. , 2005. Identification of extracellular and intracellular signaling components of the mammary adipose tissue and its interstitial fluid in high risk breast cancer patients: toward dissecting the molecular circuitry of epithelial-adipocyte stromal cell interactions. Mol. Cell. Proteomics 4, 492–522. [DOI] [PubMed] [Google Scholar]
- Celis, J.E. , Trentemølle, S. , Gromov, P. , 2006. In Celis J.E., Carter N., Hunter T., Simons K., Small J.V., Shotton D.(Eds.), A Cell Biology. Laboratory Handbook. third ed Gel-based proteomics: high-resolution two-dimensional gel electrophoresis of proteins. Isoelectric focusing and nonequilibrium pH gradient electrophoresis vol. 4, Elsevier Academic Press, Inc; San Diego: 165–174. [Google Scholar]
- Celis, J.E. , Moreira, J.M.A. , Gromov, P. , 2006. In Celis J.E., Carter N., Hunter T., Simons K., Small J.V., Shotton D.(Eds.), A Cell Biology. Laboratory Handbook. third ed Determination of antibody specificity by Western blotting vol. 4, Elsevier Academic Press, Inc; San Diego: 527–532. [Google Scholar]
- Celis, J.E. , Moreira, J.M.A. , Gromova, I. , Cabezón, T. , Gromov, P. , Shen, T. , Timmermans, V. , Rank, F. , 2007. Characterization of breast precancerous lesions and myoepithelial hyperplasia in sclerosing adenosis with apocrine metaplasia. Mol. Oncol 1, 97–119. [DOI] [PMC free article] [PubMed] [Google Scholar]
- Celis, J.E. , Gromova, I. , Cabezón, T. , Gromov, P. , Shen, T. , Timmermans, V. , Rank, F. , Moreira, J.M.A. , 2007. Identification of a subset of breast carcinomas characterized by expression of cytokeratin 15: relationship between CK15+ progenitor/amplified cells and pre-malignant lesions and invasive disease. Mol. Oncol 1, 321–349. [DOI] [PMC free article] [PubMed] [Google Scholar]
- Celis, J.E. , Gromov, P. , Cabezon, T. , Moreira, J.M. , Friis, E. , Jirstrom, K. , Llombart-Bosch, A. , Timmermans-Wielenga, V. , Rank, F. , Gromova, I. , 2008. 15-PGDH expression alone or in combination with ACSM1 defines a subgroup of the apocrine molecular subtype of breast carcinomae. Mol. Cell. Proteomics [Epub ahead of print] [DOI] [PubMed] [Google Scholar]
- Chen, E.I. , Yates, J.R. , 2007. Cancer proteomics by quantitative shotgun proteomics. Mol. Oncol 1, 144–159. [DOI] [PMC free article] [PubMed] [Google Scholar]
- Cravatt, B.F. , Simon, G.M. , Yates, J.R. , 2007. The biological impact of mass-spectrometry-based proteomics. Nature 450, 991–1000. [DOI] [PubMed] [Google Scholar]
- Dominguez, D.C. , Lopes, R. , Torres, M.L. , 2007. Proteomics: clinical applications. Clin. Lab. Sci. 20, 245–248. [PubMed] [Google Scholar]
- Dumur, C.I. , Nasim, S. , Best, A.M. , Archer, K.J. , Ladd, A.C. , Mas, V.R. , Wilkinson, D.S. , Garrett, C.T. , Ferreira-Gonzalez, A. , 2004. Evaluation of quality-control criteria for microarray gene expression analysis. Clin. Chem. 50, 1994–2002. [DOI] [PubMed] [Google Scholar]
- Forrester, S. , Hung, K.E. , Kuick, R. , Kucherlapati, R. , Haab, B.B. , 2007. Low-volume, high-throughput sandwich immunoassays for profiling plasma proteins in mice: identification of early-stage systemic inflammation in a mouse model of intestinal cancer. Mol. Oncol 1, 216–225. [DOI] [PMC free article] [PubMed] [Google Scholar]
- Geho, D.H. , Petricoin, E.F. , Liotta, L.A. , Araujo, R.P. , 2005. Modeling of protein signaling networks in clinical proteomics. Cold Spring Harb. Symp. Quant. Biol. 70, 517–524. [DOI] [PubMed] [Google Scholar]
- Gembitsky, D.S. , Lawlor, K. , Jacovina, A. , Yaneva, M. , Tempst, P. , 2004. A prototype antibody microarray platform to monitor changes in protein tyrosine phosphorylation. Mol. Cell. Proteomics 3, 1102–1118. [DOI] [PubMed] [Google Scholar]
- Görg, A. , Weiss, W. , Dunn, M.J. , 2004. Current two-dimensional electrophoresis technology for proteomics. Proteomics 4, 3665–3685. [DOI] [PubMed] [Google Scholar]
- Gromova, I. , Celis, J.E. , 2006. Protein detection in gels by silver staining: a procedure compatible with mass spectrometry. In Celis J.E., Carter N., Hunter T., Shotton D.(Eds.), Cell Biology. A Laboratory Handbook Academic Press, Inc; San Diego: 219–223. [Google Scholar]
- Haab, B.B., Dunham, M.J., Brown, P.O., 2001. Protein microarrays for highly parallel detection and quantitation of specific proteins and antibodies in complex solutions, Genome Biol. 2, RESEARCH0004. [DOI] [PMC free article] [PubMed]
- Helbich, T.H. , Rudas, M. , Haitel, A. , Kohlberger, P.D. , Thurnher, M. , Gnant, M. , Wunderbaldinger, P. , Wolf, G. , Mostbeck, G.H. , 1998. Evaluation of needle size for breast biopsy: comparison of 14-, 16-, and 18-gauge biopsy needles. Am. J. Roentgenol 171, 59–63. [DOI] [PubMed] [Google Scholar]
- Hober, S. , Uhlén, M. , 2008. Human protein atlas and the use of microarray technologies. Curr. Opin. Biotechnol 19, 30–35. [DOI] [PubMed] [Google Scholar]
- Hunter, T. , Sefton, B. , 1980. Transforming gene product of Rous sarcoma virus phosphorylates tyrosine. Proc. Natl. Acad. Sci. USA 77, 1311–1315. [DOI] [PMC free article] [PubMed] [Google Scholar]
- Issaq, H. , Veenstra, T. , 2008. Two-dimensional polyacrylamide gel electrophoresis (2D-PAGE): advances and perspectives. Biotechniques Apr 44, (5) 697–698. 700 [DOI] [PubMed] [Google Scholar]
- Jain, K.K. , 2008. Innovations, challenges and future prospects of oncoproteomics. Mol. Oncol 2, 153–160. [DOI] [PMC free article] [PubMed] [Google Scholar]
- Jaras, K. , Ressine, A. , Nilsson, E. , Malm, J. , Marko-Vara, G. , Lilja, H. , Laurell, T. , 2007. Reverse-phase versus sandwich antibody microarray, technical comparison from a clinical perspective. Anal. Chem. 79, 5817–5825. [DOI] [PubMed] [Google Scholar]
- Kenny, P.A. , Lee, G.Y. , Myers, C.A. , Neve, R.M. , Semeiks, J.R. , Spellman, P.T. , Lorenz, K. , Lee, E.H. , Barcellos-Hoff, M.H. , Petersen, O.W. , Gray, J.W. , Bissell, M.J. , 2007. The morphologies of breast cancer cell lines in three-dimensional assays correlate with their profiles of gene expression. Mol. Oncol 1, 84–96. [DOI] [PMC free article] [PubMed] [Google Scholar]
- Koomen, J.M. , Haura, E.B. , Bepler, G. , Sutphen, R. , Remily-Wood, E.R. , Benson, K. , Hussein, M. , Hazlehurst, L.A. , Yeatman, T.J. , Hildreth, L.T. , Sellers, T.A. , Jacobsen, P.B. , Fenstermacher, D.A. , Dalton, W.S. , 2008. Proteomic contributions to personalized cancer care. Mol. Cell. Proteomics [Epub ahead of print] [DOI] [PMC free article] [PubMed] [Google Scholar]
- Kruse, U. , Bantscheff, M. , Drewes, G. , Hopf, C. , 2008. Chemical and pathway proteomics: powerful tools for oncology drug discovery and personalized health care. Mol. Cell. Proteomics [Epub ahead of print] [DOI] [PubMed] [Google Scholar]
- Li, J., Gromov, P., Gromova, I., Moreira, J.M., Timmermans-Wielenga, V., Rank, F., Wang, K., Li, S., Li, H., Wiuf, C., Yang, H., Zhang, X., Bolund, L., Celis J.E., 2008. Omics-based profiling of carcinoma of the breast and matched regional lymph node metastasis. Proteomics in press. [DOI] [PubMed]
- Liotta, L.A. , Espina, V. , Mehta, A.I. , Calvert, V. , Rosenblatt, K. , Geho, D. , Munson, P.J. , Young, L. , Wulfkuhle, J. , Petricoin, E.F. , 2003. Protein microarrays: meeting analytical challenges for clinical applications. Cancer Cell 3, 317–325. [DOI] [PubMed] [Google Scholar]
- Loch, C.M. , Ramirez, A.B. , Liu, Y. , Sather, C.L. , Delrow, J.J. , Scholler, N. , Garvik, B.M. , Urban, N.D. , McIntosh, M.W. , Lampe, P.D. , 2007. Use of high density antibody arrays to validate and discover cancer serum biomarkers. Mol. Oncol 1, 313–320. [DOI] [PMC free article] [PubMed] [Google Scholar]
- McDonald, W.H. , Yates, J.R. , 2003. Shotgun proteomics: integrating technologies to answer biological questions. Curr. Opin. Mol. Ther 5, 302–309. [PubMed] [Google Scholar]
- O'Farrell, P.H. , 1975. High resolution two-dimensional electrophoresis of proteins. J. Biol. Chem. 250, 4007–4021. [PMC free article] [PubMed] [Google Scholar]
- Ornstein, D.K. , Gillespie, J.W. , Paweletz, C.P. , Duray, P.H. , Herring, J. , Vocke, C.D. , Topalian, S.L. , Bostwick, D.G. , Linehan, W.M. , Petricoin, E.F. , Emmert-Buck, M.R. , 2000. Proteomic analysis of laser capture microdissected human prostate cancer and in vitro prostate cell lines. Electrophoresis 21, 2235–2242. [DOI] [PubMed] [Google Scholar]
- Rabilloud, T. , Luche, S. , Santoni, V. , Chevallet, M. , 2007. Detergents and chaotropes for protein solubilization before two-dimensional electrophoresis. Methods Mol. Biol. 355, 111–119. [DOI] [PubMed] [Google Scholar]
- Rapkiewicz, A. , Espina, V. , Zujewski, J. , Lebowitz, P.F. , Filie, A. , Wulfkuhle, J. , Camphausen, K. , Petricoin, E.F. , Liotta, L.A. , Abati, A. , 2007. The needle in the haystack: application of breast fine-needle aspirate samples to quantitative protein microarray technology. Cancer 111, 173–184. [DOI] [PubMed] [Google Scholar]
- Riegman, P.H.J. , Morente, M.M. , Betsou, F. , de Blasio, P. , Geary, P. , 2008. The Marble Arch International Working Group on Biobanking for Biomedical Research. Biobanking for better healthcare Mol. Oncol 2, 213–222. [DOI] [PMC free article] [PubMed] [Google Scholar]
- Reymond, M.A. , Schlegel, W. , 2007. Proteomics in cancer. Adv. Clin. Chem. 44, 103–142. [DOI] [PubMed] [Google Scholar]
- Rifai, N. , Gillette, M.A. , Carr, S.A. , 2006. Protein biomarker discovery and validation: the long and uncertain path to clinical utility. Nat. Biotechnol 24, 971–983. [DOI] [PubMed] [Google Scholar]
- Shevchenko, A. , Wilm, M. , Vorm, O. , Mann, M. , 1996. Mass spectrometric sequencing of proteins silver-stained polyacrylamide gels. Anal. Chem. 68, 850–858. [DOI] [PubMed] [Google Scholar]
- Simpson, R.J. , Bernhard, O.K. , Greening, D.W. , Moritz, R.L. , 2008. Proteomics-driven cancer biomarker discovery: looking to the future. Curr. Opin. Chem. Biol. 12, 72–77. [DOI] [PubMed] [Google Scholar]
- Suzuki, M. , Tarin, D. , 2007. Gene expression profiling of human lymph node metastases and matched primary breast carcinomas: clinical implications. Mol. Oncol 1, 172–180. [DOI] [PMC free article] [PubMed] [Google Scholar]
- Weiss, W. , Görg, A. , 2008. Sample solubilization buffers for two-dimensional electrophoresis. Methods Mol. Biol. 424, 35–42. [DOI] [PubMed] [Google Scholar]
- Weissenstein, U. , Schneider, M.J. , Pawlak, M. , Cicenas, J. , Eppenberger-Castori, S. , Oroszlan, P. , Ehret, S. , Geurts-Moespot, A. , Sweep, F.C. , Eppenberger, U. , 2006. Protein chip based miniaturized assay for the simultaneous quantitative monitoring of cancer biomarkers in tissue extracts. Proteomics 6, 1427–1436. [DOI] [PubMed] [Google Scholar]
- Wingren, C. , Borrebaeck, C.A. , 2006. Antibody microarrays: current status and key technological advances. OMICS 10, 411–427. [DOI] [PubMed] [Google Scholar]
- Wulfkuhle, J.D. , Aquino, J.A. , Calvert, V.S. , Fishman, D.A. , Coukos, G. , Liotta, L.A. , Petricoin, E.F. , 2003. Signal pathway profiling of ovarian cancer from human tissue specimens using reverse-phase protein microarrays. Proteomics 3, 2085–2090. [DOI] [PubMed] [Google Scholar]