

Abstract
The balance of activity between the endogenous enzyme inhibitors known as tissue inhibitors of metalloproteinases and their targets, the matrix metalloproteinases, in the extracellular matrix is thought to play an important role in tumour cell invasion. Supporting this notion, we have shown that colorectal cancer patients have increased plasma levels of the tissue inhibitor of metalloproteinases‐1 (TIMP‐1), and that high plasma TIMP‐1 levels are associated with short colorectal cancer patient survival. However, although TIMP‐1 has been extensively studied in cancer, very little is known about how it is regulated. To further elucidate potential mechanisms of regulation of this protein, we did a number of experiments to look at associations between the transcript profile of TIMP‐1 with known matrix metalloproteinases (MMPs) as well as with expression profiles of other genes differentially regulated in human colorectal cancer (CRC) and the other TIMPs 2–4, which have also been associated with the progression of colorectal cancer. Genome‐wide expression profiling of 172 CRC and normal mucosa samples was used to identify transcript changes for the genes under investigation. We found that TIMP‐1 was up‐regulated in CRC samples compared with normal tissue, while TIMP‐2 was down‐regulated. Eight MMPs were up‐regulated in CRC compared with normal tissue. Correlating up‐regulated genes with the TIMP‐1 transcript, we identified 13 that were also up‐regulated in cancerous tissue. Among these were genes associated with the synthesis of extracellullar matrix, genes involved in the TGF‐beta signalling pathway, and genes that are likely transcribed by the tumour cells. These insights add to the complex picture emerging about the regulation of TIMPs in colorectal cancer.
Keywords: Colorectal cancer, TIMP-1, Gene expression profiling
1. Introduction
A better biological understanding of colorectal cancer (CRC) biology, the third most frequent cancer type in the Western world, is imperative for improving patient treatment and thereby patient prognosis. We and others have focused our work on the biological role of the naturally occurring endogenous Tissue Inhibitors of Metalloproteinases (TIMPs) in cancer. The TIMPs, now encompassing TIMP‐1 to ‐4, can complex with most of the metalloproteinases (MMPs) and thereby inhibit proteolysis. This inhibition should, in theory, inhibit cancer progression. Moreover, it has been suggested that the TIMPs are co‐regulated with the MMPs, i.e., that high MMP activity would induce a comparable high TIMP activity. However, the TIMPs have been shown to have functions being distinct from their anti‐proteinase functions. For TIMP‐1, these functions include stimulation of cell proliferation (Westbrook et al., 1984), inhibition of apoptosis (Guedez et al., 1998; Liu et al., 2003) and regulation of angiogenesis (Akahane et al., 2004), all functions which could facilitate cancer progression. In relation to apoptosis recent studies have suggested that TIMP‐1 could be associated with resistance to chemotherapy‐induced apoptosis in cancer cells (Davidsen et al., 2006; Schrohl et al., 2006; Sorensen et al., 2007) and one recent study has shown that in MCF10A cells TIMP‐1 exerts its anti‐apoptotic mechanism by interaction with CD63 and integrin beta 1 (ITGB1) on the plasma membrane (Jung et al., 2006). That TIMP‐1 in particular is involved in tumour progression is further supported by many clinical studies demonstrating a highly significant association between high tumour tissue or blood TIMP‐1 concentration and poor patient prognosis (Holten‐Andersen et al., 2000, 2002, 2004). However, much is still to be learned on the biological role of TIMPs in cancer progression.
The aim of this study was to investigate the regulation of TIMP‐1 in CRC as well as investigate the relationship and interactions between transcripts of MMPs and TIMPs in CRC. To gain further insight into the mechanisms that may influence TIMP‐1 expression we also included the expression data of genes that were found correlated with the expression of TIMP‐1.
2. Experimental procedures
2.1. Tissue samples and patient information
A total number of 172 CRC patient tissue samples obtained from hospitals in Denmark, Finland and The Netherlands, comprising 10 normal colon mucosae from the resection edge, 149 stage II (Dukes B) and 13 stage III (Dukes C) adenocarcinomas from patients with sporadic CRC was previously analysed on microarrays. This dataset was previously used in two publications, and clinical information such as age, sex, microsatellite stability/instability (MSS/MSI) status can be found in the supplementary (Birkenkamp‐Demtroder et al., 2007; Mansilla et al., 2007). Studies were approved by the local ethical committees of all the involved clinics, and patients gave informed consent prior to surgery.
An independent set of samples comprising 25 normal mucosae and 22 adenocarcinomas from the proximal and distal colon were also analysed. Ten of the 25 normal samples have been previously used for quantitative PCR analysis (Mansilla et al., 2007). The 22 adenocarcinomas comprised Dukes A (2),B (6),C (9), and D (5). Nine of the 22 adenocarcinomas were accompanied by their paired normal mucosa. The 22 adenocarcinomas and 15 of the normal samples had previously been analysed on HU6800 microarrays comparing gene expression in distal versus proximal colon (Birkenkamp‐Demtroder et al., 2005).
2.2. Genome‐wide microarray expression profiling
Genome‐wide microarray expression profiling was performed using Affymetrix U133.plus.2.0 GeneChips and data were normalized as previously described (Kruhoffer et al., 2005). Expression values are given in “log2” where indicated. All sequences of the TIMP‐1 to ‐4 Affymetrix probe sets were BLASTed and the probes located at the 3′ end of the coding region or the 3′ UTR region of the human TIMP sequences.
Identification of genes correlating with the TIMP‐1 transcript profile was selected based on the following criteria: Pearson correlation coefficient >0.6; significantly differentially expressed between normal mucosa and tumour tissue (p<0.05, two‐tailed Student's t‐test), log2 ratio normalized to zero >1.1 or <−1.1 and expression level of log2 >3.
2.3. Ingenuity pathway analysis (IPA)
Transcript expression values (log2) from 10 normal colon mucosae, 149 stage II and 13 stage III colon adenocarcinomas were normalized around zero. Probe sets with an intensity value of log2<2 were excluded from analysis. Normalized ratios given as ([−INF, −1] and [+1, +INF]) were submitted to IPA (2000–2008 Ingenuity Systems).
2.4. Quantitative PCR
Differences in gene expression between tumour tissue and normal tissue were verified by quantitative PCR (Q‐PCR) for selected genes: TIMP‐1, TGF‐B1, TNF‐AIP6, LOXL‐2, Activin A (INHBA) and MMP28. For these analyses RNA was extracted from 22 CRC tumours and 25 normal mucosa samples using Trizol (Gibco Life Technologies, Invitrogen Corporation, Carlsbad, CA) and 12μg RNA was reverse transcribed to cDNA using the SuperScript Choice System (Invitrogen Corporation, Carlsbad, CA) as previously described (Birkenkamp‐Demtroder et al., 2005). All primers were intron spanning to avoid detection of contaminating DNA and beta‐actin was used as reference gene. The primer sequences were: TIMP‐1 forward: 5′‐CTT CTG GCA TCC TGT TGT TG‐3′, TIMP‐1 reverse: 5′‐GGT ATA AGG TGG TCT GGT TG‐3′; TGF‐B1 forward: 5′‐GAG CCT GAG GCC GAC TAC TA‐3′, TGF‐B1 reverse: 5′‐GGG TTC AGG TAC CGC TTC TC‐3′; TNF‐AIP6 forward: 5′‐ACC ACA GAG AAG CAC GGT CT‐3′, TNF‐AIP6 reverse: 5‐‘CAA CTC TGC CCT TAG CCA TC‐3′; LOXL‐2 forward: 5′‐CCG GGT GGA GGT GTA CTA TG‐3′, LOXL2 reverse: 5′‐TCG TTG CCA GTA CAG TGG AG‐3′; INHBA forward: 5′‐CCT CGG AGA TCA TCA CGT TT‐3′, INHBA reverse: 5′‐CCC TTT AAG CCC ACT TCC TC‐3′; MMP28 forward: 5′‐CAA TGA ACA GGT CCC CAA AG‐3′, MMP28 reverse: 5′‐GGC CGC ATA ACT GTT GGT AT‐3′ and beta actin forward: 5′‐CGT GGG CCG CCC TAG GCA CCA‐3′, beta actin reverse: 5′‐TTG GCC TTA GGG TTC AGG GGG G‐3′. All samples were measured in duplicate. Q‐PCR was carried out using SYBR Green I detection and the LightCycler 480 (Roche Diagnostics, Hvidovre, Denmark). Reactions were carried out in 96 well plates with 2μl cDNA in 20μl reaction volumes consisting of 1× FastStart Master SYBR Green Mix and 0.5μM of the gene‐specific primers. The amplification programme was as follows: Preincubation for Fast Start Polymerase activation at 95°C for 5min, followed by 45 amplification cycles (95°C for 10s (20°C/s), 60°C for 10s (20°C/s), and 72°C for 10–12s (20°C/s). SYBR Green fluorescence was acquired at 72°C in each amplification cycle. After the end of the last cycle the melting curve was generated by starting the fluorescence acquisition at 65°C and taking measurements every 0.1s until 95°C was reached. Relative quantification was done using the Relative Quantification software (LightCycler, Roche, Denmark).
2.5. Statistical analysis
Statistical Analysis was performed using STATA9.2 (Statacorp, Texas, USA). A two‐tailed Student's t‐test was applied and p‐values <0.05 were considered as statistically significant.
3. Results
The TIMP‐1 to ‐4 transcript expression levels were determined by genome wide microarray transcript profiling of 10 normal colon mucosae, 149 stage II, and 13 stage III colon adenocarcinomas as shown in Figure 1. The TIMP‐1 transcript was significantly up‐regulated >5‐fold in stage II (p=4.9E‐23) and stage III (p=2.2.E‐06) colon adenocarcinomas, as compared with normal mucosa, while the TIMP‐2 transcript was down‐regulated 2‐fold in stage II (p=1.9E‐02) and stage III (p=2.2.E‐02) cancers. TIMP‐3 was not differentially expressed between cancer and normal tissue and the TIMP‐4 transcript was below detection level in all samples. Detailed expression values of TIMP‐1 to ‐4 are given in Table 1.
Figure 1.
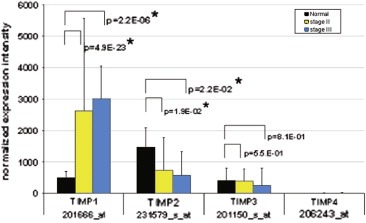
U133plus.2.0 microarray transcript profiling of TIMP‐1 to ‐4. TIMP‐1 was significantly up‐regulated in stage II and stage III colon adenocarcinomas as compared with normal colon mucosa, while TIMP‐2 was significantly down‐regulated in the tumour tissue.
Table 1.
Detailed expression values of TIMP‐1 to ‐4
| Mean | Std. dev. | Median | Std. err. | [95% conf. interval] | ||
|---|---|---|---|---|---|---|
| Normal (n=10) | ||||||
| TIMP‐1 | 521.87 | 200.39 | 498.81 | 63.37 | 378.52 | 665.23 |
| TIMP‐2 | 1628.59 | 610.48 | 1472.14 | 193.05 | 1191.88 | 2065.30 |
| TIMP‐3 | 536.53 | 396.67 | 408.32 | 125.44 | 252.77 | 820.30 |
| TIMP‐4 | 7.06 | 0.94 | 7.04 | 0.29 | 6.39 | 7.74 |
| Stage II (n=149) | ||||||
| TIMP‐1 | 3426.92 | 2940.06 | 2633.45 | 240.85 | 2950.95 | 3902.88 |
| TIMP‐2 | 1061.69 | 1046.37 | 736.02 | 85.72 | 892.29 | 1231.08 |
| TIMP‐3 | 456.55 | 368.2655 | 398.19 | 30.16 | 396.93 | 516.17 |
| TIMP‐4 | 12.23 | 13.88 | 7.03 | 1.13 | 9.98 | 14.47 |
| Stage III (n=13) | ||||||
| TIMP‐1 | 2849.46 | 1030.91 | 3014.31 | 285.92 | 2226.49 | 3472.43 |
| TIMP‐2 | 926.57 | 746.19 | 736.02 | 206.95 | 475.65 | 1377.49 |
| TIMP‐3 | 488.99 | 551.74 | 259.57 | 153.02 | 155.58 | 822.41 |
| TIMP‐4 | 19.11 | 23.22 | 13.58 | 6.44 | 5.07 | 33.14 |
The encoded proteins of the CD63 and ITGB1 genes are known to interact with TIMP‐1 (Jung et al., 2006). Figure 2 shows that the CD63 transcript as determined by the genome wide microarray expression profiling is significantly down‐regulated in stage II (median, p=3.2.E‐17) and to a lesser extent in stage III (median, p=2.1E‐04) in adenocarcinomas as compared with normal mucosa. ITGB1 was not found to be differentially expressed.
Figure 2.
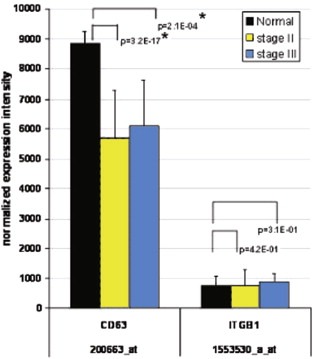
Microarray transcript profiling of CD63 and ITGB1. CD63 was significantly down‐regulated in stage II and stage III colon adenocarcinomas as compared with normal colon mucosa (marked with asterisk), while ITGB1 showed the same expression level in all three groups.
Spearman correlation analysis was done for TIMP‐1 to ‐4 as shown in Table 2. The strongest correlation was seen between TIMP‐2 and TIMP‐3 (r=0.77). A strong correlation was also found between TIMP‐1 and TIMP‐2 (r=0.62) and to a lesser extent between TIMP‐1 and TIMP‐3 (r=0.49).
Table 2.
Spearman correlation analyses performed on transcript expression values of 162 colon adenocarcinomas (149 stage II, 13 stage III)
| r | 95% CI | p‐Value | |
|---|---|---|---|
| TIMP‐1/TIMP‐2 | 0.62 | 0.51–0.71 | <0.0001 |
| TIMP‐1/TIMP‐3 | 0.49 | 0.36–0.60 | <0.0001 |
| TIMP‐1/TIMP‐4 | 0.05 | −0.10–0.20 | 0.509 |
| TIMP‐2/TIMP‐3 | 0.77 | 0.69–0.82 | <0.0001 |
| TIMP‐2/TIMP‐4 | 0.08 | −0.07–0.24 | 0.286 |
| TIMP‐3/TIMP‐4 | 0.03 | −0.12–0.18 | 0.696 |
A Pearson correlation analysis was then performed for TIMP‐1 to ‐4 and the 23 MMPs represented on the GeneChips as shown in Table 3. MMPs marked with an asterisk were significantly different between tumour and normal mucosa and showed a correlation coefficient >0.5 with at least one of TIMP‐1 to ‐3. The transcripts of TIMP‐1 to ‐3 showed a relatively good correlation with the transcripts of MMPs 2, 9, 11, 14 and 19. TIMP‐1 correlated very well with the transcripts of MMPs 1, 2, 9, 11 and 14. In particular, MMP2 was highly correlating with TIMP‐1 to ‐3, the best correlation was seen for TIMP‐2 (r=0.88). None of the MMPs correlated with TIMP‐4.
Table 3.
Pearson correlation analysis of 23 different MMPs with the four TIMPs
| Gene | Probe set | Median log2 | p‐value | log2 ratio | Pearson correlation coefficient | ||||||
|---|---|---|---|---|---|---|---|---|---|---|---|
| Normal | Tumour | TIMP‐1 | TIMP‐2 | TIMP‐3 | TIMP‐4 | ||||||
| 201666_at | 231579_s_at | 201150_s_at | 206243_at | ||||||||
| MMP1 | 204475_at | 5.16 | 10.43 | 8.36E‐09 | 5.26 | ↑ | * | 0.52 | 0.40 | 0.38 | 0.00 |
| MMP2 | 201069_at | 7.96 | 8.62 | 1.97E‐03 | 0.66 | ↑ | * | 0.67 | 0.88 | 0.70 | 0.05 |
| MMP3 | 205828_at | 3.38 | 9.08 | 1.05E‐32 | 5.71 | ↑ | 0.44 | 0.28 | 0.29 | −0.05 | |
| MMP7 | 204259_at | 2.69 | 6.22 | 1.04E‐12 | 3.53 | ↑ | 0.22 | 0.17 | 0.17 | 0.01 | |
| MMP8 | 207329_at | 2.07 | 2.05 | 2.70E‐01 | −0.01 | 0.19 | 0.15 | 0.12 | 0.02 | ||
| MMP9 | 203936_s_at | 5.02 | 7.19 | 2.06E‐04 | 2.17 | ↑ | * | 0.58 | 0.58 | 0.42 | −0.03 |
| MMP10 | 205680_at | 2.49 | 3.87 | 2.38E‐26 | 1.38 | ↑ | 0.30 | 0.08 | 0.03 | 0.02 | |
| MMP11 | 203878_s_at | 4.27 | 5.77 | 2.34E‐13 | 1.50 | ↑ | * | 0.32 | 0.50 | 0.54 | −0.14 |
| MMP12 | 204580_at | 9.43 | 10.34 | 1.50E‐01 | 0.91 | 0.36 | 0.33 | 0.22 | −0.01 | ||
| MMP13 | 205959_at | 2.41 | 2.41 | 4.23E‐04 | 0.00 | 0.31 | 0.28 | 0.27 | 0.05 | ||
| MMP14 | 202827_s_at | 2.88 | 5.38 | 1.09E‐40 | 2.50 | ↑ | * | 0.51 | 0.56 | 0.44 | 0.05 |
| MMP15 | 203365_s_at | 7.18 | 6.60 | 8.22E‐02 | −0.58 | −0.31 | −0.27 | −0.26 | 0.06 | ||
| MMP16 | 207012_at | 2.36 | 2.33 | 1.98E‐01 | −0.03 | −0.06 | −0.08 | −0.09 | 0.04 | ||
| MMP17 | 206234_s_at | 2.34 | 2.34 | 2.04E‐01 | 0.00 | 0.03 | 0.10 | −0.02 | −0.03 | ||
| MMP19 | 204575_s_at | 3.15 | 3.17 | 6.37E‐02 | 0.02 | 0.55 | 0.60 | 0.51 | 0.01 | ||
| MMP20 | 207599_at | 2.50 | 2.47 | 6.83E‐01 | −0.03 | 0.02 | 0.12 | 0.07 | −0.03 | ||
| MMP21 | 1552592_at | 2.62 | 2.58 | 1.68E‐01 | −0.04 | −0.21 | −0.29 | −0.17 | 0.05 | ||
| MMP23A/MMP23B | 207118_s_at | 2.01 | 2.01 | 3.35E‐01 | −0.01 | 0.12 | 0.22 | 0.17 | 0.00 | ||
| MMP24 | 213171_s_at | 2.92 | 2.91 | 8.90E‐01 | −0.01 | 0.02 | −0.02 | 0.02 | 0.00 | ||
| MMP25 | 207890_s_at | 2.97 | 2.96 | 9.23E‐01 | −0.01 | 0.37 | 0.21 | 0.14 | 0.08 | ||
| MMP26 | 220541_at | 2.06 | 2.05 | 2.50E‐01 | −0.01 | −0.02 | −0.01 | −0.08 | −0.06 | ||
| MMP27 | 220783_at | 2.17 | 2.15 | 2.08E‐02 | −0.02 | −0.13 | −0.13 | −0.07 | 0.06 | ||
| MMP28 | 239272_at | 8.11 | 3.80 | 2.38E‐10 | −4.31 | ↓ | −0.05 | 0.17 | −0.02 | 0.12 | |
Five of the nine matrix metalloproteinases, marked with an asterisk, are differently regulated from normal to tumour tissue and correlate significantly with at least one of the TIMPs. Median log2 expression values were normalized around zero. Genes significantly regulated are marked with an arrow.
Of the 23 different MMPs, the transcript levels of 8 MMPs were identified to be significantly up‐regulated from normal to tumour, whereas only one, MMP28, was significantly down‐regulated as shown in Table 3. The most remarkable differences were detected for MMPs 1, 3, 7, and 28.
In addition to the correlation of TIMP‐1 with other TIMPs and MMPs, we identified a group of 13 genes correlating with the TIMP‐1 transcript profile as shown in Table 4.
Table 4.
Pearson correlation analysis of 13 genes correlating with the TIMP‐1 transcript
| Gene | Gene name | Median log2 | p‐value | log2 ratio | Pearson correlation coefficient | ||
|---|---|---|---|---|---|---|---|
| Normal | Tumour | TIMP‐1 201666_at | |||||
| BGN | biglycan | 4.9 | 6.7 | 1.34E‐07 | 1.8 | ↑ | 0.648 |
| biglycan/serologically defined colon cancer | |||||||
| BGN/SDCCAG33 | antigen 33 | 4.2 | 6.8 | 8.80E‐07 | 2.6 | ↑ | 0.660 |
| COL1A1 | collagen, type I, alpha 1 | 8.1 | 11.2 | 5.30E‐10 | 3.1 | ↑ | 0.653 |
| COL6A2 | collagen, type VI, alpha 2 | 7.0 | 8.8 | 3.21E‐03 | 1.8 | ↑ | 0.652 |
| SPON2 | spondin 2 | 5.8 | 7.8 | 4.12E‐07 | 2.0 | ↑ | 0.609 |
| LOXL2 | lysyl oxidase‐like 2 | 5.5 | 7.5 | 1.88E‐11 | 2.1 | ↑ | 0.653 |
| TGFB1 | transforming growth factor, beta 1 | 2.9 | 5.2 | 4.81E‐24 | 2.3 | ↑ | 0.631 |
| INHBA | inhibin, beta A (activin A) | 3.2 | 6.1 | 2.09E‐13 | 2.9 | ↑ | 0.711 |
| PLAU | urokinase plasminogen activator | 4.6 | 7.3 | 1.08E‐05 | 2.7 | ↑ | 0.613 |
| TNFAIP6 | tumour necrosis factor, alpha‐induced protein 6 | 3.2 | 4.4 | 1.47E‐04 | 1.2 | ↑ | 0.687 |
| NNMT | nicotinamide N‐methyltransferase | 4.9 | 6.8 | 4.23E‐03 | 2.0 | ↑ | 0.646 |
| ICAM1 | intercellular adhesion molecule 1 (CD54) | 3.8 | 5.7 | 9.75E‐05 | 1.9 | ↑ | 0.637 |
| THY1 | Thy‐1 cell surface antigen | 4.8 | 6.8 | 2.82E‐06 | 2.0 | ↑ | 0.627 |
Median log2 expression values were normalized around zero. All are significantly up‐regulated (arrow) in tumour tissue compared to normal mucosa.
Ingenuity pathway analysis was performed using median log2 transcript expression data from the 172 colon tissue samples. Data were applied to the 36 genes listed in Tables 3 and 4; 18 of these were correlating with TIMP‐1 expression. Hereof, about 50% are known to be associated with cell migration, invasion and/or adhesion and for the majority of these genes a direct or indirect interaction with TIMP‐1 was identified as depicted in Figure 3A. Most of the genes affecting TIMP‐1 (Figure 3B) or genes affected by TIMP‐1 (Figure 3C) were identified to be differentially expressed in colorectal cancer when compared to normal mucosa.
Figure 3.
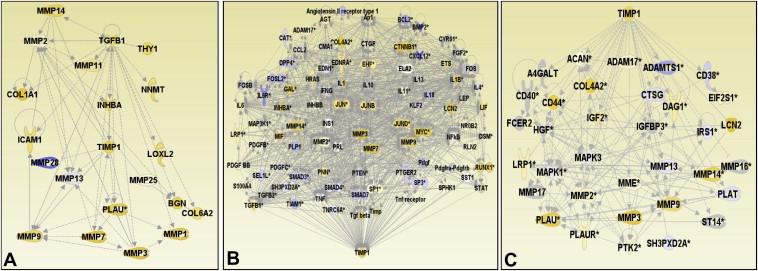
Ingenuity pathway analysis. Transcripts up‐regulated in colon adenocarcinomas (n=162) compared to normal mucosa (n=10) are shown in yellow, those down‐regulated in the tumours are shown in blue. (A) A network comprising 20 genes directly or indirectly interacting with TIMP‐1 and investigated in this study. (B,C) The majority of genes located upstream (B) or downstream (C) from TIMP‐1, directly or indirectly being affected by TIMP1 or affecting the TIMP1 expression or activity, respectively, were identified to be differentially expressed in colorectal cancer.
Using quantitative PCR on the independent sample set, we verified the up‐regulation of TIMP‐1 in tumour samples as compared with normal tissue (ratio 4.5, p=0.0001). Furthermore, we verified the up‐regulation of TGF‐B1 (ratio 3.7, p=0.004), TNF‐AIP6 (ratio 9.3, p=0.02), LOXL‐2 (ratio 8.1, p=0.0001) and Activin A (INHBA) (ratio 69, p=0.0001). The four genes were selected based on either a high correlation with TIMP‐1 or a very low p‐value in the array analysis. We also verified the correlation of the selected genes with TIMP‐1 in the tumour samples. For TGF‐B1 (r=0.64) and LOXL2 (r=0.67) we found correlation values comparable to the ones obtained in the array analysis. For TNF‐AIP6 (r=0.54) and INHBA (r=0.55) the correlation values were lower compared with what was found in the array analysis.
As MMP28 was the only down‐regulated gene we also included this in the quantitative PCR analysis. A tendency towards down‐regulation in tumour tissue of MMP28 (ratio 0.34, p=0.09) was found. No correlation between MMP28 and TIMP‐1 (r=0.17) could be demonstrated which is in agreement with the array‐analysis.
4. Discussion
TIMP‐1 has recently gained increasing interest as a protein biomarker in cancer, either analysed in tumour tissue or in corresponding plasma samples (Holten‐Andersen et al., 2000, 2002, 2004, 2006, 2007). Furthermore, recent studies have implicated TIMP‐1 as an important new target for anti‐cancer therapy (Davidsen et al., 2006). However, little is at present known about the regulation of TIMP‐1 in cancer. The aim of this study was therefore to gain further insight into regulatory mechanisms being associated with transcript expression of TIMP‐1 in cancer patients. This was accomplished by 1) analysing genome wide expression profiles of 172 tissue samples from colorectal adenocarcinomas and normal colon mucosae from the resection edge and then correlating the expression of TIMP‐1 with TIMP‐2 to ‐4 and MMPs and 2) identifying other gene transcripts which were correlated with the expression profile of TIMP‐1.
The transcript profiling dataset used in this study has previously been used for expression profiling studies of DHHC9 and KRT23, both genes strongly up‐regulated in colon adenocarcinomas showing expression differences between MSS and MSI tumours. In these two publications we did not analyse MMPs or TIMPs (Birkenkamp‐Demtroder et al., 2007; Mansilla et al., 2007).
The relationship between expression of MMPs and TIMPs in CRC has been the subject of intensive studies (reviewed by Zucker and Vacirca, 2004). However, no study has to our knowledge analysed changes in gene expression of all MMPs and TIMPs simultaneously.
The main findings of the present study were that TIMP‐1 was found to be the only of the TIMPs being significantly up‐regulated in CRC. Furthermore, among the MMPs, eight were found up‐regulated and one down‐regulated in CRC. When looking for interactions, a significant association was found between TIMP‐1 and TIMP‐2 and ‐3. For the MMPs the most significant correlation was found between MMP2 and TIMP‐1, ‐2 and ‐3. Thus, our data speaks against a general co‐regulation of MMPs and TIMPs as an explanation to the findings of high TIMP‐1 levels in CRC. Other genes associated with the expression of TIMP‐1 were genes involved in the regulation of the extracellular matrix and genes involved in activation of MMPs.
In line with other published papers we found that TIMP‐1 is up‐regulated (Guillem et al., 1990) while TIMP‐2 is down‐regulated (Baker et al., 2000) in the tumour tissue. We did not find any significant regulation of TIMP‐3 and the expression of TIMP‐4 was almost at the detection limit of the analysis. Other studies have shown that TIMP‐3 expression is absent in poorly differentiated carcinomas as compared with normal tissue (Powe et al., 1997). This difference to our study may be explained by the fact that the majority of samples analysed in the present study were obtained from well‐differentiated stage II tumours.
The MMPs are subdivided into six subgroups based on their structure and substrate specificity: collagenases (MMP1, 8 and 13), gelatinases (MMP2 and 9), stromelysin and stromelysin‐like MMPs (MMP3, 7, 10, 11 and 12), Membrane‐type MMPs (MMP14, 15, 16, 17, 24 and 25), and other MMPs (MMP19, 20, 21, 23 and 28) (Nagase and Woessner, 1999; Bister et al., 2004). We identified nine MMPs that were differently regulated in tumour samples as compared with normal colon mucosa. While MMP28 was down‐regulated in tumour tissue, the remaining MMPs belonging to the group of collagenases (MMP1), stromelysins (MMPs 3, 7, 10 and 11) or gelatinases (MMPs 2 and 9) were significantly up‐regulated. These findings are in agreement with other studies (for review see Zucker and Vacirca, 2004). It is thus clear that a broad range of MMPs involved directly in the breakdown of the extracellular matrix are up‐regulated in the CRC tumour tissue. In contrast, MMP14 was the only one of the membrane type MMPs being up‐regulated, suggesting that this group of enzymes may not play an important role in the progression of CRC.
When looking for a correlation between MMPs and TIMPs we observed the strongest correlation between MMP2 and TIMP‐1 to ‐3, even though MMP2 only showed a minimal but significant increase in expression level.
It has been shown that TIMP‐1 has other effects besides inhibiting the action of the MMPs, including inhibition of apoptosis (Liu et al., 2005; Davidsen et al., 2006). One study by Jung et al. (2006) showed that the TIMP‐1 protein may exert its anti‐apoptotic function by interaction with the CD63 cell surface antigen and Integrin Beta 1 (ITGB1). In our study a Pearson correlation analyses did not show any correlation between the transcripts of TIMP‐1, CD63 and ITGB1. However, the CD63 transcript was significantly down‐regulated in CRC as compared with normal mucosa.
We also identified 13 genes the expression of which correlated with the TIMP‐1 transcript profile (Table 4). Among these were a number of genes associated with the synthesis of extracellullar matrix (collagen, biglycan and spondin 2). It has been shown that TIMP‐1 mRNA and protein is localized to the fibroblasts located at the invasive front of CRC tissue (Holten‐Andersen et al., 2005). Since these fibroblasts are the likely source of extracellular matrix as well, it is not surprising that the expression of these three genes correlates with the TIMP‐1 gene expression.
Two of the other TIMP‐1 correlating genes (TGF‐B1 and INHBA1, the latter encoding inhibin A (activin A)) belong to the family of TGF beta genes and are thereby involved in the TGF beta signalling pathways. Both of these genes have previously been reported to be over‐expressed in CRC tumour cells (Wildi et al., 2001; Daniel et al., 2007). TGF‐B1 is known to regulate extracellular matrix production by stimulation of fibroblasts (Matsushita et al., 1999) and to induce the expression of urokinase plasminogen activator (uPA) and MMP2 in epithelial cancers (Sieuwerts et al., 1998; Ellenrieder et al., 2001; Tanaka et al., 2004). The uPA protein, encoded by urokinase plasminogen activator gene (PLAU) was also found to be up‐regulated and to correlate with TIMP‐1. INHBA is involved in the TGF beta signalling pathway as it binds to the transforming growth factor beta receptor and has been reported to be over‐expressed in colorectal cancer (Wildi et al., 2001).
Lysyl oxidase 2 (LOXL2) has been shown to be produced by cancer cells (Fong et al., 2007). It has several functions, among which one is biogenesis of connective tissue, another is down‐regulation of E‐cadherin, and LOXL2 thus has the potential to promote tumour progression (Peinado et al., 2005). The nicotinamide N‐methyl transferase (NNMT) transcript was also correlated to TIMP‐1 expression. NNMT has previously been shown to be up‐regulated in colon adenocarcinomas as compared with normal mucosa (Birkenkamp‐Demtroder et al., 2002).
Thus these genes are all known to be up‐regulated in cancer. If the correlation to TIMP‐1 is due to specific mechanisms regulating transcription or a result of malignancy independent of TIMP‐1 transcription remains unknown.
Quantitative PCR validated the up‐regulation of TIMP‐1, TGF‐B1, LOXL2, TNF‐AIP6 and INHBA in tumour samples as compared with normal mucosa and corroborated the correlation of these genes with the TIMP‐1 transcript as found by the genome wide expression profiling. Quantitative PCR yielded a higher ratio between tumour and normal samples compared to the ratio obtained from Genechip. However, the two methods differ in sensitivity and sequence and location of probes and primers within the transcript and the variation is likely due to these differences.
In conclusion, TIMP‐1 (and ‐2 and ‐3) correlates with the expression of a limited number of MMPs, in particular MMP2. Other genes that correlated with TIMP‐1 in CRC are either genes expressed in fibroblasts (the cells that express TIMP‐1 and which produce the main components of the extracellular matrix) or genes found in the tumour cells.
Acknowledgements
The authors would like to thank the John and Birthe Meyer Foundation, the Raimond and Dagmar Ringgaard‐Bohns Foundation, The Danish Cancer Society, The Danish Medical Research Counsel, The Novo Nordisk Foundation, The Beckett Foundation, The Obel Family Foundation, The Johannes Fog Foundation, The Anders Kaaresens Foundation, The IMK Foundation, The Kathrine and Vigo Skovgaard Foundation and the A.P. Møller Foundation for the Advancement of Medical Science for funding.
Offenberg Hanne, Brünner Nils, Mansilla Francisco, Ørntoft Torben F., Birkenkamp-Demtroder Karin, (2008), TIMP‐1 expression in human colorectal cancer is associated with TGF‐B1, LOXL2, INHBA1, TNF‐AIP6 and TIMP‐2 transcript profiles, Molecular Oncology, 2, doi: 10.1016/j.molonc.2008.06.003.
References
- Akahane, T. , Akahane, M. , Shah, A. , Connor, C.M. , Thorgeirsson, U.P. , 2004. TIMP-1 inhibits microvascular endothelial cell migration by MMP-dependent and MMP-independent mechanisms. Experimental Cell Research 301, 158–167. [DOI] [PubMed] [Google Scholar]
- Baker, E.A. , Bergin, F.G. , Leaper, D.J. , 2000. Matrix metalloproteinases, their tissue inhibitors and colorectal cancer staging. British Journal of Surgery 87, 1215–1221. [DOI] [PubMed] [Google Scholar]
- Birkenkamp-Demtroder, K. , Christensen, L.L. , Olesen, S.H. , Frederiksen, C.M. , Laiho, P. , Aaltonen, L.A. , Laurberg, S. , Sorensen, F.B. , Hagemann, R. , Orntoft, T.F. , 2002. Gene expression in colorectal cancer. Cancer Research 62, 4352–4363. [PubMed] [Google Scholar]
- Birkenkamp-Demtroder, K. , Olesen, S.H. , Sorensen, F.B. , Laurberg, S. , Laiho, P. , Aaltonen, L.A. , Orntoft, T.F. , 2005. Differential gene expression in colon cancer of the caecum versus the sigmoid and rectosigmoid. Gut 54, 374–384. [DOI] [PMC free article] [PubMed] [Google Scholar]
- Birkenkamp-Demtroder, K. , Mansilla, F. , Sørensen, F.B. , Kruhøffer, M. , Christensen, L. , Aaltonen, L.A. , Verspaget, H. , Ørntoft, T.F. , 2007. Phosphoprotein Keratin 23 accumulates in MSS but not MSI colon cancers in vivo and impacts viability and proliferation in vitro. Molecular Oncology 1, 181–195. [DOI] [PMC free article] [PubMed] [Google Scholar]
- Bister, V.O. , Salmela, M.T. , Karjalainen-Lindsberg, M.L. , Uria, J. , Lohi, J. , Puolakkainen, P. , Lopez-Otin, C. , Saarialho-Kere, U. , 2004. Differential expression of three matrix metalloproteinases, MMP-19, MMP-26, and MMP-28, in normal and inflamed intestine and colon cancer. Digestive Diseases and Sciences 49, 653–661. [DOI] [PubMed] [Google Scholar]
- Daniel, P. , Wagrowska-Danilewicz, M. , Danilewicz, M. , Stasikowska, O. , Malecka-Panas, E. , 2007. Transforming growth factor beta 1 and metalloproteinase-9 overexpression in colorectal cancer (CC) and adenoma. International Journal of Colorectal Disease 22, 1165–1172. [DOI] [PubMed] [Google Scholar]
- Davidsen, M.L. , Wurtz, S.O. , Romer, M.U. , Sorensen, N.M. , Johansen, S.K. , Christensen, I.J. , Larsen, J.K. , Offenberg, H. , Brunner, N. , Lademann, U. , 2006. TIMP-1 gene deficiency increases tumour cell sensitivity to chemotherapy-induced apoptosis. British Journal of Cancer 95, 1114–1120. [DOI] [PMC free article] [PubMed] [Google Scholar]
- Ellenrieder, V. , Hendler, S.F. , Ruhland, C. , Boeck, W. , Adler, G. , Gress, T.M. , 2001. TGF-beta-induced invasiveness of pancreatic cancer cells is mediated by matrix metalloproteinase-2 and the urokinase plasminogen activator system. International Journal of Cancer 93, 204–211. [DOI] [PubMed] [Google Scholar]
- Fong, S.F. , Dietzsch, E. , Fong, K.S. , Hollosi, P. , Asuncion, L. , He, Q. , Parker, M.I. , Csiszar, K. , 2007. Lysyl oxidase-like 2 expression is increased in colon and esophageal tumours and associated with less differentiated colon tumours. Genes Chromosomes Cancer 46, 644–655. [DOI] [PubMed] [Google Scholar]
- Guedez, L. , Courtemanch, L. , Stetler-Stevenson, M. , 1998. Tissue inhibitor of metalloproteinase (TIMP)-1 induces differentiation and an antiapoptotic phenotype in germinal center B Cells. Blood 92, 1342–1349. [PubMed] [Google Scholar]
- Guillem, J.G. , Levy, M.F. , Hsieh, L.L. , Johnson, M.D. , LoGerfo, P. , Forde, K.A. , Weinstein, I.B. , 1990. Increased levels of phorbin, c-myc, and ornithine decarboxylase RNAs in human colon cancer. Molecular Carcinogenesis 3, 68–74. [DOI] [PubMed] [Google Scholar]
- Holten-Andersen, M.N. , Stephens, R.W. , Nielsen, H.J. , Murphy, G. , Christensen, I.J. , Stetler-Stevenson, W. , Brunner, N. , 2000. High preoperative plasma tissue inhibitor of metalloproteinase-1 levels are associated with short survival of patients with colorectal cancer. Clinical Cancer Research 6, 4292–4299. [PubMed] [Google Scholar]
- Holten-Andersen, M.N. , Christensen, I.J. , Nielsen, H.J. , Stephens, R.W. , Jensen, V. , Nielsen, O.H. , Sorensen, S. , Overgaard, J. , Lilja, H. , Harris, A. , Murphy, G. , Brunner, N. , 2002. Total levels of tissue inhibitor of metalloproteinases 1 in plasma yield high diagnostic sensitivity and specificity in patients with colon cancer. Clinical Cancer Research 8, 156–164. [PubMed] [Google Scholar]
- Holten-Andersen, M.N. , Hansen, U. , Brunner, N. , Nielsen, H.J. , Illemann, M. , Nielsen, B.S. , 2005. Localization of tissue inhibitor of metalloproteinases 1 (TIMP-1) in human colorectal adenoma and adenocarcinoma. International Journal of Cancer 113, 198–206. [DOI] [PubMed] [Google Scholar]
- Jung, K.K. , Liu, X.W. , Chirco, R. , Fridman, R. , Kim, H.R.C. , 2006. Identification of CD63 as a tissue inhibitor of metalloproteinase-1 interacting cell surface protein. EMBO Journal 25, 3934–3942. [DOI] [PMC free article] [PubMed] [Google Scholar]
- Kruhoffer, M. , Jensen, J.L. , Laiho, P. , Dyrskjot, L. , Salovaara, R. , Arango, D. , Birkenkamp-Demtroder, K. , Sorensen, F.B. , Christensen, L.L. , Buhl, L. , Mecklin, J.P. , Jarvinen, H. , Thykjaer, T. , Wikman, F.P. , Bech-Knudsen, F. , Juhola, M. , Nupponen, N.N. , Laurberg, S. , Andersen, C.L. , Aaltonen, L.A. , Orntoft, T.F. , 2005. Gene expression signatures for colorectal cancer microsatellite status and HNPCC. British Journal of Cancer 92, 2240–2248. [DOI] [PMC free article] [PubMed] [Google Scholar]
- Liu, X.W. , Bernardo, M.M. , Fridman, R. , Kim, H.R.C. , 2003. Tissue inhibitor of metalloproteinase-1 protects human breast epithelial cells against intrinsic apoptotic cell death via the focal adhesion kinase/phosphatidylinositol 3-kinase and MAPK signaling pathway. Journal of Biological Chemistry 278, 40364–40372. [DOI] [PubMed] [Google Scholar]
- Liu, X.W. , Taube, M.E. , Jung, K.K. , Dong, Z. , Lee, Y.J. , Roshy, S. , Sloane, B.F. , Fridman, R. , Kim, H.R.C. , 2005. Tissue inhibitor of metalloproteinase-1 protects human breast epithelial cells from extrinsic cell death: A potential oncogenic activity of tissue inhibitor of metalloproteinase-1. Cancer Research 65, 898–906. [PubMed] [Google Scholar]
- Mansilla, F. , Birkenkamp-Demtroder, K. , Kruhoffer, M. , Sorensen, F.B. , Andersen, C.L. , Laiho, P. , Aaltonen, L.A. , Verspaget, H.W. , Orntoft, T.F. , 2007. Differential expression of DHHC9 in microsatellite stable and instable human colorectal cancer subgroups. British Journal of Cancer 96, 1896–1903. 10.1038/sj.bjc.6603818 [DOI] [PMC free article] [PubMed] [Google Scholar]
- Matsushita, M. , Matsuzaki, K. , Date, M. , Watanabe, T. , Shibano, K. , Nakagawa, T. , Yanagitani, S. , Amoh, Y. , Takemoto, H. , Ogata, N. , Yamamoto, C. , Kubota, Y. , Seki, F. , Inokuchi, H. , Nishizawa, M. , Takada, H. , Sawamura, T. , Okamura, A. , Inoue, K. , 1999. Down regulation of TGF-beta receptors in human colorectal cancer: implications for cancer development. British Journal of Cancer 80, 194–205. [DOI] [PMC free article] [PubMed] [Google Scholar]
- Nagase, H. , Woessner, J.F. , 1999. Matrix metalloproteinases. Journal of Biological Chemistry 274, 21491–21494. [DOI] [PubMed] [Google Scholar]
- Peinado, H. , del Carmen, M. , de la Cruz, I. , Olmeda, D. , Csiszar, K. , Fong, K.S.K. , Vega, S. , Nieto, M.A. , Cano, A. , Portillo, F. , 2005. A molecular role for lysyl oxidase-like 2 enzyme in Snail regulation and tumour progression. EMBO Journal 24, 3446–3458. [DOI] [PMC free article] [PubMed] [Google Scholar]
- Powe, D.G. , Brough, J.L. , Carter, G.I. , Bailey, E.M. , StetlerStevenson, W.G. , Turner, D.R. , Hewitt, R.E. , 1997. TIMP-3 mRNA expression is regionally increased in moderately and poorly differentiated colorectal adenocarcinoma. British Journal of Cancer 75, 1678–1683. [DOI] [PMC free article] [PubMed] [Google Scholar]
- Schrohl, A.S. , Holten-Andersen, M.N. , Peters, H.A. , Look, M.P. , Meijer-van Gelder, M.E. , Klijn, J.G. , Brunner, N. , Foekens, J.A. , 2004. Tumour tissue levels of tissue inhibitor of metalloproteinase-1 as a prognostic marker in primary breast cancer. Clinical Cancer Research 10, 2289–2298. [DOI] [PubMed] [Google Scholar]
- Schrohl, A.S. , Meijer-van Gelder, M.E. , Holten-Andersen, M.N. , Christensen, I.J. , Look, M.P. , Mouridsen, H.T. , Brunner, N. , Foekens, J.A. , 2006. Primary tumour levels of tissue inhibitor of metalloproteinases-1 are predictive of resistance to chemotherapy in patients with metastatic breast cancer. Clinical Cancer Research 12, 7054–7058. [DOI] [PubMed] [Google Scholar]
- Sieuwerts, A.M. , Klijn, J.G.M. , Henzen-Logmans, S.C. , Bouwman, I. , Van Roozendaal, K.E.P. , Peters, H.A. , Setyono-Han, B. , Foekens, J.A. , 1998. Urokinase-type-plasminogen-activator (uPA) production by human breast (myo)fibroblasts in vitro: Influence of transforming growth factor-beta(1) (TGF beta(1)) compared with factor(s) released by human epithelial-carcinoma cells. International Journal of Cancer 76, 829–835. [DOI] [PubMed] [Google Scholar]
- Sorensen, N.M. , Bystrom, P. , Christensen, I.J. , Berglund, A. , Nielsen, H.J. , Brunner, N. , Glimelius, B. , 2007. TIMP-1 is significantly associated with objective response and survival in metastatic colorectal cancer patients receiving combination of irinotecan, 5-fluorouracil, and folinic acid. Clinical Cancer Research 13, 4117–4122. [DOI] [PubMed] [Google Scholar]
- Tanaka, Y. , Kobayashi, H. , Suzuki, M. , Kanayama, N. , Terao, T. , 2004. Transforming growth factor-beta 1-dependent urokinase up-regulation and promotion of invasion are involved in Src-MAPK-dependent signaling in human ovarian cancer cells. Journal of Biological Chemistry 279, 8567–8576. [DOI] [PubMed] [Google Scholar]
- Westbrook, C.A. , Gasson, J.C. , Gerber, S.E. , Selsted, M.E. , Golde, D.W. , 1984. Purification and characterization of human T-lymphocyte-derived erythroid-potentiating activity. Journal of Biological Chemistry 259, 9992–9996. [PubMed] [Google Scholar]
- Wildi, S. , Kleeff, J. , Maruyama, H. , Maurer, C.A. , Buchler, M.W. , Korc, M. , 2001. Overexpression of activin A in stage IV colorectal cancer. Gut 49, 409–417. [DOI] [PMC free article] [PubMed] [Google Scholar]
- Zucker, S. , Vacirca, J. , 2004. Role of matrix metalloproteinases (MMPs) in colorectal cancer. Cancer and Metastasis Reviews 23, 101–117. [DOI] [PubMed] [Google Scholar]