

Abstract
Stage 4 neuroblastoma (NB) are heterogeneous regarding their clinical presentations and behavior. Indeed infants (stage 4S and non‐stage 4S of age <365days at diagnosis) show regression contrasting with progression in children (>365days). Our study aimed at: (i) identifying age‐based genomic and gene expression profiles of stage 4 NB supporting this clinical stratification; and (ii) finding a stage 4S NB signature. Differential genome and transcriptome analyses of a learning set of MYCN‐non amplified stage 4 NB tumors at diagnosis (n=29 tumors including 12 stage 4S) were performed using 1Mb BAC microarrays and Agilent 22K probes oligo‐microarrays. mRNA chips data following filtering yielded informative genes before supervised hierarchical clustering to identify relationship among tumor samples. After confirmation by quantitative RT‐PCR, a stage 4S NB's gene cluster was obtained and submitted to a validation set (n=22 tumors). Genomic abnormalities of infant's tumors (whole chromosomes gains or loss) differ radically from that of children (intra‐chromosomal rearrangements) but could not discriminate infants with 4S from those without this presentation. In contrast, differential gene expression by looking at both individual genes and whole biological pathways leads to a molecular stage 4S NB portrait which provides new biological clues about this fascinating entity.
Keywords: Metastatic neuroblastoma, Stage 4S, Molecular signature
Abbreviations
- NB
neuroblastoma
- infants
patients <365days of age at diagnosis of NB
- children
patients >365days of age at diagnosis
- stage 4S NB
metastatic NB of neonate or infant with a very special clinical presentation (small primary and hepatic, skin nodules, bone marrow involvement without bone metastasis
- [1yr−] stage 4 NB
metastatic NB of infant without stage 4S NB clinical criteria;
- [1yr+] stage 4 NB
metastatic NB of children
- Q-RT PCR
quantitative reverse transcribed PCR
- S.B.I.M.E.
Searching Biological Interpretation of Microarrays Experiments’ software
- DI
DNA index
1. Introduction
Neuroblastoma (NB), the most frequent solid tumor of very early childhood (for reviews Schwab et al., 2003; Brodeur, 2003) is diagnosed as a disseminated disease (stage 4) in about 60% of the cases. Unlike stage 4 in the other malignant diseases of childhood or the adult, stage 4 NB at diagnosis elicit three distinct clinical patterns, based on disease distribution and the age of the patients (Evans et al., 1971). On the one hand, there are the infants (<365days of age) with stage 4S (2–5% of all NB) and the similarly young stage 4 without 4S features hereafter termed “[1yr−] stage 4” who make up 5–10% of the NB population. On the other hand there are the stage 4 children (≥365days of age) comprising 45% of all NBs who will hereafter be termed “[1yr+] stage 4”. These three clinical aspects of stage 4 NB differ in their respective malignant behaviors and associated‐prognosis: good for stage 4S and [1yr−] stage 4 (5years‐EFS >80%), and dismal for [1yr+] stage 4 (5years‐EFS of around 30%) despite intensive treatment including high‐dose chemotherapy and hematopoietic stem‐cell transplantation (Matthay et al., 1999; Valteau‐Couanet et al., 2005). Noteworthy is the fact that 12months of age or older had been the criterion for making management decisions for stage 4 NB. Recently, however, an age cutoff of 18months has been proposed, but so far no molecular genetic criteria are available to uphold this empirical age‐based stratification (London et al., 2005).
The so‐called 4S stage (for special) is a very rare clinical entity first described by D'Angio et al. (1971). This form of disseminated NB usually affects neonates and infants in the first few months of life. There can be rapid tumor growth often followed by a spontaneous slower tumor regression. Stage 4S is usually diagnosed by an adrenal tumor of small size, associated with widespread disease in the skin and liver with modest bone marrow involvement, or any combination of these features. In stage 4 patients, extensive bone marrow involvement is common and associated more frequently in older patients with bone lesions.
As originally formulated by Brodeur (1995), and further refined by others (Lastowska et al., 2001; Vandesompele et al., 2005), a genetic classification of NB tumors – localized and metastatic as a whole – has been proposed. Type 1 tumors are hyperdiploid due to a whole chromosome set gains and losses resulting from mitotic disjunction, and have a good prognosis. By contrast, tumors of types 2, 3 and 4 display a spectrum of progressively more dismal outcome. They are mainly diploid (except a few tetraploid), and manifest genomic instability with specific structural chromosomal alterations. These include 17q gain and 11q loss without 1p deletion for type 2; 17q gain (Meddeb et al., 1996) and 11q loss with 1p deletion for type 3; and 1p deletion, 17q gain and MYCN amplification (Schwab et al., 1983; Seeger et al., 1985) and a few other alterations for type 4.
DNA index and MYCN genomic content are routinely used as criteria for determining prognosis and treatment for infants with stage 4 NB (Bourhis et al., 2003, 1991, 1991). Regarding MYCN‐non‐amplified [1yr+] stage 4, hyperdiploidy (George et al., 2005) as well as the combination of 1p and 11q deletions (Attiyeh et al., 2005) have been recently demonstrated to be helpful for prognosis.
If DNA microarray technologies (Sturn et al., 2002) may improve prediction of NB outcome (Oberthuer et al., 2006), they may also help to approach the issues raised by the clinical and biological stage 4 NB heterogeneity and, in particular, the spontaneous NB regression of stage 4S. This study was designed, first, to gather and catalog stage 4 NB, age‐based genomic and gene expression profiles aiming towards a possible biological rationale for clinical stratification according to the patient's age at diagnosis. Second it aims at obtaining a stage 4S NB molecular portrait that could lead to new biological insights on this intriguing clinical presentation.
2. Results
2.1. Genomic features of children and infants with non‐amplified‐MYCN stage 4 NB
DNA index analysis of 25 tumor patients (Table 1) yielded mostly two DI peaks in infants and one DI peak in children. Infants stage 4 showed a wide distribution of DI values (over 18 cases, nine hyperdiploid, seven diploid and two tetraploid) while [1yr+] stage 4 NB were all diploid (6/7) or tetraploid (Table 2). Interestingly, the three stage 4S regressing tumors showed a DI of 1.00.
Table 1.
Summary of patients and tumor specimens characteristics
| N° | Stage | Sex | Age (days) | Tumor tissue | Tissue origin | DNA index | DNA‐Ploidy | Major S phase (%) | SPF class | Evolutive Phase at diagnosis | Chemo‐therapy post‐diagnosis | Follow‐up (months/post‐diagnosis) | Present Status (point May 2008) | |
|---|---|---|---|---|---|---|---|---|---|---|---|---|---|---|
| 1 | 4s | F | 36 | PT | Abdominal | 1.2 | HD | 11.9 | 3 | Stable | No | 120 | A | |
| 2 | 4s | M | 37 | MN | Hepatic | 1.45, 1.00 | HD | nd | nd | Stable | No | 57 | A | |
| 3 | 4s | M | 46 | MN | Hepatic | 1.18, 1.00 | HD | 5.8 | 2 | Progression | No | 43 | A | |
| 4 | 4s | M | 47 | MN | Skin | 1.97 | T | 10.2 | 3 | Progression | CT | 1 | Deceased | |
| 5 | 4s | F | 47 | MN | Hepatic | 1.00, 1.67 | D | nd | nd | Unknown | CT | 107 | A | |
| 6 | 4s | M | 85 | PT | Abdominal | 1.55, 1.00 | HD | 2.0 | 1 | Stable | No | 18 | A | |
| 7 | 4s | F | 99 | MN | Skin | 1.00, 1.79 | D | nd | nd | Stable | CT | 67 | Deceased | |
| 8 | 4s | M | 108 | MN | Hepatic | 1.00 | D | 11.0 | 3 | Stable | CT | 44 | Deceased | |
| 9 | 4s | M | 187 | MN | Skin | 1.46, 1.00 | HD | 11.0 | 3 | Progression | CT | 60 | A | |
| 10 | 4s | F | 277 | MN | Hepatic | 1.00, 1.41 | D | 0.6 | 1 | Regression | No | 36 | A | |
| 11 | 4s | M | 285 | MN | Hepatic | 1.00, 1.16 | D | 6.5 | 2 | Regression | No | 132 | A | |
| Infants | 12 | 4s | F | 289 | PT | Abdominal | 1.00 | D | 0.4 | 1 | Regression | No | 194 | A |
| 13 | 4 | F | 39 | MN | Hepatic | 1.53, 1.00 | HD | 3.0 | 1 | Progression | CT | 74 | A | |
| 14 | 4 | M | 58 | PT | Paravertebral | 1.31, 1.00 | HD | 16.0 | 3 | Progression | CT | 204 | A | |
| 15 | 4 | M | 80 | PT | Thoracic | 1.57, 1.00 | HD | nd | nd | Progression | CT | 102 | A | |
| 16 | 4 | F | 141 | PT | Abdominal | nd | nd | nd | nd | Progression | CT | 60 | A | |
| 17 | 4 | M | 166 | PT | Abdominal | nd | nd | nd | nd | Stable | CT | 156 | A | |
| 18 | 4 | M | 302 | PT | Abdominal | 1.98, 1.00 | T | 11.0 | 3 | Progression | CT | 72 | A | |
| 19 | 4 | F | 305 | PT | Abdominal | 1.33,1.00 | HD | 9.0 | 3 | Progression | CT | 6 | Deceased* | |
| 20 | 4 | M | 353 | MN | Parotidian | 1.00, 2.16 | D | nd | nd | Progression | CT | 96 | A | |
| 21 | 4 | M | 369 | MN | Mediastinal | nd | nd | nd | nd | Progression | CT | 120 | A | |
| 22 | 4 | F | 375 | PT | Abdominal | 1.00 | D | nd | nd | Progression | CT | 48 | A | |
| 23 | 4 | F | 488 | PT | Abdominal | nd | nd | nd | nd | Progression | CT | 180 | A | |
| 24 | 4 | M | 843 | PT | Abdominal | 1.00 | D | nd | nd | Progression | CT | 204 | A | |
| Children | 25 | 4 | M | 881 | PT | Abdominal | 1.00 | D | 10.0 | 3 | Progression | CT | 2 | Deceased |
| 26 | 4 | M | 1226 | PT | Abdominal | 1.90, 1.00 | T | 15.0 | 3 | Stable | CT | 8 | Deceased** | |
| 27 | 4 | M | 1433 | PT | Abdominal | 1.09 | D | 15.0 | 3 | Progression | CT | 8 | Deceased | |
| 28 | 4 | F | 1978 | PT | Abdominal | 1.10 | D | 14.2 | 3 | Progression | CT | 48 | Deceased | |
| 29 | 4 | F | 5063 | MN | Clavicular | 1.16+1.00 | D | 12.2 | 3 | Progression | CT | 78 | Deceased |
F: female; M: male; PT: primary tumor; MN: metastatic nodule; D: diploid or near‐diploid, HD: hyperdiploid, T: tetraploid or near tetraploid; nd: not determined; A: alive. DNA flow cytometry (Chassevent et al., 2001) led to DNA Index (DI) tumor values classified as diploid (1.00<DI<1.17), hyperdiploid (1.18<DI<1.85) and tetraploid range (DI>1.86) (Bourhis et al., 1995a). In the DNA index column, when two peaks are measured, the major peak (>50% of area under the two G1 peaks) is underscored.
Not CT responding, renal stenosis at necroscopy.
Not DOD.
Table 2.
Stage 4 series genotypes
| Type | Flat | Atypical | 1 | 2 | 3 | Profiles remarks |
|---|---|---|---|---|---|---|
| Tumor # | ||||||
| 1 | ○ | |||||
| 2 | ○ | |||||
| 3 | ○ | |||||
| 4 | ▪ | |||||
| 5 | ● | |||||
| 6 | ○ | |||||
| 7 | ● | |||||
| 8 | ● | −1p, +2p, +17q | ||||
| 9 | ○ | |||||
| 10 | ● | |||||
| 11 | ● | −1p, +2p | ||||
| 12 | ○ | |||||
| 13 | ○ | |||||
| 14 | ○ | |||||
| 15 | ○ | |||||
| 16 | × | |||||
| 17 | CGH, DI, nd | |||||
| 18 | ▪ | |||||
| 19 | ○ | |||||
| 20 | ● | |||||
| 21 | × | |||||
| 22 | ● | |||||
| 23 | × | |||||
| 24 | ● | |||||
| 25 | ● | |||||
| 26 | ▪ | |||||
| 27 | ● | |||||
| 28 | ● | |||||
| 29 | ● |
Tumors which harbored a few unclassifiable genomic anomalies in the Lastowska's classification consisted in genotype “flat” or “atypical”, in contrast to those fitting with genotypes 1, 2 and 3 criteria. Symbols are related to DNA index value (DI): ○, hyperdiploid; ●, diploid; ▪, tetraploid. × means that DI value was not determined. nd: not done. Tumors #: 1–12, 4S; 13–20, [1yr−]; 21–29, [1yr+].
Out of the 29 tumors that composed the training set, gDNA of 28 was suitable for a BAC‐CGH microarrays analysis. Among stage 4S tumors, one diploid (# 10) showed a normal profile without any detectable abnormalities (hereafter designated as “flat”) while the 11 others elicited significant genomic abnormalities. Our stage 4 NB series clearly displays an increasing and gradual accumulation of genetic alterations (including whole and intra‐chromosomal alterations) from infants to children. Importantly, chromosomes that showed whole loss or gain in hyperdiploid tumors were those eliciting intra‐chromosomal loss or gain in near‐diploid tumors, as already reported (Tomioka et al., 2003). Infant stage 4 tumors showed an excess of whole chromosomes changes (loss or gain) contrasting with a significant accumulation of intra‐chromosomal alterations chromosomal abnormalities in children (p<0.0003; Mann–Whitney test). Gains of 1q, 6p25–21, and 17q as well as loss of 3p, 8p23 and 11q13.3–25 significantly characterize the [1yr+] stage 4 tumors (Supplementary Table 1). Similar data were obtained using Agilent‐oligo 244karray (data not shown).
According to the current genetic classification (Lastowska et al., 2001; Vandesompele et al., 2005), 25 tumors were of types 1, 2 and 3. Three infant tumors, however, displayed either no genomic alteration (“flat”, n=1), or abnormalities that did not fit any of the three already proposed genetic types (hereafter designated as “atypical”; n=2) (Table 2). Remarkably, “flat”, “atypical” and type 1 were significantly found in stage 4 infants (15/19 vs 1/9, p=0.001); conversely, there was a great excess of types 2 and 3 in [1yr+] stage 4 tumors (8/9 vs 4/19).
Finally, in considering results of genomic analysis in either the stage 4S or [1yr−] stage 4 cases whatsoever the array CGH technology used and the DI value, no specific genomic abnormalities discriminated these two clinical infantile types. Thus we searched for differential gene expression by looking at both individual genes and whole biological pathways in using a new software, Searching Biological Interpretation of Microarrays Experiments, or S.B.I.M.E (Kauffmann et al., 2008).
2.2. Children stage 4 NB transcript profiling
The 29 tumors of the learning set included the three clinical classes of stage 4 tumors: stage 4S, n=12, [1yr−] stage 4, n=8; and children ([1yr+] stage 4, n=9). Transcriptome analysis was performed using the Agilent 22K long‐oligo chips with the pooled tumors signals as reference values. A classification of stage 4 NB was obtained with a set of 144 genes that were differentially regulated across the 29 tumors (Supplementary Figures 1a,b). The [1yr+] stage 4 NB gene classifier (Supplementary Table 2) shows a significant differential up‐regulation of a set of transcription factors, cell adhesion molecules and several melanoma antigens.
2.3. Stage 4S NB transcripts profiling
A class prediction analysis (BRB software) could discriminate 4S from the non‐4S' cohort in a set of 124 genes (Supplementary Table 3) that are differentially regulated across the 29 tumors with a 76–97% correct classification (not shown). A hierarchical clustering with this set of genes shows the tight homogeneity of the 12 stage 4S (Figure 1a, Supplementary Figure 2). Transcript levels of 54 top‐ranked (differentially up or down‐regulated) genes of this 4S cluster were assessed by Q‐RTPCR, 70% of them showing Pearson's correlation coefficients >0.6 (not shown). Combination of gene cluster with the S.B.I.M.E. software – designed to pick up, by statistical testes, the functions, pathways or interaction networks of interest, directly from all the information provided by microarray experiments (Kauffmann et al., 2008) – revealed evidence of differentially regulated biological activities in stage 4S NB (Supplementary Tables 4a,b). Among genes related to neuroectodermal functions the gamma‐aminobutyric acid (GABA) receptor rho 2 was up‐regulated (Figure 2a). Stage 4S tumors also elicited a differential transcript up‐regulation of genes (Supplementary Table 3) involved in inflammatory, and immune response: SERPIN5 (Zou et al., 1994), COLEC11 (Stuart et al., 2006) and RAG1 (Gellert, 2002). Similarly, there were found to be differentially activated (Figures 2b,c) the stress‐inducible ULBP3 (Eleme et al., 2004) as well as the pro‐inflammatory cytokine TSLP1 (Soumelis and Liu, 2004). Three transcription factors were also found to be differentially up‐regulated (Figures 2d–f): NFYA (Jin et al., 2001), HMGB1 or HBP1 (Berasi et al., 2004; Scaffidi et al., 2002) and PBX3 (Monica et al., 1991). Strikingly, HBP1 appears to be differentially induced in the three regressing stage 4S tumors (Figure 2f).
Figure 1.
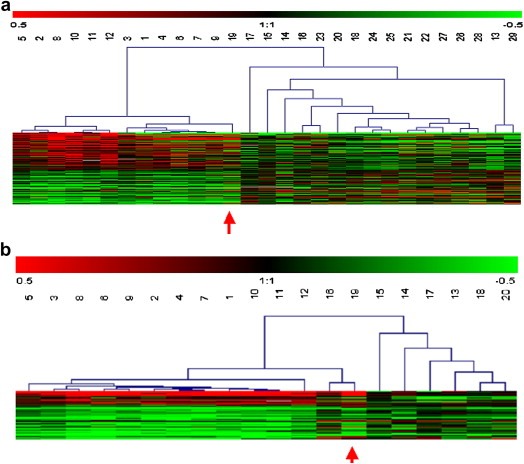
Supervised hierarchical clustering of stage 4 NB comparing: (a) stage 4S NB to non‐stage 4S NB (124 significant genes), (b) stage 4S to [1yr−] stage 4 NB (45 significant genes). Each row represents a single gene and each column a tumor. Tumors #: 1–12, 4S; 13–20, [1yr−]; 21–29, [1yr+]. As shown in the color bar, red and green indicate up and down expressions, respectively, black no change, and gray no data available. Red arrow points #19 [1yr−] stage 4 NB tumor with a 4S’ profile suggesting an atypical stage 4S clinical presentation.
Figure 2.
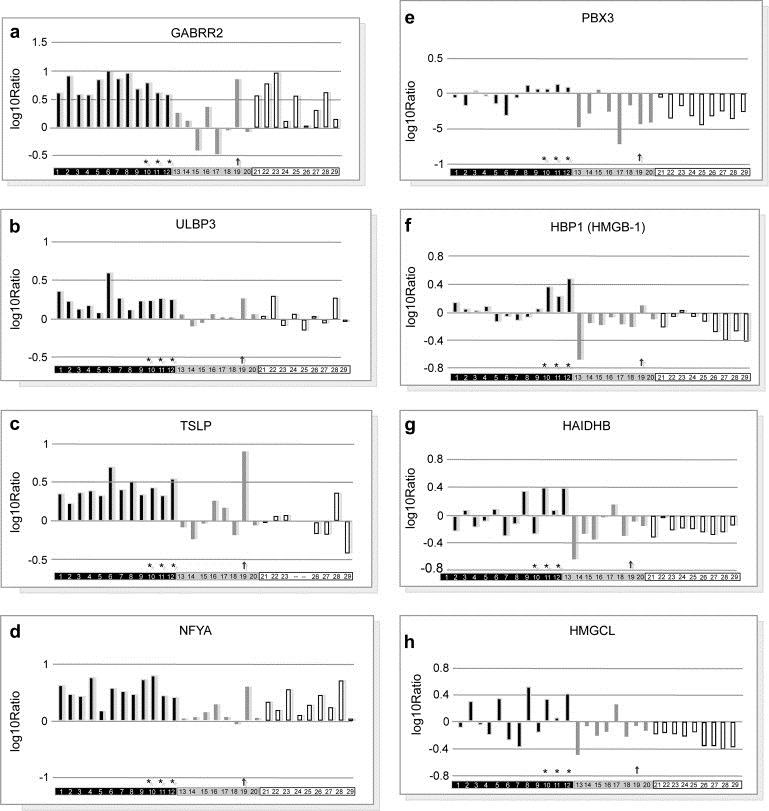
Expression profiling of top genes selected using gene classifier and S.B.I.M.E. analysis in each individual tumor of the patients cohort. For a given gene, the value of each individual bar of histogram represents the log ratio of the tumor expression signal as compared to that of the pool. Student's test yielded 2 p values, respectively 4s vs non‐4s and 4s vs [1yr−], as indicated in brackets. Tumors #: 1–12, 4S (blue bars); 13–20, [1yr−] (yellow bars); 21–29, [1yr+] (hatched bars). # 10, 11 & 12 tumors are in regression (*). Red arrow points #19 [1yr−] stage 4 NB tumor. a: GABRR2 [7 10−4; 10−4], b: ULBP3 [4 10−4; 3 10−3]; c: TSLP1[3 10−4; 1.5 10−2]; d: NFYA [9 10−4; 3 10−4]; e: PBX3 [4 10−5; 6 10−4]; f: HBP1 [4 10−4; 7 10−3]; g: HADHB [9 10−3; 7 10−2]; h: HMGCL [4 10−3; 10−1].
Stage 4S tumors also displayed a transcript level up‐regulation of genes linked to mitochondrial matrix enzymes required for long chain fatty acids degradation: thiolases (HADHB) (Figure 2g), hydratases, and dehydrogenases (acyl‐CoA dehydrogenase, ACADM) (not shown). The differential up‐regulation of both cytoplasmic (MGST1, CDO1) and active mitochondrial detoxication processes (PRDX3, ALDH3A2, ALDH2, CLU) also support an intense mitochondrial activity (Supplementary Figure 3).
To identify reliably the genes expressed differentially between infants with stage 4S and [1yr−] stage 4 disease, transcriptomes of these two clinical subtypes were compared. The BRB class prediction analysis led to a set of 45 genes (80–95%, correct classification rate) and a corresponding heatmap was obtained (Figure 1b, Supplementary Figure 4). This stage 4S NB classifier (Table 3), with fold change from −3.1 to 4.5, showed 19 genes that were common with the previous 4S vs non‐stage 4S gene set (42%), including NFYA, PBX3 and GABRR2, all genes being significantly validated by QRT‐PCR (not shown). A test set of this stage 4S classifier was then analyzed by QRT‐PCR using 22 distinct tumors obtained at diagnosis from infants MYCN‐non‐amplified stage 4 NB including stage 4S (n′=12), [1yr−] stage 4 (n″=10). This validation analysis yielded a significant correlation with four genes namely GABRR2, NFYA, DRHS8 and AP4E1 (p<0.05, Student's test).
Table 3.
Differentially expressed genes (n=45) between stage 4S and [1yr−] stage 4 neuroblastoma
| Symbol | Title | Accession number | Loc chrom | Fold change |
|---|---|---|---|---|
| Immune response | ||||
| IFNG | Interferon gamma | NM_000619 | 12q14 | −1.6 |
| SERPINI1 | Serine protein 1 | NM_005025 | 3q26.1 | −1.6 |
| RAG2 | Recombination activating gene | NM_000536 | 11p13 | −1.8 |
| BC039725 | Protein with an immunoglobulin (Ig) domain | BC039725 | – | −2.0 |
| BRDG1 | B cell receptor downstream signaling 1 | NM_012108 | 4q13.2 | −3.0 |
| Transcription factors | ||||
| NFYA | Nuclear transcription factor Y alpha | NM_002505 | 6p21.3 | 2.5 |
| PBX3 | Pre‐B‐cell leukemia transcription factor 3 | NM_006195 | 9q33–q34 | 2.1 |
| Signaling | ||||
| LOC123722 | Hypothetical protein | ENST00000334574 | 15q25.2 | 2.8 |
| PTP4A1 | Pr. tyrosine phosphatase type IVA member1 | NM_003463 | 6q12 | 2.0 |
| TNFAIP2 | Tumor necrosis factor alpha‐induced protein2 | NM_006291 | 14q32 | −1.6 |
| AP4E1 | Adaptor‐related pr. complex 4 subunit epsilon1 | CR749604 | 15q21.2 | −1.8 |
| FLJ35220 | Member of the endonuclease V family | A_23_P32433 | 17q25.3 | −1.8 |
| RASGRP1 | RAS guanyl releasing protein | NM_005739 | 15q15 | −1.8 |
| SLC36A2 | Solute carrier family 36 member 2 | NM_181776 | – | −1.9 |
| CX62 | Connexin 62 | NM_032602 | 6q15–q16 | −2.0 |
| PART1 | Prostate androgen‐regulated transcript 1 | NM_016590 | 5q12.1 | −2.2 |
| EGFL6 | EGF‐like‐domain, multiple 6 | NM_015507 | Xp22 | −2.4 |
| Metabolism | ||||
| DHRS8 | Dehydrogenase/reductase 2(RetSDR2) | NM_016245 | 4q22.1 | 2.3 |
| GPR133 | G protein‐coupled receptor 133 | NM_198827 | 12q24.33 | 1.7 |
| A_23_P61288 | – | A_23_P61288 | – | −1.6 |
| BOC | Brother of CDO | NM_033254 | 3q13.2 | −1.8 |
| KLRF1 | Killer cell lectin‐like receptor F member 1 | NM_016523 | 12p12.3–13.2 | −2.0 |
| Muscle development | ||||
| CFL2 | Cofilin 2 | NM_021914 | 14q12 | 1.8 |
| CASQ2 | Calsequestrin 2 | NM_001232 | 1p13.3–p11 | −1.6 |
| ITGA7 | Integrin alpha 7 | NM_002206 | 12q13 | −1.8 |
| MYL1 | Myosin, light polypeptide 1 | NM_079422 | 2q33–q34 | −2.0 |
| Synaptic transmission | ||||
| GABRR2 | Gamma‐aminobutyric acid receptor rho 2 | NM_002043 | 6q14–q21 | 4.5 |
| KCNMB1 | b1subunit calcium‐activated K+ channel | NM_004137 | 5q34 | −1.5 |
| Unknown function | ||||
| A_23_P15851 | Unknown function | A_23_P158513 | – | 2.5 |
| BTNL8 | Similarity with butyrophylin Btn1a1 | NM_024850 | 5q35.3 | 2.4 |
| MGC50721 | Hypothetical protein | NM_173806 | 16p12.1 | 2.0 |
| X102 | X102 protein | ENST00000327992 | 15q11.2 | 1.4 |
| C6orf165 | Chromosome 6 open reading frame 165 | NM_178823 | 6q15 | −1.6 |
| FLJ36198 | Hypothetical protein | NM_173801 | 11q12.1 | −1.6 |
| MGC26816 | Hypothetical protein | NM_152613 | 22q13.2 | −1.6 |
| FLJ20825 | Unknown function | AK000832 | 20q13.33 | −1.6 |
| C9orf52 | Chromosome 9 open reading frame 52 | NM_152574 | 9p22.3 | −1.7 |
| R7BP | Similarity with D13Bxg1146e | BX640900 | – | −1.7 |
| KIAA0125 | Hypothetical protein | NM_014792 | 14q32.33 | −1.7 |
| PRO1257 | Hypothetical protein | AF116629 | 1q24.1 | −1.7 |
| CMYA3 | Cardiomyopathy associated A3 | AL833291 | 2q24.3 | −1.7 |
| FLJ23550 | Hypothetical protein | NM_025063 | 1q24.3 | −1.8 |
| C15orf25 | Chromosome 15 open reading frame 25 | A_23_P58157 | 15q15.1 | −2.3 |
| MGC45438 | Unknown function | NM_152459 | 16p13.3 | −3.1 |
Top‐ranked genes of the stage 4S NB cluster (up‐ and down‐regulated). Genes listed are statistically significant (t‐test p‐value <0.001) as reported by BRB Array Tools after combination of the arrays within Rosetta Resolver® system for gene expression data analysis. Genes are classified by biological function, as reported in the 22K Agilent annotation. Functional annotation was performed using the Online Mendelian Inheritance in Man (OMIM). Fold change is calculated as the 4S/[1yr−] stage 4 ratio. Negative fold change means the log(Cy5 labeled [1yr−]/Cy3 labeled pool) ratio is higher than that of 4S. Underlined genes are common with those of the 4S vs non‐4S genes’ set.
When applied to common biological databases, S.B.I.M.E tool indicates active lipid metabolism in infants stage 4 (not shown) and an active citric acid cycle in stage 4S tumors, as assessed by differential increases in transcript levels of HMGCoA lyase (HMGCL) and acetyl‐CoA C‐acetyltransferase (ACAT1), fumarase, FH and glutamate dehydrogenase GLUD1 and GLUD2 (Supplementary Table 4). Moreover, S.B.I.M.E data indicate that [1yr−] stage 4 NB shows Ras‐independent pathway in NK cell‐mediated cytotoxicity and increase T cell response activity (Table 4).
Table 4.
Immune response functional analysis discriminating stage 4S (n=12) from [1yr−] stage 4 (n=8) according to S.B.I.M.E. tool
| Ng | Ngc | Ns | % | Z | P | Genes | ||||||||||||||
|---|---|---|---|---|---|---|---|---|---|---|---|---|---|---|---|---|---|---|---|---|
| BioCarta | ||||||||||||||||||||
| Ras‐independent pathway in NK cell‐mediated cytotoxicity | 17 | 17 | 4 | 23.5 | 4.84 | 1.32E‐06 | PTPN6 | ⇓ | SYK | ⇓ | LAT | ⇓ | KLRC1 | ⇓ | ||||||
| T cytotoxic cell surface molecules | 12 | 10 | 2 | 20 | 3.25 | 1.14E‐03 | CD28 | ⇓ | THY1 | ⇓ | ||||||||||
| E2F1 destruction pathway | 9 | 9 | 2 | 22.2 | 3.24 | 1.20E‐03 | SKP2 | ⇑ | CUL1 | ⇑ | ||||||||||
| T helper cell surface molecules | 12 | 10 | 2 | 20 | 3.15 | 1.63E‐03 | CD28 | ⇓ | THY1 | ⇓ | ||||||||||
| Role of Tob in T cell activation | 15 | 12 | 2 | 16.7 | 3.1 | 1.91E‐03 | IFNG | ⇓ | CD28 | ⇓ | ||||||||||
| Gene ontology – biological process | ||||||||||||||||||||
| Defense response | 98 | 77 | 7 | 9.1 | 3.13 | 1.73E‐03 | IFNG | ⇓ | MX2 | ⇓ | IFNA21 | FLJ10979 | ⇑ | PTPRCAP | ⇓ | CD84 | ⇓ | SP140 | ⇓ | |
| Humoral immune response | 28 | 25 | 3 | 12 | 2.7 | 6.86E‐03 | CD28 | ⇓ | BRDG1 | ⇓ | LTF | ⇓ | ||||||||
| Integrin‐mediated signaling pathway | 45 | 39 | 4 | 10.3 | 2.61 | 9.03E‐03 | ITGB7 | ⇓ | ITGA7 | ⇓ | ITGB3 | ⇓ | SYK | ⇓ | ||||||
| Gene ontology – molecular function | ||||||||||||||||||||
| MHC class I receptor activity | 13 | 11 | 2 | 18.2 | 2.85 | 4.36E‐03 | KLRF1 | ⇓ | ULBP3 | ⇑ | ||||||||||
| 4s<[1yr−] stage 4 | ⇓ | |||||||||||||||||||
| 4s>[1yr−] stage 4 | ⇑ | |||||||||||||||||||
Using ANOVA, only functional categories with a p‐value <0.01 were selected according to the Z‐score (comparison of the observed percentage to a randomized set of theoretical percentages). Each row corresponds to a category found by S.B.I.M.E.Kauffmann et al. (2008), ordered by increasing p‐value. “Ng”=genes number in the functional category. “Ngc”=genes number present in the data set. “Ngc”>“Ng” if there are several oligonucleotides for the same gene on the array. “Ns”=number of significantly differentially expressed genes. “%” is the percentage of genes significantly expressed (Ns/Ngc*100). “P”=p‐value associated to the Z‐score calculation, i.e., the probability to find this functional category significant by chance. Following this column, the S.B.I.M.E. output file normally presents all the genes (not shown).
3. Discussion
3.1. Genomic characteristics of non‐amplified‐MYCN stage 4 NB
Non‐hyperdiploid stage 4 tumors in patients older than 12months of age exhibit an excess of intra‐chromosomal alterations, in contrast to the mostly hyperdiploid infantile stage 4 patients aged under 12months whose tumors show whole chromosome changes (losses or gains). Strikingly, among the 20 tumors in infants, one showed a “flat” profile and two others were “atypical” regarding to the Brodeur–Lastowska–Vandesompele's classification (Brodeur, 1995; Lastowska et al., 2001; Vandesompele et al., 2005). Significantly, chromosomal types of infant tumors are type 1, “flat”, or “atypical”, while childhood tumors exclusively show types 2 or 3. The other 3 tetraploid tumors of the series fall into types 2 or 3, in agreement with a progressive disease as reported (Bourhis et al., 1991, 1991). The combination of DI values for the four genotypes do not, however, improve discrimination between infants and children (Table 2). Noteworthy, two among three infants with tumors showing intra‐chromosomal alterations followed a fatal course. One of these two tumors was type 3 (case # 4) and the other (case # 8) was of an atypical type very close to type 3 (−1p and +17q without containing −11q). This latter child died of disease 3years after a marked regression of both the primary tumor and the hepatomegaly and despite careful monitoring over 2years. This case indicates that intra‐chromosomal alterations did not develop de novo with time but were present at diagnosis. Today, MYCN genomic content is the only criterion used to eliminate type 4, but is of no help for prognosis of infants with MYCN‐non‐amplified stage 4 disease. On the basis of the genomic data here presented, we propose a systematic genotyping to improve management of infants with stage 4 NB. Such a pangenomic CGH array stratification is feasible and easily generated from gDNA obtained from fine needle‐biopsies at diagnosis. This would yield genotypes that would be used for clinical decision‐making, as currently demonstrated by an European study carried out on a very large cohort of all NB patients on one hand (Janoueix et al., in press) as well as specifically in infants NB (Schleiermacher et al., 2007, submitted). A “flat” genotype or one showing whole chromosome changes (type 1) would call for careful observation alone or minimal therapy. Intra‐chromosomal rearrangements (types 2 and 3 and “atypical” with pejorative genetics markers, i.e., −1p, +17q) would demand active monitoring and a therapeutic strategy similar to that adopted for MYCN‐amplified NB (type 4).
3.2. Molecular features of stage 4S NB
Except Dein, a single novel gene with high expression in stage 4S NB (Voth et al., 2007), no genes set identifying this subtype of disease has been reported so far. Our transcriptome analysis confirms the marked difference of genomic alterations within stage 4 NB between infants and children and thus validates the age‐based clinical classification. However a small number of [1yr+] stage 4 tumor specimens at diagnosis prevents us from validating the proposed 18‐month cut‐off age for discriminating between high risk and non‐high risk NB (London et al., 2005). A recent study of MYCN‐non‐amplified stage 4 NB shows that tumors transcriptome profiling can identify subgroups with different outcomes (Asgharzadeh et al., 2006).
The combination of genes clusterings with the S.B.I.M.E. data provides a molecular stage 4S NB portrait in facets regarding neuro‐ectodermal embryogenesis in agreement with recent findings (Fischer et al., 2006), mitochondrial and fatty acids metabolism activities, transcription factors expression and inflammatory/immune response.
Differential up‐regulation of PBX3 and GABRHO2 receptor transcript levels were observed. The homeodomain transcription factor PBX3 is expressed at high levels in the developing nervous central system including the medulla oblongata involved in respiration control. PBX3‐deficient mice die, within a few days of birth, from central respiratory hypoventilation syndrome (Rhee et al., 2004). Remaining to be elucidated is the role PBX3 plays relative to PHOX2B, the genetic determinant of the Ondine syndrome and proposed as being involved in NB oncogenesis (Trochet et al., 2004). Similarly, the channel GABRHO2 receptor, a Ca2+ current inhibitor via G‐protein‐coupled mechanisms in sympathetic neurons (Filippov et al., 2000), might represent a trophic factor involved in neuroblast development. These evidence suggest stage 4S not per se a “metastatic” disease, but rather multifocal dysregulated proliferations of embryonal neuroblasts.
A differential increase of acetyl‐CoA carboxylase alpha transcript levels in infants compared to children likely indicates lipogenesis activation. Differential up‐regulation of fatty acids catabolism with key enzymes activation, clearly pinpoints fatty acid β‐oxidation (FAβ0) activation in stage 4S. Moreover transcriptome data point out the involvement of various metabolisms that might tolerate an excessive FAβ0 and subsequent acetyl‐CoA overproduction as well as differential up‐regulation of mitochondrial activity of both cytoplasmic and mitochondrial detoxication processes. Stage 4S tumor cells thus appear as very highly energy consuming cells, able to sustain an active growth with subsequent associated detoxification mechanisms. The active lipogenesis and fatty acid catabolism must be considered in the context of the milk diet of infants during the first months of life.
The transcriptional up‐regulation of NFY‐A would reflect a compensatory DNA repair process at work. As for the transcription regulator HBP1, known to be a repressor of p47 phox (Jin et al., 2001), it can also be an endogenous immune adjuvant (Rovere‐Querini et al., 2004) able to trigger inflammation, when released by dead cells (Scaffidi et al., 2002). In this respect, we observed HBP1 differential overexpression in the three regressing stage 4S tumors showing a diploid DNA index, a low S phase fraction, and many necrotic foci (not shown).
In humans, the NK cells cytotoxic receptor NKG2D may be activated after recognition by the ULBP3 ligand that is up‐regulated in tumor cells (Pende et al., 2002). Not restricted to NK cells, NKG2D expression also concerns subsets of γ/δ T cells, particularly CD8+T cells. Moreover a down‐regulation of KLRF1, the inhibitor of NK activation via MHC class I cells, is found (Table 4) favoring NK cells as instrumental in stage 4S. The up‐regulation of TSLP1, a cytokine necessary for NK activation indicates an inflammatory process and subsequent cell “stress” (Gasser and Raulet, 2006). Such an immunity monogram reflects tumor‐infiltrating NK cells.
Altogether, from our data one may speculate the following tumor model for stage 4S. Firstly residual undifferentiated neural crest progenitors would proliferate using various energy sources, in particular fatty acids, given the high milk diet of the neonate. Secondly subsequent active β‐oxidation would generate oxygen‐reactive species possibly leading, during cell division, to whole chromosome loss and gains. Thirdly, once all compensatory mechanisms of metabolism are overridden, such genome instability cannot be repaired. In this context, an inflammatory and NK‐mediated response of the host, a kind of host “intolerance” against malignant neuroblasts, would then be triggered and lead to tumor regression. Molecular determinants of such a proliferation‐regression oscillation remain to be found.
4. Experimental procedures
4.1. Patients, tumor tissues and procedures
Snap frozen tumors samples (tru‐cut needle or open biopsy) were collected at diagnosis from these patients. These tumors were stringently selected as containing more than 70% of malignant tumor cells and MYCN‐non‐amplified (≤3 copies/haploid genome) (Ambros et al., 2003). Experiments were done from 35‐μm thick tumor slices flanked by 5μm histological controls showing immature malignant neuroblasts population higher than 70%; out of 81 tumor specimens of patients with MYCN‐non‐amplified stage 4 NB patients, 29 were available for genome and transcriptome analyses in a tumors set composed of stage 4S (n=12), [1yr−] stage 4 (n=8), [1yr+] stage 4 (n=9). Pertinent clinical and biological features of these patients are presented in Table 1.
DNA flow cytometry (Chassevent et al., 2001) permitted measurement of DNA index (DI) tumor values. Both genomic DNA (gDNA) and total RNA were purified from the tumor slices in using appropriate Qiagen extraction kits (Qiagen S.A., France).
4.2. Genome and transcriptome analyses
Tumor and reference genomic DNAs (900ng each), after differentially Cy3/Cy5‐dCTP labeling, were hybridized to 1Mb resolution pan‐genomic DNA microarrays from Spectral Genomics (Inc., Houston, TX, USA). Scanning and images processing allowed fluorescent ratio normalization across all array elements in order to compensate for differences in the whole DNA genomic content between test and diploid reference DNAs, and for differences in labeling efficiencies.
Cy5‐labeled purified cRNA from each sample (500ng) was mixed with the same amount of the Cy3‐labeled reference cRNA (a pool of the 29 cRNA tumor patients samples) and hybridized onto 22K oligonucleotide microarrays from Agilent (Inc, Palo Alto). Lack of human neonates and infants pertinent control tissue led to the use of a pool as reference that further allowed optimization of expression variations. Each microarray contains 20,172 distinct probes, corresponding to 16,300 unique genes. Raw data in the Resolver™ software (Weng et al., 2006) for all elements across all 29 samples were deposited at the European Bioinformatics Institute (http://www.ebi.ac.uk/arrayexpress/), accession number E‐TABM‐119 (Brazma et al., 2003). Genes transcript levels of the top up‐ or down‐regulated genes were measured by Quantitative RT‐PCR (QRT‐PCR) using the Applied Biosystems 7900 HT Microfluidic card.
4.3. Statistical analysis
Agilent Feature Extraction Software (version A.6.1.1) quantified the fluorescent image intensity and normalized data using the background subtraction method. Following log transformation and intensity‐dependent (LOWESS) normalization, data were imported for management, quality control and analysis. The arrays corresponding to each patient (two or three replicates) were then combined using a weighted average method as defined in the Resolver™ software; data were transferred to BrB Array Tools to perform the class prediction analyses (http://linus.nci.nih.gov/BRB‐ArrayTools.html). Minimum fold change filtering and missing values filtering finally selected 8553 genes.
The class prediction module uses six learning methods and a leave‐one‐out cross validation over the patients (not shown). Significantly regulated genes were those whose tumor expression was different in the two groups considered (p<0.001, Student's t‐test p‐value). The statistical significance test of the cross‐validated misclassification rate (based on 2000 random permutations) provides an additional p‐value for each misclassification rate. The BrB selected genes were classified by biological function relative to the Gene Ontology annotations (Ashburner et al., 2000).
A new software, Searching Biological Interpretation of Microarrays Experiments (S.B.I.M.E.), was designed to pick up, by statistical testes, the functions, pathways or interaction networks of interest, directly from all the information provided by microarray experiments (Kauffmann et al., 2008).
Supporting information
The following are the supplementary data related to this article:
Supplementary data
Supplementary data
Supplementary data
Supplementary data
Supplementary data
Supplementary data
Supplementary data
Supplementary data
Supplementary data
Supplementary data
Supplementary data
Acknowledgements
Supported by Programme Hospitalier de Recherche Clinique AO M0 2112 (French Health Minister), Ligue contre le Cancer, Comité de Montbéliard, Grant “Chromosomal Profiling, Use & Development” (Canceropole Ile‐de‐France,# 1 Axis, 2007).
We thank French surgeons and oncologists for providing the material and clinical reports, Dr Bernheim for discussions, Profs Zitvogel, Vassal and Lenoir for interest.
We are grateful to Prof D'Angio for his expertise and kind review of the manuscript.
Supplemental material 1.
1.1.
Supplementary information for this manuscript can be downloaded at doi: 10.1016/j.molonc.2008.07.002.
Bénard Jean, Raguénez Gilda, Kauffmann Audrey, Valent Alexander, Ripoche Hugues, Joulin Virginie, Job Bastien, Danglot Gisèle, Cantais Sabrina, Robert Thomas, Terrier-Lacombe Marie-José, Chassevent Agnès, Koscielny Serge, Fischer Matthias, Berthold Frank, Lipinski Marc, Tursz Thomas, Dessen Philippe, Lazar Vladimir, Valteau-Couanet Dominique, (2008), MYCN‐non‐amplified metastatic neuroblastoma with good prognosis and spontaneous regression: A molecular portrait of stage 4S, Molecular Oncology, 2, doi: 10.1016/j.molonc.2008.07.002.
Contributor Information
Jean Bénard, Email: benard@igr.fr.
Vladimir Lazar, Email: lazar@igr.fr.
References
- Ambros, I.M. , Bénard, J. , Boavida, M. , Bown, N. , Caron, H. , Combaret, V. , Couturier, J. , Darnfors, C. , Delattre, O. , Freeman-Edward, J. , 2003. Quality assessment of genetic markers used for therapy stratification. J. Clin. Oncol. 21, 2077–2084. [DOI] [PubMed] [Google Scholar]
- Asgharzadeh, S. , Pique-Regi, R. , Sposto, R. , Wang, H. , Yang, Y. , Shimada, H. , Matthay, K. , Buckley, J. , Ortega, A. , Seeger, R.C. , 2006. Prognostic significance of gene expression profiles of metastatic neuroblastoma lacking MYCN amplification. J. Natl. Cancer Inst. 98, 1193–1201. [DOI] [PubMed] [Google Scholar]
- Ashburner, M. , Ball, C.A. , Blake, J.A. , Botstein, D. , Butler, H. , Cherry, J.M. , Davis, A.P. , Dolinski, J. , Dwight, S.S. , Eppig, J.T. , 2000. Gene ontology: tool for the unification of biology. The Gene Ontology Consortium. Nat. Genet. 25, 25–29. [DOI] [PMC free article] [PubMed] [Google Scholar]
- Attiyeh, E.F. , London, W.B. , Mosse, Y.P. , Wang, Q. , Winter, C. , Khazi, D. , Mc Grady, P. , Seeger, R.C. , Look, A.T. , Shimada, H. , 2005. Chromosome 1p and 11q deletions and outcome in neuroblastoma. N. Engl. J. Med. 353, 2243–2253. [DOI] [PubMed] [Google Scholar]
- Berasi, S. , Xiu, M. , Yee, A. , Paulson, K.E. , 2004. HBP1 repression of p47phox gene: cell cycle regulation via the NADPH oxidase. Mol. Cell. Biol. 24, 3011–3024. [DOI] [PMC free article] [PubMed] [Google Scholar]
- Bourhis, J. , De Vathaire, F. , Wilson, G.D. , Hartmann, O. , Terrier-Lacombe, M.J. , Boccon-Gibod, L. , McNally, N.J. , Lemerle, J. , Riou, G. , Bénard, J. , 1991. Combined analysis of DNA ploidy index and N-myc genomic content in neuroblastoma. Cancer Res. 51, 33–36. [PubMed] [Google Scholar]
- Bourhis, J. , Dominici, C. , McDowell, H. , Raschella, G. , Wilson, G. , Castello, M.A. , Plouvier, E. , Lemerle, J. , Riou, G. , Bénard, J. , Hartmann, Q. , 1991. N-myc genomic content and DNA ploidy in stage IVS neuroblastoma. J. Clin. Oncol. 9, 1371–1375. [DOI] [PubMed] [Google Scholar]
- Brazma, A. , Parkinson, H. , Sarkans, U. , Shojatalab, M. , Vilo, J. , Abeygunawardena, N. , Hollooway, E. , Kapushesky, M. , Kemmeren, P. , Lara, G.G. , 2003. Array express, a public repository for microarray gene expression data at the EBI. Nucleic Acids Res. 31, 68–71. [DOI] [PMC free article] [PubMed] [Google Scholar]
- Brodeur, G.M. , 1995. Molecular basis for heterogeneity in human neuroblastomas. Eur. J. Cancer 31, 505–510. [DOI] [PubMed] [Google Scholar]
- Brodeur, G.M. , 2003. Neuroblastoma: biological insights into a clinical enigma. Nat. Rev. Cancer 3, 203–216. [DOI] [PubMed] [Google Scholar]
- Chassevent, A. , Jourdan, M.L. , Romain, S. , Descotes, F. , Colonna, M. , Martin, P.M. , Bolla, M. , Spyratos, F. , 2001. S-phase fraction and DNA ploidy in 633 T1–T2 breast cancers: a standardized flow cytometric study. Clin. Cancer Res. 7, 909–917. [PubMed] [Google Scholar]
- D'Angio, G. , Evans, A. , Koop, C. , 1971. Special pattern of widespread neuroblastoma with a favourable prognosis. Lancet 1, 1046–1049. [DOI] [PubMed] [Google Scholar]
- Eleme, K. , Taner, S.B. , Onfelt, B. , Collinson, L.M. , Mc Cann, F.E. , Chalupny, N.J. , Cosman, D. , Hopkins, C. , Magee, A.I. , Davis, D.M. , 2004. Cell surface organization of stress-inducible proteins ULBP and MICA that stimulate human NK cells and T cells via NKG2D. J. Exp. Med. 199, 1005–1010. [DOI] [PMC free article] [PubMed] [Google Scholar]
- Evans, A.E. , D'Angio, G.J. , Randolph, J. , 1971. A proposed staging for children with neuroblastoma. A Children's cancer study group. Cancer 2, 374–378. [DOI] [PubMed] [Google Scholar]
- Filippov, A.K. , Couve, A. , Pangalos, M. , Walsh, F.S. , Brown, D.A. , Moss, S.J. , 2000. Heteromeric assembly of GABABR1 and GABABR2 receptor subunits inhibits Ca2+ current in sympathetic neurons. J. Neurosci. 20, 2867–2874. [DOI] [PMC free article] [PubMed] [Google Scholar]
- Fischer, M. , Oberthuer, A. , Brors, B. , Kahleret, Y. , Skowron, M. , Voth, H. , Warnat, P. , Ernestus, K. , Hero, B. , Berthold, F. , 2006. Differential expression of neuronal genes defines subtypes of disseminated neuroblastoma with favorable and unfavorable outcome. Clin. Cancer Res. 12, 5118–5128. [DOI] [PubMed] [Google Scholar]
- Gasser, S. , Raulet, D.H. , 2006. The DNA damage response arouses the immune system. Cancer Res. 66, 3959–3962. [DOI] [PubMed] [Google Scholar]
- Gellert, M. , 2002. V(D)J recombination. RAG proteins, repair factors, and regulation. Ann. Rev. Biochem. 71, 101–132. [DOI] [PubMed] [Google Scholar]
- George, R.E. , London, W.B. , Cohn, S.L. , Maris, J.M. , Kretschmar, C. , Diller, L. , Brodeur, G.M. , Castleberry, R.P. , Look, A.T. , 2005. Hyperdiploidy plus non amplified MYCN confers a favorable prognosis in children 12 to 18months old with disseminated neuroblastoma: a Pediatric Oncology Group study. J. Clin. Oncol. 23, 6466–6473. [DOI] [PubMed] [Google Scholar]
- Jin, S. , Fan, F. , Fan, W. , Zhao, H. , Tong, T. , Blanck, P. , Alomo, I. , Rajasekaran, B. , Zhan, Q. , 2001. Transcription factors Oct-1 and NF-YA regulate the p53-independent induction of the GADD45 following DNA damage. Oncogene 20, 2683–2690. [DOI] [PubMed] [Google Scholar]
- Kauffmann, A. , Rosselli, F. , Lazar, V. , Winnepenninckx, V. , Mansuet-Lupo, A. , Dessen, P. , van den Oord, J.J. , Spatz, A. , Sarasin, A. , 2008. High expression of DNA repair pathways is associated with metastatic melanoma patients. Oncogene 27, 565–573. [DOI] [PubMed] [Google Scholar]
- Lastowska, M. , Cullinane, C. , Variend, S. , Cotterill, S. , Bown, N. , O'Neill, S. , Mazzocco, K. , Roberts, P. , Nicholson, J. , Ellershaw, C. , Pearson, A.D. , Jackson, M.S. , 2001. Comprehensive genetic and histopathologic study reveals three types of neuroblastoma tumors. J. Clin. Oncol. 19, 3080–3090. [DOI] [PubMed] [Google Scholar]
- London, W.B. , Castleberry, R.P. , Matthay, K.K. , Look, A.T. , Seeger, R.C. , Shimada, H. , Thorner, P. , Brodeur, G. , Maris, J.M. , Reynolds, C.P. , Cohn, S.L. , 2005. Evidence for an age cutoff greater than 365days for neuroblastoma risk group stratificationin the Children's Oncology Group. J. Clin. Oncol. 23, 6459–6465. [DOI] [PubMed] [Google Scholar]
- Matthay, K.K. , Villablanca, J.G. , Seeger, R.C. , Stram, D.O. , Harris, R.E. , Ramsay, N.K. , Swift, P. , Shimada, H. , Black, C.T. , Brodeur, G.M. , Gerbing, R.B. , Reynolds, C.P. , 1999. Treatment of high-risk neuroblastoma with intensive chemotherapy, radiotherapy, autologous bone marrow transplantation. N. Engl. J. Med. 341, 1165–1173. [DOI] [PubMed] [Google Scholar]
- Meddeb, M. , Danglot, G. , Chudoba, I. , Vénuat, A.M. , Bénard, J. , Avet-Loiseau, H. , Vasseur, B. , Le Paslier, D. , Terrier-Lacombe, M.J. , Hartmann, O. , Bernheim, A. , 1996. Additional copies of a 25Mb chromosomal region originating from 17q23.1–17qter are present in 90% of high-grade neuroblastomas. Genes Chromosomes Cancer 17, 156–165. [DOI] [PubMed] [Google Scholar]
- Monica, K. , Galili, M. , Nourse, J. , 1991. PBX2 and PBX3, new homeobox genes with extensive homology to the human proto-oncogene PBX1. Mol. Cell. Biol. 11, 6149–6157. [DOI] [PMC free article] [PubMed] [Google Scholar]
- Oberthuer, A. , Berthold, F. , Warnat, P. , Hero, B. , Kahlert, Y. , Spitz, R. , Ernestus, K. , König, R. , Haas, S. , Eils, R. , Schwab, M. , Brors, B. , Westermann, F. , Fischer, M. , 2006. Customized oligonucleotide microarray gene expression-based classification of neuroblastoma patients outperforms current clinical risk stratification. J. Clin. Oncol. 24, 5070–5078. [DOI] [PubMed] [Google Scholar]
- Pende, D. , Rivera, P. , Marcenaro, S. , Chang, C.C. , Biassoni, R. , Conte, R. , Kubin, M. , Cosman, D. , Ferrone, S. , Moretta, L. , Moretta, A. , 2002. Major histocompatibility complex class I-related chain A and UL16-binding protein expression on tumor cell lines of different histotypes: analysis of tumor susceptibility to NKG2D-dependent natural killer cell cytotoxicity. Cancer Res. 62, 6178–6186. [PubMed] [Google Scholar]
- Rhee, J. , Arata, A. , Selleri, L. , Jacobs, Y. , Arata, S. , Onimaru, H. , Cleary, M.L. , 2004. Pbx3 deficiency results in central hypoventilation. Am. J. Pathol. 165, 1343–1350. [DOI] [PMC free article] [PubMed] [Google Scholar]
- Rovere-Querini, P. , Capobianco, A. , Scaffidi, P. , Valentinis, B. , Catalanotti, F. , Giazzon, M. , Dumitriu, I.E. , Müller, S. , Iannacone, M. , Traversari, C. , Bianchi, M.E. , Manfredi, A.A. , 2004. HMGB1 is an endogenous immune adjuvant released by necrotic cells. EMBO Rep. 5, 825–830. [DOI] [PMC free article] [PubMed] [Google Scholar]
- Scaffidi, P. , Misteli, T. , Bianchi, M. , 2002. Release of chromatin protein HMGB1 by necrotic cell triggers inflammation. Nature 418, 191–194. [DOI] [PubMed] [Google Scholar]
- Schleiermacher, G. , Michon, J. , Huon, I. , d'Enghien, C.D. , Klijanienko, J. , Brisse, H. , Ribeiro, A. , Mosseri, V. , Rubie, H. , Munzer, C. , Thomas, C. , 2007. Chromosomal CGH identifies patients with a higher risk of relapse in neuroblastoma without MYCN amplification. Br. J. Cancer 97, 238–246. [DOI] [PMC free article] [PubMed] [Google Scholar]
- Schwab, M. , Alitalo, K. , Klempnauer, K.H. , Varmus, H. , Bishop, J.M. , Gilbert, F. , Brodeur, G. , Goldstein, M. , Trent, J. , 1983. Amplified DNA with limited homology to myc cellular oncogene is shared by human neuroblastoma cell line and a neuroblastoma tumor. Nature (Lond) 305, 245–248. [DOI] [PubMed] [Google Scholar]
- Schwab, M. , Westermann, F. , Hero, B. , Berthold, F. , 2003. Neuroblastoma: biology and molecular and chromosomal pathology. Lancet Oncol. 4, 472–480. [DOI] [PubMed] [Google Scholar]
- Seeger, R.C. , Brodeur, G.M. , Sather, H. , Dalton, A. , Siegel, S.E. , Wong, K.Y. , Hammond, D. , 1985. Association of multiple copies of N-myc oncogene with rapid progression of neuroblastoma. N. Engl. J. Med. 313, 1111–1116. [DOI] [PubMed] [Google Scholar]
- Soumelis, V. , Liu, Y.-J. , 2004. Human thymic stromal lymphopoietin: a novel epithelial cell-derived cytokine and a potential key player in the induction of allergic inflammation. Springer Semin. Immun. 25, 325–333. [DOI] [PubMed] [Google Scholar]
- Stuart, L.M. , Henson, P.M. , Vandivier, R.W. , 2006. Collectins: opsonins for apoptotic cells and regulators of inflammation. Curr. Dir. Autoimmun. 9, 143–161. [DOI] [PubMed] [Google Scholar]
- Sturn, A. , Quackenbush, J. , Trajanoski, Z. , 2002. Genesis: Cluster analysis of microarray data. Bioinformatics 18, 207–208. [DOI] [PubMed] [Google Scholar]
- Tomioka, N. , Kobayashi, H. , Kageyama, H. , Ohira, M. , Nakamura, Y. , Sasaki, F. , Todo, S. , Nakagawara, A. , Kaneko, Y. , 2003. Chromosomes that show segmental loss or gain in near-diploid tumors coincide with chromosomes that show whole loss or gain in near-triploid tumors: evidence suggesting the involvement of the same genes in the tumorigenesis of high- and low-risk neuroblastomas. Genes Chromosomes Cancer 36, 139–150. [DOI] [PubMed] [Google Scholar]
- Trochet, D. , Bourdeaut, F. , Janoueix-Lerosey, Deville, A. , de Pontual, L. , Schleiermacher, G. , Coze, C. , Philip, N. , Frébourg, T. , Munnich, A. , Lyonnet, S. , Delattre, O. , Amiel, J. , 2004. Germline mutations of the paired-like homeobox 2B (PHOX2B) gene in neuroblastoma. Am. J. Hum. Genet. 74, 761–764. [DOI] [PMC free article] [PubMed] [Google Scholar]
- Valteau-Couanet, D. , Michon, J. , Boneu, A. , Rodary, C. , Perel, Y. , Bergeron, C. , Rubie, H. , Coze, C. , Plantaz, D. , Bernard, F. , Chastagner, P. , Bouzy, J. , Hartmann, O. , 2005. Results of induction chemotherapy in children older than 1year with a stage 4 neuroblastoma treated with the NB 97 French Society of Pediatric Oncology (SFOP) protocol. J. Clin. Oncol. 23, 532–540. [DOI] [PubMed] [Google Scholar]
- Vandesompele, J. , Baudis, M. , De Preter, K. , Van Roy, N. , Ambros, P. , Bown, N. , Brinkschmidt, C. , Christiansen, H. , Combaret, V. , Lastowska, M. , Nicholson, J. , O'Meara, A. , Plantaz, D. , Stallings, R. , Brichard, B. , Van den Broecke, C. , De Bie, S. , De Paepe, A. , Laureys, G. , Speleman, F. , 2005. Unequivocal delineation of clinicogenetic subgroups and development of a new model for improved outcome prediction in neuroblastoma. J. Clin. Oncol. 23, 2280–2299. [DOI] [PubMed] [Google Scholar]
- Voth, H. , Oberthuer, A. , Simon, T. , Kahlert, Y. , Berthold, F. , Fischer, M. , 2007. Identification of DEIN, a novel gene with high expression levels in stage IVS neuroblastoma. Mol. Cancer Res. 5, 1276–1284. [DOI] [PubMed] [Google Scholar]
- Weng, L. , Dai, H. , Zhan, Y. , He, Y. , Stepaniants, S.B. , Bassett, D.E. , 2006. Rosetta error model for gene expression analysis. Bioinformatics 22, 1111–1121. [DOI] [PubMed] [Google Scholar]
- Zou, Z. , Anisowicz, A. , Hendrix, M.J. , Thor, A. , Neveu, M. , Sheng, S. , Rafidi, K. , Seftor, E. , Sager, R. , 1994. Maspin, a serpin with tumor-suppressing activity in human mammary epithelial cells. Science 263, 526–529. [DOI] [PubMed] [Google Scholar]
Associated Data
This section collects any data citations, data availability statements, or supplementary materials included in this article.
Supplementary Materials
The following are the supplementary data related to this article:
Supplementary data
Supplementary data
Supplementary data
Supplementary data
Supplementary data
Supplementary data
Supplementary data
Supplementary data
Supplementary data
Supplementary data
Supplementary data