

Abstract
Pancreatic adenocarcinomas express neurotensin receptors in up to 90% of cases, however, their role in tumor biology and as a drug target is not clear. In the present study, a stable neurotensin (NT) analog induced intracellular calcium release and intracellular alkalinization in BxPC‐3 and PANC‐1 pancreatic cancer cells that was abolished by inhibitors of NT receptor (NTR) and sodium–proton exchanger 1 (NHE1), amiloride and SR 142948, respectively. Activation of NHE1 involved increased phosphorylation of dimethylfumarate‐sensitive mitogen‐ and stress‐activated kinase 1/2 (MSK1/2). NTR signaling appears to promote a metastatic phenotype in pancreatic cancer cells by induction of localized extracellular acidification in normoxic cells, preceeding acidosis induced by hypoxia and switch to glycolysis in addition to increased expression of interleukin‐8 (IL‐8).
Keywords: Pancreatic adenocarcinoma, Neurotensin, Mitogen- and stress activated kinase, Sodium hydrogen exchanger 1, Interleukin-8
Non‐standard abbreviations
- NT
neurotensin
- NTR
neurotensin receptor
- Lys8-ψ-Lys9NT(8–13)
Lys8-ψ-Lys9-Pro10-Tyr11-Ile12-Leu13-OH
1. Introduction
Ductal adenocarcinoma of the pancreas is one of the leading causes of cancer deaths in the Western World since, due to the lack of specific symptoms and highly aggressive tumor progression, the disease is usually advanced at time of diagnosis (Ghaneh et al., 2007). A hallmark of exocrine pancreatic cancer is the expression of neuropeptides and their cognate receptors. For example, neurotensin (NT), bombesin, bradykinin, cholecystokinin, and vasopressin were shown to stimulate DNA synthesis in pancreatic cancer cell lines (Ryder et al., 2001). Neurotensin receptor (NTR) expression was demonstrated for pancreatic cancer cell lines as well as more than 75–90% primary pancreatic carcinomas (Bozou et al., 1986; Reubi et al., 1999). NT is a tridecapeptide with the amino acid sequence pGlu1‐Leu2‐Tyr3‐Glu4‐Asn5‐Lys6‐Pro7‐Arg8‐Arg9‐Pro10‐Tyr11‐Ile12‐Leu13‐OH that was primarily isolated from bovine hypothalami and intestine (Carraway and Leeman, 1973; Kitabgi et al., 1976). It exerts dual physiological effects as neurotransmitter/neuromodulator in the central nervous system and as circulating hormone in the periphery and stimulates proliferation of normal intestinal epithelial as well as cancer cells of the pancreas, lung, colon, breast, and prostate (Nemeroff et al., 1982; Carraway and Plona, 2006; Yamada et al., 1995; Iwase et al., 1997; Thomas et al., 2003). Of the three known NTRs, NTR1 and NTR2 belong to the superfamily of heterotrimeric G protein‐coupled receptors, whereas the type I receptor NTR3 (sortilin), homologous to the yeast vacuolar sorting protein VPS10p, is mainly involved in NT and NTR recycling (Kitabgi, 2002; Vincent et al., 1999; Mazella, 2001; Dal Farra et al., 2001). Basically, agonist binding to neuropeptide receptors stimulates phospholipase Cβ and triggers rapid mobilization of intracellular calcium (Ca2+) from endoplasmic reticulum stores, followed by activation of protein kinase C and extracellular signal‐regulated kinase 1/2 (ERK1/2) which eventually results in increased gene transcription (Thomas et al., 2003; Heasley, 2001).
Ryder et al. showed intracellular Ca2+ mobilization and increased DNA synthesis in response to NT in five pancreatic cancer cell lines (Ryder et al., 2001; Ishizuka et al., 1993). Additionally, proliferation of MIA PaCa‐2 pancreatic cancer cells was reported to be stimulated in response to low concentrations of NT, however, this observation was not made in PANC‐1 pancreatic cancer cells (Herzig et al., 1999). Growth stimulatory effects of NT were furthermore reported for cancer cell lines derived from colon, prostate, breast, and small cell lung cancer (SCLC) (Carraway and Plona, 2006). Most of the effects of NT in the central nervous system and periphery are mediated by NTR1 and can be selectively inhibited by the nonpeptide antagonist SR 48692 (Gully et al., 1993). A second nonpeptide antagonist, SR 142948, is less selective than SR 48692 since it does not discriminate between NTR1 and NTR2 (Gully et al., 1997). Experimental animal models proved inhibition of NT‐stimulated growth of SCLC xenografts by SR 48692, however, basal proliferation of MIA PaCa‐2 pancreatic cancer as well as LoVo and SW480 colon cancer cell line xenografts was not impeded by this antagonist (Carraway and Plona, 2006). Therefore, the authors of this study arrived at the conclusion that NT was of primary relevance for proliferation at an early stage of tumor development, and that other growth factors dominated at increasing cell densities and tumor size later on. SR 48692 (Meclinertant®, Sanofi‐Aventis) was clinically tested in SCLC patients (NCI identifier NCT00290953: “A Double Blind, Randomized, Phase II‐III Maintenance Study of SR 48692 Versus Placebo in Patients With Extensive Stage SCLC Following a First Line Chemotherapy With Cisplatin+Etoposide”) and resulted in sporadic responses at best which consequently led to discontinuation of further development of this drug.
In summary, these data indicate that NT plays a minor role as growth factor of tumors, however, it may be significant for processes involved in tumor progression. Definitely, there is increasing evidence that the NT–NTR signaling pathway is linked to tumor metastasis via stimulation of invasion and migration in association with cytokines like interleukin‐8 (IL‐8) and matrix metalloproteinases (MMPs), as demonstrated for head and neck squamous cell carcinoma (HNSCC) (Shimizu et al., 2008). Accordingly, high expression of NT and NTR1 was found to correlate with shorter disease‐free survival in patients with HNSCC. Furthermore, IL‐8 constitutes an important factor implicated in invasion and metastasis of pancreatic cancer as well (Kuwada et al., 2003; Li et al., 2008).
In the present study involving pancreatic cancer cell lines we investigated the effects of a stable analog of NT on intracellular pH (pHi) and expression of IL‐8. Several growth factors have been reported to affect cellular pH homeostasis and are furthermore expected to be implicated in the selection of a highly metastatic phenotype of cancer cells (Bianchini et al., 1997). In addition, we screened for NT analog‐induced variations of the phosphorylation pattern of kinases and the transcription factor cAMP response element binding protein (CREB) and investigated the putative involvement of particular protein kinases in NT‐induced alteration of pHi by application of signal transduction inhibitors.
2. Results
2.1. Release of intracellular Ca2+ in response to Lys8‐ψ‐Lys9NT(8–13)
To prove the presence of functional NTR1, cells were stimulated with the stable NT analog Lys8‐ψ‐Lys9NT(8–13) and changes in intracellular Ca2+ recorded by ratiometric measurement of fura‐2 fluorescence in spectrofluorimetry. Addition of Lys8‐ψ‐Lys9NT(8–13) to the three pancreatic cancer cell lines BxPC‐3, PANC‐1, and MIA PaCa‐2 resulted in a rapid and transient increase of free intracellular Ca2+. Basically, optimal responses were obtained at concentrations ranging from 100–400nM Lys8‐ψ‐Lys9NT(8–13). In a typical experiment as indicated in Figure 1, BxPC‐3 cells revealed maximal intracellular Ca2+ concentrations of approximately 535nM (basal intracellular Ca2+: 80nM), and MIA PaCa‐2 cells 410nM (basal intracellular Ca2+: 220nM), respectively, in response to 100nM Lys8‐ψ‐Lys9NT(8–13). Elevation of intracellular Ca2+ was more prolonged in BxPC‐3 cells. Similar results were obtained for PANC‐1 as well as for NTR1‐expressing HT‐29 colon cancer cells (data not shown). The Lys8‐ψ‐Lys9NT(8–13)‐induced Ca2+ response was completely abrogated when cells were pretreated with 20μM NTR antagonist SR 142948 (Figure 1).
Figure 1.
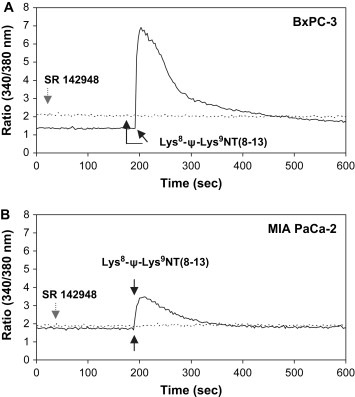
NT analog‐induced Ca2+ response in pancreatic cancer cells. Typical experiments showing alterations of intracellular Ca2+ in response to Lys8‐ψ‐Lys9NT(8–13) in (A) BxPC‐3 and (B) MIA PaCa‐2 cells. The solid line represents stimulation with Lys8‐ψ‐Lys9NT(8–13), the dotted line indicates sequential addition of NTR‐inhibitor SR 142948 and Lys8‐ψ‐Lys9NT(8–13). Application of Lys8‐ψ‐Lys9NT(8–13) or SR 142948 are marked by black or grey arrows, respectively.
2.2. Modulation of intracellular pH (pHi ) in response to Lys8‐ψ‐Lys9NT(8–13)
To investigate whether Lys8‐ψ‐Lys9NT(8–13) affects intracellular pH (pHi) cells were stimulated with the NT analog and changes of BCECF fluorescence were monitored spectrofluorimetrically. Typical experiments are shown in Figure 2. In detail, BxPC‐3 cells stimulated with 100nM Lys8‐ψ‐Lys9NT(8–13) exhibited rapid intracellular alkalinization (Figure 2A) of ΔpHi+0.197±0.089 (n=12) on average. In general, the pancreatic cancer cells revealed optimal pHi responses at 100–800nM Lys8‐ψ‐Lys9NT(8–13) persisting for more than 30min (data not shown). PANC‐1 as well as AsPC‐1 pancreatic cancer and HT‐29 colon cancer cells yielded increases in pHi in response to Lys8‐ψ‐Lys9NT(8–13) similar to BxPC‐3, namely ΔpHi+0.144±0.031 (PANC‐1), +0.130±0.004 (AsPC‐1), and +0.120±0.023 (HT‐29), respectively (n=3). Similar results were obtained using the native tridecapeptide NT (data not shown). Under the experimental conditions used here, the main active cellular pH regulator is the sodium–proton exchanger 1 (NHE1), and Lys8‐ψ‐Lys9NT(8–13)‐induced intracellular alkalinization was sensitive to 1mM amiloride (Figure 2B). Amiloride blocks NHE1, consequently leading to intracellular acidification, and in presence of this inhibitor, Lys8‐ψ‐Lys9NT(8–13) had no effect on pHi. Preincubation of BxPC‐3 cells with 10μM SR 142948 prevented intracellular alkalinization (ΔpHi+0.040 units) when Lys8‐ψ‐Lys9NT(8–13) was added subsequently (data not shown). In contrast to BxPC‐3, PANC‐1, AsPC‐1, and HT‐29, MIA PaCa‐2 cells developed slight intracellular acidification of ΔpHi ‐0.010±0.009 (n=5) on average (Figure 2C).
Figure 2.
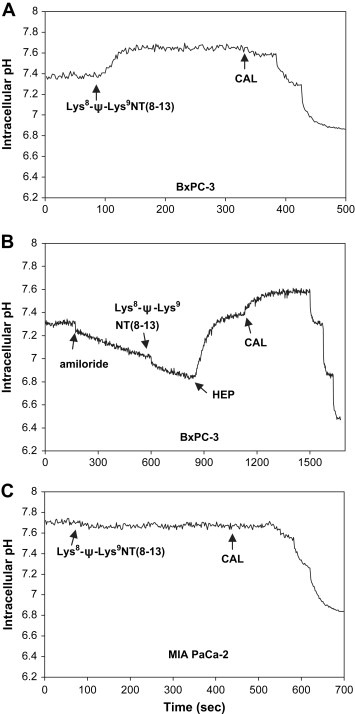
NT analog‐induced pHi response in pancreatic cancer cells. (A) Changes in pHi in BxPC‐3 cells treated with Lys8‐ψ‐Lys9NT(8–13) and (B) the same cells exposed to amiloride prior to stimulation with Lys8‐ψ‐Lys9NT(8–13). (C) Course of pHi in Lys8‐ψ‐Lys9NT(8–13)‐treated MIA PaCa‐2 cells is shown for comparison. Addition of compounds is indicated by arrows (HEP, HEPES‐buffered Ringer solution; CAL, calibration).
2.3. Effects of Lys8‐ψ‐Lys9NT(8–13) on phosphorylation of kinases and the transcription factor CREB
In order to investigate putative signaling pathways mediating the pHi effect of Lys8‐ψ‐Lys9NT(8–13), BxPC‐3 cells exhibiting pronounced intracellular alkalinization and MIA PaCa‐2 cells showing slight cytoplasmic acidification in response to the NT analog were compared. Therefore, the phosphorylation status of certain effector proteins following treatment of cells with Lys8‐ψ‐Lys9NT(8–13) was assessed by a protein kinase array that detects specific phosphorylation of a total of 46 sites. Since intracellular alkalinization induced by Lys8‐ψ‐Lys9NT(8–13) continued over a minimum period of 30min, cells were incubated with 200nM Lys8‐ψ‐Lys9NT(8–13) under serum‐free conditions for 15min. As shown in Figure 3, BxPC‐3 and MIA PaCa‐2 exhibited differing patterns of protein phosphorylation: BxPC‐3 cells showed enhanced phosphorylation of ERK1/2 (+12.3±3.3%), p38α mitogen‐activated protein kinase (p38α MAPK; +16.3±0.8%), mitogen‐ and stress‐activated kinase 1/2 (MSK1/2; +46.2±7.2%), c‐Jun N‐terminal kinase (JNK; +67.6±12.4), and CREB (+20.5±3.2%), whereas phosphorylation of p90 ribosomal S6 kinase (RSK1/2/3; −23.8±8.0%) was decreased (Figure 3A). Elevated phosphorylation of MSK1/2 in response to Lys8‐ψ‐Lys9NT(8–13) was proved for NTR1‐positive HT‐29 colon cancer cells as well (data not shown). By contrast, MIA PaCa‐2 cells exhibited increased phosphorylation of RSK1/2/3 (+18.5±2.2%) in response to Lys8‐ψ‐Lys9NT(8–13), while phosphorylation of p38α MAPK (−26.9±20.0%), JNK (+0.1±8.1), and CREB (−4.8±2.6%) was not significantly affected (Figure 3B). The amount of phosphorylated ERK1/2 (−4.9±1.0%) and MSK1/2 (−44.5±16.8%) was decreased.
Figure 3.
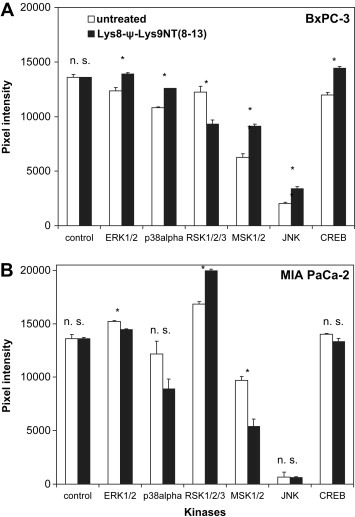
NT analog‐induced changes in phosphorylation of selected kinases and substrates. Pixel intensities shown correspond to the phosphorylation level of affected proteins in Lys8‐ψ‐Lys9NT(8–13)‐treated (A) BxPC‐3 and (B) MIA PaCa‐2 cells, respectively, compared to untreated cells. ERK1/2, extracellular signal‐regulated kinase; p38α, p38α mitogen‐activated protein kinase; RSK1/2, p90 ribosomal S6 kinase; MSK1/2, mitogen‐ and stress‐activated kinase 1/2; JNK, c‐Jun N‐terminal kinase; CREB, cAMP response element binding protein. Data are presented as mean ± SD of duplicate measurements (∗p<0.05; n.s., nonsignificant).
2.4. Inhibition of putative kinases mediating the Lys8‐ψ‐Lys9NT(8–13)‐induced pHi effect
To investigate a possible functional involvement of protein kinases identified by the kinase arrays in regulation of pHi in response to Lys8‐ψ‐Lys9NT(8–13), the inhibitors SC 68376 (p38α MAPK), dimethylfumarate (DMF; MSK1/2), and PD 98059 (mitogen‐activated protein kinase kinase; MEK1/2) were applied in experiments using BxPC‐3 cells. The presence of 20μM SC 68376 alone resulted in a decrease of cytoplasmic pH of ΔpHi−0.021, and sequential application of Lys8‐ψ‐Lys9NT(8–13) led to further acidification of another ΔpHi−0.009 (data not shown). Similarly, as demonstrated in Figure 4, addition of 140μM DMF alone caused significant intracellular acidification of approximately ΔpHi−0.045, and subsequent stimulation with Lys8‐ψ‐Lys9NT(8–13) markedly reduced the increase in cytoplasmic pH (ΔpHi+0.037) compared to BxPC‐3 cells not preexposed to DMF (Figure 2A). However, pHi following application of Lys8‐ψ‐Lys9NT(8–13) was more acidic (ΔpHi−0.069) compared to DMF treatment of cells alone. The presence of 5μM PD 98059 alone induced an increase in cytosolic pH of ΔpHi+0.074 and inhibited Lys8‐ψ‐Lys9NT(8–13)‐induced intracellular alkalinization (maximal ΔpHi+0.020; data not shown). Application of DMF to MIA PaCa‐2 cells triggered slight acidification of the cytoplasm and, as observed in MIA PaCa‐2 cells not pretreated with DMF, Lys8‐ψ‐Lys9NT(8–13)‐induced pHi response was absent (data not shown).
Figure 4.
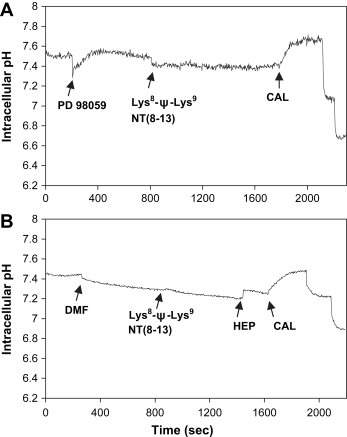
Effects of inhibitors of MEK1/2 or MSK1/2 on NT analog‐induced intracellular alkalinization. BxPC‐3 cells were pretreated with (A) PD 98059 or (B) DMF, respectively, and subsequently stimulated with Lys8‐ψ‐Lys9NT(8–13). Addition of inhibitors or Lys8‐ψ‐Lys9NT(8–13) is marked by arrows (DMF, dimethylfumarate).
2.5. NTR1 protein expression in dependence of extracellular pH (pHe )
Increased cellular efflux of protons from the cytosol by NHE1 leading to intracellular alkalinization is expected to result in localized extracellular acidosis. To investigate whether differing extracellular pH conditions affect cell surface expression of NTR1, cells were incubated in media of pH 7.1, 7.4, and 7.8, respectively, and analyzed by flow cytometry. As shown in Figure 5A, BxPC‐3 and PANC‐1 cells revealed upregulation of NTR1 surface expression at pHe 7.1 and downregulation at pHe 7.8, respectively, compared to the physiological pHe of 7.4. By contrast, NTR1 expression in MIA PaCa‐2 was significantly lower at all and declined with decreasing extracellular pH (pHe).
Figure 5.
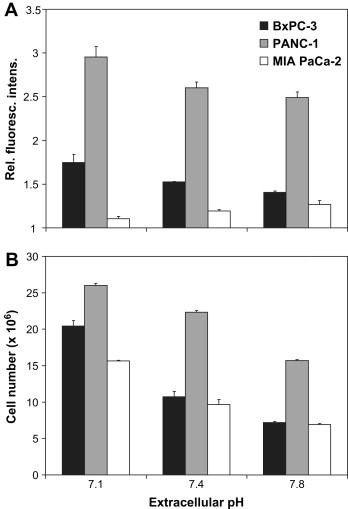
Dependence of NTR1 expression and cell proliferation on extracellular pH. Modulation of (A) protein expression of NTR1 and (B) cell proliferation under acidic, normal, and alkaline extracellular conditions in BxPC‐3, PANC‐1, and MIA PaCa‐2 cells. Data are presented as mean ± SD of duplicate measurements of relative fluorescence intensities and cell numbers, respectively. In both tests, all differences of values at acidic and alkaline pHe to normal pHe are statistically significant, with exception of expression of NTR1 in MIA PaCa‐2 cells.
2.6. Cell proliferation in dependence of pHe
Cell numbers counted following incubation of cells in media of pH 7.1, 7.4, and 7.8, respectively, revealed increased proliferation under acidic conditions and reduced cell growth at pHe 7.8 for all three pancreatic cancer cell lines (Figure 5B).
Compared to the physiological pHe of 7.4, BxPC‐3 exhibited augmented proliferation by 190.2±10.1% at low pHe and growth inhibition to 67.0±8.5% at alkaline conditions, while PANC‐1 cells revealed a slight increase of cell numbers by 116.3±2.0% at pHe 7.1 and a decrease to 70.2±1.8% at pHe 7.8. Proliferation of MIA PaCa‐2 cells was enhanced by 162.2±7.8% under acidic conditions and impaired to 71.5±9.4% at pHe 7.8 in comparison to normal pHe.
2.7. Cellular release of IL‐8
Constitutive and Lys8‐ψ‐Lys9NT(8–13)‐induced production of IL‐8 in BxPC‐3, PANC‐1, and MIA PaCa‐2 cells was quantified in cell culture supernatants following incubation under serum‐free conditions for 7h. Furthermore, amiloride was used to elucidate a potential influence of the pH regulator NHE1 on cellular IL‐8 production (Figure 6). For BxPC‐3 cells, constitutive levels of 68.9±4.2pg/ml IL‐8 were found, and 100nM Lys8‐ψ‐Lys9NT(8–13) stimulated production of IL‐8 by +42.7±6.8% (Figure 6A). Amiloride inhibited constitutive and Lys8‐ψ‐Lys9NT(8–13)‐triggered IL‐8 secretion in a dose‐dependent manner. PANC‐1 cells revealed constitutive IL‐8 levels of 130.6±7.6pg/ml that was stimulated by Lys8‐ψ‐Lys9NT(8–13) by +75.3±10.1% (Figure 6B). Constitutive IL‐8 production and, to a larger extent, the proportion of Lys8‐ψ‐Lys9NT(8–13)‐induced IL‐8 were impaired by amiloride dose‐dependently. MIA PaCa‐2 cells exhibited also considerably high expression of IL‐8 (166.8±2.9pg/ml) relatively insensitive to Lys8‐ψ‐Lys9NT(8–13) but dependent on an active NHE1 (Figure 6C). 10μM SR 142948 repressed both constitutive (−2.8±4.8%) and NT analog‐induced IL‐8 secretion (−40.2±7.5%) in BxPC‐3 cells (data not shown).
Figure 6.
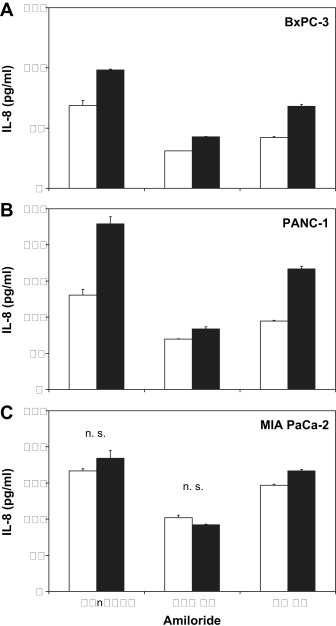
NT analog‐induced IL‐8 production in dependence on NHE1. Constitutive and Lys8‐ψ‐Lys9NT(8–13)‐triggered IL‐8 release of (A) BxPC‐3, (B) PANC‐1, and (C) MIA PaCa‐2 cells in the presence or absence of the NHE1 inhibitor amiloride, respectively. Data are presented as mean ± SD of duplicate measurements (all differences significant, except those marked n.s. for nonsignificant).
3. Discussion
Pancreatic adenocarcinoma is characterized by highly aggressive tumor growth resulting in dismal prognosis in patients. Several tumor growth factors including the epidermal growth factor (EGF) are involved in the biology of this disease and accordingly, the monoclonal antibody cetuximab, directed to the epidermal growth factor receptor (EGFR), or erlotinib, an inhibitor of EGFR, in combination with gemcitabine improved survival in clinical trials (Ghaneh et al., 2007). Although production of NT and expression of NTR have been described for up to 90% of pancreatic tumors and cell lines, the role of NT–NTR signaling in growth and metastasis of this tumor is still not clear (Carraway and Plona, 2006). Therefore, the present study aimed at further characterization of functional effects of NT in pancreatic cancer cell lines and identification of affected signal transduction pathways.
Since NT is rapidly cleaved by endogenous enzymes, a stable C‐terminus hexapeptide analog comprising Lys residues in a reduced peptide bond in place of Arg, Lys8‐ψ‐Lys9NT(8–13), was used in the present study (Kitabgi, 2006; Lugrin et al., 1991). Addition of this analog triggered SR 142948‐sensitive increases of intracellular Ca2+ in BxPC‐3, PANC‐1, and MIA PaCa‐2 cells in good accordance with the literature for full‐length NT (Ryder et al., 2001; Thomas et al., 2003; Heasley, 2001). Transient elevations of intracellular Ca2+ were reported to activate NHE1 via different pathways in response to growth factors and hypertonicity (McSwine et al., 1996). Our experiments revealed for the first time that, with the exception of MIA PaCa‐2, stimulation of BxPC‐3, PANC‐1 and other pancreatic cancer cell lines with Lys8‐ψ‐Lys9NT(8–13) triggered pronounced intracellular alkalinization. Under the experimental conditions used, NHE1 is the predominant cellular pH regulator and accordingly, the Lys8‐ψ‐Lys9NT(8–13)‐induced increase in cytosolic pH proved to be sensitive to the NHE1 inhibitor amiloride. Activity of NHE1 is known to be subject to modulation by intracellular acidosis and growth factors by increased protein expression and/or modification of regulatory sites within the C‐terminus, for example through phosphorylation of several Ser and Thr residues by the protein kinases RSK1/2/3, ERK1/2, and p38α MAPK (Chiang et al., 2008; Khaled et al., 2001; Fliegel, 2005; Slepkov et al., 2007; Smith et al., 2005). Cytosolic alkalinization in response to exposure to bases was reported to increase JNK and p38 MAPK activities by a calcium‐independent mechanism (Shrode et al., 1997).
We screened Lys8‐ψ‐Lys9NT(8–13)‐induced alterations in signaling pathways using protein kinase arrays that detect specific phosphorylation of a total of 46 sites. In BxPC‐3, as well as NTR1‐expressing HT‐29 colon cancer cells, the NT analog enhanced phosphorylation of MSK1/2 and JNK to a major extent and of ERK1/2, p38α MAPK, and CREB significantly, whereas phosphorylation of RSK1/2/3 was decreased. In contrast, MIA PaCa‐2 cells lacking Lys8‐ψ‐Lys9NT(8–13)‐induced intracellular alkalinization, exhibited increased phosphorylation of RSK1/2/3 in response to Lys8‐ψ‐Lys9NT(8–13), while ERK1/2 and CREB were only slightly affected and phosphorylation of p38α MAPK, and MSK1/2 was markedly decreased.
In a next step, the effects of NT–NTR signal transduction mediators putatively involved in Lys8‐ψ‐Lys9NT(8–13)‐induced mediators alkalinization were investigated. Preincubation of BxPC‐3 cells with SR 142948, PD 98059 or SC 68376, inhibitors of NTR1/2, MEK1/2 and p38α MAPK, respectively, eliminated Lys8‐ψ‐Lys9NT(8–13)‐induced alkalinization. Furthermore, significant intracellular acidification and suppression of NT analog‐induced alkalinization were observed following application of the MSK1/2 inhibitor DMF (Gesser et al., 2007). Therefore, inhibition of kinase MSK1/2 or the upstream effectors MEK1/2 or p38α MAPK abolishes the Lys8‐ψ‐Lys9NT(8–13)‐induced increase in pHi.
According to our data, MSK1/2 instead of the closely related RSK1/2/3 is the dominant kinase activating NHE1 in BxPC‐3 pancreatic cancer cells, as proved by specific inhibition of MSK1/2 with DMF as well as dependence of this kinase on activation by both ERK1/2 and p38α MAPK and the differing protein phosphorylation patterns in BxPC‐3 and MIA PaCa‐2 cells. Activation of MSK1/2 by stress or mitogenic stimuli as a result of phosphorylation by ERK1/2 and p38α MAPK and autophosphorylation of Ser376 was reported in the literature (Deak et al., 1998; Dunn et al., 2005). Substrates of MSK1/2 are translation factors, nuclear proteins, CREB, activating transcription factor 1, and nuclear factor‐κB (NF‐κB), among others (Wiggin et al., 2002; Deak et al., 1998; Liu et al., 2002; Soloaga et al., 2003; Arthur and Cohen, 2000; Vermeulen et al., 2003). The MSK1/2 inhibitor DMF is the most active compound currently used empirically for the treatment of psoriasis where it downregulates p38α MAPK‐ and MSK1/2‐activated NF‐κB/Rel transcription factors specifically, resulting in decreased production of IL‐8 and IL‐20 (Gesser et al., 2007). Furthermore, DMF was demonstrated to possess antiproliferative and proapoptotic effects on melanoma cells in vitro and to delay growth and spread of melanoma xenografts in experimental animal models (Loewe et al., 2006).
Hypoxic and acidic conditions play an important role in the progression of a benign tumor to invasive cancer (Fang et al., 2008; Brahimi‐Horn and Pouyssegur, 2007). Acidic regions are frequently found in solid tumors with insufficient or intermittent supply of oxygen, and acidosis has been linked to induction of a highly malignant phenotype. Lactate produced during anaerobic or aerobic glycolysis has been considered to be the main source of intratumoral acidity (Gatenby et al., 2007). Melanoma cells selected under acidic extracellular conditions exhibited permanently enhanced heterogeneity among cells and increased rates of invasion (Moellering et al., 2008). In particular, NHE1 has been implicated in these processes in a number of tumors. In the malignant transformation of cells, NHE1‐dependent intracellular alkalinization was reported to be an early event preceeding increased proliferation, serum‐ and anchorage‐independent growth, and glycolysis (Reshkin et al., 2000). Chiang et al. showed that NHE1 protein levels were higher in malign tissues of cervix cancer patients with dismal prognosis and could be stimulated by EGF in cervix cancer cells (Chiang et al., 2008). The importance of NHE1 in the growth and malignancy of human gastric carcinoma cells was furthermore shown by antisense gene transfection (Liu et al., 2008). This downregulation of NHE1 resulted in significantly decreased pHi, growth inhibition, cell cycle arrest in G1/0 phase, and increased apoptosis, concomitant with impeded tumorigenicity. All three pancreatic cancer cell lines studied here exhibited highest proliferation at low pHe. Furthermore, BxPC‐3 and PANC‐1 cells showed highest NTR1 protein expression under acidic extracellular conditions. Consequently, enhanced NHE1‐mediated proton efflux resulting in localized extracellular acidification of the microenvironment may be a further important factor contributing to acidosis in solid tumors, independently of increased glycolysis caused by hypoxic conditions. It may be concluded that the effects mediated by NT–NTR signaling described here have greatest impact in small tumor cell aggregates, hence providing an explanation for the observation that NTR antagonists are largely ineffective to stop the growth of larger tumors in experimental animal models (Carraway and Plona, 2006).
A central player of metastasis is IL‐8, an autocrine/paracrine factor that affects several cellular processes and, importantly, triggers release of MMPs or uroplasminogen activator from cells (Xie, 2001). These enzymes with a pH optimum at acidic conditions degrade components of the extracellular matrix to promote tissue invasion and metastasis (Duffy et al., 2008). Upregulation of IL‐8 in solid tumors like colon and pancreatic cancer is known to be stimulated by the hypoxic and acidic environment, and a mild decrease in extracellular pH to 6.9–7.4 was shown to stimulate activator protein 1 and NF‐κB (Xie, 2001; Yuan et al., 2005). Furthermore, NT–NTR signaling in HNSCC was found to correlate with expression of IL‐8 and MMP‐1 as well as formation of distant metastases in association with reduced survival in patients (Shimizu et al., 2008). In addition, NT stimulates IL‐8 production and migration of human colon cancer cells and exerts autocrine mitogenic effects on melanoma cell lines, colon cancer and pancreatic cancer cells and may predict adverse outcome in cancer patients (Xie, 2001; Wang et al., 2006). IL‐8 mRNA was substantially overexpressed in 11 of 14 (79%) clinical pancreatic adenocarcinoma samples compared with that in their surrounding normal tissues (Li et al., 2008). Maximal IL‐8 expression was shown to be the result of a combination of stimulation of gene transcription by NF‐κB and JNK signaling pathways, derepression of the IL‐8 gene promoter by histone acetylation, and IL‐8 mRNA stabilization by the p38 MAPK pathway. Our experiments clearly demonstrate that Lys8‐ψ‐Lys9NT(8–13) induced secretion of IL‐8 in BxPC‐3 and PANC‐1 cells that concomitantly exhibited intracellular alkalinization in response to the NT analog. By contrast, MIA PaCa‐2 cells did not alter IL‐8 production in response to the NT analog. This cell line seems to constitute a different phenotype exhibiting growth in the form of scattered single cells and absence of Lys8‐ψ‐Lys9NT(8–13)‐induced intracellular alkalinization, in contrast to NT analog‐responsive BxPC‐3 and PANC‐1 cells that form dense confluent monolayers. Constitutive and, to a greater extent, Lys8‐ψ‐Lys9NT(8–13)‐induced IL‐8 expression in BxPC‐3 and PANC‐1 cells were sensitive to amiloride, pointing to the preferential involvement of NHE1 in the NT analog‐induced stimulation of IL‐8 release. Enhanced phosphorylation of CREB and the upstream kinase MSK1/2, as we found for Lys8‐ψ‐Lys9NT(8–13)‐treated BxPC‐3 cells, may furthermore contribute to overexpression of IL‐8 (Iourgenko et al., 2003). Therefore, it may be concluded that the NT signaling pathway diverges at the point of MSK1/2 in BxPC‐3 cells in which this kinase stimulates NHE1 on the one hand and, on the other hand, phosphorylates and activates the transcription factor CREB and increases IL‐8 production. MIA PaCa‐2 cells were reported to be highly tumorigenic in mouse xenograft models (Carraway and Plona, 2006).
In conclusion, NT–NTR signaling in pancreatic cancer cells seems to promote induction of a metastatic phenotype by activation of distinct signal transduction pathways, generation of intracellular alkalinization/extracellular acidification and increased expression of IL‐8, in contrast to its varying effects on tumor cell proliferation. Growth factors like NT and EGF seem to have the capability to stimulate NHE1 and to promote an acidic extracellular microenvironment favoring tumor cell invasion at a very early stage of tumor development, prior to acidosis linked to a metabolic switch to glycolysis in larger cancers. The results of this study suggest that MSK1/2 may be of high significance as drug target in pancreatic cancer.
4. Experimental procedures
4.1. Cell culture
Unless otherwise noted, all chemicals were obtained from Sigma‐Aldrich (St. Louis, MO, USA). Cell lines were obtained from the American Type Culture Collection (ATCC; Rockville, MD, USA) and cultured in RPMI‐1640 bicarbonate medium (Seromed, Berlin, Germany) supplemented with 10% heat‐inactivated fetal bovine serum (Seromed), 4mM l‐glutamine, 50 units/ml penicillin, 50μg/ml streptomycin, and 100μg/ml neomycin in a humidified incubator (Heraeus Cytoperm, Hanau, Germany; 5% CO2, 37°C, 95% humidity). Cell culture media yielding pH values of 7.1, 7.4, and 7.8 under tissue culture conditions were prepared by supplementation of bicarbonate‐free RPMI‐1640 medium with 10, 25, and 45mM sodium bicarbonate, respectively. Cells were subcultured by trypsination with 0.05% trypsin solution containing 0.02% ethylene diamine tetraacetic acid three times a week and checked for mycoplasma contamination (Mycoplasma PCR ELISA, Roche Diagnostics, Vienna, Austria). Cell numbers were counted using a microcellcounter (CC110, Sysmex TOA, Tokyo, Japan).
4.2. Spectrofluorimetric measurement of intracellular Ca2+
Intracellular Ca2+ was quantified monitoring the fluorescence intensity of cells loaded with the dye fura‐2 acetoxymethyl ester (fura‐2‐AM; Molecular Probes, Eugene, OR, USA). Therefore, cells in medium were labeled with 0.625mM fura‐2‐AM at 37°C for 30min. Fura‐2 fluorescence intensity ratios were recorded in HEPES‐Ringer solution (150mM NaCl, 2.5mM KH2PO4, 1mM CaCl2, 1mM MgSO4, 10mM glucose, and 20mM HEPES; pH=7.4) at room temperature (RT) under stirring in a cuvette‐based spectrofluorimetric system (QuantaMaster and Felix32 software, Photon Technology International, PTI, New Jersey, NY, USA) with alternating excitation wavelengths of 345 and 380nm and an emission wavelength of 510nm, respectively. Maximal and minimal fura‐2 ratios (R max and R min) were recorded in the presence of 5% Nonidet P‐40 and 10mM ethylene glycol tetraacetic acid, respectively. Intracellular Ca2+ was calculated according to Grynkiewicz equation Ca2+=K d×(R−R min)/(R max−R), where R is the fluorescence intensity ratio at the unknown intracellular Ca2+ concentration and K d denotes the apparent dissociation constant of the fura‐2‐Ca2+ complex (Grynkiewicz et al., 1985). K d was previously determined using the calcium calibration buffer kit #1 (Molecular Probes). The stable NT analog Lys8‐ψ‐Lys9NT(8–13) was obtained from Bachem (Weil am Rhein, Germany) and the NTR‐inhibitor SR 142948 from Tocris (Tocris Cookson, Bristol, UK).
4.3. Spectrofluorimetric measurement of pHi
Cells were precultured in Leighton tubes (Costar, Cambridge, MA, USA), loaded with 10μM BCECF‐AM (Molecular Probes) in HEPES‐buffered Ringer solution in the dark at RT for 30min and mounted in a cuvette‐based spectrofluorimeter (PTI). Emission was recorded at 525nm following excitation of cells to alternating wavelengths of 440 and 490nm, respectively (Felix software, Photon Technology). At the end of each experiment, cells were transferred to calibration buffer (140mM KCl, 1.3mM MgSO4, 2mM CaCl2, 12mM glucose, 20mM HEPES, 10μM nigericin) and 490/440nm ratios were obtained for four different declining pHi=pHe values covering the range of pH 7.8–6.5 by stepwise addition of 0.1M HCl (Wenzl et al., 1989). The signal transduction inhibitor PD 98059 was purchased from Calbiochem (Merck Chemicals, Darmstadt, Germany).
4.4. Protein kinase array
Profiles of 46 phosphorylation sites of selected protein kinases and their substrates were obtained using a Phospho‐Kinase Array Kit (Proteome Profiler Antibody Array, ARY003, R&D Systems, Minneapolis, MN, USA) according to the manufacturer's instructions. Cells cultivated in 162cm2 tissue culture flasks were serum‐starved (RPMI‐1640 medium, 4mM l‐glutamine) for 24h. Control and treated cells were rinsed with phosphate‐buffered saline (PBS), solubilized in lysis buffer at 1×10⁷ cells/ml under constant shaking at 4°C for 30min and aliquots stored frozen at −80°C. Membranes of the assay with spotted catcher antibodies were incubated with diluted cell lysates at 4°C overnight. Thereafter, cocktails of biotinylated detection antibodies were added at RT for 2h. Finally, phosphorylated proteins were revealed using streptavidin‐horseradish peroxidase (HRP)/chemiluminescence substrate (SuperSignal West Pico, Thermo Fisher Scientific, Rockford, IL, USA). The resulting spots on films (Amersham Hyperfilm ECL, GE Healthcare Life Sciences, Buckinghamshire, UK) were scanned and images quantified using ImageQuant TL v2005 (Amersham Biosciences, Buckinghamshire, UK) and Microsoft Excel software. In detail, the phosphorylation sites of the proteins covered in this study were residues Thr202/Tyr204 and Thr185/Tyr187 of ERK1/2, Thr180/Tyr182 of p38α MAPK, Ser380 of RSK1/2/3, Ser376/Ser360 of MSK1/2, Thr183/Tyr185 and Thr221/Tyr223 of JNK, and Ser133 of the transcription factor CREB, respectively.
4.5. Flow cytometry
For detection of NTR1, harvested cells (4×10⁵) were incubated with anti‐NTR1 monoclonal antibody clone B‐N6 (dilution 1:100, Cell Sciences, Canton, MA, USA) in microtiter plates at 4°C overnight, stained with anti‐mouse IgG‐FITC conjugate and analyzed using the Cytomics FC500 flow cytometer (Beckman Coulter, Fullerton, CA, USA). Antigen expression was calculated as relative fluorescence intensity (mean fluorescence antibody/mean fluorescence control).
4.6. Determination of IL‐8
Cellular IL‐8 production was detected using the Strakine Tool Box ELISA Kit (Strathmann Biotec, Hamburg, Germany) according to the manufacturer's instructions. Briefly, the catcher antibody in 0.1M carbonate/bicarbonate buffer (pH 9.6) was coated to the wells of a microtiter plate overnight. Unspecific binding sites were blocked and, following washes with 0.05% Tween 20 in PBS, standards and samples were added to the plate and incubated at RT for 60min. Subsequent to washing, biotinylated antibody was applied and the plate incubated at RT for another 60min. Detection was accomplished using streptavidin‐HRP conjugate (RT, 30min) and 3,5,3′,5′‐tetramethylbenzidine substrate solution. Reaction was stopped with 1.8 M sulphuric acid and optical density read at 450nm. The concentration of IL‐8 in the samples was calculated according to the standard curve (0–240pg/ml IL‐8).
4.7. Statistics
Values are demonstrated as mean ± SD. Statistical analysis was done using Student's t‐test. Differences with p<0.05 were regarded as statistically significant.
Olszewski Ulrike, Hamilton Gerhard, (2009), Neurotensin signaling induces intracellular alkalinization and interleukin‐8 expression in human pancreatic cancer cells, Molecular Oncology, 3, doi: 10.1016/j.molonc.2009.01.006.
References
- Arthur, J.S. , Cohen, P. , 2000. MSK1 is required for CREB phosphorylation in response to mitogens in mouse embryonic stem cells. FEBS Lett.. 482, 44–48. [DOI] [PubMed] [Google Scholar]
- Bianchini, L. , L'Allemain, G. , Pouyssegur, J. , 1997. The p42/p44 mitogen-activated protein kinase cascade is determinant in mediating activation of the Na+/H+ exchanger (NHE1 isoform) in response to growth factors. J. Biol. Chem.. 272, 271–279. [DOI] [PubMed] [Google Scholar]
- Bozou, J.C. , Amar, S. , Vincent, J.P. , Kitabgi, P. , 1986. Neurotensin-mediated inhibition of cyclic AMP formation in neuroblastoma N1E115 cells: involvement of the inhibitory GTP-binding component of adenylate cyclase. Mol. Pharmacol.. 29, 489–496. [PubMed] [Google Scholar]
- Brahimi-Horn, M.C. , Pouyssegur, J. , 2007. Hypoxia in cancer cell metabolism and pH regulation. Essays Biochem.. 43, 165–178. [DOI] [PubMed] [Google Scholar]
- Carraway, R. , Leeman, S.E. , 1973. The isolation of a new hypotensive peptide, neurotensin, from bovine hypothalami. J. Biol. Chem.. 248, 6854–6861. [PubMed] [Google Scholar]
- Carraway, R.E. , Plona, A.M. , 2006. Involvement of neurotensin in cancer growth: evidence, mechanisms and development of diagnostic tools. Peptides. 27, 2445–2460. [DOI] [PubMed] [Google Scholar]
- Chiang, Y. , Chou, C.Y. , Hsu, K.F. , Huang, Y.F. , Shen, M.R. , 2008. EGF upregulates Na+/H+ exchanger NHE1 by post-translational regulation that is important for cervical cancer cell invasiveness. J. Cell. Physiol.. 214, 810–819. [DOI] [PubMed] [Google Scholar]
- Dal Farra, C. , Sarret, P. , Navarro, V. , Botto, J.M. , Mazella, J. , Vincent, J.P. , 2001. Involvement of the neurotensin receptor subtype NTR3 in the growth effect of neurotensin on cancer cell lines. Int. J. Cancer. 92, 503–509. [DOI] [PubMed] [Google Scholar]
- Deak, M. , Clifton, A.D. , Lucocq, L.M. , Alessi, D.R. , 1998. Mitogen- and stress-activated protein kinase-1 (MSK1) is directly activated by MAPK and SAPK2/p38, and may mediate activation of CREB. EMBO J.. 17, 4426–4441. [DOI] [PMC free article] [PubMed] [Google Scholar]
- Duffy, M.J. , McGowan, P.M. , Gallagher, W.M. , 2008. Cancer invasion and metastasis: changing views. J. Pathol.. 214, 283–293. [DOI] [PubMed] [Google Scholar]
- Dunn, K.L. , Espino, P.S. , Drobic, B. , He, S. , Davie, J.R. , 2005. The Ras-MAPK signal transduction pathway, cancer and chromatin remodeling. Biochem. Cell. Biol.. 83, 1–14. [DOI] [PubMed] [Google Scholar]
- Fang, J.S. , Gillies, R.D. , Gatenby, R.A. , 2008. Adaptation to hypoxia and acidosis in carcinogenesis and tumor progression. Semin. Cancer Biol.. 18, 330–337. [DOI] [PMC free article] [PubMed] [Google Scholar]
- Fliegel, L. , 2005. The Na+/H+ exchanger isoform 1. Int. J. Biochem. Cell. Biol.. 37, 33–37. [DOI] [PubMed] [Google Scholar]
- Gatenby, R.A. , Smallbone, K. , Maini, P.K. , Rose, F. , Averill, J. , Nagle, R.B. , Worrall, L. , Gillies, R.J. , 2007. Cellular adaptations to hypoxia and acidosis during somatic evolution of breast cancer. Br. J. Cancer. 97, 646–653. [DOI] [PMC free article] [PubMed] [Google Scholar]
- Gesser, B. , Johansen, C. , Rasmussen, M.K. , Funding, A.T. , Otkjaer, K. , Kjellerup, R.B. , Kragballe, K. , Iversen, L. , 2007. Dimethylfumarate specifically inhibits the mitogen and stress-activated kinases 1 and 2 (MSK1/2): possible role for its anti-psoriatic effect. J. Invest. Dermatol.. 127, 2129–2137. [DOI] [PubMed] [Google Scholar]
- Ghaneh, P. , Costello, E. , Neoptolemos, J.P. , 2007. Biology and management of pancreatic cancer. Gut. 56, 1134–1152. [DOI] [PMC free article] [PubMed] [Google Scholar]
- Grynkiewicz, G. , Poenie, M. , Tsien, R.Y. , 1985. A new generation of Ca2+ indicators with greatly improved fluorescence properties. J. Biol. Chem.. 260, 3440–3450. [PubMed] [Google Scholar]
- Gully, D. , Canton, M. , Boigegrain, R. , Jeanjean, F. , Molimard, J.C. , Poncelet, M. , Gueudet, C. , Heaulme, M. , Leyris, R. , Brouard, A. , 1993. Biochemical and pharmacological profile of a potent and selective nonpeptide antagonist of the neurotensin receptor. Proc. Natl. Acad. Sci. USA. 90, 65–69. [DOI] [PMC free article] [PubMed] [Google Scholar]
- Gully, D. , Labeeuw, B. , Boigegrain, R. , Oury-Donat, F. , Bachy, A. , Poncelet, M. , Steinberg, R. , Suaud-Chagny, M.F. , Santucci, V. , Vita, N. , 1997. Biochemical and pharmacological activities of SR 142948A, a new potent neurotensin receptor antagonist. J. Pharmacol. Exp. Ther.. 280, 802–812. [PubMed] [Google Scholar]
- Heasley, L.E. , 2001. Autocrine and paracrine signaling through neuropeptide receptors in human cancer. Oncogene. 20, 1563–1569. [DOI] [PubMed] [Google Scholar]
- Herzig, M.C. , Chapman, W.G. , Sheridan, A. , Rake, J.B. , Woynarowski, J.M. , 1999. Neurotensin receptor-mediated inhibition of pancreatic cancer cell growth by the neurotensin antagonist SR 48692. Anticancer Res.. 19, 213–219. [PubMed] [Google Scholar]
- Iourgenko, V. , Zhang, W. , Mickanin, C. , Daly, I. , Jiang, C. , Hexham, J.M. , Orth, A.P. , Miraglia, L. , Meltzer, J. , Garza, D. , 2003. Identification of a family of cAMP response element-binding protein coactivators by genome-scale functional analysis in mammalian cells. Proc. Natl. Acad. Sci. USA. 100, 12147–12152. [DOI] [PMC free article] [PubMed] [Google Scholar]
- Ishizuka, J. , Townsend, C.M. , Thompson, J.C. , 1993. Neurotensin regulates growth of human pancreatic cancer. Ann. Surg.. 217, 439–445. [DOI] [PMC free article] [PubMed] [Google Scholar]
- Iwase, K. , Evers, B.M. , Hellmich, M.R. , Kim, H.J. , Higashide, S. , Gully, D. , Thompson, J.C. , Townsend, C.M. , 1997. Inhibition of neurotensin-induced pancreatic carcinoma growth by a nonpeptide neurotensin receptor antagonist, SR48692. Cancer. 79, 1787–1793. [DOI] [PubMed] [Google Scholar]
- Khaled, A.R. , Moor, A.N. , Li, A. , Kim, K. , Ferris, D.K. , Muegge, K. , Fisher, R.J. , Fliegel, L. , Durum, S.K. , 2001. Trophic factor withdrawal: p38 mitogen-activated protein kinase activates NHE1, which induces intracellular alkalinization. Mol. Cell. Biol.. 21, 7545–7557. [DOI] [PMC free article] [PubMed] [Google Scholar]
- Kitabgi, P. , 2002. Targeting neurotensin receptors with agonists and antagonists for therapeutic purposes. Curr. Opin. Drug Discov. Devel.. 5, 764–776. [PubMed] [Google Scholar]
- Kitabgi, P. , 2006. Inactivation of neurotensin and neuromedin N by Zn metallopeptidases. Peptides. 27, 2515–2522. [DOI] [PubMed] [Google Scholar]
- Kitabgi, P. , Carraway, R. , Leeman, S.E. , 1976. Isolation of a tridecapeptide from bovine intestinal tissue and its partial characterization as neurotensin. J. Biol. Chem.. 251, 7053–7058. [PubMed] [Google Scholar]
- Kuwada, Y. , Sasaki, T. , Morinaka, K. , Kitadai, Y. , Mukaida, N. , Chayama, K. , 2003. Potential involvement of IL-8 and its receptors in the invasiveness of pancreatic cancer cells. Int. J. Oncol.. 22, 765–771. [PubMed] [Google Scholar]
- Li, M. , Zhang, Y. , Feurino, L.W. , Wang, H. , Fisher, W.E. , Brunicardi, F.C. , Chen, C. , Yao, Q. , 2008. Interleukin-8 increases vascular endothelial growth factor and neuropilin expression and stimulates ERK activation in human pancreatic cancer. Cancer Sci.. 99, 733–737. [DOI] [PMC free article] [PubMed] [Google Scholar]
- Liu, G. , Zhang, Y. , Bode, A.M. , Ma, W.Y. , Dong, Z. , 2002. Phosphorylation of 4E-BP1 is mediated by the p38/MSK1 pathway in response to UVB irradiation. J. Biol. Chem.. 277, 8810–8816. [DOI] [PubMed] [Google Scholar]
- Liu, H.F. , Teng, X.C. , Zheng, J.C. , Chen, G. , Wang, X.W. , 2008. Effect of NHE1 antisense gene transfection on the biological behavior of SGC-7901 human gastric carcinoma cells. World J. Gastroenterol.. 14, 2162–2167. [DOI] [PMC free article] [PubMed] [Google Scholar]
- Loewe, R. , Valero, T. , Kremling, S. , Pratscher, B. , Kunstfeld, R. , Pehamberger, H. , Petzelbauer, P. , 2006. Dimethylfumarate impairs melanoma growth and metastasis. Cancer Res.. 66, 11888–11896. [DOI] [PubMed] [Google Scholar]
- Lugrin, D. , Vecchini, F. , Doulut, S. , Rodriguez, M. , Martinez, J. , Kitabgi, P. , 1991. Reduced peptide bond pseudopeptide analogues of neurotensin: binding and biological activities, and in vitro metabolic stability. Eur. J. Pharmacol.. 205, 191–198. [DOI] [PubMed] [Google Scholar]
- Mazella, J. , 2001. Sortilin/neurotensin receptor-3: a new tool to investigate neurotensin signaling and cellular trafficking?. Cell. Signal.. 13, 1–6. [DOI] [PubMed] [Google Scholar]
- McSwine, R.L. , Li, J. , Villereal, M.L. , 1996. Examination of the role for Ca2+ in regulation and phosphorylation of the Na+/H+ antiporter NHE1 via mitogen and hypertonic stimulation. J. Cell. Physiol.. 168, 8–17. [DOI] [PubMed] [Google Scholar]
- Moellering, R.E. , Black, K.C. , Krishnamurty, C. , Baggett, B.K. , Stafford, P. , Rain, M. , Gatenby, R.A. , Gillies, R.J. , 2008. Acid treatment of melanoma cells selects for invasive phenotypes. Clin. Exp. Metastasis. 25, 411–425. [DOI] [PubMed] [Google Scholar]
- Nemeroff, C.B. , Hernandez, D.E. , Luttinger, D. , Kalivas, P.W. , Prange, A.J. , 1982. Interactions of neurotensin with brain dopamine systems. Ann. N.Y. Acad. Sci.. 400, 330–344. [DOI] [PubMed] [Google Scholar]
- Reshkin, S.J. , Bellizzi, A. , Caldeira, S. , Albarani, V. , Malanchi, I. , Poignee, M. , Alunni-Fabbroni, M. , Casavola, V. , Tommasino, M. , 2000. Na+/H+ exchanger-dependent intracellular alkalinization is an early event in malignant transformation and plays and essential role in the development of subsequent transformation-associated phenotypes. FASEB J.. 14, 2185–2197. [DOI] [PubMed] [Google Scholar]
- Reubi, J.C. , Waser, B. , Schaer, J.C. , Laissue, J.A. , 1999. Neurotensin receptors in human neoplasms: high incidence in Ewing's sarcomas. Int. J. Cancer. 82, 213–218. [DOI] [PubMed] [Google Scholar]
- Ryder, N.M. , Guha, S. , Hines, O.J. , Reber, H.A. , Rozengurt, E. , 2001. G protein-coupled receptor signaling in human ductal pancreatic cancer cells: neurotensin responsiveness and mitogenic stimulation. J. Cell. Physiol.. 186, 53–64. [DOI] [PubMed] [Google Scholar]
- Shimizu, S. , Tsukada, J. , Sugimoto, T. , Kikkawa, N. , Sasaki, K. , Chazono, H. , Hanazawa, T. , Okamoto, Y. , Seki, N. , 2008. Identification of a novel therapeutic target for head and neck squamous cell carcinomas: A role for the neurotensin-neurotensin receptor 1 oncogenic signaling pathways. Int. J. Cancer. 123, 1816–1823. [DOI] [PubMed] [Google Scholar]
- Shrode, L.D. , Rubie, E.A. , Woodgett, J.R. , Grinstein, S. , 1997. Cytosolic alkalinization increases stress-activated protein kinase/c-Jun NH2-terminal kinase (SAPK/JNK) activity and p38 mitogen-activated protein kinase activity by a calcium-independent mechanism. J. Biol. Chem.. 272, 13653–13659. [DOI] [PubMed] [Google Scholar]
- Slepkov, E.R. , Rainey, J.K. , Sykes, B.D. , Fliegel, L. , 2007. Structural and functional analysis of the Na+/H+ exchanger. Biochem. J.. 401, 623–633. [DOI] [PMC free article] [PubMed] [Google Scholar]
- Smith, J.A. , Poteet-Smith, C.E. , Xu, Y. , Errington, T.M. , Hecht, S.M. , Lannigan, D.A. , 2005. Identification of the first specific inhibitor of p90 ribosomal S6 kinase (RSK) reveals an unexpected role for RSK in cancer cell proliferation. Cancer Res.. 65, 1027–1034. [PubMed] [Google Scholar]
- Soloaga, A. , Thomson, S. , Wiggin, G.R. , Rampersaud, N. , Dyson, M.H. , Hazzalin, C.A. , Mahadevan, L.C. , Arthur, J.S. , 2003. MSK2 and MSK1 mediate the mitogen- and stress-induced phosphorylation of histone H3 and HMG-14. EMBO J.. 22, 2788–2797. [DOI] [PMC free article] [PubMed] [Google Scholar]
- Thomas, R.P. , Hellmich, M.R. , Townsend, C.M. , Evers, B.M. , 2003. Role of gastrointestinal hormones in the proliferation of normal and neoplastic tissues. Endocr. Rev.. 24, 571–599. [DOI] [PubMed] [Google Scholar]
- Vermeulen, L. , De Wilde, G. , Van Damme, P. , Vanden Berghe, W. , Haegeman, G. , 2003. Transcriptional activation of the NF-kappaB p65 subunit by mitogen- and stress-activated protein kinase-1 (MSK1). EMBO J.. 22, 1313–1324. [DOI] [PMC free article] [PubMed] [Google Scholar]
- Vincent, J.P. , Mazella, J. , Kitabgi, P. , 1999. Neurotensin and neurotensin receptors. Trends Pharmacol. Sci.. 20, 302–309. [DOI] [PubMed] [Google Scholar]
- Wang, X. , Wang, Q. , Ives, K.L. , Evers, B.M. , 2006. Cucurmin inhibits neurotensin-mediated interleukin-8 production and migration of HCT116 human colon cancer cells. Clin. Cancer Res.. 12, 5346–5355. [DOI] [PMC free article] [PubMed] [Google Scholar]
- Wenzl, E. , Sjaastad, M.D. , Weintraub, W.H. , Machen, T.E. , 1989. Intracellular pH regulation in IEC-6 cells, a cryptlike intestinal cell line. Am. J. Physiol.. 257, G732–G740. [DOI] [PubMed] [Google Scholar]
- Wiggin, G.R. , Soloaga, A. , Foster, J.M. , Murray-Tait, V. , Cohen, P. , Arthur, J.S. , 2002. MSK1 and MSK2 are required for the mitogen- and stress-induced phosphorylation of CREB and ATF1 in fibroblasts. Mol. Cell. Biol.. 22, 2871–2881. [DOI] [PMC free article] [PubMed] [Google Scholar]
- Xie, K. , 2001. Interleukin-8 and human cancer biology. Cytokine Growth Factor Rev.. 12, 375–391. [DOI] [PubMed] [Google Scholar]
- Yamada, M. , Ohata, H. , Momose, K. , Yamada, M. , Richelson, E. , 1995. Pharmacological characterization of SR 48692 sensitive neurotensin receptor in human pancreatic cancer cells, MIA PaCa-2. Res. Commun. Mol. Pathol. Pharmacol.. 90, 37–47. [PubMed] [Google Scholar]
- Yuan, A. , Chen, J.J. , Yao, P.L. , Yang, P.C. , 2005. The role of interleukin-8 in cancer cells and microenvironment interaction. Front. Biosci.. 10, 853–865. [DOI] [PubMed] [Google Scholar]