Abstract
In Escherichia coli DNA replication is carried out by the coordinated action of the proteins within a replisome. After replication initiation, the two bidirectionally oriented replisomes from a single origin are colocalized into higher-order structures termed replication factories. The factory model postulated that the two replisomes are also functionally coupled. We tested this hypothesis by using DNA combing and whole-genome microarrays. Nascent DNA surrounding oriC in single, combed chromosomes showed instead that one replisome, usually the leftward one, was significantly ahead of the other 70% of the time. We next used microarrays to follow replication throughout the genome by measuring DNA copy number. We found in multiple E. coli strains that the replisomes are independent, with the leftward replisome ahead of the rightward one. The size of the bias was strain-specific, varying from 50 to 130 kb in the array results. When we artificially blocked one replisome, the other continued unabated, again demonstrating independence. We suggest an improved version of the factory model that retains the advantages of threading DNA through colocalized replisomes at about equal rates, but allows the cell flexibility to overcome obstacles encountered during elongation.
Keywords: DNA combing, microarrays, initiation, replication origin, factory model
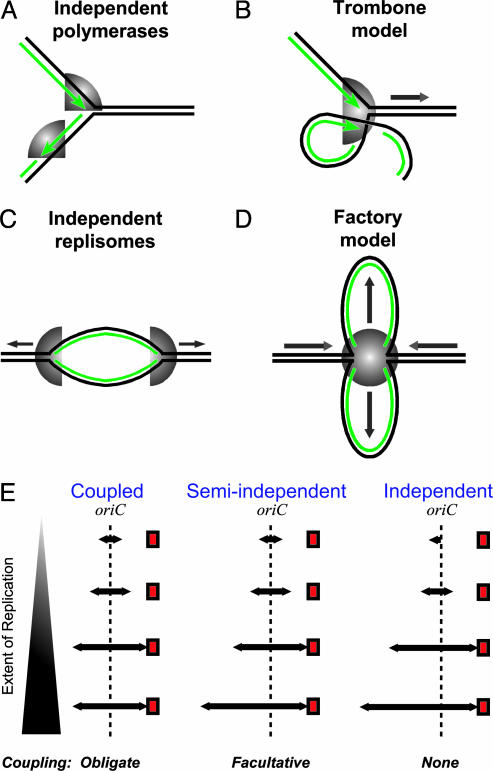
Cellular DNA replication is almost always initiated in a bidirectional manner. Therefore, initiation of replication requires the recruitment of four polymerases and assorted auxiliary proteins at a replication origin (1). Before 1983, the dominant model was that the leading and lagging polymerases continually and repeatedly sped past each other (Fig. 1A) because of the antiparallel nature of duplex DNA. It was difficult to see how the polymerases could be coordinated to achieve synthesis of both DNA strands at about the same time. Alberts et al. (2) suggested an elegant solution, the trombone model, in which one strand is looped so that the two polymerases are colocalized and point in the same direction (Fig. 1B), forming a replisome that additionally contains the auxiliary proteins. Subsequent work confirmed that sister polymerases are physically attached to one another (1). This colocalization is accompanied by coordination; blocking leading-strand replication stops the whole replisome (3–5).
Fig. 1.
Higher-order organization of DNA replication. (A) Independent polymerases at a replication fork. DNA strands (parental in black, daughters in green) are antiparallel, so the polymerases (gray) move in opposite directions during replication. (B) The trombone model. The two polymerases at a fork are colocalized, forming a replisome. The lagging-strand template is looped so that both polymerases face in the same direction. (C) The train-on-tracks model. The two replisomes are independent and move apart along the DNA template. (D) The factory model. The two replisomes are colocalized and relatively stationary, forming a factory that reels in parental DNA and extrudes looped nascent chromosomes. (E) A schematic of replisome behavior is shown for the three versions of the factory model. For simplicity, the looped organization of the factory model is omitted. Red squares indicate blocks to replication. In the coupled model as originally proposed, each replisome is always the same distance from oriC, and blocking one causes the other to stall. In the semiindependent model, the forks normally progress at the same rate, but uncoupling occurs if one fork is blocked. In the independent model, the forks may initiate at different times and move at different rates, and blocking one fork does not affect the other.
A colocalization of the replisomes themselves was proposed in the factory model of DNA replication (6) and demonstrated cytologically (7). Instead of the left and right replisomes racing away from each other until they meet at the terminus (Fig. 1C), this model proposed that the replisomes have stationary positions in the center of the cell (7). Much as in the trombone model, colocalization is facilitated through looping of the DNA, which is fed through the factory (Fig. 1D). This model organizes replication to the cell's advantage (8, 9). Extruding the two daughter chromosomes in opposite directions should greatly facilitate chromosome partitioning (10–12). Furthermore, resources such as dNTPs, Ssb protein, and β-clamps can be concentrated in one place, improving the speed and efficiency of replication. Surveillance by repair proteins also becomes much easier if replication occurs in a single location.
As with the trombone model's colocalization of the two polymerases, colocalization of the two replisomes into a factory provides an opportunity for coordination, ensuring that the replisomes arrive at the terminus at the same time. Lemon and Grossman (7) proposed as part of the factory model that the left and right replicative hexameric helicases were joined in a dodecamer to achieve coupling of the replisomes. Together with the trombone model, this proposal leads to a strict coupling of all four polymerases: all synthesize DNA at the same rate, and blocking one leading-strand polymerase would cause all to stop. We term the obligatory coupling of left and right replisomes the coupled replisome factory model (Fig. 1E Left).
A second possibility is a facultative coupling of replisomes, a semiindependent replisome factory model. Here, the replisomes move in lock step, but uncoupling occurs if one encounters an obstacle (Fig. 1E Center). This process is similar to the uncoupling of the leading polymerase in response to blocked lagging-strand replication (4, 5). In a third possibility, the independent replisome factory model, there is no coupling between replisomes despite colocalization, and the replisomes may move at different rates (Fig. 1E Right).
We used the single-molecule method of DNA combing (13–15) and genomic microarrays (16) to probe coordination of DNA replication. By using DNA combing, we found that in individual Escherichia coli chromosomes the relative progress of the two replisomes was highly variable; most of the time, the leftward replisome was farther from oriC. Our microarray results confirmed that the replisomes are uncoupled at the start of replication. The size of the bias varied by strain background, but the leftward replisome was always further from oriC. Moreover, blocking one fork with an ectopic ter site had no discernible effect on the progress of the other fork. However, under normal circumstances, the two replication forks move at the same mean rate, 610 nt/s at 30°C, helping to ensure that termination will occur roughly opposite oriC on the chromosome. We conclude that the independent replisome factory model is correct, and we discuss its clear physiological advantages to the cell.
Materials and Methods
Strains and Plasmids. AB2937 was constructed by P1 transduction of the dnaC2 allele from MG1655dnaC2 into KHG1005 (17), containing the ectopic ter site in blocking orientation, followed by transformation with pTus (18). AB2932 was constructed in the same way starting with KHG1007 (17), which contains the ectopic ter in nonblocking orientation.
DNA Combing. Cultures of 15T- (19) were grown, labeled with BrdUrd, harvested, and prepared for combing in agarose plugs (20, 21). Plugs were digested overnight by using β-agarase (NEB, Beverly, MA). Glass microscope slides were treated with 3-aminopropyltriethoxysilane (Sigma) as described (14) except that they were used within days of preparation and stored in ambient air. DNA was bound to silanated glass and processed as described (20).
Biotinylated FISH probes for oriC and digoxigenated probes for the whole genome were prepared by random priming (BioPrime kit, Invitrogen). Surfaces with combed DNA were treated with Blocking Reagent (Roche Molecular Biochemicals) for 2 h at 37°C, denatured at 90°C for 90 s, hybridized with FISH probes overnight, and washed, blocked, and treated with fluorescent avidin and antibodies (14, 20). Avidin and antibodies were from Vector Laboratories except mouse anti-BrdUrd (Becton Dickinson) and sheep anti-digoxigenin (Roche Molecular Biochemicals).
Slides were examined by using a Zeiss Axioplan 2 fluorescence microscope. We counted molecules in which labeling occurred after initiation as well as those in which BrdUrd labeling overlapped with the origin. We analyzed only those molecules with BrdUrd signals that ended within the molecule and not at a break and that had oriC FISH signals with clearly recognizable orientations. The measured length of BrdUrd tracks in microns was converted to kilobases by using the oriC FISH signal as an internal standard. To establish the 95% confidence limit for differences in BrdUrd track length, we randomly selected several molecules and measured the size of every gap within BrdUrd tracks. Ninety-five percent of 59 measured gaps were <13.6 kb; the expected error in position of the end of the BrdUrd signal is half this number, or 6.8 kb, because each spot of BrdUrd is effectively surrounded by a “half gap” on each side.
Synchronization of Bacterial Cultures. Cultures bearing the dnaC2 allele, which prevents initiation of replication but not elongation at the restrictive temperature, were grown in either M9 plus 0.2% glucose and 0.2% casamino acids. They were synchronized by incubation at the restrictive temperature (38°C or 42°C) for 90 or 120 min, followed by 2-fold dilution with medium to give a final temperature of 30°C, allowing replication to initiate. Samples (10–20 ml) were removed, treated with NaN3 (0.3 M), and frozen in liquid nitrogen.
In the experiments with AB2937 and AB2932, the temperature was shifted back to the restrictive temperature 14 min after initiation to prevent reinitiation. In the experiment shown in Fig. 5, the glucose-containing medium was replaced by filtration with medium containing arabinose at the time of initiation. In other experiments (Table 1), the shift to arabinose occurred 30–90 min before initiation.
Fig. 5.
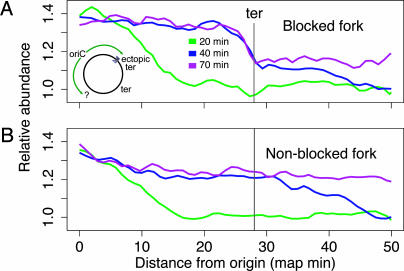
Blocking one replisome does not inhibit the other. Strain AB2937, containing an ectopic ter site at the lacZ locus, 28 map minutes right of the replication origin (Inset), was synchronized and induced to express Tus protein. Samples were taken 20 (green), 40 (blue), and 70 (purple) min after initiation. Shown are abundance versus distance from oriC for the rightward, blocked and leftward, unblocked halves of the chromosome, respectively. oriC is at the left edge, and the natural terminus is at the right edge. Black vertical lines mark the position of the ectopic ter in A and the equivalent position in B. At 20 min, the rightward fork had reached the ectopic ter, but at 40 min, the fork had stalled there. A subpopulation that bypassed the ter was visible at 30–50 min as a slight slope. Meanwhile, the entire population of leftward forks proceeded normally, unaffected by the blocking of the rightward fork.
Table 1. Summary of microarray measurements of offset.
| Strain | Origin orientation | N | Offset size, kb |
|---|---|---|---|
| MG1655dnaC2 | Normal | 6 | -39 |
| MG1655dnaC2 | Normal | 1 | -48 |
| MG1655dnaC2 | Normal | 1 | -82 |
| All MG1655 | Normal | N/A | -51 ± 6 |
| WPC2 | Normal | 12 | -156 |
| AB2937 | Inverted | 1 | 94 |
| AB2937 | Inverted | 1 | 116 |
| AB2937 | Inverted | 1 | 121 |
| AB2937 | Inverted | 1 | 144 |
| AB2932 | Inverted | 1 | 56 |
| All W3110 | Varies | N/A | 127 ± 8 |
Each entry represents an independent experiment. WPC2, AB2937, and AB2932 are W3110 derivatives. Origin orientation: Normal if oriC is oriented as in MG1655, Inverted if as in W3110. N, number of samples taken. N/A, not available. Offset size: difference in position of left and right forks; negative numbers indicate that the left fork is further from oriC.
Microarray Procedures and Data Analysis. Preparation of microarrays and fluorescent labeling of genomic DNA was as described (22). WPC2, MG1655dnaC2, and AB2932 samples were always paired with reference DNA from the same experiment, which was taken from the culture before initiation. Because of the possibility of stalled forks at the ectopic ter, we used either MG1655dnaC2 or AB2932 reference DNA in experiments with AB2937.
Microarrays were scanned with a Genepix 4000A or 4000B scanner (Axon Instruments, Union City, CA), and 16-bit TIFF images of each fluorescence channel were acquired and gridded with genepix 3.0. Spots were filtered to require that at least 40% of pixels in each spot be at least one standard deviation above background in both channels. The results were then normalized so that the terminus had a relative abundance of one, except for late time points where forks had reached the terminus; these were normalized by using the region behind each fork corresponding to replicated DNA. The data were sorted by their position on the chromosome and smoothed by using the lowess algorithm (23) supplied with the r language and environment, version 1.6.2 (24) by using the setting f = 0.075.
To determine fork position, the smoothed traces of relative copy number versus chromosome position were divided into halves to the left and right of oriC. In samples where reinitiation had not occurred, each half was fit with a piecewise function consisting of two flat lines joined by a sloped line. The free parameters were the positions of the flat lines and the endpoints of the sloped line. The fit was obtained by using the nonlinear minimization function nlm supplied with r (25), using an initial guess in which replication forks were positioned symmetrically around the origin. Average fork position was measured as the mean of the sloped line endpoints.
Results
Single-Molecule Analysis of Replication with DNA Combing. We first sought to discriminate among the independent, semiindependent, and coupled replisome factory models (Fig. 1E) by using DNA combing (26). Combing allows the visualization of the replicated regions of long molecules of genomic DNA that have been bound and stretched on glass. The major advantage of a single DNA molecule method such as combing is that, unlike ensemble methods, it discriminates between variation among cells and variation within cells. If all replications were unidirectional but in a random direction, an ensemble measurement would show equal leftward and rightward replication and lead to the erroneous conclusion that replication is bidirectional. In our case, measuring the relative positions of the left and right replisomes on individual chromosomes should distinguish among the three models.
Our DNA combing experiments required a high degree of incorporation of the nucleoside analog BrdUrd to robustly visualize nascent DNA. We screened thymidine-requiring derivatives of the MG1655 and W3110 backgrounds, but none gave satisfactory results. However, strain 15T- (19), known for its ability to incorporate high levels of thymidine, was able to label sufficiently well for DNA combing.
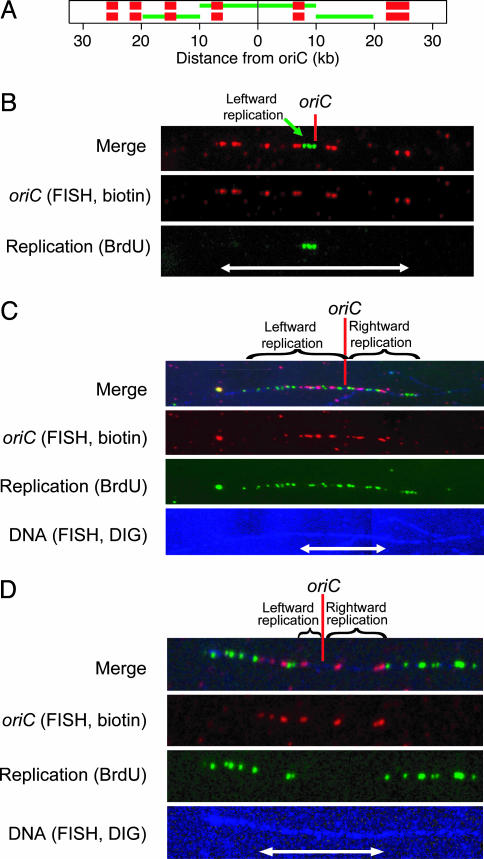
We treated 15T- cultures growing at 37°C with a 10–15 min pulse of BrdUrd. A set of biotinylated probes was hybridized to the DNA to identify the location and orientation of oriC (Fig. 2A), and both the probes and BrdUrd were detected by immunofluorescence. In most experiments, we used a third fluorescent probe of digoxigenin-labeled genomic DNA to lightly counterstain the entire combed DNA molecule (Fig. 2 C and D Bottom). The counterstain verified that the ends of BrdUrd signals did not correspond to breaks in the DNA. We only considered molecules without genomic counterstains if the BrdUrd signal was entirely within the 52-kb oriC FISH pattern, as in Fig. 2B.
Fig. 2.
Single-molecule analysis of replication initiation. (A) Schematic diagram of expected oriC FISH and BrdUrd signals when labeling begins at (Upper) or after (Lower) initiation of replication. Four 2-kb FISH probes (red bars) are left of oriC (black dot), and one 2-kb probe and one 4-kb probe are to the right. In green is the expected BrdUrd signal for symmetric replication of 10 kb to each side. In Lower, the BrdUrd signal indicates that each replication fork was 10 kb from the origin when labeling began. (B) A combed DNA molecule showing unidirectional leftward initiation. The FISH signals (red) indicate the location and orientation of the origin. The signals, with an end-to-end distance of 16.4 μm (white arrow), have a length of 3.2 kb/μm. Replication, indicated by BrdUrd immunofluorescence (green), is visible only to the left of oriC. The replication signal is 2.3 μm or 7.3 kb long. DIG, digoxigenin. (C) A combed DNA molecule showing asymmetric, bidirectional replication. The 52-kb red FISH signal indicating oriC is 20.3 μm long. The green BrdUrd signal extends 65 kb (25.5 μm) to the left and 46 kb (18.0 μm) to the right. The genomic counterstain (blue; brightened at right for visibility) shows that the ends of the replication signal are not caused by DNA breaks. (D) A combed molecule in which replication initiated just before BrdUrd labeling. The 52-kb origin signal is 12.8 μm long (white arrow). We measured gaps of 11 kb (2.7 μm) to the left and 27 kb (6.7 μm) to the right, so the rightward fork is 16 kb ahead of its sister.
Three visualized DNA molecules are pictured in Fig. 2 B–D. None showed the symmetric pattern expected for coordination between replisomes. In Fig. 2B, only the very beginning of replication occurred during the labeling period. The BrdUrd signal extends 7.3 kb to the left of oriC, but there is no signal to the right. Thus, this molecule is unidirectionally initiated. In Fig. 2C, there is bidirectional replication, but the leftward replisome is 19 kb farther from the origin. Fig. 2D also shows bidirectional replication, but this time the rightward replisome was ahead by 16 kb.
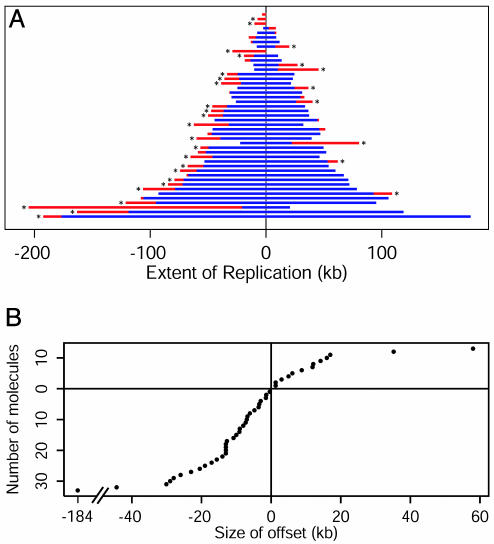
We observed a total of 46 newly initiated DNA molecules (Fig. 3A). In 32 molecules, 70% of the total, the offset between replisomes was statistically significant (>6.8 kb; see Materials and Methods). This level of variability strongly supports the independent replisome factory model. Providing further support for this model, 24 of the 32 molecules with significant variation had more replicated DNA on the left side (Fig. 3B); this bias is highly significant (P = 0.007, binomial test). Overall, the mean offset is 9 kb to the left.
Fig. 3.
Summary of measurements of combed molecules. (A) Measurements from all combed molecules are shown, one molecule per line, in the order of total replication (left plus right). The length by which one replisome has outpaced the other is shown in red. Molecules in which this difference is statistically significant are indicated by *. (B) The offset (right minus left) measured in each combed molecule is plotted in the order of offset magnitude. Offsets between –14 and +2 kb are most common. Twenty-four molecules showed a leftward offset >6.8 kb, and eight molecules showed a rightward bias >6.8 kb.
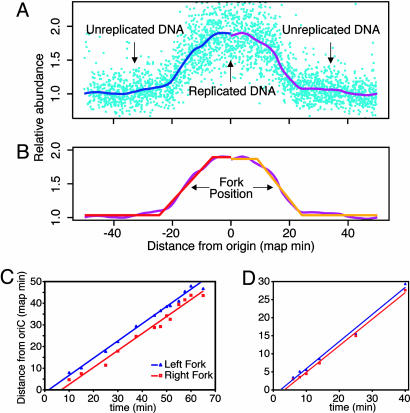
Whole-Genome Analysis of Replication with DNA Microarrays. To investigate whether the independent replisome model is generally true, we tracked replication by using genomic microarrays with more commonly used E. coli strains. We synchronized cultures with the dnaC2 allele, which confers temperature sensitivity for replication initiation (16, 27). Microarrays complement our combing results by tracking fork progression throughout elongation rather than only near initiation. In our first microarray analyses, we isolated genomic DNA from WPC2, a dnaC2 derivative of W3110 (16), just before and at 12 times after replication initiation. Each timed sample was hybridized competitively with preinitiation reference DNA to a microarray containing ≈95% of the ORFs in the E. coli genome. We smoothed the results with the lowess algorithm (23) (Fig. 4A) and then fit the data to a series of straight lines. On each side of the origin, the horizontal lines corresponded to prereplication and postreplication areas of the genome, whose abundance should be constant (Fig. 4B). The sloped lines represent the position of the replication forks. Because the synchrony was not perfect, the sloped lines are not vertical and had a width of 10–15 map minutes, corresponding to the window of time within which initiation occurred. We assigned the average fork position as the midpoint of the sloped line. Reinitiation started ≈30 min after the first initiation. It was well separated from the first wave of forks but poorly synchronized, and thus it was not analyzed.
Fig. 4.
Microarray analysis of DNA replication in synchronized cells. (A) Data from an early time point (turquoise) were normalized to the terminus and plotted by distance from oriC (horizontal) and relative abundance (vertical). Each point corresponds to a gene on the microarray. Smoothing of the data using lowess (blue and purple) revealed that loci near the origin had an average copy number near 2, indicating DNA replication. (B) A series of straight lines (red and orange) was fit to the data for each time point. The average replication fork position was assigned as the midpoint of the sloped line. (C) Thirteen samples were taken from a synchronized culture of WPC2. The results for each fork were plotted versus time. (D) Six samples were taken from a synchronized culture of MG1655dnaC2, and results were plotted as in C.
We plotted the distance of each fork from the origin versus time (Fig. 4C). We draw three conclusions from these data. First, the average rate of replication is constant for both forks. The data for each replisome fit very well to a straight line (R2 = 0.992 and 0.972 for the left and right forks, respectively). Second, the average speeds of the two forks are, within error, identical: 604 nt/s for the left replisome and 617 nt/s for the right at 30°C. Thus, the forks move at nearly the same speed throughout elongation. These values are consistent with the speed of 1 kb/s at 37°C previously measured for DNA polymerase III (1). Third, the left replisome was farther from the origin by ≈150 kb. Thus, the only consistent difference between the two replisomes occurs at or just after initiation, when the leftward replisome establishes a lead. This difference is compatible only with the independent model.
The raw microarray data used to generate Fig. 4C showed that WPC2 had acquired a second inversion around oriC in addition to the documented inversion in W3110 (28). To ensure that the initiation offset did not result from an undetected chromosomal rearrangement, we hybridized nonreplicating WPC2 genomic DNA to a microarray with nonreplicating genomic DNA from MG1655dnaC2 as a reference. We discovered that WPC2 contained a tandem chromosomal triplication on the right side of oriC (Fig. 7A, which is published as supporting information on the PNAS web site). This finding was confirmed by PCR (Fig. 7B). Our analysis, including calculation of offset size, takes these rearrangements into account; notably, the second inversion causes the orientation of oriC to be the same as in MG1655-derived strains, but not other W3110 derivatives.
To test the generality of the offset and its size, we performed repeated synchrony experiments with different strains. With a dnaC2 derivative of MG1655 (29), the strain used for genome sequencing (30), there was a 40-kb offset to the left. The mean for all MG1655 experiments was 51 kb (Table 1). We also used strains derived from W3110 with a single chromosomal inversion about oriC (28). As predicted, in these inverted strains, the offset switched sides; the rightward fork now had the lead, and its mean size in W3110-derived strains was 130 kb (Table 1). This result is consistent with the asymmetry of oriC or its nearby environment being the root of the offset between replisomes. One possible consequence of an offset in initiation is that one replication fork would arrive first at the terminus because of its head start. However, the offset size we observed should not be large enough to cause a large difference; the size of the region containing the central four ter sites is ≈200 kb (31).
Blocking One Fork Does Not Stop the Other. According to the independent replisome model, one fork can proceed even if the other is blocked. We tested this prediction directly by using strain AB2937, a dnaC2 derivative of KHG1005 (17). This strain has an ectopic ter site at lacZ to block the rightward replisome. ter sites bind Tus protein and the Tus–ter complex DnaB helicase and stall replication (32).
A culture of AB2937 was synchronized as usual, except that Tus expression was induced simultaneously with initiation. We assayed fork position 20, 40, and 70 min after initiation (Fig. 5). At 40 min, the rightward fork had stalled at the ter site, but the leftward replisome kept going. Even after 70 min, most of the rightward forks are still stalled at the ter site, but the leftward forks have reached the terminus. Thus, the leftward replisome continued uninhibited when its sister was blocked.
Discussion
We found that sister replisomes in E. coli behave independently. Measurements of single DNA molecules revealed that one replisome was significantly further from the origin than the other 70% of the time. Furthermore, there is an overall leftward bias with a strain-specific size. Finally, we showed directly that even when one fork is blocked, the other is able to reach the terminus. These data argue convincingly for the independent replisome factory model.
Our results might also be consistent with the precursor to the factory model, the train-on-tracks model (33) (Fig. 1C), where each replisome moves independently along its template as it copies DNA. However, there is an abundance of cytological evidence that favors localization of polymerases and other replication proteins as well as nascent DNA into foci for several bacterial species, including E. coli (34), Bacillus subtilis (7), and Caulobacter crescentus (35).
In fact, we see functionally independent yet colocalized replisomes as the best of both worlds. The cell receives the benefits of replisome colocalization, concentration of resources and repair factors in one place, and facilitation of segregation, while avoiding potential problems caused by coordination. Replication forks break down frequently (36), and it is inefficient for both forks to stop every time one encounters a problem. Additionally, replication near the terminus presents a unique problem; it becomes increasingly difficult to maintain a (–) supercoiled template as the size of that template decreases, so it is possible that forks stall more frequently there. If one fork continues while the other is stopped, this problem would be alleviated because torsional strain could more easily diffuse away from the active fork through the inactive one. Finally, in extremis, one fork may be able to get through the terminus region and complete the other fork's job if it has irretrievably halted. Consistent with this possibility, in a B. subtilis strain with a 900-kb insertion on one side of the chromosome, a significant number of forks from the other side penetrated beyond the first ter site after reaching the terminus region, whereas their counterparts were delayed by the insertion (37). Similarly, we observed a population of forks that bypassed the ectopic ter (Fig. 5).
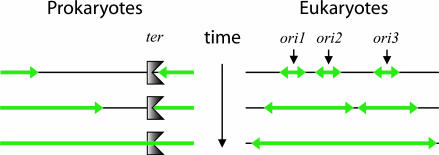
In cells with multiple origins per chromosome such as eukaryotes, strict coordination of replication forks is also impossible. Origins are variably spaced and fire at different times (38), so one fork will terminate before the other (Fig. 6), particularly in the cases of DNA damage (36) and the rDNA repeats in Saccharomyces cerevisiae (39). Therefore, the commonly held view of replication as generally bidirectional is only true early in replication of a replicon; it must generally be unidirectional at the end.
Fig. 6.
Examples of unidirectional late-stage replication. Parental DNA is black, and nascent DNA is green. (Left) The end of prokaryotic chromosomal replication is depicted. The fork coming from the right encounters a ter site and stalls. The fork from the left must complete replication by proceeding unidirectionally. (Right) Replication of a eukaryotic chromosome is shown. Unevenly spaced origins initiate bidirectionally, but closely spaced forks converge and terminate, and their divergent counterparts must complete replication unidirectionally.
Furthermore, the textbook view of replication initiation as occurring equally and symmetrically in each direction also must be modified. Leftward and rightward initiation are most likely two separate events. In many bacteria, phage λ, and budding yeast, origins are consistently asymmetric, with a replicator region that binds the initiator protein beside a zone where melting, replisome assembly, and initial priming occur (1, 40–43). In vitro evidence indicates that the two DnaB hexamers are loaded differentially (44). After E. coli DnaA has melted the AT-rich 13-mers on the left side of oriC, the leftward DnaB helicase is recruited. DnaB must then denature additional DNA before priming and further replisome assembly can occur, including the loading of the rightward helicase (44). In vivo, the first rightward primer was found to have a variable location that was sometimes outside and even to the left of oriC (45), and initiation at the λ replication origin showed a bias toward its melting side (40), hinting at the bias and stochasticity described here. The replication initiator complex must be assembled at origins carefully and precisely (46). We suggest that the leftward helicase is loaded first because it moves away from the initiator, whereas the rightward helicase will plow through the initiator–replicator complex, likely rendering it incompetent to direct further initiation events. In this model, the leftward helicase always starts first, and the fraction of DNA molecules with either rightward or no bias that we observed (Figs. 2D and 3) arose because the rightward replisome moved faster than its sister. An alternative possibility is that DnaA and other proteins bound at oriC slow the rightward replisome, but we consider this notion unlikely because replisomes did not pause specifically at the the datA locus, which binds up to 60% of the DnaA protomers normally in the cell (47), even when DnaA was overexpressed (22).
Overall, the microarray data give a larger size for the offset, between 51 and 127 kb, than the 9 kb from combing. Strain differences are probably mostly responsible for this difference, as even among K-12 strains tested with microarrays the offset size varied by >70 kb. However, the combing results are necessarily somewhat smaller because the median amount of leftward replication was only 46 kb in the molecules we observed.
Supplementary Material
Acknowledgments
We thank Aaron Bensimon and Chiara Conti for early instruction in DNA combing; Brian Peter, Arkady Khodursky, and Patrick Brown for help with microarrays; Eileen Beall for advice on BrdUrd labeling and detection; and Barbara Meyer and Annette Chan for access to a fluorescence microscope. This work was supported by National Institutes of Health Grants GM31655 (to N.R.C.) and HD45736 (to H.-U.G.W.) and a Howard Hughes Medical Institute Predoctoral Fellowship (to A.M.B.).
Author contributions: A.M.B. and N.R.C. designed research; A.M.B. performed research; H.-U.G.W. contributed new reagents/analytic tools; A.M.B. and N.R.C. analyzed data; and A.M.B. and N.R.C. wrote the paper.
References
- 1.Kornberg, A. & Baker, T. A. (1992) DNA Replication (Freeman, New York).
- 2.Alberts, B. M., Barry, J., Bedinger, P., Formosa, T., Jongeneel, C. V. & Kreuzer, K. N. (1983) Cold Spring Harb. Symp. Quant. Biol. 47, 655–668. [DOI] [PubMed] [Google Scholar]
- 3.Lee, J., Chastain, P. D., 2nd, Kusakabe, T., Griffith, J. D. & Richardson, C. C. (1998) Mol. Cell 1, 1001–1010. [DOI] [PubMed] [Google Scholar]
- 4.Pages, V. & Fuchs, R. P. (2003) Science 300, 1300–1303. [DOI] [PubMed] [Google Scholar]
- 5.Higuchi, K., Katayama, T., Iwai, S., Hidaka, M., Horiuchi, T. & Maki, H. (2003) Genes Cells 8, 437–449. [DOI] [PubMed] [Google Scholar]
- 6.Sundin, O. & Varshavsky, A. (1980) Cell 21, 103–114. [DOI] [PubMed] [Google Scholar]
- 7.Lemon, K. P. & Grossman, A. D. (2000) Mol. Cell. 6, 1321–1330. [DOI] [PubMed] [Google Scholar]
- 8.Falaschi, A. (2000) Trends Genet. 16, 88–92. [DOI] [PubMed] [Google Scholar]
- 9.Hearst, J. E., Kauffman, L. & McClain, W. M. (1998) Trends Genet. 14, 244–247. [DOI] [PubMed] [Google Scholar]
- 10.Lemon, K. P. & Grossman, A. D. (2001) Genes Dev. 15, 2031–2041. [DOI] [PubMed] [Google Scholar]
- 11.Sherratt, D. J. (2003) Science 301, 780–785. [DOI] [PubMed] [Google Scholar]
- 12.Gordon, G. S., Sitnikov, D., Webb, C. D., Teleman, A., Straight, A., Losick, R., Murray, A. W. & Wright, A. (1997) Cell 90, 1113–1121. [DOI] [PubMed] [Google Scholar]
- 13.Bensimon, A., Simon, A., Chiffaudel, A., Croquette, V., Heslot, F. & Bensimon, D. (1994) Science 265, 2096–2098. [DOI] [PubMed] [Google Scholar]
- 14.Weier, H.-U. (2001) Methods Cell. Biol. 64, 33–53. [DOI] [PubMed] [Google Scholar]
- 15.Versini, G., Comet, I., Wu, M., Hoopes, L., Schwob, E. & Pasero, P. (2003) EMBO J. 22, 1939–1949. [DOI] [PMC free article] [PubMed] [Google Scholar]
- 16.Khodursky, A. B., Peter, B. J., Schmid, M. B., DeRisi, J., Botstein, D., Brown, P. O. & Cozzarelli, N. R. (2000) Proc. Natl. Acad. Sci. USA 97, 9419–9424. [DOI] [PMC free article] [PubMed] [Google Scholar]
- 17.Horiuchi, T. & Fujimura, Y. (1995) J. Bacteriol. 177, 783–791. [DOI] [PMC free article] [PubMed] [Google Scholar]
- 18.Peter, B. J., Ullsperger, C., Hiasa, H., Marians, K. J. & Cozzarelli, N. R. (1998) Cell 94, 819–827. [DOI] [PubMed] [Google Scholar]
- 19.Barner, H. D. & Cohen, S. S. (1954) J. Bacteriol. 68, 80–88. [DOI] [PMC free article] [PubMed] [Google Scholar]
- 20.Breier, A. M. (2004) Ph.D thesis (Univ. of California, Berkeley).
- 21.Rayssiguier, C., Thaler, D. S. & Radman, M. (1989) Nature 342, 396–401. [DOI] [PubMed] [Google Scholar]
- 22.Simmons, L. A., Breier, A. M., Cozzarelli, N. R. & Kaguni, J. M. (2004) Mol. Microbiol. 51, 349–358. [DOI] [PubMed] [Google Scholar]
- 23.Cleveland, W. S. (1979) J. Am. Stat. Assoc. 74, 829–836. [Google Scholar]
- 24.R Development Core Team (2004) r (R Foundation for Statistical Computing, Vienna).
- 25.Schnabel, R. B., Koontz, J. E. & Weiss, B. E. (1985) ACM Trans. Math Software 11, 419–440. [Google Scholar]
- 26.Weier, H.-U., Wang, M., Mullikin, J. C., Zhu, Y., Cheng, J. F., Greulich, K. M., Bensimon, A. & Gray, J. W. (1995) Hum. Mol. Genet. 4, 1903–1910. [DOI] [PubMed] [Google Scholar]
- 27.Carl, P. L. (1970) Mol. Gen. Genet. 109, 107–122. [DOI] [PubMed] [Google Scholar]
- 28.Xia, X. M. & Enomoto, M. (1986) Mol. Gen. Genet. 205, 376–379. [DOI] [PubMed] [Google Scholar]
- 29.Withers, H. L. & Bernander, R. (1998) J. Bacteriol. 180, 1624–1631. [DOI] [PMC free article] [PubMed] [Google Scholar]
- 30.Blattner, F. R., Plunkett, G., 3rd, Bloch, C. A., Perna, N. T., Burland, V., Riley, M., Collado-Vides, J., Glasner, J. D., Rode, C. K., Mayhew, G. F., et al. (1997) Science 277, 1453–1474. [DOI] [PubMed] [Google Scholar]
- 31.Coskun-Ari, F. F. & Hill, T. M. (1997) J. Biol. Chem. 272, 26448–26456. [DOI] [PubMed] [Google Scholar]
- 32.Bussiere, D. E. & Bastia, D. (1999) Mol. Microbiol. 31, 1611–1618. [DOI] [PubMed] [Google Scholar]
- 33.Losick, R. & Shapiro, L. (1998) Science 282, 1430–1431. [DOI] [PubMed] [Google Scholar]
- 34.Lau, I. F., Filipe, S. R., Soballe, B., Okstad, O. A., Barre, F. X. & Sherratt, D. J. (2003) Mol. Microbiol. 49, 731–743. [DOI] [PubMed] [Google Scholar]
- 35.Jensen, R. B., Wang, S. C. & Shapiro, L. (2001) EMBO J. 20, 4952–4963. [DOI] [PMC free article] [PubMed] [Google Scholar]
- 36.Cox, M. M., Goodman, M. F., Kreuzer, K. N., Sherratt, D. J., Sandler, S. J. & Marians, K. J. (2000) Nature 404, 37–41. [DOI] [PubMed] [Google Scholar]
- 37.Griffiths, A. A. & Wake, R. G. (2000) J. Bacteriol. 182, 1448–1451. [DOI] [PMC free article] [PubMed] [Google Scholar]
- 38.Raghuraman, M. K., Winzeler, E. A., Collingwood, D., Hunt, S., Wodicka, L., Conway, A., Lockhart, D. J., Davis, R. W., Brewer, B. J. & Fangman, W. L. (2001) Science 294, 115–121. [DOI] [PubMed] [Google Scholar]
- 39.Kobayashi, T. & Horiuchi, T. (1996) Genes Cells 1, 465–474. [DOI] [PubMed] [Google Scholar]
- 40.Furth, M. & Wickner, S. (1983) in Lambda II, eds. Hendrix, R. W., Roberts, J. W., Stahl, F. W. & Weisberg, R. A. (Cold Spring Harbor Lab. Press, Plainview, NY), pp. 145–174.
- 41.Breier, A. M., Chatterji, S. & Cozzarelli, N. R. (2004) Genome Biol. 5, R22. [DOI] [PMC free article] [PubMed] [Google Scholar]
- 42.Rowles, A., Chong, J. P., Brown, L., Howell, M., Evan, G. I. & Blow, J. J. (1996) Cell 87, 287–296. [DOI] [PubMed] [Google Scholar]
- 43.Bielinsky, A. K. & Gerbi, S. A. (1999) Mol. Cell 3, 477–486. [DOI] [PubMed] [Google Scholar]
- 44.Fang, L., Davey, M. J. & O'Donnell, M. (1999) Mol. Cell 4, 541–553. [DOI] [PubMed] [Google Scholar]
- 45.Kohara, Y., Tohdoh, N., Jiang, X. W. & Okazaki, T. (1985) Nucleic Acids Res. 13, 6847–6866. [DOI] [PMC free article] [PubMed] [Google Scholar]
- 46.Kim, S. Y., Sharma, S., Hoskins, J. R. & Wickner, S. (2002) J. Biol. Chem. 277, 44778–44783. [DOI] [PubMed] [Google Scholar]
- 47.Kitagawa, R., Mitsuki, H., Okazaki, T. & Ogawa, T. (1996) Mol. Microbiol. 19, 1137–1147. [DOI] [PubMed] [Google Scholar]
Associated Data
This section collects any data citations, data availability statements, or supplementary materials included in this article.


