

Abstract
Epigenetics has been implicated in human cancer development. Epigenetic factors include HBx protein, which is able to induce hypermethylation and suppresses tumor suppressor genes. One of such tumor suppressor genes, GSTP1, shows reduced expression in many human cancers. Hypermethylation of GSTP1 is the most studied mechanism of its silence. In the present study, we reported that GSTP1 expression was completely depleted in HBV integrated HepG2.2.15 cells due to the hypermethylation in its promoter region. And it was HBx, especially HBx genotype D, that played the key role in repressing GSTP1 expression. Further functional studies like ROS assay and apoptosis detection were also used to confirm this repression. Our findings should facilitate the understanding of HBV and their influences on the epigenetic modulations for epigenetic tumorigenesis during HBV‐mediated hepatocellular carcinogenesis.
Keywords: HBV, HBx, DNA methylation, GSTP1, HepG2, HepG2.2.15
Abbreviations
- HBV
hepatitis B virus
- HBx
hepatitis B virus X
- HCC
hepatocellular carcinoma
- GSTP1
glutathione S‐transferase P1
- ROS
reactive oxygen species
- DNMT1
DNA methyltransferase 1
- MEM
minimal essential medium
- DMEM
Dulbecco's modified Eagle's medium
- PBS
phosphate‐buffered saline
- HBsAg
HBV surface antigen
- HBcAg
HBV core antigen
- MSP
methylation‐specific PCR
- TBHP
tert‐butyl hydroperoxide
1. Introduction
The glutathione S‐transferase P1 (GSTP1) has been identified as a tumor suppressor gene with its high percentage of silenced expression in many types of human cancers. It belongs to the family of Phase II detoxification enzymes that catalyze the conjugation of a wide variety of endogenous and exogenous cytotoxic and carcinogenic reagents with glutathione. Promoter methylation of GSTP1 is the most studied mechanism of its silence and it is an early event in many types of tumorigenesis, including prostate cancer, breast cancer, cholangiocarcinoma, as well as hepatocellular carcinoma (HCC), as reviewed by Tischoff and Tannapfe (2008). And there are also reports indicating that patients who were positive for HBV DNA had significantly lower GST activity than those who were HBV negative, which might suggest that cellular protection within the human liver is compromised by HBV infection and further decreased during hepatocellular tumorigenesis (Zhou et al., 1997).
Mechanisms of activation of pathways involved in human cancer development have been identified by recent advances in epigenetics. Key players in epigenetic modifications include viral proteins such as hepatitis B virus X (HBx) protein. The involvement of the HBx protein in regional hypermethylation and global hypomethylation of target promoters has been studied (Park et al., 2007) and evidences are indicating that HBx could go by activating a key enzyme during DNA methylation, DNA methyltransferase 1 (DNMT1), resulting in silence of some tumor suppressor genes and leading to the development of hepatocellular carcinoma (HCC) (Jung et al., 2007; Liu et al., 2006; Lee et al., 2005). In the present study, we reported that GSTP1 expression was completely depleted in HBV integrated HepG2.2.15 cells due to the hypermethylation in its promoter region, and we first report that it is HBx, especially HBx genotype D, that plays the key role in repressing the expression of GSTP1 and this repression was also confirmed by further functional studies like Reactive Oxygen Species (ROS) assay and apoptosis detection, indicating that GSTP1 repression could be a mechanism of damaging cellular protection by HBV infection and replication. Our findings should facilitate the understanding of HBV and their influences on the epigenetic modulations for epigenetic tumorigenesis during HBV‐mediated hepatocellular carcinogenesis.
2. Results
2.1. Validation of HBV genome expression in HepG2.2.15 cell line
To make sure that HepG2.2.15 cell line in our lab could work as we expected, we detected the HBV genome expression within this cell line. As shown in Figure 1A, HepG2.2.15 could release HBV surface antigen (HBsAg) significantly while HepG2 result was negative. While in Figure 1B, RT‐PCR results indicted that both HBsAg and HBV core antigen (HBcAg) could be detected in HepG2.2.15 mRNA but not in HepG2, while the internal control β‐actin could be detected normally in both the cells. These results provided the validation that the HepG2.2.15 cell line we used could express HBV genome as expected.
Figure 1.
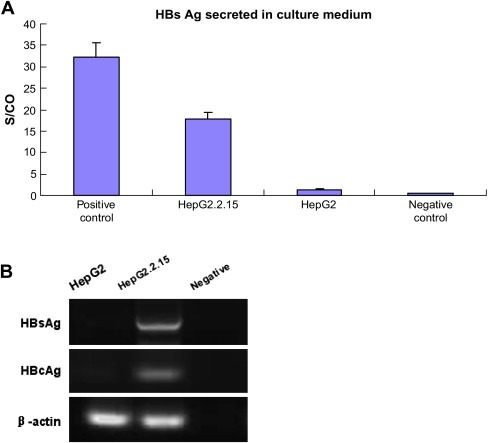
HBV genome expression in HepG2.2.15. A. ELISA assay detection of HBsAg secreted in cell culture medium of both HepG2 and HepG2.2.15. Data are presented as an S/CO ratio (Y‐axis), which stands for the Sample Rate/Cut‐Off Rate, calculated by the IMx system. S/CO ratios >1 are considered to be reactive while ratios <1 are non‐reactive. The positive control and negative control are reagents provided in the IMx kit. B. RT‐PCR performed to show the HBsAg and HBcAg expression in the mRNA of both the cell lines. The negative control was no template DNA added but equal volume of water instead.
2.2. GSTP1 is significantly repressed in HepG2.2.15 compared with that in HepG2 and this repression could be rescued by DNMT1 inhibitor 5‐Aza‐dC treatment
First we explored the GSTP1 expression pattern in HepG2 and HepG2.2.15 cells, and both of them treated by 5‐Aza‐dC. As shown in Figure 2, both real‐time RT‐PCR and Western blotting give respectively the evidences on mRNA level (A) and protein level (B) that GSTP1 was normally expressed in HepG2 (column 1 in Figure 2A and lane 1 in Figure 2B) but completely depleted in HepG2.2.15 (column 3 in Figure 2A and lane 3 in Figure 2B), which could steadily express HBV genome. Further, after the treatment of 5‐Aza‐dC, GSTP1 expression in HepG2 was slightly elevated (column 2 in Figure 2A) while significantly rescued in HepG2.2.15 (column 4 in Figure 2A and lane 4 in Figure 2B).
Figure 2.
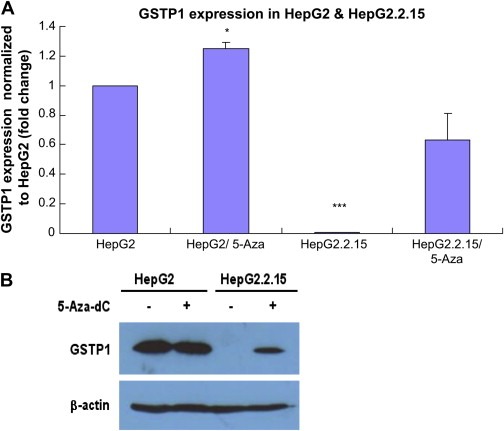
GSTP1 expression in HepG2 and HepG2.2.15 with or without treatment of 5‐Aza‐dC. A. Real‐time RT‐PCR showing the expression of GSTP1 on mRNA level in HepG2 and HepG2.2.15 (columns 1 and 3), and both of them treated by 2.5μM 5‐Aza‐dC for 72h (columns 2 and 4). Three independent experiments were carried out. Compared with HepG2: *P<0.05; ***P<0.001. B. Western blotting showing GSTP1 expression on protein level (up panel), with the bottom panel of β‐actin as loading control. Rows 1 and 2 are HepG2 without or with 5‐Aza‐dC treatment, Rows 3 and 4 are HepG2.2.15 without or with 5‐Aza‐dC treatment.
These results indicated that GSTP1 expression could be inhibited by HBV genome expression and this alteration might occur due to the DNA methylation in GSTP1 promoter.
2.3. Promoter region of GSTP1 in HepG2.2.15 is completely methylated and partially demethylated after 5‐Aza‐dC treatment
To further confirm whether the GSTP1 expression alteration was caused by DNA methylation or not, we performed methylation‐specific PCR (MSP) to test the promoter DNA methylation status of GSTP1 in the cells. Both HepG2 and HepG2.2.15 cells were analyzed after the treatment of 5‐Aza‐dC or mock treatment, as described in this section. It is shown in Figure 3 that GSTP1 in HepG2 cells is partially methylated (both bands in M and U lanes, Lanes 1 and 2), while in HepG2.2.15 it is completely methylated (only band in M lane but not in U lane, Lanes 5 and 6). This result agreed with the GSTP1 expression pattern in both the cells presented in Section 2.2, and these combined to suggest that GSTP1 could be expressed in HepG2 when some of the alleles were unmethylated, but were totally silenced in HepG2.2.15 due to all the methylated alleles.
Figure 3.
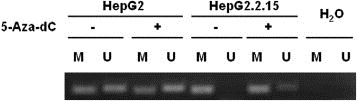
MSP analysis of the methylation status of the GSTP1 promoter CpG islands in HepG2 and HepG2.2.15 cells. The presence of PCR products in Lane M indicates the presence of methylated genes of GSTP1 while the presence of PCR products in Lane U indicates the presence of unmethylated genes of GSTP1. Water was used as the negative control.
After 5‐Aza‐dC treatment, we can see that parts of the methylated alleles were demethylated and thus the percentage of PCR products in U lane of HepG2 was slightly increased while products in U lane of HepG2.2.15 clearly appeared. This result provided further evidence that GSTP1 expression inhibition in HepG2.2.15 compared with HepG2 was caused by GSTP1 promoter DNA methylation.
2.4. GSTP1 expression is significantly repressed in HBx D transiently transfected HepG2 cells
To study the potential factors from HBV integration in HepG2.2.15, causing such GSTP1 expression alteration, we focused our attention on one of the four proteins encode by HBV genome, HBx protein, as well‐known, HBx is a very versatile regulatory factor and nowadays it is also indicated to be involved in epigenetic regulation. So here we want to see whether HBx plays a role in this process.
We constructed plasmids containing HBx coding sequences with different genotypes, genotypes A, B, C and D, transfected them into HepG2 cells together with the pXj40 empty vector, and tested GSTP1 expression by Western blotting assay. As shown in Figure 4, when HBx protein was well expressed, there was suppression of GSTP1 expression by HBx, especially HBx genotype D.
Figure 4.
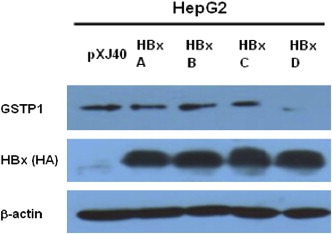
Western blotting analysis of GSTP1 expression in HBx genotypes A–D transiently transfected HepG2 cells. First panel was blotted with anti‐GSTP1 antibody, while second panel was blotted with anti‐HA antibody to show the HBx protein expression as well. β‐Actin was included as the loading control. pXj40 transfected HepG2 cell lysate served as the empty vector control.
2.5. ROS levels are increased in HepG2.2.15, as well as HBx transfected HepG2 cells
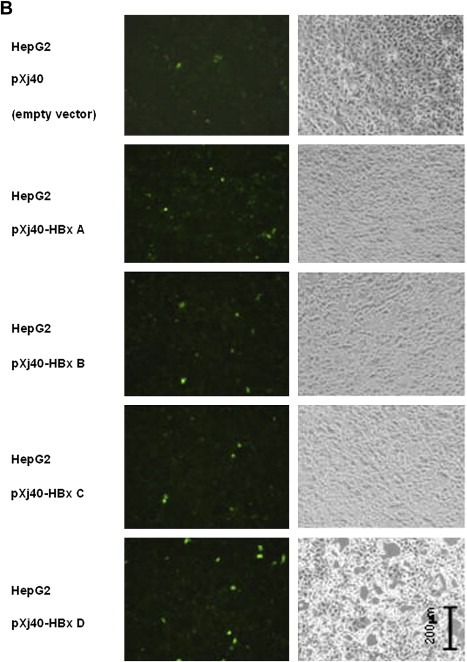
According to the traditional understanding of GST enzymes, the major function of GSTP1 should be detoxication of electrophiles by glutathione conjugation. There are a wide variety of electrophilic substrates, including both endogenous [e.g. by‐products of reactive oxygen species (ROS) activity] and exogenous (e.g. polycyclic aromatic hydrocarbons) (Strange et al., 2001). In order to confirm the inhibition effect of GSTP1 by HBx D, we further detected the cellular ROS level with the help of an ROS detection kit. With this kit, ROS level could be indicated by the number of cells with green fluorescence: the more these cells are, the higher the ROS level is. As shown in Figure 5A, ROS level in HepG2.2.15 (Figure 5A, b) was significantly higher than that in HepG2 (Figure 5A, e); and could be reduced by 5‐Aza‐dC treatment in both the cell lines (Figure 5A, HepG2.2.15: c compared with b; HepG2: f compared with e). And in Figure 5B, ROS levels in HepG2 cells transiently transfected with HBx A–D were all detected. Compared with cells transfected by empty vector pXj40, certain increase of ROS level could be seen in cells transfected by all the genotypes of HBx, with HBx D as the relatively significant one. That is to say, HBx D could increase the ROS level, the same effect as that in HepG2.2.15, which has HBV integrated. The ROS results further confirmed the link between HBx D and GSTP1 expression inhibition.
Figure 5.
Continued
Figure 5.
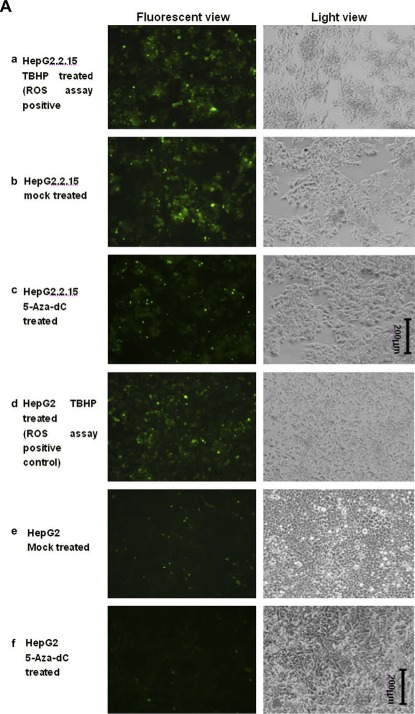
ROS assay detecting the ROS levels in HepG2.2.15 and HBx transiently transfected HepG2 cells. A. ROS levels in HepG2 and HepG2.2.15 cell lines. Fluorescent view (Left panel) was presented, as well as the light view (right panel) serving as cell density control. a) HepG2.2.15 treated by TBHP which serves as the assay positive control for the successful induction of ROS; b) HepG2.2.15 mock treated by only DMSO in the same volume as that of 5‐Aza‐dC in c); c) HepG2.2.15 treated by 5‐Aza‐dC; d) HepG2 treated by TBHP as the assay positive control; e) HepG2 mock treated by only DMSO; f) HepG2 treated by 5‐Aza‐dC. B. ROS levels in HepG2 cells transfected by HBx A‐D. HepG2 cells transfected by the empty vector pXj40 were also included as the negative controls.
2.6. HBx, especially the HBx genotype D increases Apoptosis of HepG2 cells
As well known, ROS are involved in several different cellular processes ranging from apoptosis and necrosis to cell proliferation and carcinogenesis. In our previous research, we found that cellular apoptosis could be induced by replication of HBV genomes (Lu et al., 2007), so here with the above identification that HBx could increase cellular ROS level, we further explored that whether the ROS level increased by HBx could also lead to apoptosis.
Therefore, apart from HepG2.2.15 cells, we transfected HepG2 cells with pXj40‐HBx A–D, as well as the empty vector pXj40, labeled them with the Annexin‐V‐FLUOS Staining Kit and analyzed the apoptosis of cells by flow cytometer. As shown in Figure 6A, more than 95% of the HepG2 cells were normal living cells and only 2.6% were apoptotic. While in Figure 6B, HepG2 cells treated with 50μM cisplatin for 16h were involved as the positive control of induced apoptosis, and the apoptotic cells reached to 73.6%. Compared with HepG2 cells transfected with empty vector pXj40, which had 18.01% as the apoptotic cells, except HBx C transfected HepG2, either HepG2.2.15 (35.8%) or HepG2 cells transfected with HBx A (24.3%), B (27.68%) and D (51.58%) displayed a higher level of apoptotic cells, especially HBx genotype D.
Figure 6.
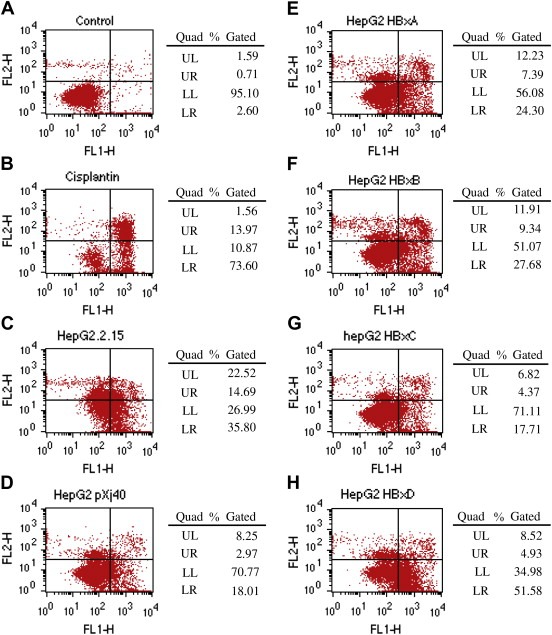
Flow cytometry analysis of apoptosis in HepG2.2.15 and HBx transfected HepG2 cells. FL1‐H indicates the Annexin result while FL2‐H indicates the PI staining result. Therefore, LL (lower left) gives the normal (living) cells with low Annexin and low PI staining and LR (lower right) gives the apoptotic cells with high Annexin and low PI staining, while UR (upper right) shows the necrotic cells with high Annexin and high PI staining. Experiments were carried out three times with one typical set of results shown. A. HepG2 cells without treatment served as negative control and were used to get the analysis settings. B. HepG2 cells treated with Cisplatin were used as the apoptosis positive control. C. HepG2.2.15 cells. D–H. HepG2 cells transfected with either empty vector pXj40 or pXj40‐HBx A/D.
These results suggested that either HepG2.2.15 with HBV integrated, or HepG2 transfected by HBx genotype D could significantly increase the cell apoptosis.
3. Discussion
GSTP1, which is one of the detoxification enzymes defending cells against damage mediated by electrophilic or oxidant carcinogens, has been considered as a tumor suppressor gene which is usually repressed or even silenced in several types of human cancers. Some of the clinical researches have suggested that the hypermethylation on the promoter CpG sites of GSTP1 has relationship with HBV infection, especially in HBV‐associated hepatocellular carcinomas (Su et al., 2007; Zhong et al., 2002; Zhou et al., 1997). However, the molecular processes underlying such phenotype and the detailed contribution of HBV are poorly understood. Here in this study, we explored the role of HBx protein, especially HBx genotype D, in the GSTP1 hypermethylation and silenced expression by HBV infection.
To study this problem, we employed two cell lines HepG2 and HepG2.2.15. HepG2 is a human hepatoma cell line while HepG2.2.15 is HepG2‐derivative and stably transfected with a plasmid containing 2 head‐to‐tail dimers of the HBV genome. HepG2.2.15 can not only release high levels of HBsAg and HBeAg into supernatants, but also support the assembly and secretion of replicative intermediates of HBV DNA and Dane particles during culture (Sells et al., 1987), thus it is considered as a good model to study HBV involved modulation of host cells. In our study we first confirmed the HBV genome expression in HepG2.2.15 cells, to make sure that the following studies would be carried out based on this HBV expression. Figure 1 provided evidences of HBV core gene and surface gene expression on either mRNA (RT‐PCR, Figure 1B) or protein level (ELISA for testing HBsAg secreted in culture medium, Figure 1A), which suggested that the HepG2.2.15 cell line we were using could express HBV genome as expected.
With the validation of HepG2.2.15, we first explored our target protein GSTP1 expression on either mRNA level (Real‐time RT‐PCR, Figure 2A) or protein level (Western blotting, Figure 2B) in HepG2 as well as HepG2.2.15 cells. It is clear that GSTP1 expression could be detected in HepG2 (Figure 2A Column 1 and Figure 2B Lane 1) but was completely depleted in HepG2.2.15 (Figure 2A Column 3 and Figure 2B Lane 3). This result agrees with some clinical researches indicating that GSTP1 activity was lower in HBV positive patients than those who were negative (Zhou et al., 1997), or the GSTP1 was silenced in HBV‐associated hepatocellular carcinogenesis (Su et al., 2007; Zhong et al., 2002; Zhou et al., 1997). But as to the GSTP1 expression in HepG2, our result disagrees with one of the published studies (Zhong et al., 2002), which showed that there was not GSTP1 expression detectable in HepG2 because its promoter in HepG2 was totally methylated. This discrepancy might be due to different culture conditions or different passage times. Furthermore, the GSTP1 expression level in both the cells, especially in HepG2.2.15, could be increased (from none to detectable) after the treatment of demethylation reagent 5‐Aza‐dC. The increase in HepG2 was not as significant as that in HepG2.2.15; this may be due to that the efficiency of 5‐Aza‐dC treatment was not high enough, but the trend was still there. Considering some clinical reports indicating that the frequency of GSTP1 promoter hypermethylation was significantly higher in HCC than corresponding non‐tumor tissues from HBsAg‐positive patients, but not HBsAg‐negative controls (Su et al., 2007), our results probably suggested that DNA methylation might play a role in GSTP1 repression in HepG2.2.15 cells.
Therefore, to further check the potential DNA methylation mechanism of such depletion of its expression in HepG2.2.15, MSP was carried out to check DNA methylation status of GSTP1 promoter in both HepG2 and HepG2.2.15 cells. It is shown in Figure 3 that while there were both methylated and unmethylated alleles of GSTP1 in HepG2, all the alleles of GSTP1 in HepG2.2.15 were methylated. This result well agreed with the GSTP1 expression patterns in both the cell lines (Figure 2). That is, HepG2 could express GSTP1 due to its partially unmethylated GSTP1 promoter, while HepG2.2.15 was not able to express the gene because all of the GSTP1 alleles were methylated. What's more, as expected, 5‐Aza‐dC treatment was able to change some of the GSTP1 alleles in HepG2.2.15 from methylated (Figure 3 Lanes 5 and 6) into unmethylated (Figure 3 Lanes 7 and 8); although the change of the methylation pattern in HepG2 cells after 5‐Aza‐dC treatment was not that significant, we still can see lower density of methylated band (Figure 3 Lane 3 compared with Lane 1)and higher density of unmethylated band (Figure 3 Lane 4 compared with Lane 2). The MSP results provided evidences directly to confirm the role of DNA methylation in GSTP1 repression in HepG2.2.15 by HBV.
With the above evidences, we could believe that HBV presented in HepG2.2.15 did cause hypermethylation of GSTP1 promoter region and thus totally inhibited its expression. The next question is what factor or factors would be in charge of this change? As well known, one of the four proteins encoded by HBV genome, HBx is considered as a quite versatile viral protein, which has been reported to be involved in many cellular functions such as transcriptional regulation, DNA repair, cell adhesion, apoptosis and so on. What's more, the functions of HBx have been enriched to the field of epigenetics quite recently. It has been suggested that HBx can also play such a role to regulate DNA methylation, via regulating the expression of DNA methyltransferase (DNMT) 1 (Jung et al., 2007; Lee et al., 2005). For instance, some studies showed that the HBx protein could repress E‐cadherin (Liu et al., 2006; Lee et al., 2005) and p16INK14 (Jung et al., 2007; Zhang et al., 2007) expression via activation of DNMT1, and may further lead to the development of hepatocellular carcinoma (HCC). So here it is reasonable to explore whether HBx also plays a role in GSTP1 repression via this way.
To achieve this, we constructed plasmids containing HBx with different genotypes, from HBx genotype A to genotype D, and then transfected them into HepG2 cells to see whether the forced expression of HBx has something to do with GSTP1 expression. Western blotting results in Figure 4 indicated that GSTP1 expression could be significantly inhibited by HBx genotype D; this primarily confirmed our hypothesis that HBx did have effect on GSTP1 expression.
With GSTP1 expression down‐regulated, the intracellular microenvironment generating ROS may be altered accordingly. Two functional assays, ROS detection and apoptosis analysis were performed subsequently and provided further evidences that suppression of GSTP1 expression by HBx D transfection in HepG2 as well as HBV integration in HepG2.2.15 might lead to ROS increase (Figure 5) and apoptosis (Figure 6). However, it seems somewhat incompatible with the concept that HBV infection has been supported by many researches that it should favor the changes leading to hepatocarcinogenesis, which should involve decreased apoptosis instead of increased. Actually, there are contradictory data about the HBx effect on cellular apoptosis, either anti‐apoptosis (Fiedler et al., 2006) or pro‐apoptosis (Miao et al., 2006; Lu and Chen, 2005; Su and Schneider, 1997), which might be due to differences in cells and experimental systems. As reviewed by Lohong Ye et al. (2008) HBx can either inhibit or promote cell apoptosis in a dose‐dependent manner. When HBx is expressed at high levels, it promotes apoptosis; whereas it inhibits apoptosis when expressed at physiological levels. In our study, HBx was over‐expressed in cells and increased apoptosis. Therefore it did not conflict but support the functional significance of alteration of GSTP1 expression by HBx. Our results agree with several clinical studies that GSTP1 expression was significantly down‐regulated due to hypermethylation in HBV‐associated HCC (Su et al., 2007; Zhou et al., 1997), and provide further evidences on molecular level to suggest that the cellular protection within human liver is compromised by HBV infection, especially HBx function, and further decreased during hepatocellular tumorigenesis.
4. Experimental procedures
4.1. Plasmid construction
The HBV genomes with genotypes A–D in our lab are from Singapore clinical samples. We cloned the whole genomes into pcDNA3.1 vector (Invitrogen), and in this research, HBx coding sequences with different genotypes were got from the above HBV genomes by PCR amplification and inserted into HindIII/PstI site of another vector named pXj40 with higher expression efficiency and HA tags, which was a kind gift from Dr. Cheng Gee Koh (SBS, NTU). Primers used were listed in Table 1. All the constructs were confirmed by sequencing.
Table 1.
Primers used for plasmid construction.
| Primer name | Sequence |
|---|---|
| HBx A forward | 5′‐CCCAAGCTTGCTGCTAGGCTGTACT‐3′ (Hind III) |
| HBx B forward | 5′‐CCCAAGCTTGCTGCTAGGCTGTGCT‐3′ (Hind III) |
| HBx C forward | 5′‐CCCAAGCTTGCTGCTAGGGTGTGCT‐3′ (Hind III) |
| HBx D forward | 5′‐CCCAAGCTTGCTGCTAGGCTGTGCT‐3′ (Hind III) |
| HBx A/B/C/D reverse | 5′‐AACTGCAGTTAGGCAGAGGTGAAA‐3′ (Pst I) |
4.2. Cell culture and transfection
HepG2 and HepG2.2.15 cell lines were used in this research. HepG2 is a human hepatoma cell line while HepG2.2.15 is a well established HepG2 derivative cell line, stably transfected with a plasmid containing 2 head‐to‐tail dimers of the HBV genome. HepG2 cell line was kept with minimal essential medium (MEM) supplemented with 10% fetal bovine serum (FBS) (Gibco, Invitrogen); and HepG2.2.15 was maintained with Dulbecco's Modified Eagle's Medium (DMEM) supplemented with 10% FBS, 1× MEM Non‐essential amino acid (Gibco, Invitrogen), and 150μg/ml of G418 (Geneticin) (Gibco, Invitrogen), in an incubator containing 5% CO2 at 37°C. For the transfection of HepG2 cells, considering its relatively lower transfection efficiency with other methods, electro‐transfection from Amaxa system was applied and about 50% efficiency could be achieved (data not shown), following the protocol provided by the Cell Line Nucleofector Kit V (Amaxa Inc, USA).
4.3. 5‐Aza‐dC treatment of cells
Cells were seeded in low density 12–18h before treatment. Cells were treated from a 10mM DMSO (Sigma) dissolved stock solution of 5‐Aza‐dC (A3656, Sigma–Aldrich) at a final concentration of 2.5μM, or were mock‐treated by adding into the medium with the same volume of DMSO alone. Treatment was conducted for 72h, with the drugs and culture medium replaced every 24h, as described previously (Dannenberg and Edenberg, 2006; Zhong et al., 2002).
4.4. ELISA assay
The secretion of HBV surface antigen (HBsAg) in the medium of HepG2.2.15 was detected by ELISA using IMx immunoassay system (Abbott, USA) and IMx HBsAg Kit (Abbott, USA), according to the manufacturer's instructions.
4.5. Western blotting
Cell extracts were prepared in a home‐made TNT lysis buffer (50mM Tris–HCl, pH 7.4, 150mM NaCl, 1% Triton‐100, and a protease inhibitor cocktail), followed by the protein concentration quantification with Bradford Dye Reagent (#500‐0205, Bio‐Rad). After that, equal amounts (30μg) of cell lysates were resolved by 12% SDS‐PAGE. The resolved proteins were electro‐transferred to PVDF membranes (Bio‐Rad), which were then probed with a primary antibody anti‐GSTP1 (3F2C2: sc‐66000, Santa Cruz Biotechnology), an anti‐HA (F‐7: sc‐7392, Santa Cruz Biotechnology) in 1:1000 dilution, and an anti‐β‐actin (AC‐74, Sigma) in 1:5000 dilution. A horseradish peroxidase (HRP)‐conjugated anti‐mouse IgG antibody (#31430, PIERCE) was used as the secondary antibody in 1:5000 dilution. The results were visualized using Supersignal West solutions (#1856136, PIERCE).
4.6. RNA extraction and quantification
RNA of the HepG2.2.15 or HepG2 cells transfected with HBx expression plasmids or blank vector, as well as the cells without transfection, was isolated using RNeasy Mini kit (QIAGEN) following the product manual. Briefly, buffer RTL was added to cell pellet, followed by addition of 1vol 70% ethanol. The mixture was transferred to RNeasy mini column and centrifuged at a bench top centrifuger (Sigma). The flow‐through was discarded and the column was washed with buffer RW1 and buffer RPE respectively. RNase‐free water was added directly onto the membrane of the column and RNA was eluted by centrifugation. The concentration of RNA was determined by measuring the absorbance at 260nm in a spectrophotometer, and the quality was examined by the ratio of absorbance at 260–280nm.
4.7. Real‐time RT‐PCR
Real‐time RT‐PCR was performed by using iScript One‐step RT‐PCR kit (Bio‐Rad) according to the instruction, to accurately quantify the original amount of target mRNAs in different samples. The real‐time RT‐PCR was carried out in an IQ5 multicolor Real‐time PCR detection system (Bio‐Rad), with the cycling program: 50°C 10min for cDNA synthesis; 95°C 5min for iScript Reverse Transcriptase inactivation; then 40 cycles of PCR and detection as the following: 95°C 10s, 60°C 30s; and a melt curve analysis of 95°C 1min, 55°C 1min, 55°C 10s with 80 cycles increasing each by 0.5°C. Primers were used as the sequences listed in Table 2. Microsoft Excel formatted data which could be automatically provided by IQ5 optical system software version 2.0 (Bio‐Rad) include amplification analysis, experimental report, melting curve analysis and threshold cycle number. The fold changes were calculated as the following formula:
Table 2.
Primers used for either Real‐time RT‐PCR or RT‐PCR.
| Primer name | Sequence |
|---|---|
| HBsAg forward | 5′‐TCACCATATTCTTGGGAACAA‐3′ |
| HBsAg reverse | 5′‐GTTTTGTTAGGGTTTAAATG‐3′ |
| HBcAg forward | 5′‐ATCTCCTAGACACCGCCTCA‐3′ |
| HBcAg reverse | 5′‐TTCCAAATTATTACCCACCC‐3′ |
| β‐Actin forward | 5′‐CTTAGTTGCGTTACACCCTTTC‐3′ |
| β‐Actin reverse | 5′‐ACCTTCACCGTTCCAGTTTT‐3′ |
| GSTP1 forward | 5′‐ATGACTATGTGAAGGCACTG‐3′ |
| GSTP1 reverse | 5′‐AGGTTCACGTACTCAGGGGA‐3′ |
4.8. Genomic DNA extraction and quantification
Genomic DNA of cells was extracted with PureLink Genomic DNA Kit (Invitrogen), according to the user manual provided with the kit. Genomic DNA was isolated by digestion with Proteinase K and RNase A in the Lysis/Binding Buffer during a 10min' incubation at 55°C. After that, ethanol was added and samples were applied to the PureLink Spin Column. Centrifugation was performed to allow DNA bind to the column, followed by washing and eluting. The purity of the DNA extract was evaluated by spectrophotometric determination of the A 260/280 ratio, while the concentration was calculated according to the A 260.
4.9. Bisulfite modification and methylation‐specific PCR (MSP)
Genomic DNA was treated using EpiTech Bisulfite Kit (QIAGEN) for complete bisulfite conversion and cleanup for MSP analysis. The bisulfite treatment was conducted following the manufacturer's instructions. 1.5μg of each DNA sample was used for each treatment reaction, with 85μl Bisulfite Mix, 35μl DNA Protect Buffer, and RNase‐free water to make up to 140μl as the total volume pre‐reaction. After that, a thermal cycler was used to perform the bisulfite DNA conversion according to the following program: 99°C 5min, 60°C 25min, 99°C 5min, 60°C 85min, 99°C 5min, 60°C 175min, and 99°C hold. Once the bisulfite conversion is complete, Buffer BL was added and the mixture was transferred to the EpiTect spin column and centrifuged. After washing with Buffer BW and Buffer BD, conversed DNA was eluted from the column by adding Buffer EB and performing centrifugation, and then stored at −80°C until use. To examine the methylation status at CpG islands of target genes, methylation‐specific PCR (MSP) was carried out. The bisulfite‐treated DNA was amplified with primers for both the methylated and unmethylated GSTP1 promoters, as described previously (Esteller et al., 1998). For the methylated GSTP1, primers are: GSTP1M forward: 5′‐TTC GGG GTG TAG CGG TCG TC‐3′ and GSTP1M reverse: 5′‐GCC CCA ATA CTA AAT CAC GAC G‐3′; for the unmethylated GSTP1, primers are: GSTP1 U forward: 5′‐GAT GTT TGG GGT GTA GTG GTT GTT‐3′ and GSTP1 U reverse: 5′‐CCA CCC CAA TAC TAA ATC ACA ACA‐3′. The PCR mixture contained bisulfite‐modified DNA 100ng, 1× Platinum Taq buffer, 1.5mM MgCl2, 0.24mM each of dNTP, 0.6μM of each primer, and 1 unit of Platinum Taq DNA polymerase (10966034, Invitrogen). The temperature profiles for the amplification were: 95°C 5min, 35 cycles of denaturing at 95°C for 30s, annealing at 59°C for 45s, extension at 72°C for 30s, and a final extension at 72°C for 10min. PCR products were analyzed by 3.5% agarose gel with ethidium bromide, as described (Zhang et al., 2005).
4.10. Reactive oxygen species (ROS) detection
We used Image iT LIVE Green Reactive Oxygen Species Detection Kit (I36007, Invitrogen) to test ROS in live cells by different treatments. According to the optimized protocol provided in the kit, oxidatively stressed and non‐stressed cells could be reliably distinguished by fluorescence microscopy. In detail, when cells are ready, gently wash cells once with warm HBSS buffer. Then apply a sufficient amount of 25μM carboxy‐H2DCFDA working solution to cover the cells adhering to the plate for a 30min incubation at 37°C protected from light. After that gently wash cells three times in warm HBSS and add some more HBSS buffer before imaging the cells immediately under fluorescence microscopy. The use of TBHP (also provided in the kit) was employed as a positive control for the induction of ROS, by applying 100μM TBHP working solution to the cells and incubating for 90min at 37°C and 5% CO2 before the labeling procedures as described above.
4.11. Apoptosis assay
We used Annexin‐V‐FLUOS Staining Kit (Roche) according to the manufacturer's instructions, for the detection and quantification of apoptosis and differentiation from necrosis at single cell level, based on Annexin‐V‐labeling. Briefly, Annexin‐V‐FLUOS labeling solution was prepared by prediluting 20μl Annexin‐V‐Fluos labeling reagent and 20μl Propidium iodide solution in 1ml Incubation buffer. 106 Cells were trypsinized and washed with PBS and collected by centrifugation. After that cells were resuspended in 100μl labeling solution and incubated for 10–15min at room temperature. 0.5ml Incubation buffer was added per 106 cells and analysis on a flow cytometer was carried out using 488nm excitation and a 515nm bandpass filter for fluorescein detection and a filter >600nm for PI detection. The analysis clearly differentiates normal (living) cells with low Annexin and low PI staining, apoptotic cells with high Annexin and low PI staining, while necrotic cells with high Annexin and high PI staining.
Acknowledgements
This work was supported by grant RG42/05 (WN Chen) from Ministry of Education, Singapore. DD Niu and HX Feng are recipients of the graduate scholarship from Nanyang Technological University. JH Zhang is recipient of Singapore Millennium Foundation Scholarship.
Niu Dandan, Zhang Jianhua, Ren Yudan, Feng Huixing, Chen Wei Ning, (2009), HBx genotype D represses GSTP1 expression and increases the oxidative level and apoptosis in HepG2 cells, Molecular Oncology, 3, doi: 10.1016/j.molonc.2008.10.002.
References
- Dannenberg, L.O. , Edenberg, H.J. , 2006. Epigenetics of gene expression in human hepatoma cells: expression profiling the response to inhibition of DNA methylation and histone deacetylation. BMC Genomics. 7, 181 [DOI] [PMC free article] [PubMed] [Google Scholar]
- Esteller, M. , Corn, P.G. , Urena, J.M. , Gabrielson, E. , Baylin, S.B. , Herman, J.G. , 1998. Inactivation of glutathione S-transferase P1 gene by promoter hypermethylation in human neoplasia. Cancer Res.. 58, 4515–4518. [PubMed] [Google Scholar]
- Fiedler, N. , Quant, E. , Fink, L. , Sun, J. , Schuster, R. , Gerlich, W.H. , Schaefer, S. , 2006. Differential effects on apoptosis induction in hepatocyte lines by stable expression of hepatitis B virus X protein. World J. Gastroenterol.. 12, 4673–4682. [DOI] [PMC free article] [PubMed] [Google Scholar]
- Jung, J.K. , Arora, P. , Pagano, J.S. , Jang, K.L. , 2007. Expression of DNA methyltransferase 1 is activated by hepatitis B virus X protein via a regulatory circuit involving the p16INK4a-cyclin D1-CDK 4/6-pRb-E2F1 pathway. Cancer Res.. 67, 5771–5778. [DOI] [PubMed] [Google Scholar]
- Lee, J.O. , Kwun, H.J. , Jung, J.K. , Choi, K.H. , Min, D.S. , Jang, K.L. , 2005. Hepatitis B virus X protein represses E-cadherin expression via activation of DNA methyltransferase 1. Oncogene. 24, 6617–6625. [DOI] [PubMed] [Google Scholar]
- Liu, J. , Lian, Z. , Han, S. , Waye, M.M. , Wang, H. , Wu, M.C. , Wu, K. , Ding, J. , Arbuthnot, P. , Kew, M. , 2006. Downregulation of E-cadherin by hepatitis B virus X antigen in hepatocellullar carcinoma. Oncogene. 25, 1008–1017. [DOI] [PubMed] [Google Scholar]
- Lu, Y.W. , Chen, W.N. , 2005. Human hepatitis B virus X protein induces apoptosis in HepG2 cells: role of BH3 domain. Biochem. Biophys. Res. Commun.. 338, 1551–1556. [DOI] [PubMed] [Google Scholar]
- Lu, Y.W. , Tan, T.L. , Zhang, J. , Chen, W.N. , 2007. Cellular apoptosis induced by replication of hepatitis B virus: possible link between viral genotype and clinical outcome. Virol. J.. 4, 117 [DOI] [PMC free article] [PubMed] [Google Scholar]
- Miao, J. , Chen, G.G. , Chun, S.Y. , Lai, P.P. , 2006. Hepatitis B virus X protein induces apoptosis in hepatoma cells through inhibiting Bcl-xL expression. Cancer Lett.. 236, 115–124. [DOI] [PubMed] [Google Scholar]
- Park, I.Y. , Sohn, B.H. , Yu, E. , Suh, D.J. , Chung, Y.H. , Lee, J.H. , Surzycki, S.J. , Lee, Y.I. , 2007. Aberrant epigenetic modifications in hepatocarcinogenesis induced by hepatitis B virus X protein. Gastroenterology. 132, 1476–1494. [DOI] [PubMed] [Google Scholar]
- Sells, M.A. , Chen, M.L. , Acs, G. , 1987. Production of hepatitis B virus particles in Hep G2 cells transfected with cloned hepatitis B virus DNA. Proc. Natl. Acad. Sci. U. S. A.. 84, 1005–1009. [DOI] [PMC free article] [PubMed] [Google Scholar]
- Strange, R.C. , Spiteri, M.A. , Ramachandran, S. , Fryer, A.A. , 2001. Glutathione-S-transferase family of enzymes. Mutat. Res.. 482, 21–26. [DOI] [PubMed] [Google Scholar]
- Su, F. , Schneider, R.J. , 1997. Hepatitis B virus HBx protein sensitizes cells to apoptotic killing by tumor necrosis factor alpha. Proc. Natl. Acad. Sci. U. S. A.. 94, 8744–8749. [DOI] [PMC free article] [PubMed] [Google Scholar]
- Su, P.F. , Lee, T.C. , Lin, P.J. , Lee, P.H. , Jeng, Y.M. , Chen, C.H. , Liang, J.D. , Chiou, L.L. , Huang, G.T. , Lee, H.S. , 2007. Differential DNA methylation associated with hepatitis B virus infection in hepatocellular carcinoma. Int. J. Cancer. 121, 1257–1264. [DOI] [PubMed] [Google Scholar]
- Tischoff, I. , Tannapfe, A. , 2008. DNA methylation in hepatocellular carcinoma. World J. Gastroenterol.. 14, 1741–1748. [DOI] [PMC free article] [PubMed] [Google Scholar]
- Ye, L. , Dong, N. , Wang, Q. , Xu, Z. , Cai, N. , Wang, H. , Zhang, X. , 2008. Progressive changes in hepatoma cells stably transfected with hepatitis B virus X gene. Intervirology. 51, 50–58. [DOI] [PubMed] [Google Scholar]
- Zhang, Y.J. , Chen, Y. , Ahsan, H. , Lunn, R.M. , Chen, S.Y. , Lee, P.H. , Chen, C.J. , Santella, R.M. , 2005. Silencing of glutathione S-transferase P1 by promoter hypermethylation and its relationship to environmental chemical carcinogens in hepatocellular carcinoma. Cancer Lett.. 221, 135–143. [DOI] [PubMed] [Google Scholar]
- Zhang, Y.J. , Wu, H.C. , Shen, J. , Ahsan, H. , Tsai, W.Y. , Yang, H.I. , Wang, L.Y. , Chen, S.Y. , Chen, C.J. , Santella, R.M. , 2007. Predicting Hepatocellular Carcinoma by Detection of Aberrant Promoter Methylation in Serum DNA. Clin. Cancer Res.. 13, 2378–2384. [DOI] [PubMed] [Google Scholar]
- Zhong, S. , Tang, M.W. , Yeo, W. , Liu, C. , Lo, Y.M. , Johnson, P.J. , 2002. Silencing of GSTP1 gene by CpG island DNA hypermethylation in HBV-associated hepatocellular carcinomas. Clin. Cancer Res.. 8, 1087–1092. [PubMed] [Google Scholar]
- Zhou, T. , Evans, A.A. , London, W.T. , Xia, X. , Zou, H. , Shen, F. , Clapper, M.L. , 1997. Glutathione S-transferase expression in hepatitis B virus-associated human hepatocellular carcinogenesis. Cancer Res.. 57, 2749–2753. [PubMed] [Google Scholar]