Abstract
Objective
To assess the associations of perceived discrimination and CV outcomes in African Americans (AA) in the Jackson Heart Study.
Methods
In 5085 AA free of clinical CV disease at baseline enrolled in the Jackson Heart Study from September 26, 2000–March 31, 2004 and followed through 2012, associations of everyday discrimination (frequency of occurrences of perceived unfair treatment) and lifetime discrimination (perceived unfair treatment in 9 life domains) with CV outcomes (all-cause mortality, incident coronary heart disease [CHD], incident stroke, and heart failure [HF] hospitalization) were examined using Cox models.
Results
Greater everyday and lifetime discrimination were more common in participants who were younger, male, had higher education and income, a lower perceived community standing, worse healthcare access, and fewer comorbidities. Prior to adjustment, greater everyday and lifetime discrimination were associated with a lower risk of all-cause mortality, incident CHD, stroke, and HF hospitalization. After adjustment for potential confounders, we found no association of everyday/lifetime discrimination with incident CHD, incident stroke or HF hospitalization; however, a decrease in all-cause mortality with progressively higher everyday discrimination persisted (HR per unit increase in discrimination 0.90, 95% CI 0.82–0.99, P=.02). The unexpected association of everyday discrimination and all-cause mortality was partially mediated by perceived stress.
Conclusion
We found no independent associations of perceived discrimination with risk of incident CV disease or HF hospitalization in this AA population. An observed paradoxical negative association of everyday discrimination and all-cause mortality was partially mediated by perceived stress.
Keywords: discrimination, mortality, stroke, coronary disease, heart failure
INTRODUCTION
In 1985, the Heckler report1 demonstrated that African Americans (AA) experienced worse health outcomes than Whites in the United States. Today, AA still suffer from a higher burden of adverse cardiovascular (CV) risk factors such as hypertension2,3 and obesity4, and are more likely to develop chronic CV conditions such as heart failure (HF)5,6. Perceived discrimination has been shown to play a role in the development of CV risk factors such as hypertension in AA7, but the associations with CV outcomes have been less thoroughly examined. A recent report from a multi-ethnic cohort study found a modestly increased risk of CV events in participants reporting discrimination8. Whether this association persists in an exclusively AA population requires further examination. A better understanding of the role of discrimination in AA is of particular importance in designing public health prevention efforts, as AA are not only disproportionately affected with CV disease (CVD) compared with other races and ethnicities, but also most likely to report discrimination8,9. Furthermore, the way in which racial discrimination may lead to differences in health risks and outcomes may be complex and mediated by psychosocial factors such as poverty and education.
The extensive clinical and psychosocial data collected in the Jackson Heart Study (JHS) provide a framework to investigate whether perceived racial discrimination is associated with CV health outcomes and how other psychosocial constructs may mediate this relationship. The goal of this study was to determine the impact of perceived discrimination on outcomes (all-cause mortality, incident stroke, incident coronary heart disease [CHD], HF hospitalization) and to test the hypothesis that individuals with greater perceived discrimination experience worse outcomes and have a higher risk of incident CVD.
METHODS
Data sources
We used data from the JHS, a cohort study of AA adults from the Jackson, Mississippi metropolitan area developed to evaluate risk factors for CV outcomes in this community. Detailed study methods are reported elsewhere.10–13 Briefly, 5301 participants, aged 21 to 94, were enrolled between September 26, 2000 and March 31, 2004. Participants had a baseline clinical examination and provided responses to interviews and questionnaires on topics including demographics, social and economic factors, medical history, and medications. This analysis uses data collected during the baseline exam visits and follow-up event surveillance data gathered through December 31, 2012. The JHS was approved by the institutional review boards of Jackson State University, Tougaloo College, the University of Mississippi Medical Center, and the Duke University Health System. All study participants gave written informed consent.
Study population
We included all participants who completed the everyday and lifetime sections of the discrimination instrument at the baseline exam visit. For incident stroke and incident CHD, we excluded patients with prevalent stroke or prevalent CHD at the baseline exam visit, respectively. For HF hospitalization, we included participants who survived through January 1, 2005, the start date for HF hospitalization surveillance.
Exposure definition
Perceived discrimination was measured using three scales from the JHS Discrimination Instrument.7,12,14 The everyday discrimination scale consists of nine statements following the question “How often on a day-to-day basis do you have the following experiences?” Examples include “You are treated with less respect than other people”, “People act as if they think you are not smart”, and “You are threatened or harassed”. Response choices range from “never”(1) to “several times a day”(7) assessing frequency of everyday discrimination. The mean of the nine responses was treated as a continuous variable (range 1–7). The lifetime discrimination scale consists of nine domains completing the question “Have you ever felt unfairly treated…?” Examples include “in getting a job”, “at school or during training”, and “in getting resources or money”. The sum of the binary responses (“Yes”=1; “No”=0) was used as a continuous measure (range of 0 to 9). Finally, the burden of lifetime discrimination scale is composed of 3 questions asking participants to rate how stressful these experiences have been, to what extent discrimination has interfered with having a full and productive life, and how much harder life has been due to discrimination, scored on a 1 to 4 scale where 4 represents the greatest burden.
Outcome ascertainment
CV endpoints were ascertained by annual telephone follow-up interviews, surveillance of hospitalizations with adjudicated medical abstraction review, and death certificate review.15 Hospital discharge lists are reviewed for International Classification of Diseases, 9th revision (ICD-9) codes for CV events (CHD, stroke, HF), and if present, hospital records are reviewed in detail by trained abstractors with data entered into a computerized system. For incident stroke and incident CHD events, computerized event data are subsequently reviewed and events adjudicated by a committee. Surveillance for incident stroke, incident CHD and deaths began in September 2000; surveillance of HF hospitalizations began on January 1, 2005; as a result of the delay in HF hospitalization surveillance, we measure time to first HF hospitalization after January 1, 2005 but cannot determine whether subjects had other HF hospitalizations prior to that date.
Covariates
Covariates were selected based on prior knowledge of potential confounders. We categorized these variables into four groups, which were then used as sequential adjustment sets in the models. Demographic variables included age and sex. Clinical and behavioral variables included smoking status (never, former, or current); body mass index; hypertension, hypercholesterolemia, diabetes mellitus, and estimated glomerular filtration rate. Socioeconomic status variables included income (poor, lower-middle, upper-middle, affluent, or missing); education (less than high school, high school graduate, college degree, or graduate/professional degree); occupation (management/professional, service, sales, construction, production, and other/missing); perceived standing in the community (continuous variable); and healthcare access. The fully-adjusted model included an ordinal scale for social support (Range 0–5, continuous variable, calculated by the sum of items assessing marital status, number of friends and relatives, and involvement in community groups).
Statistical analysis
For descriptive analyses and the assessment of threshold effects, the everyday and lifetime discrimination scores were categorized into quartiles. Baseline characteristics were described by quartile of everyday or lifetime discrimination using frequencies with percentages for categorical variables and means with standard deviations for continuous variables. To compare baseline characteristics between quartiles, we used χ2 tests for categorical variables and Kruskal-Wallis tests for continuous variables. Kaplan-Meier methods were used to calculate and plot 11-year cumulative incidence of all-cause mortality, incident stroke, and incident CHD and 8-year cumulative incidence for HF hospitalization. Log-rank tests were used to assess differences by quartile.
Unadjusted and adjusted Cox proportional hazards regression models were used to examine the associations of each discrimination measure on a continuous scale (everyday, lifetime and burden) and each of the four outcomes. Participant censoring was set at the time of (a) participant loss to follow-up, or (b) December 31st, 2012, the end of study follow-up; for incident CHD, incident stroke, and HF hospitalization, death was treated as an additional censoring event. Each discrimination measure was parameterized with a linear functional form and Box-Tidwell tests were used to assess potential non-linearity. Covariate groups were sequentially entered into five successive regression models for each outcome: 1) unadjusted, 2) adjusted for demographic variables, 3) adjusted for demographic and clinical/behavioral variables, 4) adjusted for variables in model 3 plus socioeconomic variables, and 5) adjusted for variables in model 4 plus social support. The proportional hazards assumption was tested by including a term for the interaction between each discrimination measure and the log of survival time. Potential effect modification was assessed by including a term for the interaction between each discrimination measure and either age or sex into each of the fully-adjusted models. In a post-hoc analysis, we explored if perceived stress mediated the association of everyday discrimination and mortality by adding perceived stress as a continuous variable to the final model (model 5). Perceived stress should be considered on the causal pathway between discrimination and health outcomes, particularly because the perceived stress questionnaire contains a question, “Over the past 12 months, how much stress did you experience related to racism and discrimination?” We conducted a simple mediation analysis of the relationships between discrimination, stress, and all-cause mortality using the four steps suggested by Baron and Kenny.16
Most variables had very low rates of missingness (<5%). For variables with < 5% missingness, we imputed continuous variables to the median value, dichotomous variables to “no”, and multichotomous variables to the most frequent categorical value.17 For household income (15.3% missingness) missing values were treated as a separate category.18 All analyses were performed using SAS version 9.4 (SAS Institute, Cary, North Carolina). A P value of <.05 was used as the level of significance in all analyses.
RESULTS
Study population
In total, 5,301 participants were enrolled in the JHS from September 26, 2000–March 31, 2004, of whom 5,085 (95.8%) completed baseline discrimination questionnaires and were included in analysis. The mean (standard deviation) age of participants was 55.3 (12.8) years and 1,856 (36.5%) were men. Most participants (81.7%) graduated high school and 39.6% had a college or graduate degree.
The vast majority of participants (85%) reported experiencing discrimination at some point in their life. The baseline characteristics of the study population by quartiles of everyday discrimination are shown in Table 1. Participants reporting a higher burden of everyday discrimination were more often younger, male, had higher education, higher income, lower perceived standing in the community, worse perceived healthcare access, higher body mass index, and a lower prevalence of CV risk factors. Similar differences in characteristics were observed when the population was stratified by quartiles of lifetime discrimination (data not shown).
Table 1.
Baseline Characteristics of 5,085 Jackson Heart Study Participants by Quartiles of Perceived Everyday Discrimination
| Lowest Discrimination → Highest Discriminationa | |||||
|---|---|---|---|---|---|
| 1st Quartile | 2nd Quartile | 3rd Quartile | 4th Quartile | P - value | |
| N | 1287 | 1211 | 1303 | 1284 | |
| Demographics | |||||
| Age, mean (SD) | 60.3 (12.8) | 55.9 (12.4) | 53.8 (12.3) | 51.1 (12.0) | < .001 |
| Male sex, No. (%) | 453 (35.2) | 377 (31.1) | 508 (39.0) | 518 (40.3) | < .001 |
| Socioeconomic | |||||
| Education, No. (%) | < .001 | ||||
| Less than high school | 379 (29.4) | 197 (16.3) | 174 (13.4) | 182 (14.2) | |
| High school graduate | 510 (39.6) | 488 (40.3) | 545 (41.8) | 595 (46.3) | |
| College degree | 218 (16.9) | 296 (24.4) | 335 (25.7) | 323 (25.2) | |
| Graduate or professional degree | 180 (14.0) | 230 (19.0) | 249 (19.1) | 184 (14.3) | |
| Incomeb, No. (%) | < .001 | ||||
| Poor | 206 (16.0) | 122 (10.1) | 162 (12.4) | 181 (14.1) | |
| Lower-middle | 316 (24.6) | 243 (20.1) | 218 (16.7) | 265 (20.6) | |
| Upper-middle | 293 (22.8) | 308 (25.4) | 358 (27.5) | 323 (25.2) | |
| Affluent | 258 (20.0) | 346 (28.6) | 398 (30.5) | 310 (24.1) | |
| Missing | 214 (16.6) | 192 (15.9) | 167 (12.8) | 205 (16.0) | |
| Occupation, No. (%) | < .001 | ||||
| Management/professional | 373 (29.0) | 490 (40.5) | 538 (41.3) | 428 (33.3) | |
| Service | 407 (31.6) | 279 (23.0) | 276 (21.2) | 310 (24.1) | |
| Sales | 167 (13.0) | 233 (19.2) | 216 (16.6) | 258 (20.1) | |
| Construction | 78 (6.1) | 63 (5.2) | 88 (6.8) | 82 (6.4) | |
| Production | 243 (18.9) | 135 (11.1) | 175 (13.4) | 196 (15.3) | |
| Other/Missingc | 19 (1.5) | 11 (0.9) | 10 (0.8) | 10 (0.8) | |
| Perceived standing in the community, mean (SD)d | 8.0 (2.0) | 7.8 (1.9) | 7.4 (2.0) | 7.2 (2.1) | < .001 |
| Social support, mean (SD) d | 4.1 (0.8) | 4.3 (0.8) | 4.2 (0.8) | 4.1 (1.0) | < .001 |
| Healthcare access, mean (SD) d | 0.4 (0.7) | 0.4 (0.8) | 0.5 (0.9) | 0.6 (0.9) | < .001 |
| Physical examination | |||||
| BMI, kg/m2, mean (SD) | 31.1 (6.6) | 31.8 (7.1) | 31.7 (7.4) | 32.3 (7.7) | .009 |
| Behavioral factors | |||||
| Smoking history, No. (%) | < .001 | ||||
| Never smoked | 881 (68.5) | 842 (69.5) | 884 (67.8) | 839 (65.3) | |
| Former smoker | 272 (21.1) | 234 (19.3) | 252 (19.3) | 231 (18.0) | |
| Current smoker | 134 (10.4) | 135 (11.1) | 167 (12.8) | 214 (16.7) | |
| Comorbidities | |||||
| Hypertension, No. (%) | 889 (69.1) | 727 (60.0) | 747 (57.3) | 698 (54.4) | < .001 |
| Hypercholesterolemia, No. (%) | 429 (33.3) | 386 (31.9) | 364 (27.9) | 334 (26.0) | < .001 |
| Diabetes, No. (%) | 316 (24.6) | 282 (23.3) | 266 (20.4) | 249 (19.4) | .004 |
| Estimated GFR, mean (SD) | 82.9 (19.7) | 85.0 (18.2) | 86.7 (17.6) | 89.1 (17.5) | < .001 |
BMI= body mass index; GFR= glomerular filtration rate; No.=number; SD=standard deviation
Patients were divided into quartiles by everyday discrimination scores (range 1–7). The range of scores from the lowest to highest quartile were 1.00–1.22, 1.33–1.77, 1.88–2.55, 2.66–7.00.
Income categories were based on family size, US Census poverty levels, and year of baseline clinic visit (2000–2004). Poor represents income below poverty level. Lower-middle, upper-middle, and affluent represent 1–1.5, >1.5 – <3.5, and ≥ 3.5 times the poverty level, respectively.
“Other / missing” occupation includes farming, military, sick, unemployed, homemaker, retired, student, and missing.
Perceived standing in the community scores range from 1–10 with higher scores indicating greater perceived standing. The social support scale ranges from 0–5 with higher scores indicate greater social support. Healthcare access scores range from 0–3 with lower scores indicating better perceived healthcare access.
Associations of perceived discrimination and CV outcomes
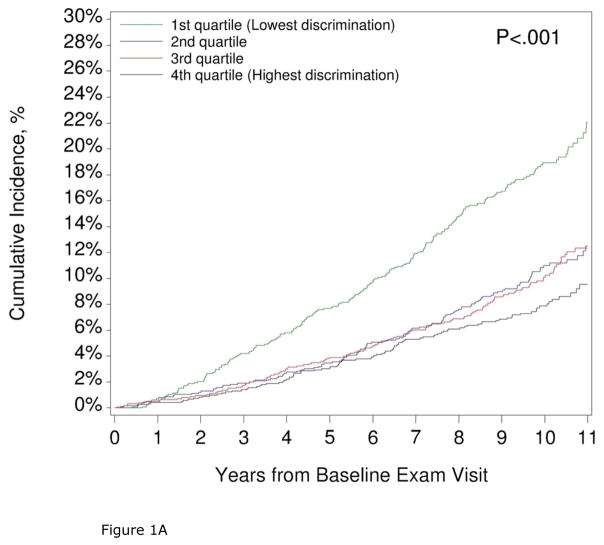
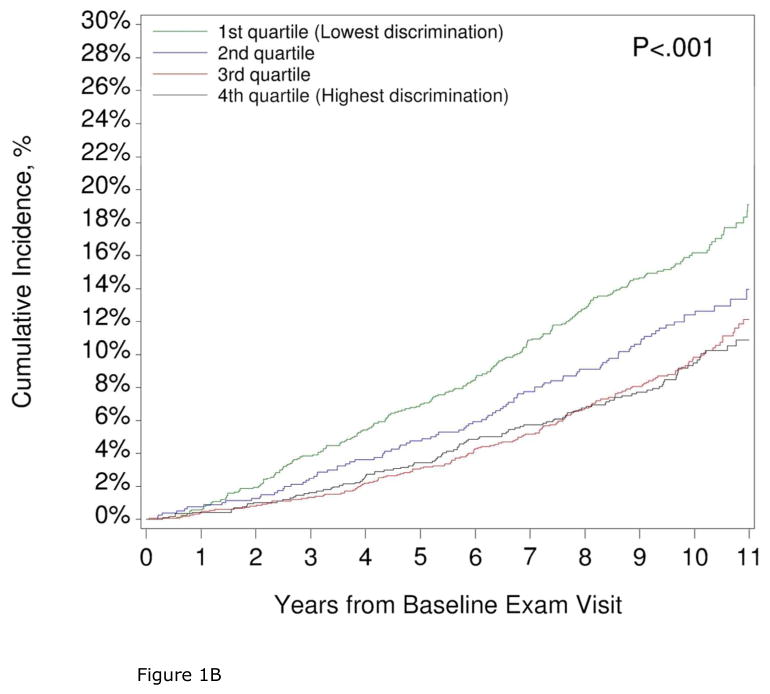
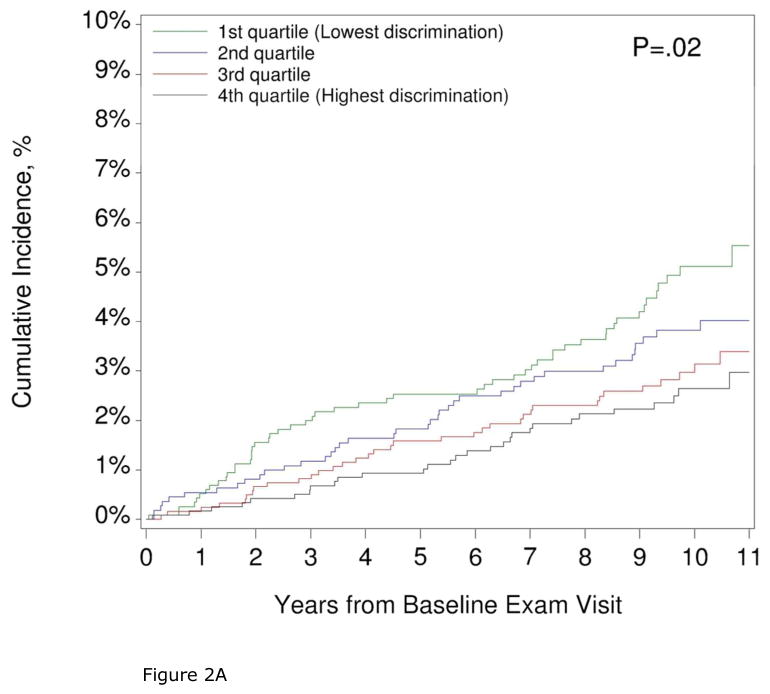
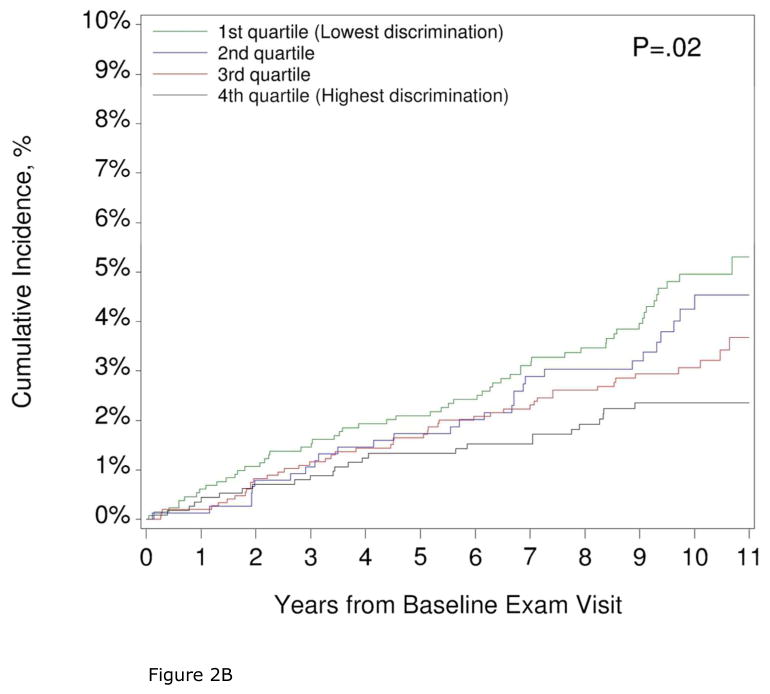
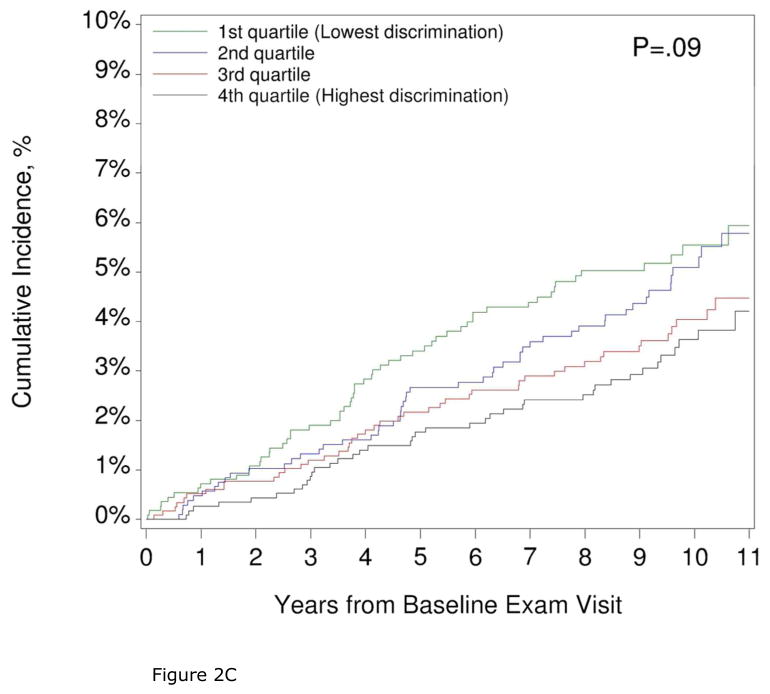
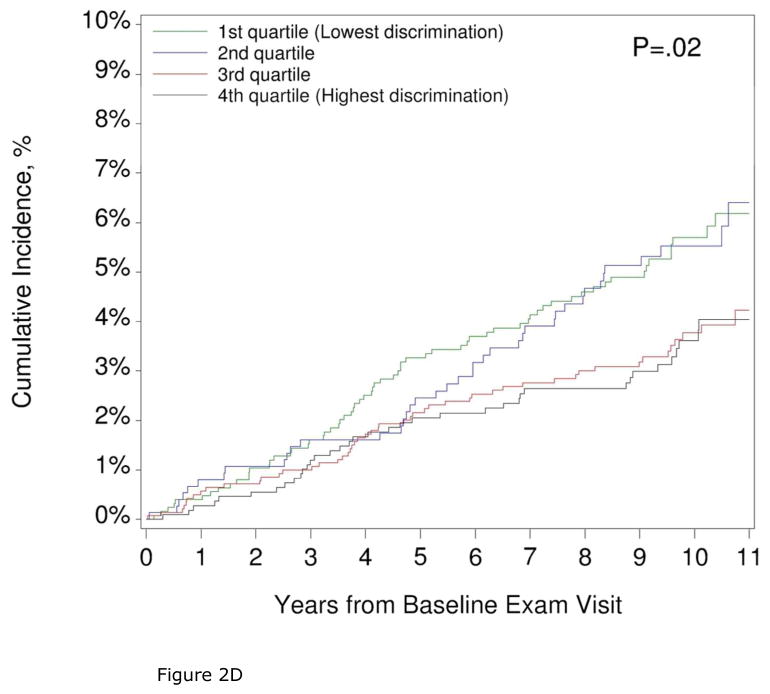
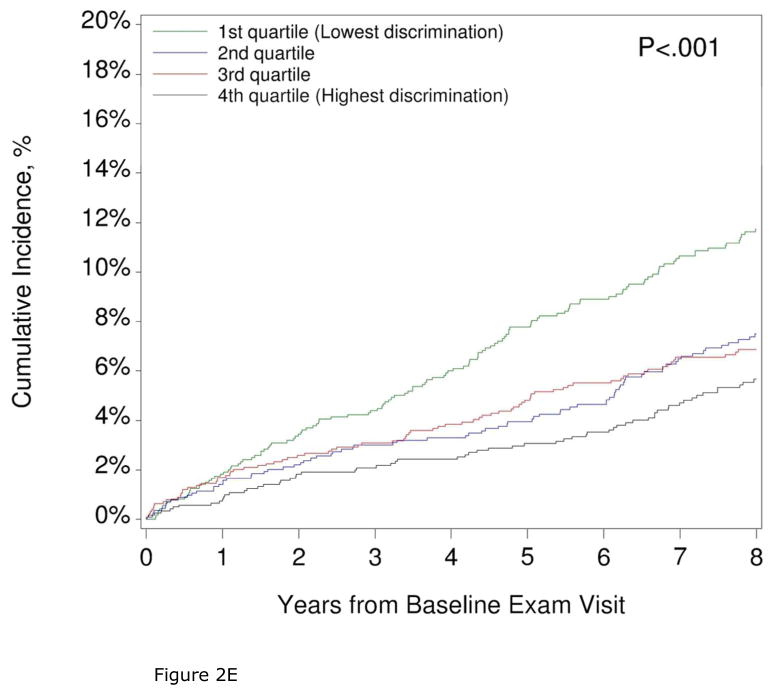
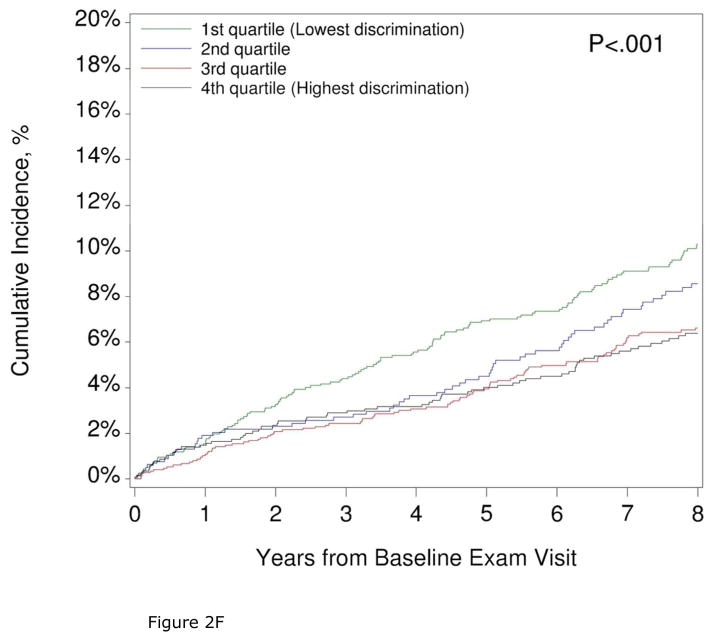
Over a median follow-up of 9.8 (25th, 75th percentile 8.8, 10.6 years; median 8.0 years, 25th, 75th percentile 7.5, 8.0 years for HF hospitalizations), 573 deaths, 193 incident CHD, 156 incident strokes, and 348 HF hospitalizations were observed. The cumulative incidence of all-cause mortality, incident CHD, incident stroke, and HF hospitalization were higher in participants with lower perceived discrimination (Figures 1 and 2, Supplemental Tables 1 and 2). Accordingly, in the unadjusted model, greater perceived everyday discrimination was associated with a lower risk of all-cause mortality, incident stroke, and HF hospitalization (Table 2). Findings were similar for lifetime discrimination (Table 3). The unadjusted association of perceived discrimination and incident CHD was statistically significant for lifetime discrimination (HR 0.91, 95% CI 0.85, 0.97), but not everyday discrimination (HR 0.88, 95% CI 0.76, 1.03). In participants reporting discrimination, we found no association between the burden of lifetime discrimination and all-cause mortality, incident CHD, incident stroke, or HF hospitalization (P>.05 in unadjusted and adjusted analyses, Supplemental Table 3).
Figure 1. Cumulative incidence of All-cause Mortality by Quartiles of Everyday and Lifetime Discrimination.
The cumulative incidence of all-cause mortality by quartiles of everyday (1A) and lifetime (1B) discrimination are shown.
Figure 1A. All-cause mortality by everyday discrimination
Figure 1B. All-cause mortality by lifetime discrimination
Figure 2. Cumulative Incidence of Incident Stroke, Incident Coronary Heart Disease, and Heart Failure Hospitalization by Quartiles of Everyday and Lifetime Discrimination.
The cumulative incidence of incident stroke (2A, 2B), coronary heart disease (2C, 2D), and heart failure (2E, 2F) by quartiles of everyday and lifetime discrimination are shown.
Figure 2A. Incident Stroke by Everyday Discrimination
Figure 2B. Incident Stroke by Lifetime Discrimination
Figure 2C. Incident CHD by Everyday Discrimination
Figure 2D. Incident CHD by Lifetime Discrimination
Figure 2E. Heart Failure by Everyday Discrimination
Figure 2F. Heart Failure by Lifetime Discrimination
Table 2.
Hazard ratios for the Associations of Everyday Discrimination and All-cause Mortality, Incident Stroke, Incident Coronary Heart Disease, and Heart Failure Hospitalization
| Model | All-cause mortality | Incident stroke | Coronary heart disease | Heart failure hospitalization | ||||
|---|---|---|---|---|---|---|---|---|
| Hazard Ratio (95% CI)d | P-value | Hazard Ratio (95% CI) d | P-value | Hazard Ratio (95% CI) d | P-value | Hazard Ratio (95% CI) d | P-value | |
| 1: Unadjusted | 0.74 (0.67, 0.81) | < .001 | 0.76 (0.63, 0.91) | .003 | 0.88 (0.76, 1.03) | .11 | 0.79 (0.70, 0.89) | < .001 |
| 2: Age and Sex | 0.94 (0.85, 1.03) | .16 | 0.93 (0.78, 1.11) | .40 | 1.05 (0.91, 1.22) | .49 | 0.99 (0.89, 1.12) | .92 |
| 3: M2+Behavioral/Clinicala | 0.91 (0.83, 1.00) | .05 | 0.90 (0.75, 1.07) | .24 | 1.05 (0.90, 1.21) | .54 | 0.97 (0.86, 1.08) | .55 |
| 4: M3+Socioeconomicb | 0.90 (0.82, 0.99) | .03 | 0.91 (0.76, 1.08) | .28 | 1.04 (0.90, 1.20) | .62 | 0.96 (0.85, 1.08) | .50 |
| 5: M4+Social Supportc | 0.90 (0.82, 0.99) | .02 | 0.90 (0.76, 1.08) | .27 | 1.04 (0.90, 1.20) | .62 | 0.96 (0.85, 1.08) | .49 |
Adjusted for all variables in model 2 plus smoking status, body mass index, hypertension, hypercholesterolemia, diabetes mellitus, estimated glomerular filtration rate
Adjusted for all variables in model 3 plus income, education, occupation, perceived standing in the community, healthcare access. Due to low event counts, 3 variables were re-parameterized to reduce the total degrees of freedom for the incident stroke and incident coronary heart disease models only: (1) income was reduced to 3 categories, (2) education was treated as continuous, and (3) occupation was dichotomized.
Adjusted for all variables in model 4 plus social support
Hazard ratios are per 1-point increase in everyday discrimination
Table 3.
Hazard ratios for the Associations of Lifetime Discrimination and All-cause Mortality, Incident Stroke, Incident Coronary Heart Disease, and Heart Failure Hospitalization
| Model | All-cause mortality | Incident stroke | Coronary heart disease | Heart failure hospitalization | ||||
|---|---|---|---|---|---|---|---|---|
| Hazard Ratio (95% CI) d | P-value | Hazard Ratio (95% CI) d | P-value | Hazard Ratio (95% CI) d | P-value | Hazard Ratio (95% CI) d | P-value | |
| M1: Unadjusted | 0.88 (0.85, 0.92) | < .001 | 0.88 (0.81, 0.95) | .001 | 0.91 (0.85, 0.97) | .007 | 0.91 (0.86, 0.96) | < .001 |
| M2: Age and Sex | 0.94 (0.90, 0.98) | .004 | 0.93 (0.86, 1.00) | .06 | 0.95 (0.89, 1.02) | .17 | 0.97 (0.92, 1.02) | .28 |
| M3: M2+Behavioral/Clinicala | 0.94 (0.91, 0.98) | .006 | 0.93 (0.86, 1.01) | .07 | 0.96 (0.89, 1.03) | .24 | 0.97 (0.92, 1.03) | .33 |
| M4: M3+Socioeconomicb | 0.96 (0.92, 1.00) | .04 | 0.94 (0.86, 1.02) | .12 | 0.96 (0.89, 1.03) | .27 | 0.99 (0.93, 1.04) | .65 |
| M5: M4+Social Supportc | 0.96 (0.92, 1.00) | .06 | 0.94 (0.86, 1.02) | .12 | 0.96 (0.89, 1.03) | .28 | 0.99 (0.94, 1.04) | .68 |
Adjusted for all variables in model 2 plus smoking status, BMI, hypertension, hypercholesterolemia, diabetes mellitus, estimated glomerular filtration rate
Adjusted for all variables in model 3 plus income, education, occupation, perceived standing in the community, healthcare access. Due to low event counts, 3 variables were re-parameterized to reduce the total degrees of freedom for the incident stroke and incident coronary heart disease models only: (1) income was reduced to 3 categories, (2) education was treated as continuous, and (3) occupation was dichotomized.
Adjusted for all variables in model 4 plus social support.
Hazard ratios are per 1-point increase in lifetime discrimination
Potential confounders and mediators of the associations of perceived discrimination with CV outcomes were adjusted for in a stepwise fashion. Adjusting for age and sex (Model 2, Tables 2 and 3) shifted all of the HR toward, or through, the null, largely due to the fact that older participants reported less discrimination and were at greater risk for incident CVD. In the fully-adjusted models, we found no statistically significant association of perceived discrimination with incident CHD, incident stroke or HF hospitalization; however, a decrease in all-cause mortality risk with progressively higher perceived everyday discrimination persisted (adjusted HR per unit increase in perceived discrimination 0.90, 95% CI 0.82, 0.99, P=.02). However, perceived stress partially mediated this association. The addition of perceived stress to the final model (model 5) resulted in an adjusted HR of 0.92 (95% CI 0.83, 1.01, P=.08). The association of lifetime discrimination and all-cause mortality was not significant (HR 0.96, 95% CI 0.92, 1.00, P=.06). Results were similar when perceived discrimination was modeled in quartiles (Supplemental Table 4. No differences in the associations of discrimination (everyday, lifetime) and outcomes by age or sex were detected (P values for interactions with each discrimination measure for each outcome were all >.05).
DISCUSSION
This study revealed several key findings. First, perceived discrimination was related to demographics, socioeconomic and psychosocial factors in this large, community-based AA cohort. Second, older individuals reported less discrimination than younger individuals, which is of importance when considering the associations of discrimination and age-related outcomes such as CVD and death. Third, in contrast to findings from a multi-ethnic cohort8, we found no independent associations of perceived discrimination with risk of incident CHD, incident stroke or HF hospitalization. Fourth, we did, however, find an unexpected inverse association of perceived everyday discrimination with all-cause mortality that persisted after adjustment for potential confounders.
Our finding that older participants report less discrimination is consistent with prior reports7,19, but becomes particularly important when examining the associations of discrimination with risk of outcomes that increase with age, such as those examined in this study. The connection between age and perceived discrimination may relate to factors other than age alone. In the JHS, younger participants had higher education8,20 and income8,20 than older participants, and may live and work in environments of greater racial and ethnic diversity where exposure to discrimination would be more likely to occur9,21 and thus be likely to have adverse effects on proximal (vs. distal) health outcomes.
This is one of the first reports of the associations of discrimination and incident CVD and death in AA. To the best of our knowledge, the only prior study of the associations of discrimination and incident CV events was an analysis of participants in the Multi-Ethnic Study of Atherosclerosis, which enrolled individuals age 45–84 of all races and ethnicities in six United States cities. The authors reported a modest increase in the risk of incident CV events in participants with greater lifetime discrimination (HR 1.28)8. As the number of events was approximately half that observed in our study, the authors used a combined endpoint of incident CHD, incident stroke, and CV death in their analysis. While the 26% of AA participants (N=1,718) were more likely to report discrimination, they acknowledge that the power to detect differences by race/ethnicity was limited and stratified analyses by race were not performed. Herein, in an exclusively AA population, we found no independent association of perceived discrimination and incident CHD or incident stroke. Furthermore, we found no increased risk of HF hospitalization in participants reporting greater discrimination, which has not been examined in previous studies.
There have been two prior reports of the associations of perceived discrimination and all-cause mortality, with disparate results. In AA women enrolled in the Black Women’s Health Study, no association between perceived experiences of racism and all-cause mortality was found.22 By contrast, perceived discrimination was associated with a modest, albeit statistically significant (HR 1.05 per 1 point increase in discrimination scale, 95% CI 1.01–1.09), increased risk of all-cause mortality in older adults participating in the Chicago Health and Aging Project23. Our study adds to these prior studies by including AA of both sexes, spanning the adult age spectrum and analyzing multiple measures of discrimination. While participants reporting less discrimination more often died in follow-up, this was mostly accounted for by differences in demographics. In the JHS, the more highly educated, younger AA who are most likely to report experiencing discrimination also have the lowest risk of all-cause mortality due to their demographic and behavioral characteristics. Even after adjustment for demographics, comorbidities, socioeconomic factors, and social support, there was still a slightly lower risk of all-cause mortality in participants with greater perceived discrimination, which was an unexpected finding. However, we found that perceived stress partially mediated this association, and may lie on the causal pathway between perceived discrimination and mortality in AAs. This finding is worthy of analysis in future studies.
There are several potential reasons why perceived discrimination may not be associated with risk of CV events in AA. First, while discrimination has been associated with a higher prevalence of some CV risk factors, such as hypertension7 and tobacco use20,24, it has also been linked with CV-protective behaviors such as physical activity.9 Second, data on the associations of perceived discrimination and subclinical CVD have had mixed results, with one study demonstrating a positive association with coronary artery calcium25 and another finding no relationship between discrimination and either coronary artery calcification or aortic wall thickness19. Third, in the JHS, younger AA report greater levels of discrimination, but also have more ideal health behaviors (diet, physical activity26), inflammatory biomarkers (C reactive protein27) and clinical risk factors (blood pressure, diabetes) than older participants which may counteract potential negative effects of discrimination on CV outcomes. In other words, the manner by which younger AA in the JHS cope with stressors (such as discrimination) via physical exercise may contribute to the lack of effect of discrimination on CV outcomes we observed. Clearly, more analysis is warranted to further explore the stress-response, behavioral28, inflammatory, and risk-factor pathway between exposure to discrimination and manifestation of CV outcomes in AA. Fourth, perhaps the examination of perceived discrimination in a population that perceives high levels of discrimination (>65%) may demonstrate a potential ‘ceiling’ effect of discrimination on CV outcomes. Alternatively, discrimination measures that capture one event in one’s lifetime, or that assess everyday experiences of unfair treatment over the last week or month may not capture the intended effect this type of stressor may have on CV events which develop sub-clinically over a greater period of time than when a person is exposed to discrimination. Therefore, a more precise method to capture the complex causal chain between exposure to discrimination and CV outcomes may be to examine the chronicity (or average change over time) of discrimination and its association with CV outcomes. The chronicity of discrimination likely captures the ongoing effect of interpersonal discrimination which may impact the risk of CV events or all-cause mortality. Targeted approaches to reduce the harmful effects of chronic discrimination (i.e., stress-reduction, mind-body, yoga interventions) may help to mitigate the deleterious consequences of this type of exposure.
Limitations
There are limitations to acknowledge to aid in interpretation of these data. First, this was a retrospective analysis from AA in the Jackson, Mississippi metropolitan area, a community with a very high concentration of AA, and findings may differ in other AA populations. While we adjusted for numerous potential confounders, residual confounding from unmeasured factors may still exist. As perceived discrimination may change over time, the associations of serial measures of discrimination with CV outcomes would be of interest to examine in future studies.
Strengths
There are also several important strengths. The JHS is the largest study of CVD in AA and participants are well characterized in psychosocial measures, which enabled us to examine multiple dimensions of discrimination and key socioeconomic factors. The JHS also has longitudinal surveillance for outcomes, thus enabling us to examine the associations of discrimination and CV outcomes after adjustment for a rich set of potential confounders. CV outcomes were adjudicated by an expert panel, which provides a rigorous assessment of discrimination and clinically relevant CV outcomes.
Clinical Implications
These data, interpreted in the context of prior studies, support that perceived discrimination may be associated with the development of near-term CV risk factors such as hypertension, but is not a strong factor in the long-term development of incident CV events or all-cause mortality in AAs. The examination of potentially modifiable factors (e.g. behavioral, psychosocial, and clinical) that comprise the causal pathways of these associations is paramount to identifying ways to treat individuals at the highest risk of discrimination to optimize outcomes. Perhaps an examination of institutional forms of discrimination, which affect various socioeconomic factors and life chances of at-risk groups, may have a greater effect on CV outcomes than interpersonal discrimination.7,29
CONCLUSION
In the JHS, after adjustment for differences in clinical and socioeconomic factors, we found no association between perceived everyday or lifetime discrimination and risk of CV events. An unexpected lower risk of all-cause mortality in those with greater perceived everyday discrimination was observed, and was partially mediated by perceived stress. These findings suggest that, in an AA community with high levels of perceived discrimination, discrimination does not have significant independent adverse effects on long-term CV outcomes. Further work is needed to understand the mechanistic pathway underlying how discrimination may impact the development of near-term CV risk factors, but not result in worse long-term outcomes.
Supplementary Material
Acknowledgments
Funding sources. The Jackson Heart Study is supported by contracts HHSN268201300046C, HHSN268201300047C, HHSN268201300048C, HHSN268201300049C, HHSN268201300050C from the National Heart, Lung, and Blood Institute (NHLBI) and the National Institute on Minority Health and Health Disparities (NIMHD). This work was also supported by from the National Heart, Lung, And Blood Institute at the National Institutes of Health (Grant R01HL117305 and Grant K23 HL116643 to S.M.D.).
ABBREVIATIONS
- AA
African Americans
- CHD
coronary heart disease
- CI
confidence interval
- CV
cardiovascular
- CVD
cardiovascular disease
- HF
heart failure
- HR
hazard ratio
- ICD-9
International Classification of Diseases, 9th Revision
- JHS
Jackson Heart Study
Footnotes
Disclosures: ECO receives research support from Janssen, Bristol-Myers Squibb, GlaxoSmithKline, and Pfizer. RJM receives research support from Amgen, AstraZeneca, Bristol-Myers Squibb, GlaxoSmithKline, Gilead, Medtronic, Novartis, Otsuka, and ResMed; honoraria from HeartWare, Janssen, Luitpold Pharmaceuticals, Novartis, ResMed, and Thoratec/St Jude; and has served on an advisory board for Luitpold Pharmaceuticals, Inc. The remaining authors have no disclosures.
Publisher's Disclaimer: This is a PDF file of an unedited manuscript that has been accepted for publication. As a service to our customers we are providing this early version of the manuscript. The manuscript will undergo copyediting, typesetting, and review of the resulting proof before it is published in its final citable form. Please note that during the production process errors may be discovered which could affect the content, and all legal disclaimers that apply to the journal pertain.
References
- 1.Heckler MM. Report of the Secretary's Task Force on Black and Minority Health. Washington, D.C: US Department of Health and Human Services; 1985. [Google Scholar]
- 2.Hertz RP, Unger AN, Cornell JA, Saunders E. Racial disparities in hypertension prevalence, awareness, and management. Arch Intern Med. 2005;165(18):2098–2104. doi: 10.1001/archinte.165.18.2098. [DOI] [PubMed] [Google Scholar]
- 3.Cutler JA, Sorlie PD, Wolz M, Thom T, Fields LE, Roccella EJ. Trends in hypertension prevalence, awareness, treatment, and control rates in United States adults between 1988–1994 and 1999–2004. Hypertension. 2008;52(5):818–827. doi: 10.1161/HYPERTENSIONAHA.108.113357. [DOI] [PubMed] [Google Scholar]
- 4.Ogden CL, Carroll MD, Kit BK, Flegal KM. Prevalence of childhood and adult obesity in the United States, 2011–2012. JAMA. 2014;311(8):806–814. doi: 10.1001/jama.2014.732. [DOI] [PMC free article] [PubMed] [Google Scholar]
- 5.Bahrami H, Kronmal R, Bluemke DA, et al. Differences in the incidence of congestive heart failure by ethnicity: the multi-ethnic study of atherosclerosis. Arch Intern Med. 2008;168(19):2138–2145. doi: 10.1001/archinte.168.19.2138. [DOI] [PMC free article] [PubMed] [Google Scholar]
- 6.Sangaralingham LR, Shah ND, Yao X, Roger VL, Dunlay SM. Incidence and Early Outcomes of Heart Failure in Commercially Insured and Medicare Advantage Patients, 2006–2014. Circ Cardiovasc Qual Outcomes. 2016;9(3):332–337. doi: 10.1161/CIRCOUTCOMES.116.002653. [DOI] [PMC free article] [PubMed] [Google Scholar]
- 7.Sims M, Diez-Roux AV, Dudley A, et al. Perceived discrimination and hypertension among African Americans in the Jackson Heart Study. Am J Public Health. 2012;102(Suppl 2):S258–265. doi: 10.2105/AJPH.2011.300523. [DOI] [PMC free article] [PubMed] [Google Scholar]
- 8.Everson-Rose SA, Lutsey PL, Roetker NS, et al. Perceived Discrimination and Incident Cardiovascular Events: The Multi-Ethnic Study of Atherosclerosis. Am J Epidemiol. 2015;182(3):225–234. doi: 10.1093/aje/kwv035. [DOI] [PMC free article] [PubMed] [Google Scholar]
- 9.Borrell LN, Kiefe CI, Diez-Roux AV, Williams DR, Gordon-Larsen P. Racial discrimination, racial/ethnic segregation, and health behaviors in the CARDIA study. Ethn Health. 2013;18(3):227–243. doi: 10.1080/13557858.2012.713092. [DOI] [PMC free article] [PubMed] [Google Scholar]
- 10.The Atherosclerosis Risk in Communities (ARIC) Study: design and objectives. The ARIC investigators. Am J Epidemiol. 1989;129(4):687–702. [PubMed] [Google Scholar]
- 11.Fuqua SR, Wyatt SB, Andrew ME, et al. Recruiting African-American research participation in the Jackson Heart Study: methods, response rates, and sample description. Ethn Dis. 2005;15(4 Suppl 6):S6-18-29. [PubMed] [Google Scholar]
- 12.Payne TJ, Wyatt SB, Mosley TH, et al. Sociocultural methods in the Jackson Heart Study: conceptual and descriptive overview. Ethn Dis. 2005;15(4 Suppl 6):S6-38-48. [PubMed] [Google Scholar]
- 13.Taylor HA, Jr, Wilson JG, Jones DW, et al. Toward resolution of cardiovascular health disparities in African Americans: design and methods of the Jackson Heart Study. Ethn Dis. 2005;15(4 Suppl 6):S6-4-17. [PubMed] [Google Scholar]
- 14.Sims M, Wyatt SB, Gutierrez ML, Taylor HA, Williams DR. Development and psychometric testing of a multidimensional instrument of perceived discrimination among African Americans in the Jackson Heart Study. Ethn Dis. 2009;19(1):56–64. [PMC free article] [PubMed] [Google Scholar]
- 15.Keku E, Rosamond W, Taylor HA, Jr, et al. Cardiovascular disease event classification in the Jackson Heart Study: methods and procedures. Ethn Dis. 2005;15(4 Suppl 6):S6-62-70. [PubMed] [Google Scholar]
- 16.Baron RM, Kenny DA. The moderate-mediator variable distinction in social psychological research: conceptural, strategic, and statistical considerations. J Personal Soc Pyschol. 1986;51(6):1173–1182. doi: 10.1037//0022-3514.51.6.1173. [DOI] [PubMed] [Google Scholar]
- 17.Harrell FE. Regression Modeling Strategies with Application to Linear Models, Logistic Regression, and Survival Analysis. New York, NY: Springer New York; 2001. [Google Scholar]
- 18.Krumholz HM, Wang Y, Mattera JA, et al. An administrative claims model suitable for profiling hospital performance based on 30-day mortality rates among patients with an acute myocardial infarction. Circulation. 2006;113(13):1683–1692. doi: 10.1161/CIRCULATIONAHA.105.611186. [DOI] [PubMed] [Google Scholar]
- 19.Albert MA, Ravenell J, Glynn RJ, Khera A, Halevy N, de Lemos JA. Cardiovascular risk indicators and perceived race/ethnic discrimination in the Dallas Heart Study. Am Heart J. 2008;156(6):1103–1109. doi: 10.1016/j.ahj.2008.07.027. [DOI] [PubMed] [Google Scholar]
- 20.Borrell LN, Jacobs DR, Jr, Williams DR, Pletcher MJ, Houston TK, Kiefe CI. Self-reported racial discrimination and substance use in the Coronary Artery Risk Development in Adults Study. Am J Epidemiol. 2007;166(9):1068–1079. doi: 10.1093/aje/kwm180. [DOI] [PubMed] [Google Scholar]
- 21.Dailey AB, Kasl SV, Holford TR, Lewis TT, Jones BA. Neighborhood- and individual-level socioeconomic variation in perceptions of racial discrimination. Ethn Health. 2010;15(2):145–163. doi: 10.1080/13557851003592561. [DOI] [PMC free article] [PubMed] [Google Scholar]
- 22.Albert MA, Cozier Y, Ridker PM, et al. Perceptions of race/ethnic discrimination in relation to mortality among Black women: results from the Black Women's Health Study. Arch Intern Med. 2010;170(10):896–904. doi: 10.1001/archinternmed.2010.116. [DOI] [PMC free article] [PubMed] [Google Scholar]
- 23.Barnes LL, de Leon CF, Lewis TT, Bienias JL, Wilson RS, Evans DA. Perceived discrimination and mortality in a population-based study of older adults. Am J Public Health. 2008;98(7):1241–1247. doi: 10.2105/AJPH.2007.114397. [DOI] [PMC free article] [PubMed] [Google Scholar]
- 24.Sims M, Diez-Roux AV, Gebreab SY, et al. Perceived discrimination is associated with health behaviours among African-Americans in the Jackson Heart Study. J Epidemiol Comm Health. 2016;70(2):187–194. doi: 10.1136/jech-2015-206390. [DOI] [PMC free article] [PubMed] [Google Scholar]
- 25.Cardarelli R, Cardarelli KM, Fulda KG, et al. Self-reported racial discrimination, response to unfair treatment, and coronary calcification in asymptomatic adults--the North Texas Healthy Heart study. BMC public health. 2010:10285. doi: 10.1186/1471-2458-10-285. [DOI] [PMC free article] [PubMed] [Google Scholar]
- 26.Dubbert PM, Robinson JC, Sung JH, et al. Physical activity and obesity in African Americans: the Jackson Heart Study. Ethn Dis. 2010;20(4):383–389. [PMC free article] [PubMed] [Google Scholar]
- 27.Fox ER, Benjamin EJ, Sarpong DF, et al. Epidemiology, heritability, and genetic linkage of C-reactive protein in African Americans (from the Jackson Heart Study) Am J Cardiol. 2008;102(7):835–841. doi: 10.1016/j.amjcard.2008.05.049. [DOI] [PMC free article] [PubMed] [Google Scholar]
- 28.Tomfohr LM, Pung MA, Dimsdale JE. Mediators of the relationship between race and allostatic load in African and White Americans. Health Psychol. 2016;35(4):322–332. doi: 10.1037/hea0000251. [DOI] [PubMed] [Google Scholar]
- 29.Brondolo E, Love EE, Pencille M, Schoenthaler A, Ogedegbe G. Racism and hypertension: a review of the empirical evidence and implications for clinical practice. Am J Hypertens. 2011;24(5):518–529. doi: 10.1038/ajh.2011.9. [DOI] [PubMed] [Google Scholar]
Associated Data
This section collects any data citations, data availability statements, or supplementary materials included in this article.


