Abstract
Strain evaluation is of major interest in clinical cardiology as it can quantify the cardiac function. Myocardial elastography, a radio-frequency (RF)-based cross-correlation method, has been developed to evaluate the local strain distribution in the heart in vivo. However, inhomogeneities such as RF ablation lesions or infarction require a three-dimensional approach to be measured accurately. In addition, acquisitions at high volume rate are essential to evaluate the cardiac strain in three dimensions. Conventional focused transmit schemes using 2D matrix arrays, trade off sufficient volume rate for beam density or sector size to image rapid moving structure such as the heart, which lowers accuracy and precision in the strain estimation. In this study, we developed 3D myocardial elastography at high volume rates using diverging wave transmits to evaluate the local axial strain distribution in three dimensions in three open-chest canines before and after radio-frequency ablation. Acquisitions were performed with a 2.5 MHz 2D matrix array fully programmable used to emit 2000 diverging waves at 2000 volumes/s. Incremental displacements and strains enabled the visualization of rapid events during the QRS complex along with the different phases of the cardiac cycle in entire volumes. Cumulative displacement and strain volumes depict high contrast between non-ablated and ablated myocardium at the lesion location, mapping the tissue coagulation. 3D myocardial strain elastography could thus become an important technique to measure the regional strain distribution in three dimensions in humans.
Index Terms: 3D ultrasound, Strain imaging, myocardial elastography, electromechanical wave imaging, diverging wave, cardiac imaging
I. INTRODUCTION
The non-invasive quantification of regional cardiac function is of major interest in clinical cardiology. Echocardiography is the most common modality used in the clinic as it is fast, low-cost and enables the real-time visualization of the heart. Deformation or strain of the myocardium have been extensively studied these past decades to quantify the cardiac function. It is nowadays a widely adopted technique.
It allows physicians to better understand the mechanics of the heart muscle and the contribution of abnormalities in heart disease [1]. Different approaches have been developed to assess the local strain in two-dimensional ultrasound images. Doppler techniques such as tissue Doppler imaging (TDI) perform regional strain estimation by computing the spatial gradient of the tissue velocity estimated by Color Doppler. However, Doppler-based methods are angle dependent as the strain is typically estimated along the ultrasound image line, which causes valuable information to be missed in the clinic [2]. On the other hand, radio-frequency-based cross-correlation strain estimation techniques are using the phase information of the beamformed signal to image local strain in tissues. They were first developed for quasi-static elastography [3] using an external compression and have been extended to the heart using its natural contraction and relaxation instead of an external perturbation. One such method is Myocardial Elastography [6]. It has been used to estimate the local displacement and strain of the myocardium during a cardiac cycle and showed an interest in detection and diagnosis of infarct [7], [8], graded ischemia conditions [9] and radio-frequency lesions in patients [10]. Since this method originally enabled the estimation of the axial strain, several methods have been developed to assess the lateral strain component using radio-frequency cross-correlation based techniques in phantoms [11]–[17] as well as in the heart [18]–[20].
However, the cardiac motion occurs in three dimensions and only estimating the components in two dimensional images can lead to artifacts due to the “out of plane” motion inducing elevational strain [21]. In addition, despite going beyond the scope of this initial feasibility study, the knowledge of the complete strain tensor could provide new parameters of the myocardial tissue such as principal strain anisotropy [22] for instance. More generally, three-dimensional imaging could help to reduce intra- and inter- observer variability as the acquisition becomes independent of the single cross-sectional strain map imaged by the observer. With the development of 2D matrix arrays, three-dimensional ultrasound imaging was introduced for cardiac applications [23]. Several methods have been developed to assess the local strain in three dimensions in the heart using speckle tracking techniques [24]–[28] or RF based methods [29]. However, the low frame rate remains a critical problem [30]. The frame rate of the 3-D ultrasound scanners is limited by the number of transmit beams. To reconstruct an entire volume, it requires a considerable amount of scan lines which drastically lowers the frame rate. The trade-off between the amount of scan lines while maintaining an acceptable field of view, resolution and frame rate, has to be solved in order to achieve highest accuracy in the strain estimation [29]. In addition, a high frame rate is crucial to observe rapid variations in the heart occurring during the QRS complex, associated to mechanical and electromechanical phenomena [31].
In biomedical ultrasound, imaging at high frame rates was developed for various applications [32] by using single non-focused transmit waves such as plane waves or diverging waves instead of conventional multiple focused beams. The emission of these single transmits enable to construct the image and to increase the frame rate by several orders of magnitude. Originally developed to track shear waves in biological tissues [33], high frame rate imaging has been applied to strain imaging for various applications, including cardiac strain imaging [20], electromechanical wave imaging [34], pulse wave imaging [35] or vascular strain imaging [36]. Very recently it has been applied to 3D imaging with 2D matrix array probe for cardiac Doppler imaging [37], vascular Doppler imaging [38], shear wave imaging [39] and quasi-static elastography [40]. It enabled the acquisition of entire volumes with single transmits at a high volume rate without the need to make any compromises on the lateral or elevational resolutions.
In this study, we develop for the first time 3D strain imaging in vivo at high volume rates. We used a fully programmable 2D matrix array probe to emit 2000 diverging waves at 2000 volumes/s to include an entire cardiac cycle. Incremental and cumulative displacement and strain were first assessed in three dimensions in the heart of N=3 open-chest canines. An external radio-frequency ablation was then performed on top of the heart on the anterior wall. Acquisitions were repeated at the ablated tissue location and incremental, cumulative displacement and strain were evaluated in three dimensions during an entire cardiac cycle on top of the lesion to highlight the tissue change.
II. METHODS
A. Ultrasound system
A fully programmable ultrasound system with 256 fully programmable channels in emission and receive (Vantage, Verasonics, Kirkland, USA) was used to control a 2.5MHz ultrasonic 2D matrix array probe of 256 square elements (16×16 elements), with an inter-element spacing of 0.95mm and a bandwith of 50% (Sonic Concepts, Bothell, USA). The volume delay-and-sum beamforming and the axial strain distribution calculations were performed on a Tesla K40 GPU (Nvidia, Santa Clara, USA). 3D rendering was computed with Amira software (Visualization Sciences Group, Burlington, USA).
B. Experimental Setup
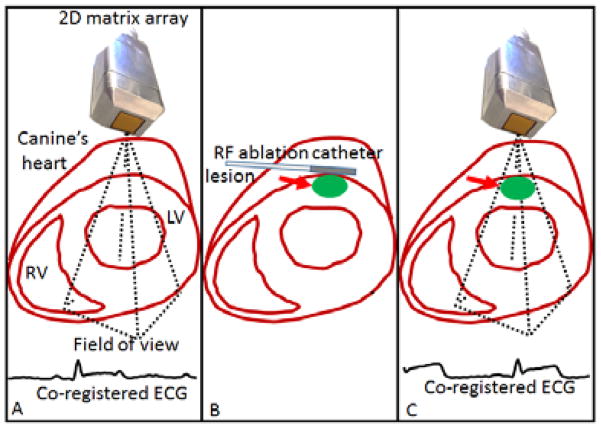
This study was conformed to the Public Health Service Policy on Humane Care and Use of Laboratory Animals and was approved by the Institutional Animal Care and Use Committee of Columbia University. Three normal male adult mongrel dogs (23–25 kg) were anesthetized with an intravenous injection of diazepam (0.5–1.0 mg/kg) and an intra-muscular injection of hydromorphone (0.05 mg/kg). Canines were ventilated with a rate- and volume-regulated ventilator on a mixture of oxygen and titrated isoflurane (0.5%–5.0%) to maintain anesthesia. To maintain blood volume, 0.9% saline solution was administered intravenously at 5 mL/kg/h. The animal was positioned supine on a heating pad. Oxygen, peripheral blood pressure, and temperature were monitored throughout the experiment. Standard limb leads were placed at the surface of the dogs for electrocardiogram (ECG) monitoring and co-registration with the acquisitions (Figure 1: A). The chest was opened by lateral thoracotomy using electrocautery. A radio-frequency ablation was performed with an intracardiac catheter (St Jude Medical, Minnesota, USA) placed externally on top of the anterior wall of the left ventricle of the dogs’ heart (Figure 1: B). The parameters for the radio-frequency ablation system was set to 60s and 20W for the duration and the power respectively, to generate cylindrical lesions of approximately 1.5–2 cm diameter.
Figure 1.
Schematic of the experiment. 2000 diverging waves were acquired at 2000 vol/s on the left ventricle (A). Radio-frequency (RF) ablation catheter was set on top of the heart at the same location to perform a lesion. 2000 diverging waves were acquired on the left ventricle at the lesion location (C).
C. Ultrasound acquisitions
Acquisitions were performed with the 2D matrix array probe positioned at a distance of 5±5mm on top of the anterior wall of the left ventricle of the open-chest canines. The contact was ensured by ultrasonic gel. 2000 diverging waves were emitted at 2000 volumes/s before (Figure 1: A) and after (Figure 1: C) radio-frequency ablation at the lesion location. For each diverging wave, radio-frequency signals of each element were recorded at a sampling rate of 10 MHz and stored in memory. The diverging waves were generated from a virtual source positioned behind the probe as it is described in [37] at a distance of 2.6 mm to create a 40° angular aperture. All the elements were used in transmit.
D. Image formation and 3D displacement and strain calculation
From radio-frequency acquired signals, a conventional three-dimensional delay-and-sum algorithm was used to beamform one 3D volume from each diverging wave acquisition, resulting in a total of 2000 volumes. The reconstructed depth was set to 50–70 mm with an axial sampling of 61.6 μm corresponding to a λ/10 beamforming (where λ is the ultrasonic wavelength). The lateral distances were defined in terms of sector angles as typically done in 2D imaging of the heart. The sector angles were set at 40° and the number of reconstructed lines were set to 80 lines corresponding to a sampling of one line per 0.5° in both directions. 3D B-mode volumes were normalized and displayed using a Hilbert transform in decibels. A custom-made Matlab function was built to perform the scan conversion in 3D. This function computed remapping of a series of scan lines in spherical coordinates to a conventional ultrasound image, in Cartesian coordinates, suitable for display. Remapping was performed on a pixel grid of 256×256×256 pixels using linear interpolation via the Matlab function interp3.
4D masks based on manual segmentation of 3D B-mode volumes over time were applied on the data to display only the tissue inside the heart wall, to remove the surrounding tissue and the signal from the cavity. An example of a 3D mask associated to a 3D B-mode is showed on Figure 2: A and B. A cine-loop is provided to visualize the temporal variations of the 3D mask.
Figure 2.
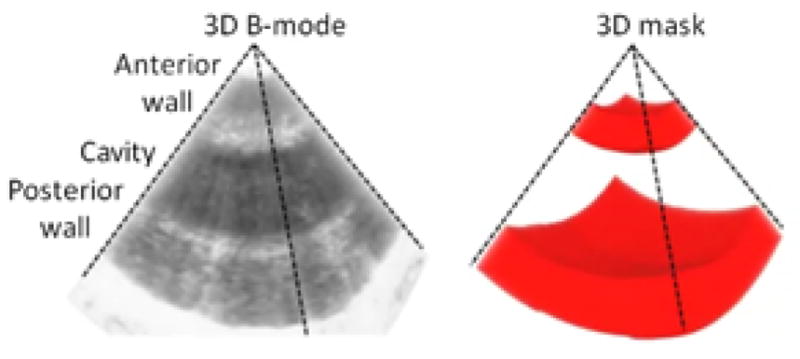
Schematic representation of the 3D mask generation based on 3D B-mode.
The 3D axial incremental displacements between two consecutive volumes were estimated by normalized 1D cross-correlation [41] of the RF beamformed signals with a window size of 1.2 mm (corresponding to a 2λ window size and a 95% overlap). The 3D incremental axial strain was computed by applying a least-squares estimator [42] with a kernel of 350 μm. 3D incremental axial displacement and strain were then scan-converted. A 3D median filter with a pixel kernel of 10×10×10pixels (1.5×1.5×2.3mm) was applied and displayed using Amira software. The central line of the displacement and strain volumes were used to display displacement and strain M-modes. To calculate the 3D cumulative displacement over the systolic and diastolic phases, the non-scan-converted 3D incremental axial displacement was integrated over systole and diastole respectively, according to the co-registered ECG. The 3D cumulative displacements were then scan-converted, filtered with the same 3D median filter and multiplied to the corresponding logical mask. 3D cumulative axial strain over the systolic and diastolic phases were computed from 3D cumulative displacement by applying the same least-squares estimator than for the incremental strain calculation. Scan conversion and 3D median filtering were applied, and the final 3D axial strain volume was displayed using Amira software. The values of cumulative displacement and strain before and after ablation on the anterior and posterior walls in three canines were averaged in a cubic region of interest positioned at the center of the walls with a size of 80×80×20 pixels (1.2×1.2×0.5cm)
III. RESULTS
A. Before radio-frequency ablation
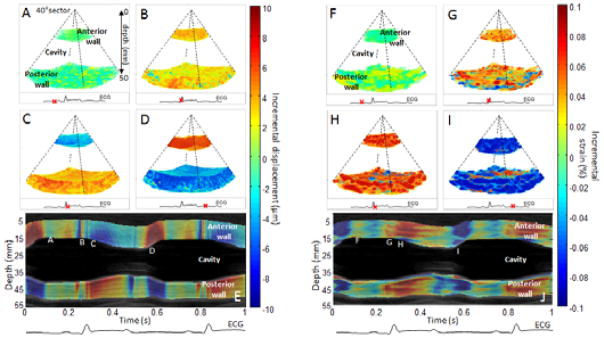
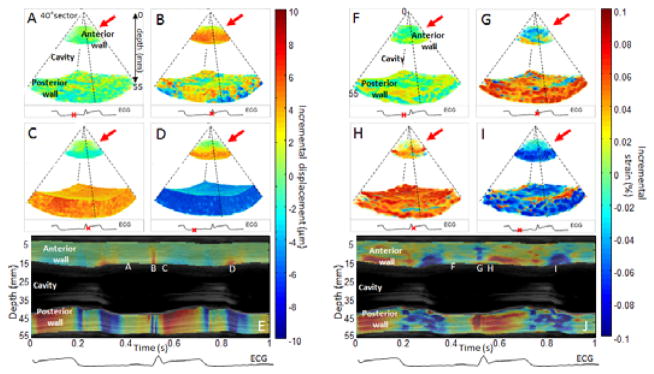
The incremental displacement and incremental strain images were first obtained before ablation in three dimensions. During mid-diastole, the heart walls (anterior and posterior walls) were found not to substantially move (Figure 3: A) and the average strain appear to be zero indicated that the heart was in the diastasis phase (Figure 3: F). During the QRS complex, fast perturbations associated with mechanical and electromechanical phenomena were observed both in the displacement and the strain (Figure 3: A F and Cine-loop attached). Then, the systolic phase could be observed in the displacement as the two walls moved towards each other in order to eject the blood from the cavity (Figure 3: C). Indeed, the red color (positive displacement) means a motion towards the transducer whereas the blue color (negative displacement) means a motion away from the transducer. The systolic phase was also defined by the contraction of the myocardium which was observed on the incremental strains (Figure 3: H) as both walls contracted (red color/positive strain). Finally, the diastolic phase was also highlighted. On the displacement (Figure 3: D), the two walls were found to move outward (upward for the anterior (red)/downward for the posterior wall (blue)). On the strain, the blue color indicated relaxation of both walls (Figure 3: I). Two cine-loops associated with the 3D representation of incremental displacements and strains were attached to Fig. 3. The displacement and strain M-modes (Figure 3: E and J respectively) displayed the temporal variation over the central line of the volumes and confirmed the results found.
Figure 3.
Incremental displacements and incremental strains of a portion of the left ventricle of the heart of an open-chest canine. Incremental displacements and incremental strains are presented in three dimensions at four moments of the cardiac cycles: during mid-diastole (A,F), during the QRS (B,G), during early systole (C,H) and during early diastole (D,I). Overlaid on the Motion-mode (M-mode), displacement and strain M-modes of the central line of the volumes were displayed (I,J) with the co-registered ECG. Letters along the wall correspond to the phases as displayed above. Positive displacement (red color) indicates a motion towards the transducer whereas negative displacement (blue color) indicates motion away from the transducer. Positive strain (red color) indicates thickening whereas negative strain (blue color) indicates thinning.
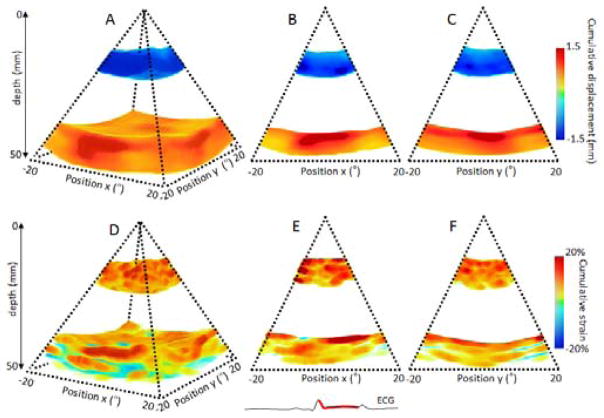
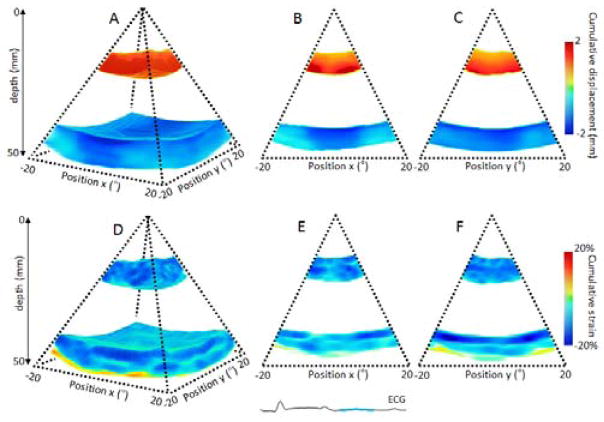
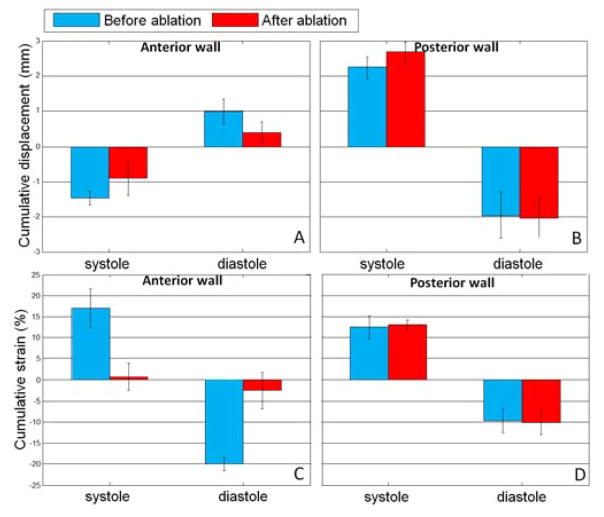
Incremental displacements were integrated during systole and disatole based on the ECG. The volume of cumulative displacement and its two associated 2D frames were displayed for systole on Figure 4: A, B and C respectively and for diastole on Figure 5: A, B and C. The results were consistent with the ones found with the incremental strains. The blue color on the anterior wall and the red color on the posterior wall indicated that the two walls moved inwards each other during systole and outwards each other during diastole. The strain values on the anterior and posterior walls were averaged in the region of interest for the three dogs (Figure 9:). The associated cumulative strains and 2D frames were displayed on Figure 4: D, E and F, for systole and Figure 5: D, E and F for diastole. Similarly, the results were consistent as we found positive strain indicated a contraction (thickening) and negative strain indicated the relaxation (thinning).
Figure 4.
Cumulative displacement and cumulative strain over the systolic phase of a portion of the left ventricle of an open-chest canine. Cumulative displacement and cumulative strain are displayed in three dimensions (A,D) respectively, and in two dimensions as the middle slices of the three dimension volumes (B,C) and (E,F) respectively.
Figure 5.
Cumulative displacement and cumulative strain over the diastolic phase of a portion of the left ventricle of an open-chest dog. Cumulative displacement and cumulative strain are displayed in three dimensions (A,D), respectively, and in two dimensions as the middle slices of the three dimension volumes (B,C) and (E,F).
Figure 9.
Cumulative displacement average with associated standard deviation and cumulative strain average with associated standard deviation in the anterior (A, C) and posterior walls (B, D) over the systolic and diastolic phases before (blue color) and after (red color) RF ablation for the N=3 dogs.
B. After radio-frequency ablation
The study was then performed after a radio-frequency ablation on the anterior wall at the same location of the first acquisition. First, incremental displacements and strains were studied. The results are displayed in Figure 6:. The red arrows indicated the lesion location. During diastasis, no significant changes could be observed on the displacement (Figure 6: A) or the strain (Figure 6: F) However, during the systolic phase the anterior wall displayed a displacement (Figure 6: C) and strain (Figure 6: H) that tend to zero whereas the posterior wall displayed a normal behavior. The ablated tissue was thus found to become passive as it was unable to move or contract anymore. This result was confirmed during the diastolic phase has the anterior wall exhibited displacement and strain that also tend to zero (Figure 6: D and I respectively) in opposition to the posterior wall. Two cine-loops associated to the 3D representation of incremental displacements and strains were attached to Figure 6:. The displacement and strain temporal variations were highlighted by the M-modes (Figure 6: E and J) which confirmed change of the ablated tissue.
Figure 6.
Incremental displacements and incremental strains of a portion of the left ventricle of an open-chest canine after performing radio-frequency ablation on the anterior wall of the heart. The lesion location is indicated by the red arrow. Incremental displacements and incremental strains are presented in three dimensions at four moments of the cardiac cycles: during mid-diastole (A,F), during the QRS (B,G), during early systole (C,H) and during early diastole (D,I). Overlaid on the traditional motion mode (M-mode), displacement and strain M-modes of the central line of the volumes are displayed (I,J) with the co-registered ECG. Letters along the wall correspond to the different phases displayed above. Positive displacement (red color) indicates a motion towards the transducer whereas negative displacement (blue color) indicates a motion away from the transducer. Positive strain (red color) indicates a thickening whereas negative strain (blue color) indicates a thinning from the transducer.
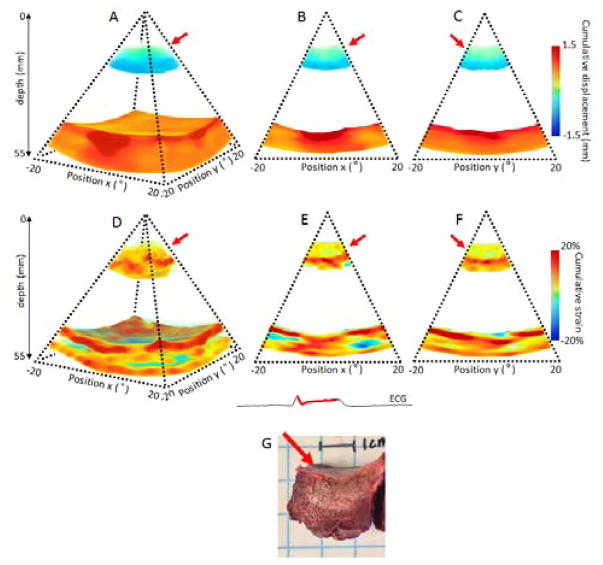
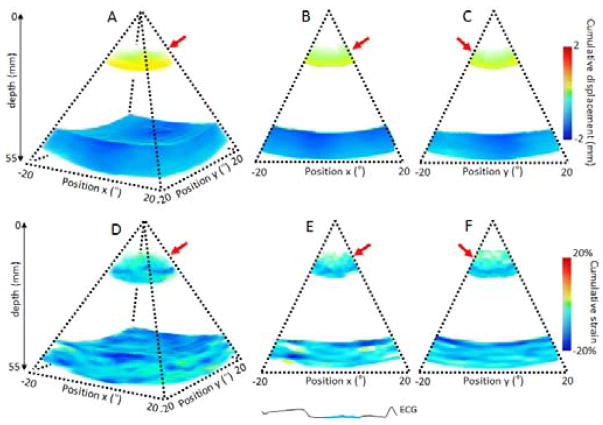
After ablation, while the posterior wall displayed the same pattern and magnitude as before the ablation. The anterior wall however, exhibited decrease of absolute displacement at the lesion location. This decrease was depicted during systole in Figure 7: in three (Figure 7: A) and two dimensions (Figure 7: B C) and during diastole (Figure 8: A B C). The cumulative strains were also found to be close to zero at the lesion location, during systole (Figure 7: D, E, F) and diastole (Figure 8: E and F) after radio-frequency ablation. Depth of the lesion on the strain map was in good quantitative agreement with gross pathology of the lesion.
Figure 7.
Cumulative displacement and cumulative strain over the systolic phase of a portion of the left ventricle of an open-chest dog after performing RF ablation on the anterior wall of the heart. Cumulative displacement and cumulative strain are displayed in three dimensions (A,D), respectively, and in two dimensions as the middle slices of the three dimension volumes (B,C) and (E,F). Gross pathology of the lesion is shown (G). The lesion location is indicated by the red arrow.
Figure 8.
Cumulative displacement and cumulative strain over the diastolic phase of a portion of the left ventricle of an open-chest dog after performing RF ablation on the anterior wall of the heart. Cumulative displacement and cumulative strain are displayed in three dimensions (A,D), respectively, and in two dimensions as the middle slices of the three dimension volumes (B,C) and (E,F). The lesion location is indicated by the red arrow.
The results found for cumulative displacement and strain over diastole and systole before and after ablation for the three dogs are summarized in Figure 9: A substantial decrease in both the absolute strain and displacement were found after ablation during systole and diastole (Figure 9: A, C). However, no significant change was measured on the posterior walls (Figure 9: B, D).
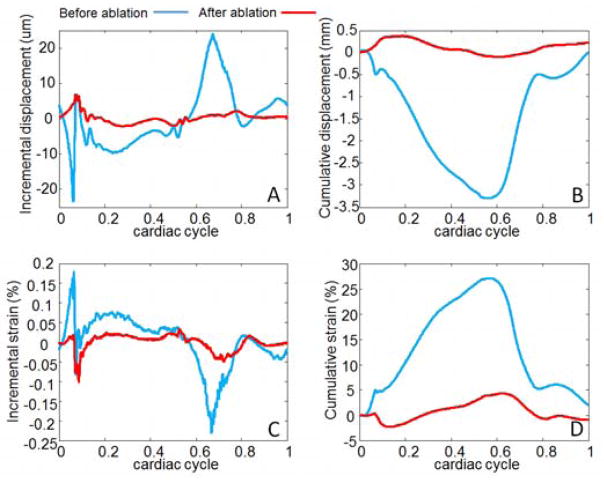
From the same data, incremental and cumulative displacement plots (A,B) as well as incremental and cumulative strain plots (C,D) can be assessed at each point of the volume (Figure 10:).
Figure 10.
Incremental displacements (A), cumulative displacements (B), incremental strains (C) and cumulative strains (D) at one point of the anterior wall before (blue color) and after ablation (red color).
IV. DISCUSSION
In this study, we demonstrated the feasibility of imaging the heart in vivo at very high volume rate to assess tissue displacement and strain of the myocardium before and after a radio-frequency ablation lesion.
2000 diverging waves were emitted at 2000 volumes/s to cover an entire cardiac cycle at high volume rate. A 2D matrix array probe with 16×16 elements fully programmable placed directly on top of the heart of N=3 open-chest canines, was used for this study. With the acquired data, we could reconstruct conventional three dimensional B-modes for each transmit. M-modes and 3D B-modes were used to generate masks in order to display only the results corresponding to the anterior and posterior walls of the myocardium. Incremental displacements and incremental strains were successfully assessed in each voxel of the volumes using a radio-frequency cross-correlation technique. Different phases of the cardiac cycle were identified including the diastolic and systolic phases. Such a high volume rate also enabled the visualization in three dimensions of fast phenomena propagation during the QRS complex. Such phenomena associated to mechanical and electromechanical activities have been visualized in one or two dimensions in numerous studies [31], [43], [44]. In this study, they were observed in three dimensions for the first time. From the incremental displacement volumes, cumulative displacement and cumulative strain volumes were computed during the diastolic and the systolic phases. On average, −20.0%±1.5% thinning during diastole and 17.0%±4.6% thickening during systole were measured, which was found to be consistent with the values found in literature [45].
In addition, an external radio-frequency ablation was performed with an intracardiac catheter placed directly on top of the anterior wall of the left ventricle at the location of the first acquisition. After the ablation, an identical ultrasound acquisition was performed by positioning the 2D matrix array at the lesion location. No significant differences were found in the posterior wall in terms of displacement or strain. However, strong differences were observed in the anterior wall at the lesion location during the cardiac cycle. The displacement and strain tend to zero as the necrosis tissue became stiffer.
In this study, we showed the feasibility of assessing local strain differences induced by a radio-frequency ablation in volumes with a very high volume rate.
Diverging wave emission alleviated the main limitation of three-dimensional cardiac strain applications as it enabled to increase the volume rate by two orders of magnitude without trade-off on sector size or beam density. Such a high volume rate would enable to track the mechanical waves linked to the electrical activation of the heart during the QRS complex to perform electromechanical wave imaging [46] in three dimensions. Another advantage of the technique, is the possibility to assess tissue motion at high temporal resolution in each voxel of the volume.
Limitations include the small sector view achieved in this study. The angular aperture of the diverging beam was limited to approximately 40–50° due to probe design because the size of the elements was too large compared to the wavelength of the probe. To be able to steer the beam and emit diverging waves with large angular aperture view, the elements size should be half of the wavelength. In our case, the size of the elements (950μm) was about 1.5 times the wavelength (616μm), as a consequence: no energy was transmitted for an angle superior to 40–50°. With a more appropriate transducer, the entire heart could have been imaged with a large angular aperture in three dimensions using diverging waves as it is shown in [37].
The lateral size of the lesions could not be measured because of the narrow field view. However, the axial depth of the lesion seemed to be in a good agreement with the gross pathology. Further work will focus on the size correlation between the strain and the histology measurements (Fig. 7G).
Another limitation is the fact that we could not guarantee that the imaged location of the heart before and after ablation would be exactly the same because the transducer had to be removed after the first acquisition and placed back on after ablation. However, a trained expert used the real-time B-mode and M-mode to reposition the probe the closest from the first acquisition. During the processing, the M-mode of the posterior wall was used as a landmark to verify the position between the two acquisitions. To be more precise, the radio-frequency catheter could be positioned directly inside the left ventricle to perform intracardiac ablation while the 2D matrix array would be left at the same location on top of the anterior wall.
The other major limitation is the relatively poor image quality compared to focused transmit scheme that can be an issue to perform “speckle tracking” for instance, as it needs good image quality. Coherent compounding techniques could be used to increase the resolution and contrast of the image [37], [47] which could also be coupled to harmonic emissions [48]. However, in radio-frequency based cross-correlation or tissue Doppler techniques, the quality of the B-mode image may not be as critical to accurately assess the tissue displacement and strain. Indeed, few studies reported very low contrast in the heart imaged with a single transmit, but still very high displacement and strain estimations [34]. The strain estimation quality from focused transmits compared to single transmission was also studied in terms of expected SNR in [20] where very similar results were found. Finally, in this study, only the axial component of displacement and strain was estimated and imaged. The entire strain tensor could be evaluated from the data collected which constitutes an ongoing work by our group.
V. CONCLUSION
In this study, the feasibility of imaging the heart with a 2D matrix array probe at high volume rate (2000 volumes/s) using diverging emissions to assess incremental displacements and strains throughout the entire cardiac cycle in entire three dimensional volumes in three open-chest canines was demonstrated. We were able to visualize rapid events due to the electromechanical activation propagating during the QRS complex as well as the different phases of the myocardial strain during the entire cardiac cycle. Cumulative displacements and strains were quantified before and after a radio-frequency ablation in the anterior wall of the myocardium. Strong differences were measured at the lesion location highlighting the necrosis of the tissue after ablation. The 3D myocardial strain elastography method could become of major interest in the clinic to measure the local strain distribution in three dimensions in patients and obtain ablation volumes in real-time.
Acknowledgments
Research reported in this publication was supported by National Institutes of Health (NIH) grants R01-EB006042 and R01-HL114358. Clement Papadacci was also supported by the Bettencourt Schueller Foundation.
Contributor Information
Clement Papadacci, Department of Biomedical Engineering, Columbia University, New York, NY 10027 USA.
Ethan A. Bunting, Department of Biomedical Engineering, Columbia University, New York, NY 10027 USA
Elaine Y. Wan, Department of Medicine, Division of Cardiology, Columbia University, New York, NY 10027 USA
Pierre Nauleau, Department of Biomedical Engineering, Columbia University, New York, NY 10027 USA.
Elisa E. Konofagou, Department of Biomedical Engineering, Columbia University, New York, NY 10027 USA
Bibliography
- 1.Cottrell C, Kirkpatrick JN. Echocardiographic strain imaging and its use in the clinical setting. Expert Rev Cardiovasc Ther. 2010 Jan;8(1):93–102. doi: 10.1586/erc.09.165. [DOI] [PubMed] [Google Scholar]
- 2.D’hooge J, Bijnens B, Thoen J, de Werf FV, Sutherland GR, Suetens P. Echocardiographic strain and strain-rate imaging: a new tool to study regional myocardial function. IEEE Trans Med Imaging. 2002 Sep;21(9):1022–1030. doi: 10.1109/TMI.2002.804440. [DOI] [PubMed] [Google Scholar]
- 3.Ophir J, Céspedes I, Ponnekanti H, Yazdi Y, Li X. Elastography: A Quantitative Method for Imaging the Elasticity of Biological Tissues. Ultrason Imaging. 1991 Apr;13(2):111–134. doi: 10.1177/016173469101300201. [DOI] [PubMed] [Google Scholar]
- 4.D’hooge J, Heimdal A, Jamal F, Kukulski T, Bijnens B, Rademakers F, Hatle L, Suetens P, Sutherland GR. Regional Strain and Strain Rate Measurements by Cardiac Ultrasound: Principles, Implementation and Limitations. Eur J Echocardiogr. 2000 Sep;1(3):154–170. doi: 10.1053/euje.2000.0031. [DOI] [PubMed] [Google Scholar]
- 5.Sutherland GR, Di Salvo G, Claus P, D’hooge J, Bijnens B. Strain and strain rate imaging: a new clinical approach to quantifying regional myocardial function. J Am Soc Echocardiogr Off Publ Am Soc Echocardiogr. 2004 Jul;17(7):788–802. doi: 10.1016/j.echo.2004.03.027. [DOI] [PubMed] [Google Scholar]
- 6.Konofagou EE, D’hooge J, Ophir J. Myocardial elastography--a feasibility study in vivo. Ultrasound Med Biol. 2002 Apr;28(4):475–482. doi: 10.1016/s0301-5629(02)00488-x. [DOI] [PubMed] [Google Scholar]
- 7.Konofagou EE, Harrigan T, Solomon S. Assessment of regional myocardial strain using cardiac elastography: distinguishing infarcted from non-infarcted myocardium. 2001 IEEE Ultrasonics Symposium; 2001; pp. 1589–1592. [Google Scholar]
- 8.Luo J, Fujikura K, Homma S, Konofagou EE. Myocardial elastography at both high temporal and spatial resolution for the detection of infarcts. Ultrasound Med Biol. 2007 Aug;33(8):1206–1223. doi: 10.1016/j.ultrasmedbio.2007.01.019. [DOI] [PubMed] [Google Scholar]
- 9.Lee WN, Provost J, Fujikura K, Wang J, Konofagou EE. In vivo study of myocardial elastography under graded ischemia conditions. Phys Med Biol. 2011 Feb;56(4):1155–1172. doi: 10.1088/0031-9155/56/4/017. [DOI] [PMC free article] [PubMed] [Google Scholar]
- 10.Grondin J, Wan E, Gambhir A, Garan H, Konofagou EE. Intracardiac Myocardial Elastography in canines and humans in vivo. IEEE Trans Ultrason Ferroelectr Freq Control. 2015 Feb;62(2):337–349. doi: 10.1109/TUFFC.2014.006784. [DOI] [PMC free article] [PubMed] [Google Scholar]
- 11.Konofagou E, Ophir J. A new elastographic method for estimation and imaging of lateral displacements, lateral strains, corrected axial strains and poisson’s ratios in tissues. Ultrasound Med Biol. 1998 Oct;24(8):1183–1199. doi: 10.1016/s0301-5629(98)00109-4. [DOI] [PubMed] [Google Scholar]
- 12.Rao M, Varghese T. Correlation analysis of three-dimensional strain imaging using ultrasound two-dimensional array transducers. J Acoust Soc Am. 2008 Sep;124(3):1858–1865. doi: 10.1121/1.2953310. [DOI] [PubMed] [Google Scholar]
- 13.Mercure E, Cloutier G, Schmitt C, Maurice RL. Performance evaluation of different implementations of the Lagrangian speckle model estimator for non-invasive vascular ultrasound elastography. Med Phys. 2008 Jul;35(7):3116–3126. doi: 10.1118/1.2936771. [DOI] [PubMed] [Google Scholar]
- 14.McCormick M, Varghese T, Wang X, Mitchell C, Kliewer MA, Dempsey RJ. Methods for robust in vivo strain estimation in the carotid artery. Phys Med Biol. 2012 Nov;57(22):7329–7353. doi: 10.1088/0031-9155/57/22/7329. [DOI] [PMC free article] [PubMed] [Google Scholar]
- 15.Idzenga T, Hansen HHG, Thijssen JM, de Korte CL. Enhancing the performance of lateral shear strain estimation by using 2-D strain imaging. IEEE Trans Ultrason Ferroelectr Freq Control. 2014 May;61(5):756–764. doi: 10.1109/TUFFC.2014.6805690. [DOI] [PubMed] [Google Scholar]
- 16.Techavipoo U, Varghese T. IMPROVEMENTS IN ELASTOGRAPHIC CONTRAST-TO-NOISE RATIO USING SPATIAL-ANGULAR COMPOUNDING. Ultrasound Med Biol. 2005 Apr;31(4):529–536. doi: 10.1016/j.ultrasmedbio.2005.01.006. [DOI] [PMC free article] [PubMed] [Google Scholar]
- 17.Lopata RGP, Nillesen MM, Hansen HHG, Gerrits IH, Thijssen JM, de Korte CL. Performance of two dimensional displacement and strain estimation techniques using a phased array transducer. Ultrasound Med Biol. 2009 Dec;35(12):2031–2041. doi: 10.1016/j.ultrasmedbio.2009.06.1101. [DOI] [PubMed] [Google Scholar]
- 18.Langeland S, D’hooge J, Leather HA, Claus P, Sutherland GR, Wouters PE, Bijnens B. A new method for two-dimensional myocardial strain estimation by ultrasound: an in-vivo comparison with sonomicrometry. 2004 IEEE Ultrasonics Symposium; 2004; pp. 486–489. [Google Scholar]
- 19.Lee WN, Qian Z, Tosti CL, Brown TR, Metaxas DN, Konofagou EE. Preliminary validation of angle-independent myocardial elastography using MR tagging in a clinical setting. Ultrasound Med Biol. 2008 Dec;34(12):1980–1997. doi: 10.1016/j.ultrasmedbio.2008.05.007. [DOI] [PMC free article] [PubMed] [Google Scholar]
- 20.Bunting EA, Provost J, Konofagou EE. Stochastic precision analysis of 2D cardiac strain estimation in vivo. Phys Med Biol. 2014;59(22):6841. doi: 10.1088/0031-9155/59/22/6841. [DOI] [PMC free article] [PubMed] [Google Scholar]
- 21.Kallel F, Ophir J. Three-dimensional tissue motion and its effect on image noise in elastography. IEEE Trans Ultrason Ferroelectr Freq Control. 1997 Nov;44(6):1286–1296. [Google Scholar]
- 22.Lee Wn, Ingrassia CM, Fung-kee-fung SD, Costa KD, Holmes JW, Konofagou EE. Theoretical Quality Assessment of Myocardial Elastography with In Vivo Validation. IEEE Trans Ultrason Ferroelectr Freq Control. 2007 Nov;54(11):2233–2245. doi: 10.1109/tuffc.2007.528. [DOI] [PubMed] [Google Scholar]
- 23.Schmidt MA, Ohazama CJ, Agyeman KO, Freidlin RZ, Jones M, Laurienzo JM, Brenneman CL, Arai AE, von Ramm OT, Panza JA. Real-time three-dimensional echocardiography for measurement of left ventricular volumes. Am J Cardiol. 1999 Dec;84(12):1434–1439. doi: 10.1016/s0002-9149(99)00591-3. [DOI] [PubMed] [Google Scholar]
- 24.Elen A, Choi HF, Loeckx D, Gao H, Claus P, Suetens P, Maes F, D’hooge J. Three-Dimensional Cardiac Strain Estimation Using Spatio #x2013;Temporal Elastic Registration of Ultrasound Images: A Feasibility Study. IEEE Trans Med Imaging. 2008 Nov;27(11):1580–1591. doi: 10.1109/TMI.2008.2004420. [DOI] [PubMed] [Google Scholar]
- 25.Papademetris X, Sinusas AJ, Dione DP, Duncan JS. Estimation of 3D left ventricular deformation from echocardiography. Med Image Anal. 2001 Mar;5(1):17–28. doi: 10.1016/s1361-8415(00)00022-0. [DOI] [PubMed] [Google Scholar]
- 26.Crosby J, Amundsen BH, Hergum T, Remme EW, Langeland S, Torp H. 3-D speckle tracking for assessment of regional left ventricular function. Ultrasound Med Biol. 2009 Mar;35(3):458–471. doi: 10.1016/j.ultrasmedbio.2008.09.011. [DOI] [PubMed] [Google Scholar]
- 27.Saito K, Okura H, Watanabe N, Hayashida A, Obase K, Imai K, Maehama T, Kawamoto T, Neishi Y, Yoshida K. Comprehensive evaluation of left ventricular strain using speckle tracking echocardiography in normal adults: comparison of three-dimensional and two-dimensional approaches. J Am Soc Echocardiogr Off Publ Am Soc Echocardiogr. 2009 Sep;22(9):1025–1030. doi: 10.1016/j.echo.2009.05.021. [DOI] [PubMed] [Google Scholar]
- 28.Chen X, Xie H, Erkamp R, Kim K, Jia C, Rubin JM, O’Donnell M. 3-D correlation-based speckle tracking. Ultrason Imaging. 2005 Jan;27(1):21–36. doi: 10.1177/016173460502700102. [DOI] [PubMed] [Google Scholar]
- 29.Lopata RGP, Nillesen MM, Thijssen JM, Kapusta L, de Korte CL. Three-dimensional cardiac strain imaging in healthy children using RF-data. Ultrasound Med Biol. 2011 Sep;37(9):1399–1408. doi: 10.1016/j.ultrasmedbio.2011.05.845. [DOI] [PubMed] [Google Scholar]
- 30.Lopata RGP, Nillesen MM, Gerrits IH, Thijssen JM, Kapusta L, de Korte CL. 10B-4 4D Cardiac Strain Imaging: Methods and Initial Results. IEEE Ultrasonics Symposium; 2007; 2007. pp. 872–875. [Google Scholar]
- 31.Pernot M, Fujikura K, Fung-Kee-Fung SD, Konofagou EE. ECG-gated, mechanical and electromechanical wave imaging of cardiovascular tissues in vivo. Ultrasound Med Biol. 2007 Jul;33(7):1075–1085. doi: 10.1016/j.ultrasmedbio.2007.02.003. [DOI] [PubMed] [Google Scholar]
- 32.Tanter M, Fink M. Ultrafast imaging in biomedical ultrasound. IEEE Trans. Ultrason. Ferroelectr. Freq. Control, in press; Jan. 2014; [DOI] [PubMed] [Google Scholar]
- 33.Bercoff J, Tanter M, Fink M. Supersonic shear imaging: a new technique for soft tissue elasticity mapping. IEEE Trans Ultrason Ferroelectr Freq Control. 2004 Apr;51(4):396–409. doi: 10.1109/tuffc.2004.1295425. [DOI] [PubMed] [Google Scholar]
- 34.Provost J, Nguyen VTH, Legrand D, Okrasinski S, Costet A, Gambhir A, Garan H, Konofagou EE. Electromechanical wave imaging for arrhythmias. Phys Med Biol. 2011 Nov;56(22):L1–11. doi: 10.1088/0031-9155/56/22/F01. [DOI] [PMC free article] [PubMed] [Google Scholar]
- 35.Li Ronny Xi. Ultrasonic Pulse Wave Imaging for in vivo Assessment of Vascular Wall Dynamics and Characterization of Arterial Pathologies. 2016 [Google Scholar]
- 36.Hansen HHG, Saris AECM, Vaka NR, Nillesen MM, de Korte CL. Ultrafast vascular strain compounding using plane wave transmission. J Biomech. 2014 Mar;47(4):815–823. doi: 10.1016/j.jbiomech.2014.01.015. [DOI] [PubMed] [Google Scholar]
- 37.Provost J, Papadacci C, Arango JE, Imbault M, Fink M, Gennisson JL, Tanter M, Pernot M. 3D ultrafast ultrasound imaging in vivo. Phys Med Biol. 2014 Oct;59(19):L1. doi: 10.1088/0031-9155/59/19/L1. [DOI] [PMC free article] [PubMed] [Google Scholar]
- 38.Provost J, Papadacci C, Demene C, Gennisson JL, Tanter M, Pernot M. 3-D ultrafast doppler imaging applied to the noninvasive mapping of blood vessels in Vivo. IEEE Trans Ultrason Ferroelectr Freq Control. 2015 Aug;62(8):1467–1472. doi: 10.1109/TUFFC.2015.007032. [DOI] [PMC free article] [PubMed] [Google Scholar]
- 39.Gennisson JL, Provost J, Deffieux T, Papadacci C, Imbault M, Pernot M, Tanter M. 4-D ultrafast shear-wave imaging. IEEE Trans Ultrason Ferroelectr Freq Control. 2015 Jun;62(6):1059–1065. doi: 10.1109/TUFFC.2014.006936. [DOI] [PubMed] [Google Scholar]
- 40.Papadacci C, Bunting E, Konofagou E. 3D quasi-static ultrasound elastography with plane wave in vivo. IEEE Trans Med Imaging. 2016;PP(99):1–1. doi: 10.1109/TMI.2016.2596706. [DOI] [PMC free article] [PubMed] [Google Scholar]
- 41.Luo J, Konofagou EE. A fast normalized cross-correlation calculation method for motion estimation. IEEE Trans Ultrason Ferroelectr Freq Control. 2010 Jun;57(6):1347–1357. doi: 10.1109/TUFFC.2010.1554. [DOI] [PMC free article] [PubMed] [Google Scholar]
- 42.Kallel F, Ophir J. A least-squares strain estimator for elastography. Ultrason Imaging. 1997 Jul;19(3):195–208. doi: 10.1177/016173469701900303. [DOI] [PubMed] [Google Scholar]
- 43.Kanai H. Propagation of spontaneously actuated pulsive vibration in human heart wall and in vivo viscoelasticity estimation. IEEE Trans Ultrason Ferroelectr Freq Control. 2005 Nov;52(11):1931–1942. doi: 10.1109/tuffc.2005.1561662. [DOI] [PubMed] [Google Scholar]
- 44.Provost J, Lee Wei-Ning, Fujikura K, Konofagou EE. Electromechanical Wave Imaging of Normal and Ischemic Hearts In Vivo. IEEE Trans Med Imaging. 2010 Mar;29(3):625–635. doi: 10.1109/TMI.2009.2030186. [DOI] [PMC free article] [PubMed] [Google Scholar]
- 45.Hurlburt HM, Aurigemma GP, Hill JC, Narayanan A, Gaasch WH, Vinch CS, Meyer TE, Tighe DA. Direct Ultrasound Measurement of Longitudinal, Circumferential, and Radial Strain Using 2-Dimensional Strain Imaging in Normal Adults. Echocardiography. 2007 Aug;24(7):723–731. doi: 10.1111/j.1540-8175.2007.00460.x. [DOI] [PubMed] [Google Scholar]
- 46.Konofagou EE, Provost J. Electromechanical wave imaging for noninvasive mapping of the 3D electrical activation sequence in canines and humans in vivo. J Biomech. 2012 Mar;45(5):856–864. doi: 10.1016/j.jbiomech.2011.11.027. [DOI] [PMC free article] [PubMed] [Google Scholar]
- 47.Papadacci C, Pernot M, Couade M, Fink M, Tanter M. High-contrast ultrafast imaging of the heart. IEEE Trans Ultrason Ferroelectr Freq Control. 2014 Feb;61(2):288–301. doi: 10.1109/TUFFC.2014.6722614. [DOI] [PMC free article] [PubMed] [Google Scholar]
- 48.Correia M, Provost J, Chatelin S, Villemain O, Tanter M, Pernot M. Ultrafast Harmonic Coherent Compound (UHCC) Imaging for High Frame Rate Echocardiography and Shear-Wave Elastography. IEEE Trans Ultrason Ferroelectr Freq Control. 2016 Mar;63(3):420–431. doi: 10.1109/TUFFC.2016.2530408. [DOI] [PMC free article] [PubMed] [Google Scholar]


