

Abstract
MicroRNAs (miRNAs) are small RNA species that regulate gene expression post‐transcriptionally and are aberrantly expressed in many malignancies including lymphoma. However, the role of miRNAs in the pathogenesis of T‐cell lymphoid malignancies is poorly understood. Previously we examined the miRNA profile of Sézary syndrome (Sz), a leukemia of skin‐homing memory T cells. In this study we determined the complete miRNome of mycosis fungoides (MF), the most common type of cutaneous T cell lymphoma. The miRNA profile of skin biopsies from 19 patients with tumor stage MF and 12 patients with benign inflammatory dermatoses (eczema and lichen planus) were compared by microarray analysis. We identified 49 miRNAs that are differentially expressed in tumor stage MF compared to benign inflammatory dermatoses using ANOVA analysis (P < 0.05, Benjamini–Hochberg corrected). The majority of the differentially expressed miRNAs (30/49) were up‐regulated in tumor stage MF. The most significant differentially expressed were miR‐155 and miR‐92a (both up‐regulated in tumor stage MF), while miR‐93 showed the highest up‐regulation in tumor stage MF with a fold difference of 5.8. Differential expression of a selection of these miRNAs was validated by miRNA‐Q‐PCR on additional test groups (tumors and controls). None of the miRNAs up‐regulated in tumor stage MF was previously shown to be up‐regulated in Sz, and only 2 of the 19 miRNAs down‐regulated in tumor stage MF were also down‐regulated in Sz. Taken together this report is the first describing the miRNA signature of tumor stage MF.
Keywords: miRNA, Microarray, CTCL, Mycosis fungoides
Highlights
We determined the miRNA expression profile of tumor stage mycosis fungoides.
Comparison with benign dermatoses identified 49 differentially expressed miRNAs.
MiRNA‐Q‐PCR confirmed array results in an independent test group.
1. Introduction
Mycosis fungoides (MF) is the most common type of cutaneous T cell lymphoma (CTCL) and is characterized clinically by an evolution of patches, plaques to tumors containing malignant skin homing T cells. Patients with limited plaque stage disease have a 10‐year survival of 97–98% but in patients with tumor stage disease the 10‐year survival decreases to 42% (Willemze et al., 2005). In previous studies tumor stage MF samples were investigated for genomic alterations, gene expression profiles, and promoter hypermethylation to unravel the molecular basis of this disease (van Doorn et al., 2009; van Doorn et al., 2005; Laharanne et al., 2010; Salgado et al., 2010).
MicroRNAs (miRNAs) are short non‐coding RNA molecules involved in crucial biological processes, including development, immune function, proliferation, apoptosis, and the stress response through negative regulation of the stability and translation of target messenger RNAs (mRNAs) (Calin and Croce, 2006a; Kent and Mendell, 2006; O'Connell et al., 2010). It is becoming increasingly clear that specific miRNAs contribute to cancer initiation and progression, and that miRNAs may have oncogenic or tumor suppressing properties depending on their target genes (Croce, 2009). Also, there is increasing evidence for a role for miRNAs in the pathogenesis of lymphoid malignancies such as lymphoma (Lawrie, 2008).
Little is known about the role of miRNAs in cutaneous lymphoma. So far our study on the miRNome of Sézary syndrome (Sz), a leukemia of skin homing T‐cells, is the only one describing miRNA expression in cutaneous lymphoma (Ballabio et al., 2010). In the current study we performed miRNA analysis on tumor stage MF to gain further insight in the molecular pathogenesis of this disease. Firstly by identifying aberrantly expressed miRNAs specific for tumor stage MF by comparing the miRNA profiles of tumor stage MF with benign inflammatory dermatoses. Secondly by correlating miRNA expression with previously described copy number alterations characteristic for tumor stage MF (Laharanne et al., 2010; Salgado et al., 2010; van Doorn et al., 2009). Finally by comparing aberrantly expressed miRNAs of tumor stage MF with aberrant expression in Sz to identify differences.
2. Materials and methods
2.1. Patient selection
Tumor stage MF patients were selected from the database of the Dutch Cutaneous Lymphoma Group (DCLG), reviewed by an expert panel of dermatologists and hematopathologists before entry into this database and classified using the criteria of the WHO‐EORTC classification for primary cutaneous lymphomas (Willemze et al., 2005). Nineteen formalin fixed paraffin embedded (FFPE) MF tumor biopsies containing more than 75% tumor cells were selected for array analysis and ten additional cases for miRNA‐Q‐PCR validation experiments. Clinical characteristics are shown in Table 1. For control material FFPE biopsies of benign inflammatory dermatosis) containing T‐cell rich infiltrates were selected for array analysis (eczema (n = 5) and lichen planus (n = 7) and miRNA‐Q‐PCR validation experiments (additional eczema (n = 5) and lichen planus (n = 6) cases). This study was performed in accordance with the Dutch code and Leiden University Medical Center guidelines on leftover material.
Table 1.
Clinical characteristics of MF patients.
| Patient | Gender | Age | Stage at diagnosis/biopsy | Current status | Follow‐up after diagnosis/biopsy (months) |
|---|---|---|---|---|---|
| Array group | |||||
| 1 | M | 66 | T2N0M0/T3N0M0 | AWD | 173/81 |
| 2 | M | 80 | T3N0M0/T3N0M0 | DOOC | 100/100 |
| 3 | M | 57 | T2N0M0/T3N0M0 | DOD | 24/16 |
| 4 | M | 54 | T3N0M0/T3N0M0 | DOD | 45/45 |
| 5 | F | 65 | T3N0M0/T3N0M0 | DOD | 56/19 |
| 6 | M | 67 | T2N0M0/T3N0M0 | DOD | 58/7 |
| 7 | M | 57 | T2N0M0/T2N0M0 | DOD | 28/28 |
| 8 | F | 49 | T2N0M0/T3N1M0 | DOD | 12/4 |
| 9 | F | 66 | T1N0M0/T3N0M0 | ACR | 139/10 |
| 10 | F | 84 | T3N0M0/T3N0M0 | DOD | 13/9 |
| 11 | M | 65 | T3N0M0/T3N0M0 | DOD | 54/7 |
| 12 | F | 61 | T2N0M0/T3N0M0 | DOD | 83/39 |
| 13 | F | 44 | T3N0M0/T3N0M0 | ACR | 11/9 |
| 14 | M | 63 | T2N0M0/T3N0M0 | AWD | 306/16 |
| 15 | M | 75 | T3N0M0/T3N0M0 | AWD | 49/49 |
| 16 | F | 87 | T2N0M0/T2N0M0 | AWD | 9/9 |
| 17 | M | 62 | T3N3M0/T3N3M0 | DOD | 22/22 |
| 18 | M | 60 | T2N3M0/T3N0M0 | AWD | 34/18 |
| 19 | F | 50 | T3N1M0/T3N1M0 | DOD | 20/20 |
| Validation group | |||||
| 1 | M | 33 | T2N0M0/T3N3M0 | DOD | 55/4 |
| 2 | M | 72 | T2N0M0/T3N0M0 | DOD | 41/13 |
| 3 | F | 50 | T2N0M0/T3N0M0 | ACR | 147/90 |
| 4 | M | 61 | T3N0M0/T3N0M0 | DOOC | 45/44 |
| 5 | M | 69 | T2N0M0/T3N0M0 | DOD | 21/14 |
| 6 | M | 74 | T2N0M0/T3N0M0 | DOD | 136/11 |
| 7 | M | 68 | T3N0M0/T3N0M0 | DOOC | 24/17 |
| 8 | M | 76 | T3N0M0/T3N0M0 | DOD | 39/39 |
| 9 | M | 80 | T2N0M0/T3N0M0 | DOOC | 87/33 |
| 10 | F | 77 | T3N0M0/T3N0M0 | AWD | 74/74 |
DOD denotes died of disease, DOOC died of other causes, ACR alive in complete remission, AWD alive with disease.
2.2. miRNA extraction
Total RNA was isolated from 6 × 20 μm sections of tumor biopsies and 8 × 20 μm sections of benign control biopsies using the Ambion total nucleic acid extraction kit according to manufacturers' protocol (Ambion, Warrington UK). To assess the (tumor) infiltrate of slides sectioned for miRNA extraction, HE and CD3 stainings were performed on slides sectioned directly before and after sections used for RNA extraction.
2.3. miRNA array analysis
Total RNA (±3 μg), were labeled and hybridized to miRNA microarrays as previously described [Ballabio et al., 2010] along with a synthetic human miRNA universal reference pool containing 454 miRNAs as a common reference. The arrays contain 655 human probes (miRBase v.10.1). Probe details can be found at www.microRNAworld.com. Image analysis was carried out by Bluefuse software (BlueGnome, Cambridge, UK). Raw fold ratio data were global loess‐normalized within arrays and quantile normalized between arrays using the LIMMA package (Smyth and Speed, 2003). The normalized log ratios (average of four replicates per probe) were used for subsequent analysis in Genespring 7.2 (Agilent Technologies, CA, US). MiRNAs were filtered prior to ANOVA analysis to remove those that had a median intensity >300 fluorescence units background in more than 50% of the arrays. ANOVA analysis was used to identify miRNAs differentially expressed between sample types and P values were adjusted using the Benjamini–Hochberg multiple testing correction method.
2.4. miRNA Q‐PCR
For miRNA cDNA synthesis, 300 ng RNA was reverse transcribed using the miRNA reverse transcription kit (Applied Biosystems) in combination with the stem‐loop Megaplex primer pool A v2.1 (Applied Biosystems), allowing simultaneous reverse transcription of 377 miRNAs and endogenous controls. miRNA‐Q‐PCR was performed using Taqman miRNA assays and 2× Universal PCR mastermix (Applied Biosystems). All reactions were run on the LightCycler480 (Roche, Almere, the Netherlands), according to manufacturer's protocol (Applied Biosystems). The cycle parameters were as follows: 10 min at 95 °C, 45 cycles denaturing for 15 s at 95 °C and annealing and extension for 60 s at 60 °C. MiRNA expression was analyzed using the Δ Ct method expressed relative to U6. Statistical analyses were performed using the Mann–Whitney independent t test in SPSS (version 17).
3. Results
Aberrantly expressed miRNAs in tumor stage mycosis fungoides are predominantly up‐regulated in comparison to benign controls
We determined the miRNA profiles from FFPE biopsies of 19 tumor stage MF patients and 12 inflammatory dermatoses (Lichen planus n = 7, Eczema n = 5) using miRNA microarrays (miRBase v.10.1). Using unsupervised clustering (Figure. 1) the majority of tumor and benign tissue samples clustered in different clusters. However, 3 samples from benign inflammatory dermatoses clustered with tumor samples. Clinical data including the extent of the lymphoid infiltrate did not correlate with the misclassification of these samples. Comparison of the miRNA expression levels in MF tumors with benign inflammatory dermatoses identified 49 differentially expressed miRNAs with an adjusted p‐value <0.05 (Table 2). The majority (30 miRNAs) were up‐regulated in tumor stage MF, and of these 30 up‐regulated miRNAs 16 have a fold change (FC) >2. Of the 19 miRNAs that are down‐regulated in tumor stage MF, 7 have an FC < −2. To validate the array results miRNA‐Q‐PCR was performed for 6 miRNAs up‐regulated in tumor stage MF (miR‐93, miR‐155, miR‐30b, miR‐16 miR‐30c and miR‐92a) and one miRNA down‐regulated in tumor stage MF (miR‐383) in an additional group of tumor stage MF (n = 10) and benign inflammatory dermatoses (eczema n = 5 and lichen planus n = 6) cases. In these experiments miRNA‐Q‐PCR results are consistent with microarray data and shown in Figure. 2. All miRNAs show a significant differential expression measured by Mann–Whitney independent t test (p < 0.05).
Figure 1.
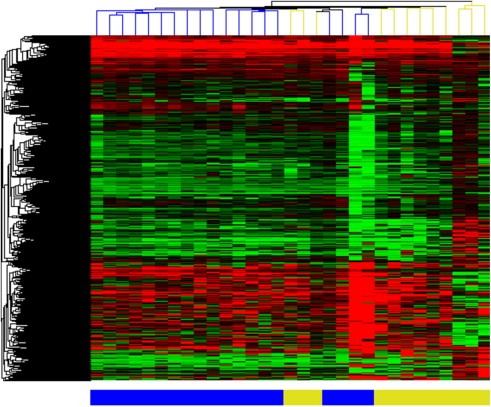
Unsupervised cluster analysis tumor stage MF and benign inflammatory dermatoses. Heatmap representing miRNA array expression data of MF tumor samples (n = 19 depicted in blue) and benign inflammatory dermatosis samples (n = 12, depicted in yellow).
Table 2.
Differentially expressed miRNAs with chromosomal location.
| miRNA | Fold change | Adj. P‐value | Chromosomal location |
|---|---|---|---|
| hsa‐miR‐620 | −3.07 | 0.0481 | 12: 116586365–116586459 [−] |
| hsa‐miR‐302d | −2.23 | 0.0422 | 4: 113569160–113569227 [−] |
| hsa‐miR‐483 | −2.19 | 0.0030 | 11: 2155364–2155439 [−] |
| hsa‐miR‐204 | −2.08 | 0.0010 | 9: 73424891–73425000 [−] |
| hsa‐miR‐323b‐5p | −2.07 | 0.0407 | 14: 101522556–101522637 [+] |
| hsa‐miR‐380‐5p | −2.06 | 0.0303 | 14: 101491354–101491414 [+] |
| hsa‐miR‐383 | −2.02 | 0.0459 | 8: 14710947–14711019 [−] |
| hsa‐miR‐211 | −1.96 | 0.0459 | 15: 31357235–31357344 [−] |
| hsa‐miR‐363∗ | −1.94 | 0.0015 | X: 133303408–133303482 [−] |
| hsa‐miR‐133b | −1.92 | 0.0033 | 6: 52013721–52013839 [+] |
| hsa‐miR‐485‐3p | −1.80 | 0.0075 | 14: 101521756–101521828 [+] |
| hsa‐miR‐517c | −1.70 | 0.0377 | 19: 54244567–54244661 [+] |
| hsa‐miR‐199b | −1.64 | 0.0165 | 9: 131007000–131007109 [−] |
| hsa‐miR‐199a | −1.63 | 0.0304 | 19: 10928102–10928172 [−] |
| 1: 172113675–172113784 [−] | |||
| hsa‐miR‐133a | −1.53 | 0.0475 | 18: 19405659–19405746 [−] |
| 20: 61162119–61162220 [+] | |||
| hsa‐miR‐99a | −1.48 | 0.0407 | 21: 17911409–17911489 [+] |
| hsa‐miR‐197 | −1.44 | 0.0155 | 1: 110141515–110141589 [+] |
| hsa‐miR‐218 | −1.41 | 0.0481 | 4: 20529898–20530007 [+] |
| 5: 168195151–168195260 [−] | |||
| hsa‐miR‐100 | −1.40 | 0.0248 | 11: 122022937–122023016 [−] |
| hsa‐miR‐25 | 1.28 | 0.0483 | 7: 99691183–99691266 [−] |
| hsa‐miR‐15b | 1.34 | 0.0407 | 3: 160122376–160122473 [+] |
| hsa‐miR‐195 | 1.34 | 0.0325 | 17: 6920934–6921020 [−] |
| hsa‐miR‐221 | 1.40 | 0.0066 | X: 45605585–45605694 [−] |
| hsa‐miR‐103 | 1.46 | 0.0389 | 20: 3898141–3898218 [+] |
| 5: 167987901–167987978 [−] | |||
| hsa‐miR‐107 | 1.48 | 0.0176 | 10: 91352504–91352584 [−] |
| hsa‐miR‐181a | 1.49 | 0.0407 | 9: 127454721–127454830 [+] |
| 1: 198828173–198828282 [−] | |||
| hsa‐miR‐342 | 1.67 | 0.0025 | 14: 100575992–100576090 [+] |
| hsa‐miR‐20a | 1.69 | 0.0165 | 13: 92003319–92003389 [+] |
| hsa‐miR‐222 | 1.70 | 0.0025 | X: 45606421–45606530 [−] |
| hsa‐let‐7i | 1.78 | 0.0022 | 12: 62997466–62997549 [+] |
| hsa‐miR‐30c | 1.91 | 0.0075 | 6: 72086663–72086734 [−] |
| 1: 41222956–41223044 [+] | |||
| hsa‐miR‐191 | 1.92 | 0.0040 | 3: 49058051–49058142 [−] |
| hsa‐miR‐24 | 1.99 | 0.0038 | 9: 97848303–97848370 [+] |
| 19: 13947101–13947173 [−] | |||
| hsa‐miR‐17‐5p | 2.06 | 0.0021 | 13: 92002859–92002942 [+] |
| hsa‐miR‐342‐3p | 2.08 | 0.0004 | 14: 100575992–100576090 [+] |
| hsa‐miR‐146b | 2.13 | 0.0007 | 10: 104196269–104196341 [+] |
| hsa‐miR‐29a | 2.26 | 0.0407 | 7: 130561506–130561569 [−] |
| hsa‐miR‐92b | 2.26 | 0.0007 | 1: 155164968–155165063 [+] |
| hsa‐miR‐320a | 2.41 | 0.0295 | 8: 22102475–22102556 [−] |
| hsa‐miR‐16 | 2.46 | 0.0021 | 13: 50623109–50623197 [−] |
| 3: 160122533–160122613 [+] | |||
| hsa‐miR‐30b | 2.51 | 0.0155 | 8: 135812763–135812850 [−] |
| hsa‐miR‐146a | 2.70 | 0.0005 | 5: 159912359–159912457 [+] |
| hsa‐miR‐92 | 2.80 | <0.0001 | 13: 92003568–92003645 [+] |
| X: 133303568–133303642 [−] | |||
| hsa‐miR‐142‐3p | 3.05 | 0.0077 | 17: 56408593–56408679 [−] |
| hsa‐miR‐92a | 3.20 | <0.0001 | 13: 92003568–92003645 [+] |
| X: 133303568–133303642 [−] | |||
| hsa‐miR‐21 | 3.86 | 0.0123 | 17: 57918627–57918698 [+] |
| hsa‐miR‐155 | 4.41 | <0.0001 | 21: 26946292–26946356 [+] |
| hsa‐miR‐425‐5p | 5.54 | 0.0165 | 3: 49057581–49057667 [−] |
| hsa‐miR‐93 | 5.83 | 0.0093 | 7: 99691391–99691470 [−] |
Positive fold changes are up‐regulated in MF samples and negative values down‐regulated compared to controls.
Adj. P‐value is adjusted P‐value after Benjamini‐Hochberg multiple testing correction.
Figure 2.
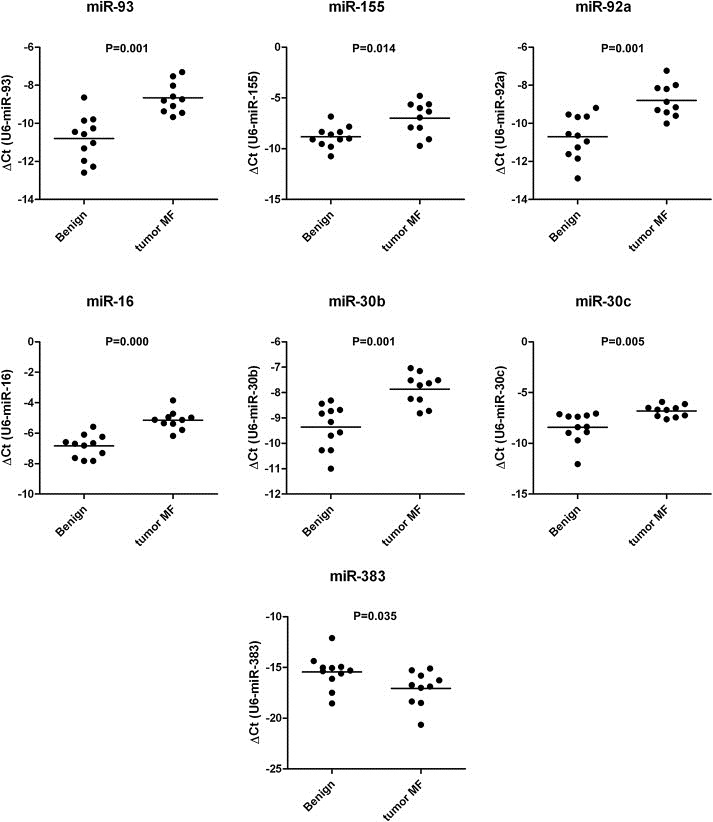
Expression levels of selected miRNAs as measured by miRNA‐Q‐PCR in an additional test group. Expression levels of miR‐93, miR‐155, miR‐92a, miR‐30b, miR‐16, miR‐30c and miR‐383 in tumor stage MF (n = 10) and benign inflammatory dermatoses (Lichen planus n = 6, Eczema n = 5) calculated by Delta Ct method. Horizontal bars represent the mean. All miRNAs are significant differentially expressed between tumor stage MF and benign inflammatory dermatoses, p‐values were measured by Mann–Whitney independent t test.
4. Discussion
In this study we elaborated the miRNA expression profile of tumor stage MF using miRNA microarrays. We found 49 miRNAs aberrantly expressed in MF tumors compared to benign inflammatory dermatoses. Remarkably, the majority (30) of the miRNAs is up‐regulated, while in most tumors miRNAs are predominantly expressed at lower levels compared to their benign counterparts, though higher expression in the majority of differentially expressed miRNAs has also been described for B‐cell malignancies (Zhang et al., 2009). We validated differentially expression of 7 miRNAs in additional test groups supporting the robustness of the results.
The miRNA with the highest fold difference is miR‐93, which is part of the miR‐106b‐25 cluster and has been previously described as an oncomir preventing apoptosis and promoting tumor growth (Fang et al., 2010; Petrocca et al., 2008), targeting tumor suppressors integrin‐β8 (Fang et al., 2010), FUS1 (Du et al., 2009), and E2F1 (Li et al., 2009). MiR‐93 over expression is reported in a subtype of nodal lymphoma (ALK + ALCL when compared to ALK‐ALCL) (Merkel et al., 2010) and in gastric and hepatocellularcarcinoma (Kim et al., 2009; Li et al., 2009). MiR‐93 is hosted by the gene encoding MCM7 (minichromosome maintenance protein 7) which has been reported to be over expressed in MF on the protein level (Gambichler et al., 2008). Another up‐regulated miRNA is miR‐155, which targets SHIP1, PU.1, AID, SOCS1, BACH1, CEBPB, CSFR, TAB2, MAF and JARID2, all known to play a role in immune responses and required for T cell function (O'Connell et al., 2010; Rodriguez et al., 2007). MiR‐155 up‐regulation is described for several types of lymphoma and leukemia, the first reports were on B‐cell lymphoma (Eis et al., 2005; Kluiver et al., 2005; Lawrie, 2007; O'Connell et al., 2010). Several members of the miR‐17‐92 cluster are up‐regulated in MF tumor stage (miR‐17‐5p, miR‐20a, miR‐92a and miR‐92). MiRNAs from the miR‐17‐92 cluster, targeting BIM and PTEN, regulate T cell survival and selection (O'Connell et al., 2010) and are involved in many malignancies including lymphoma (Bonauer and Dimmeler, 2009). Remarkably, we demonstrate miR‐16 up‐regulation, while the tumor suppressing function of miR‐16 and the corresponding down‐regulation is frequently described in tumors and lymphoma (Lawrie, 2007). Possibly miR‐16 plays a different yet unexplored role in MF tumors.
Recently the effect of DNA copy number alteration on miRNA expression was shown and has been linked to the initiation, progression and development of malignancies (Calin and Croce, 2006, 2007). To investigate the possible effect of copy number alterations on miRNA expression in tumor stage MF we determined the genomic location (miRBase release September 2010) of differentially expressed miRNAs and correlated those to previously described copy number alterations seemingly characteristic for tumor stage MF (Laharanne et al., 2010; Salgado et al., 2010; van Doorn et al., 2009), which revealed that 8 up‐regulated miRNAs (miR‐93, miR‐21, miR‐142‐3p, miR‐30b, miR‐92b, miR‐29a,miR‐181a and miR‐25) are encoded in genomic regions of gain (Table 3). We could not find any correlation between down‐regulated miRNAs and regions of loss identified in tumor stage MF. Not all miRNAs of a miRNA cluster located in a region of gain are up‐regulated suggesting that other mechanisms than copy number effect, such as transcriptional regulation primarily regulate miRNA expression in MF.
Table 3.
Differentially expressed miRNAs located in a previously described region of DNA copy number alteration in MF.
| miRNA | Cluster | Cytoband | Chromosomal location | Gain in MF | ||
|---|---|---|---|---|---|---|
| van Doorn et al., 2009 | Salgado et al., 2010 | Laharanne et al. 2010 | ||||
| hsa‐miR‐92b | 1q22 | 1: 155164968–155165063 [+] | × | |||
| hsa‐miR‐181a | 181a‐181b | 1q32.1 | 1: 198828173–198828282 [−] | × | ||
| 181a‐181b | 9q33.3 | 9: 127454721–127454830 [+] | ||||
| hsa‐miR‐25 | 106b‐93‐25 | 7q22.1 | 7: 99691183–99691266 [−] | × | ||
| hsa‐miR‐93 | 106b‐93‐25 | 7q22.1 | 7: 99691391–99691470 [−] | × | ||
| hsa‐miR‐29a | 29a‐29b | 7q32.3 | 7: 130561506–130561569 [−] | × | × | |
| hsa‐miR‐30b | 30b‐30d | 8q24.22 | 8: 135812763–135812850 [−] | × | ||
| hsa‐miR‐142‐3p | 17q22 | 17: 56408593–56408679 [−] | × | |||
| hsa‐miR‐21 | 17q23.1 | 17: 57918627–57918698 [+] | × | |||
Recent data from our group and others demonstrated many differences in gene expression profiles and DNA copy number alterations between MF and Sz, a leukemia of skin homing T cells, in addition Campbell and colleagues recently suggested that MF and Sz arise from different T‐cell subsets, indicating that the molecular pathogenesis of these CTCL may be distinct (van Doorn et al., 2004; van Doorn et al., 2009; Campbell et al., 2010; Booken et al., 2008). We compared our MF tumor stage miRNA profile with the previously generated miRNA profile of Sz (Ballabio et al., 2010). Although a similar array platform was used, a direct comparison of MF and Sz miRNA array results was not possible, since different reference miRNAs were used for competitive hybridization in both experiments (synthetic miRNAs in current experiments, and miRNAs isolated from tonsils in previous experiments (Ballabio et al., 2010)). We therefore compared the list of differentially expressed miRNAs identified in MF tumors (MF vs benign inflammatory dermatoses) with the list of differentially expressed miRNAs in Sz (CD4+ T cells of Sz vs CD4+ T cells from healthy donors (Ballabio et al., 2010)). This comparison, showing minimal overlap between MF and Sz, support the notion that Sz and tumor stage MF are molecularly distinct. In contrast to tumor stage MF the majority of the miRNAs (104 miRNAs) in Sz is down‐regulated compared to its benign counterpart (CD4+ T cells). Of the 19 miRNAs down‐regulated in tumor stage MF, only miR‐100 and miR‐133 are also down‐regulated in Sz. The 30 miRNAs up‐regulated in MF tumor stage and the 10 miRNAs up‐regulated in Sz show no overlap. Several of the miRNAs up‐regulated in tumor stage MF are down‐regulated in Sz, among these are miR‐93, miR‐155, miR‐16 and members of the miR‐17–92 cluster.
In summary this is the first report describing the characterization of the miRNA profile in tumor stage MF, thereby identifying 49 aberrantly expressed miRNAs. For 8 miRNA encoding genes, DNA copy number alteration could possibly contribute to aberrant expression. This analysis provides a framework for further (functional) studies which will reveal the role of these miRNAs on gene and protein expression and thereby their specific contribution to the pathogenesis of this disease.
Acknowledgments
We would like to thank W.H. Zoutman, J.J. Out‐Luiting (Dept. of Dermatology, LUMC), P.A. van der Velden (Dept. of Ophthalmology, LUMC) and R.H.A.M. Vossen (Center of Human and Clinical Genetics, LUMC) for their excellent assistance. This work was funded by grants from Netherlands Organization for Scientific Research> (NWO) (MHV) and the Fondation René Touraine (MvK), and grants from the Leukaemia and Lymphoma Research (EB, X‐HC) and the Julian Starmer‐Smith Memorial Fund (CHL).
van Kester Marloes S., Ballabio Erica, Benner Marchina F., Chen Xiao H., Saunders Nigel J., van der Fits Leslie, van Doorn Remco, Vermeer Maarten H., Willemze Rein, Tensen Cornelis P., and Lawrie Charles H., (2011), miRNA expression profiling of mycosis fungoides, Molecular Oncology, 5, doi: 10.1016/j.molonc.2011.02.003.
References
- Ballabio, E. , Mitchell, T. , van Kester, M.S. , Taylor, S. , Dunlop, H.M. , Chi, J. , Tosi, I. , Vermeer, M.H. , Tramonti, D. , Saunders, N.J. , Boultwood, J. , Wainscoat, J.S. , Pezzella, F. , Whittaker, S.J. , Tensen, C.P. , Hatton, C.S. , Lawrie, C.H. , 2010. MicroRNA expression in Sezary syndrome: identification, function, and diagnostic potential. Blood. 116, 1105–1113. [DOI] [PMC free article] [PubMed] [Google Scholar]
- Bonauer, A. , Dimmeler, S. , 2009. The microRNA-17-92 cluster: still a miRacle?. Cell Cycle. 8, 3866–3873. [DOI] [PubMed] [Google Scholar]
- Booken, N. , Gratchev, A. , Utikal, J. , Weiss, C. , Yu, X. , Qadoumi, M. , Schmuth, M. , Sepp, N. , Nashan, D. , Rass, K. , Tuting, T. , Assaf, C. , Dippel, E. , Stadler, R. , Klemke, C.D. , Goerdt, S. , 2008. Sezary syndrome is a unique cutaneous T-cell lymphoma as identified by an expanded gene signature including diagnostic marker molecules CDO1 and DNM3. Leukemia. 22, 393–399. [DOI] [PubMed] [Google Scholar]
- Calin, G.A. , Croce, C.M. , 2006. MicroRNA signatures in human cancers. Nat. Rev. Cancer. 6, 857–866. [DOI] [PubMed] [Google Scholar]
- Calin, G.A. , Croce, C.M. , 2006. MicroRNAs and chromosomal abnormalities in cancer cells. Oncogene. 25, 6202–6210. [DOI] [PubMed] [Google Scholar]
- Calin, G.A. , Croce, C.M. , 2007. Chromosomal rearrangements and microRNAs: a new cancer link with clinical implications. J. Clin. Invest.. 117, 2059–2066. [DOI] [PMC free article] [PubMed] [Google Scholar]
- Campbell, J.J. , Clark, R.A. , Watanabe, R. , Kupper, T.S. , 2010. Sezary syndrome and mycosis fungoides arise from distinct T-cell subsets: a biologic rationale for their distinct clinical behaviors. Blood. 116, 767–771. [DOI] [PMC free article] [PubMed] [Google Scholar]
- Croce, C.M. , 2009. Causes and consequences of microRNA dysregulation in cancer. Nat. Rev. Genet.. 10, 704–714. [DOI] [PMC free article] [PubMed] [Google Scholar]
- Du, L. , Schageman, J.J. , Subauste, M.C. , Saber, B. , Hammond, S.M. , Prudkin, L. , Wistuba, I.I. , Ji, L. , Roth, J.A. , Minna, J.D. , Pertsemlidis, A. , 2009. miR-93, miR-98, and miR-197 regulate expression of tumor suppressor gene FUS1. Mol. Cancer Res.. 7, 1234–1243. [DOI] [PMC free article] [PubMed] [Google Scholar]
- Eis, P.S. , Tam, W. , Sun, L. , Chadburn, A. , Li, Z. , Gomez, M.F. , Lund, E. , Dahlberg, J.E. , 2005. Accumulation of miR-155 and BIC RNA in human B cell lymphomas. Proc. Natl. Acad. Sci. U. S. A. 102, 3627–3632. [DOI] [PMC free article] [PubMed] [Google Scholar]
- Fang, L. , Deng, Z. , Shatseva, T. , Yang, J. , Peng, C. , Du, W.W. , Yee, A.J. , Ang, L.C. , He, C. , Shan, S.W. , Yang, B.B. , 2010. MicroRNA miR-93 promotes tumor growth and angiogenesis by targeting integrin-beta8. Oncogene. [DOI] [PubMed] [Google Scholar]
- Gambichler, T. , Bischoff, S. , Bechara, F.G. , Altmeyer, P. , Kreuter, A. , 2008. Expression of proliferation markers and cell cycle regulators in T cell lymphoproliferative skin disorders. J. Dermatol. Sci.. 49, 125–132. [DOI] [PubMed] [Google Scholar]
- Kent, O.A. , Mendell, J.T. , 2006. A small piece in the cancer puzzle: microRNAs as tumor suppressors and oncogenes. Oncogene. 25, 6188–6196. [DOI] [PubMed] [Google Scholar]
- Kim, Y.K. , Yu, J. , Han, T.S. , Park, S.Y. , Namkoong, B. , Kim, D.H. , Hur, K. , Yoo, M.W. , Lee, H.J. , Yang, H.K. , Kim, V.N. , 2009. Functional links between clustered microRNAs: suppression of cell-cycle inhibitors by microRNA clusters in gastric cancer. Nucleic Acids Res.. 37, 1672–1681. [DOI] [PMC free article] [PubMed] [Google Scholar]
- Kluiver, J. , Poppema, S. , de, J.D. , Blokzijl, T. , Harms, G. , Jacobs, S. , Kroesen, B.J. , van den, B.A. , 2005. BIC and miR-155 are highly expressed in Hodgkin, primary mediastinal and diffuse large B cell lymphomas. J. Pathol.. 207, 243–249. [DOI] [PubMed] [Google Scholar]
- Laharanne, E. , Oumouhou, N. , Bonnet, F. , Carlotti, M. , Gentil, C. , Chevret, E. , Jouary, T. , Longy, M. , Vergier, B. , Beylot-Barry, M. , Merlio, J.P. , 2010. Genome-wide analysis of cutaneous T-cell lymphomas identifies three clinically relevant classes. J. Invest. Dermatol.. 130, 1707–1718. [DOI] [PubMed] [Google Scholar]
- Lawrie, C.H. , 2007. MicroRNA expression in lymphoma. Expert Opin. Biol. Ther.. 7, 1363–1374. [DOI] [PubMed] [Google Scholar]
- Lawrie, C.H. , 2008. MicroRNA expression in lymphoid malignancies: new hope for diagnosis and therapy?. J. Cell Mol. Med.. 12, 1432–1444. [DOI] [PMC free article] [PubMed] [Google Scholar]
- Li, Y. , Tan, W. , Neo, T.W. , Aung, M.O. , Wasser, S. , Lim, S.G. , Tan, T.M. , 2009. Role of the miR-106b-25 microRNA cluster in hepatocellular carcinoma. Cancer Sci.. 100, 1234–1242. [DOI] [PubMed] [Google Scholar]
- Merkel, O. , Hamacher, F. , Laimer, D. , Sifft, E. , Trajanoski, Z. , Scheideler, M. , Egger, G. , Hassler, M.R. , Thallinger, C. , Schmatz, A. , Turner, S.D. , Greil, R. , Kenner, L. , 2010. Identification of differential and functionally active miRNAs in both anaplastic lymphoma kinase (ALK)+ and ALK− anaplastic large-cell lymphoma. Proc. Natl. Acad. Sci. U S A. 107, 16228–16233. [DOI] [PMC free article] [PubMed] [Google Scholar]
- O'Connell, R.M. , Rao, D.S. , Chaudhuri, A.A. , Baltimore, D. , 2010. Physiological and pathological roles for microRNAs in the immune system. Nat. Rev. Immunol.. 10, 111–122. [DOI] [PubMed] [Google Scholar]
- Petrocca, F. , Visone, R. , Onelli, M.R. , Shah, M.H. , Nicoloso, M.S. , de, M.I. , Iliopoulos, D. , Pilozzi, E. , Liu, C.G. , Negrini, M. , Cavazzini, L. , Volinia, S. , Alder, H. , Ruco, L.P. , Baldassarre, G. , Croce, C.M. , Vecchione, A. , 2008. E2F1-regulated microRNAs impair TGFbeta-dependent cell-cycle arrest and apoptosis in gastric cancer. Cancer Cell. 13, 272–286. [DOI] [PubMed] [Google Scholar]
- Rodriguez, A. , Vigorito, E. , Clare, S. , Warren, M.V. , Couttet, P. , Soond, D.R. , van, D.S. , Grocock, R.J. , Das, P.P. , Miska, E.A. , Vetrie, D. , Okkenhaug, K. , Enright, A.J. , Dougan, G. , Turner, M. , Bradley, A. , 2007. Requirement of bic/microRNA-155 for normal immune function. Science. 316, 608–611. [DOI] [PMC free article] [PubMed] [Google Scholar]
- Salgado, R. , Servitje, O. , Gallardo, F. , Vermeer, M.H. , Ortiz-Romero, P.L. , Karpova, M.B. , Zipser, M.C. , Muniesa, C. , Garcia-Muret, M.P. , Estrach, T. , Salido, M. , Sanchez-Schmidt, J. , Herrera, M. , Romagosa, V. , Suela, J. , Ferreira, B.I. , Cigudosa, J.C. , Barranco, C. , Serrano, S. , Dummer, R. , Tensen, C.P. , Sole, F. , Pujol, R.M. , Espinet, B. , 2010. Oligonucleotide array-CGH identifies genomic subgroups and prognostic markers for tumor stage mycosis fungoides. J. Invest. Dermatol.. 130, 1126–1135. [DOI] [PubMed] [Google Scholar]
- Smyth, G.K. , Speed, T. , 2003. Normalization of cDNA microarray data. Methods. 31, 265–273. [DOI] [PubMed] [Google Scholar]
- van Doorn, R. , Dijkman, R. , Vermeer, M.H. , Out-Luiting, J.J. , van der Raaij-Helmer, E.M. , Willemze, R. , Tensen, C.P. , 2004. Aberrant expression of the tyrosine kinase receptor EphA4 and the transcription factor twist in Sezary syndrome identified by gene expression analysis. Cancer Res.. 64, 5578–5586. [DOI] [PubMed] [Google Scholar]
- van Doorn, R. , Zoutman, W.H. , Dijkman, R. , de Menezes, R.X. , Commandeur, S. , Mulder, A.A. , Van der Velden, P.A. , Vermeer, M.H. , Willemze, R. , Yan, P.S. , Huang, T.H. , Tensen, C.P. , 2005. Epigenetic profiling of cutaneous T-cell lymphoma: promoter hypermethylation of multiple tumor suppressor genes including BCL7a, PTPRG, and p73. J. Clin. Oncol.. 23, 3886–3896. [DOI] [PubMed] [Google Scholar]
- van Doorn, R. , van Kester, M.S. , Dijkman, R. , Vermeer, M.H. , Mulder, A.A. , Szuhai, K. , Knijnenburg, J. , Boer, J.M. , Willemze, R. , Tensen, C.P. , 2009. Oncogenomic analysis of mycosis fungoides reveals major differences with sezary syndrome. Blood. 113, 127–136. [DOI] [PubMed] [Google Scholar]
- Willemze, R. , Jaffe, E.S. , Burg, G. , Cerroni, L. , Berti, E. , Swerdlow, S.H. , Ralfkiaer, E. , Chimenti, S. , Az-Perez, J.L. , Duncan, L.M. , Grange, F. , Harris, N.L. , Kempf, W. , Kerl, H. , Kurrer, M. , Knobler, R. , Pimpinelli, N. , Sander, C. , Santucci, M. , Sterry, W. , Vermeer, M.H. , Wechsler, J. , Whittaker, S. , Meijer, C.J. , 2005. WHO-EORTC classification for cutaneous lymphomas. Blood. 105, 3768–3785. [DOI] [PubMed] [Google Scholar]
- Zhang, J. , Jima, D.D. , Jacobs, C. , Fischer, R. , Gottwein, E. , Huang, G. , Lugar, P.L. , Lagoo, A.S. , Rizzieri, D.A. , Friedman, D.R. , Weinberg, J.B. , Lipsky, P.E. , Dave, S.S. , 2009. Patterns of microRNA expression characterize stages of human B-cell differentiation. Blood. 113, 4586–4594. [DOI] [PMC free article] [PubMed] [Google Scholar]