

Abstract
In attempt to discover novel aberrantly hypermethylated genes with putative tumor suppressor function in epithelial ovarian cancer (EOC), we applied expression profiling following pharmacologic inhibition of DNA methylation in EOC cell lines. Among the genes identified, one of particular interest wаs DOK1, or downstream of tyrosine kinase 1, previously recognized as a candidate tumor suppressor gene (TSG) for leukemia and other human malignancies. Using bisulfite sequencing, we determined that a 5′‐non‐coding DNA region (located at nt −1158 to −850, upstream of the DOK1 translation start codon) was extensively hypermethylated in primary serous EOC tumors compared with normal ovarian specimens; however, this hypermethylation was not associated with DOK1 suppression. On the contrary, DOK1 was found to be strongly overexpressed in serous EOC tumors as compared to normal tissue and importantly, DOK1 overexpression significantly correlated with improved progression‐free survival (PFS) values of serous EOC patients. Ectopic modulation of DOK1 expression in EOC cells and consecutive functional analyses pointed toward association of DOK1 expression with increased EOC cell migration and proliferation, and better sensitivity to cisplatin treatment. Gene expression profiling and consecutive network and pathway analyses were also confirmative for DOK1 association with EOC cell migration and proliferation. These analyses were also indicative for DOK1 protective role in EOC tumorigenesis, linked to DOK1‐mediated induction of some tumor suppressor factors and its suppression of pro‐metastasis genes. Taken together, our findings are suggestive for a possible tumor suppressor role of DOK1 in EOC; however its implication in enhanced EOC cell migration and proliferation restrain us to conclude that DOK1 represents a true TSG in EOC. Further studies are needed to more completely elucidate the functional implications of DOK1 and other members of the DOK gene family in ovarian tumorigenesis.
Keywords: Epithelial ovarian cancer, DNA methylation, DOK1, Tumor suppressor, Progression-free survival, DNA microarrays
Highlights
We identified the DOK1 tumor suppressor gene as hypermethylated in ovarian cancer.
However, DOK1 was found to be highly overexpressed in ovarian tumors.
DOK1 expression strongly correlated with ovarian cancer progression‐free survival.
Successive analyses displayed a contradictory role for DOK1 in ovarian tumorigenesis.
Further studies are needed to clarify the DOK1 gene implications in ovarian cancer.
Abbreviations
- EOC
epithelial ovarian cancer
- PFS
progression-free survival
- IHC
immunohistochemistry
- CT
chemotherapy
- IPA
Ingenuity Pathway Analysis
- TMA
tissue microarray
- TSG
tumor suppressor gene
1. Introduction
Epithelial ovarian cancer (EOC) accounts for 4% of all cancers in women and is the leading cause of death from gynecologic malignancies (Jemal et al., 2010). Despite medical and surgical improvements, long‐term survival rates for patients with advanced disease remain disappointing (Marchetti et al., 2010). The molecular basis of EOC initiation and progression is still poorly understood (Mok et al., 2007). To establish novel therapeutic and diagnostic strategies against this deadly disease, it is essential to understand its molecular pathology.
Disruption of normal gene regulation is important for carcinogenesis resulting in loss, or gain of genetic function. Recently, the importance of epigenetic perturbation of gene regulation in cancer (Jones and Baylin, 2007), including EOC (Balch et al., 2004; Barton et al., 2008), has begun to be more fully appreciated. The most studied epigenetic alteration is DNA methylation, the addition of a methyl moiety to the cytosine‐5 position within the context of a CpG dinucleotide, mediated by DNA methyltransferases (DNMTs) (Jones and Baylin, 2007). DNA methylation patterns are reset early in the embryogenesis and reestablished early during development. After that, they are thought to be relatively stable. In cancer, the physiological regulation of DNA methylation is disrupted leading to drastic changes of the distribution pattern of 5‐methylcytosine. The heavy methylation found in the bulk of chromatin is reduced, while the normally unmethylated CpG islands located in the promoter and first exon of genes become hypermethylated. Promoter hypermethylation often leads to inactivation of different TSGs and is associated with many important pathways involved with cancer, such as DNA repair, cell cycle regulation, apoptosis, carcinogen metabolism, hormonal response, and cell adherence (Baylin et al., 2001; Momparler, 2003). Aberrant DNA methylation is also involved in the development of chemotherapy‐resistant tumor phenotypes (Maier et al., 2005). Therefore, cancer‐specific promoter hypermethylation can itself serve as a valuable clue to uncover novel TSGs and/or tumor‐specific biomarkers for disease prognosis, treatment response prediction, and the development of novel treatment strategies.
Global demethylation and expression microarray analysis has been successfully used to identify a number of novel genes hypermethylated in association with different cancer types (Esteller, 2006). We applied a similar approach that includes expression profiling following pharmacologic inhibition of DNMT1 in EOC cell lines, in attempt to discover novel hypermethylated genes in EOC. Among the identified genes, one of particular interest wаs downstream of tyrosine kinase 1 (DOK1). DOK1 (also known as p62dok) was initially identified as a tyrosine‐phosphorylated, 62‐kDa protein associated with p120Ras‐GAP in Philadelphia chromosome‐positive chronic myeloid leukemia blasts and in v‐Abl transformed B cells (Carpino et al., 1997; Yamanashi and Baltimore, 1997). It later turned out that DOK1 is a member of a family of intracellular adapter proteins that includes DOK 1–7 and insulin receptor substrates 1–4 (IRS1–4) (Cai et al., 2003). DOK1 contains several features consistent with its function in signal transduction, including a pleckstrin‐homology domain at the N‐terminus for lipid membrane targeting, a phosphotyrosine‐binding domain in the central region for binding of tyrosine‐phosphorylated proteins, followed by an extended C‐terminal region with multiple sites of tyrosine phosphorylation (Wu et al., 2009). DOK1 represents a negative regulator of tyrosine kinase signaling and mitogen‐activated protein (MAP) kinase activity and down‐regulates cell proliferation (Nemorin et al., 2001; Tamir et al., 2000; Yamanashi and Baltimore, 1997; Yamanashi et al., 2000). It was also shown that DOK1 induces activin A‐mediated apoptotic responses via serine/threonine kinase receptors (Yamakawa et al., 2002). However, a positive role for DOK1 has been demonstrated in cell adhesion, cell spreading, and cell migration (Hosooka et al., 2001; Master et al., 2001; Noguchi et al., 1999; Woodring et al., 2004). Cumulative evidence from several groups has revealed that DOK1 exhibits tumor‐suppressive activity in both hematopoietic and non‐hematopoietic malignancies (Berger et al., 2010, 2004, 2007, 2010, 2004, 2004, 2006). Moreover, it has been recently reported that DOK1 is hypermethylated in hepatocellular carcinoma (Lambert et al., 2011). This prompted us to investigate whether DOK1 could represent an EOC TSG, silenced by DNA hypermethylation.
2. Materials and methods
2.1. Cell cultures
The EOC cell lines OVCAR3 and SKOV3 were purchased from the American Tissue Type Collection (Manassas, VA), while TOV112 and TOV21 were a kind gift of Dr. Anne‐Marie Mes‐Masson (Montreal University). The cell lines were passaged in different culture media supplemented with 10% fetal bovine serum, as described previously (L'Esperance et al., 2008). For microarray experiments, cells were treated with 5 μM 5‐Aza‐2′‐deoxycytidine (5‐aza‐dC; Sigma, St. Louis, MO), or DMSO vehicle alone, for 6 days.
2.2. Patients and tissue specimens
Primary cancer tissues (snap‐frozen or fixed) were obtained for genomic DNA extraction or immunohistochemistry (IHC) analyses prior to initial chemotherapy (CT) from 57 patients with invasive papillary serous adenocarcinoma of the ovary, (FIGO stage IIIC and IV, grade 2 and 3) at the Hotel‐Dieu de Quebec Hospital, Quebec, Canada. The patients received CT following debulking surgery between 2005 and 2010. All tumors were histologically classified according to the criteria defined by the World Health Organization (Vergote et al., 2000). The CT treatment was completed for all patients and the response to treatment was known. Disease progression was evaluated following the guidelines of the Gynecology Cancer Intergroup (Vergote et al., 2000). Progression‐free survival (PFS) was defined as the time from surgery to the first observation of disease progression, recurrence or death. Fifteen normal ovarian samples were derived from women subjected to hysterectomy with oophorectomy due to non‐ovarian pathologies. The study was approved by the Clinical Research Ethics Committee of the Hotel‐Dieu de Quebec Hospital and all patients signed an informed consent for voluntary participation.
2.3. Gene expression profiling and data analysis
Gene expression analysis was carried out as previously described (Bachvarov et al., 2006; L'Esperance et al., 2006). Briefly, total RNA was isolated from 5‐aza‐dC‐treated or control (vehicle‐treated) EOC cell cultures using the Trizol reagent (Invitrogen, Burlington ON, Canada). Alternatively, total RNA was extracted from stably transfected TOV112 clones, overexpressing (pCMV‐DOK1‐c3) or suppressing (shRNA‐DOK1‐sh1) DOK1 expression and their corresponding mock‐transfected TOV112 clones (see below, Sections 2.7 and 2.8.). The quality of all RNA samples was examined by capillary electrophoresis using the Agilent 2100 Bioanalyzer (Agilent, Palo Alto, CA). Fluorescently labeled cRNA targets were generated from 0.5 μg of total RNA from each corresponding EOC cell line or TOV112 cell clone (see Results for details), using the Fluorescent Linear Amplification Kit (Agilent) and 10.0 mM Cyanine 3‐ or 5‐labeled CTP (PerkinElmer, Boston, MA), and following user's manual. Cyanine‐labeled cRNA from 5‐aza‐dC‐treated EOC cells, or TOV112 clones overexpressing or suppressing DOK1, was mixed with the same amount of reverse‐color cyanine‐labeled cDNA from the corresponding control cells/mock‐transfected TOV112 clones and hybridized on the Agilent Whole Human Genome microarrays, containing ∼44,000 genes. Array hybridization, washing, scanning, data extraction and analyses were performed as previously described (Bachvarov et al., 2006; L'Esperance et al., 2006). Network analysis of the microarray data was completed using the Ingenuity Pathway Analysis (IPA) software (see http://www.Ingenuity.com).
2.4. Semi‐quantitative duplex RT‐PCR (sqRT‐PCR)
Analysis of DOK1 gene expression in 5‐aza‐dC‐treated and control EOC cells was performed by sqRT‐PCR as previously described (Bachvarov et al., 2006; L'Esperance et al., 2006). The β‐actin gene was used as an internal standard. Primers were designed for these loci with the sequences freely available from the Entrez Nucleotide database and the Primer3 algorithm for primer design (http://www‐genome.wi.mit.edu/cgi‐bin/primer/primer3_www.cgi).
2.5. Bisulfite sequencing PCR (BSP) analysis
Genomic DNA from EOC cultured cells and from normal and tumor ovarian specimens was isolated using the Qiagen DNeasy Blood and Tissue Kit. Bisulfite modification of genomic DNAs was done using the Methyl Detector kit (Active Motif, Carlsbad, CA). For BSP, a 308‐bp fragment was amplified from the 5′‐non‐coding DOK1 region, using primer pairs specific for bisulfite‐modified sequences but not harboring CpGs, located at nt −1158 (AGGTAGTTTTGTTTTGGGTTG) to nt −850 (CCCAACCCTTAAAATCCTACT) upstream of the DOK1 start (ATG) codon. BSP primer selection was performed using the Methyl Primer Express Software v1.0 (Applied Biosystems). PCR was done as above for 35 cycles (94 °C, 30 s; 60 °C, 50 s; 72 °C, 1 min). PCR products were sent for dideoxy‐sequencing analysis at the Genomics Analysis Platform at Laval University (http://www.bioinfo.ulaval.ca/seq/en/).
2.6. Tissue microarrays (TMAs) construction and IHC
TMAs were constructed, as previously described (Tetu et al., 2008). Briefly, one representative block of each ovarian tumor and normal ovarian tissue was selected for the preparation of the tissue arrays. Three 0.6 mm cores of tumor were taken from each tumor block and placed, 0.4 mm apart, on a recipient paraffin block using a commercial tissue arrayer (Beecher Instruments, Sun Prairie, WI). The cores were randomly placed on one of two recipient blocks to avoid IHC evaluation biases. Four micron thick sections were cut for the hematoxylin–eosin (HE) staining and IHC analyses.
IHC was performed, as previously described (Tetu et al., 2008). Briefly, one representative 4 μm tissue section was cut from the tissue array blocks. Sections were deparaffinized and rehydrated in graded alcohols, then incubated with blocking serum for 20 min. Sections were incubated overnight at room temperature with the DOK1 (A‐3) mouse monoclonal antibody (Santa Cruz Biotechnology) at dilution 1:500. Sections were then incubated with a biotinylated secondary antibody (Dako, Carpinteria, CA) and then exposed to a streptavidin complex (Dako, Carpinteria, CA). Complete reaction was revealed by 3‐3′ diaminobenzidine and slides were counterstained with hematoxylin.
DOK1 protein expression was assessed by semi‐quantitative scoring of the intensity of staining and recorded as absent (0), weak (1+), moderate (2+) or strong (3+). The relationship between DOK1 expression in serous ovarian carcinomas and normal ovarian tissues was evaluated by the Wilcoxon two‐sample test. A significant association was considered when p‐value was below 0.05. A Kaplan–Meier curve and the log‐rank test were performed based on PFS values to test the effect of the intensity of DOK1 (3, 2 versus 0, 1) on disease progression.
2.7. Ectopic DOK1 expression in TOV112 cells
For DOK1 overexpression, the cDNA sequence of the human DOK1 gene (transcript variant 1) cloned in the pCMV6 entry eukaryotic expression vector (pCMV‐DOK1) was purchased from OriGene Technologies, Inc. (Rockville, MD). Transfection with ExGen 500 (Fermentas Canada Inc., Burlington ON) was carried out according to the manufacturer's guidelines. Briefly, 100,000 TOV112 cells were plated onto 6 × 30‐mm plates and allowed to grow to 70% confluence. Ten microliters of ExGen 500 were added to 2 μg of plasmid DNA dissolved in 190 μl of 150 mM NaCl. The complexes were incubated at room temperature for 10 min and then overlaid onto the cells in 1.8 ml medium. The plate was then centrifuged for 5 min at 15000 rpm and incubated at 37 °C, 5% CO2 for 48 h. Stably transfected clones were selected by adding G418 (1 mg/ml) and further cultivation for about 2 weeks. Cells were also mock‐transfected with the pCMV6 vector, and stably transfected clones were isolated as controls. The DOK1 expression levels of selected DOK1‐overexpressing and control clones were confirmed by Western blot.
2.8. DOK1 short hairpin RNA transduction in TOV112 cells
A DOK1 short hairpin RNA (shRNA) plasmid that targeted the DOK1 coding sequence (5′‐CCGGGAGGGAGTACAACGGAAGAAACTCGAGTTTCTTCCGTTGTACTCCCTCTTTTG‐3′) was purchased from the Mission shRNA collection of Sigma–Aldrich (St. Louis, MO). The shRNA sequence was subcloned into a pLKO.1‐puro vector (shRNA‐DOK1). Viral supernatants were generated by transfecting 293‐T cells with the shRNA construct and packaging vectors pSPAX2 and pMD2.G (Addgene, Cambridge, MA). The high‐titer lentiviral supernatants in the presence of 8 μg/ml polybrene were used to infect TOV112 cells. Two days later, infected cells were treated with puromycin (0.5 μg/ml) for the selection of stably‐transduced clones. The pLKO empty vector was used for the generation of mock‐transduced (control) clones. The DOK1 expression levels of selected shRNA‐DOK1 and control clones were confirmed by Western blot.
2.9. Western blot analysis
Protein lysates were prepared by resuspending cell pellets in Laemmli sample buffer containing 5% β‐mercaptoethanol. Protein lysates were separated by 6–12% Tris–glycine gel electrophoresis and transferred onto a polyvinylidene difluoride membrane using a semidry apparatus (Bio‐Rad Laboratories, Hercules, CA). The membrane was blocked with 5% nonfat dry milk in TBST (20 mmol/L Tris–HCl, 0.5 M NaCl, and 0.1% Tween 20), incubated with the anti‐DOK1 (A‐3) mouse monoclonal antibody (dilution 1:500) at room temperature for 3 h, followed by washing with TBST. Subsequently the membrane was incubated with horseradish peroxidase‐conjugated secondary antibody and detected with ECL solution (Thermo Fisher Scientific, Waltham, MA).
2.10. Colony formation assay
TOV112 cells were seeded at 500 cells per 60 mm culture dish. After 14 days, the dishes were washed twice in PBS, fixed with cold methanol, stained with Coomassie Blue (Sigma–Aldrich) for 5 min, washed with water and air dried. The number of colonies was determined by imaging with a Multimage™ Cabinet (Alpha Innotech Corporation, San Leandro, CA) and using AlphaEase Fc software.
2.11. Cell migration (wound‐healing) assay
Cells were seeded in individual wells of a 6‐well culture plate. pCMV‐DOK1 and shRNA‐DOK1 TOV112 clones together with their corresponding control clones were cultured in quiescent medium until 80–90% confluence. Then, a sterile 10‐μl pipette tip was used to longitudinally scratch a constant‐diameter stripe in the confluent monolayer. The medium and cell debris were aspirated away and replaced with 2 ml of fresh serum‐free medium. Photographs were taken at 0 h and 16 h or 24 h after wounding by phase contrast microscopy. For statistical analysis, three randomly selected points along each wound were marked, and the density of the migrating cells was measured at 0 h and 16 h or 24 h. Values were means ± SD from at least three‐independent experiments. Differences between pCMV‐DOK1 and shRNA‐DOK1 and control data were determined by a Student's t‐test, where p < 0.05 was considered significant.
2.12. MTT (cytotoxicity) assay
The MTT cell proliferation assay (Sigma, St‐Louis, MS, USA) was used to measure the cell growth inhibition effects of cisplatin in TOV112 cell clones overexpressing or suppressing DOK1, as previously described (Jutras et al., 2010). Briefly, cell suspensions (at 2 × 10⁴ cells/ml) were transferred to 96‐well plates in triplicates and incubated for 3 days with different cisplatin concentrations (ranging between 1 nM and 100 μM). Then, 38 μl of 3‐[4,5‐dimethylthiazol‐2‐yl]‐2,5‐diphenyl‐tetrazolium bromide (MTT, 5 mg/ml) was added to each well 4 h before the end of the incubation. After centrifugation and removing the supernatant, 200 μL of dimethyl sulphoxide (DMSO) were added to resolve the crystals and the optical density was measured by microplate reader at 595 nm.
3. Results
3.1. Identification of DOK1 as a potentially hypermethylated gene in EOC cells
To identify candidate genes whose expression was silenced by aberrant DNA methylation in EOC, we treated four different EOC cell lines (OVCAR3, SKOV3, TOV21 and TOV112) with the DNA methyltransferase inhibitor 5‐aza‐dC. For each of the cell lines, RNA isolated from treated and untreated cells was directly compared by microarray hybridization to Agilent Human Whole Genome microarrays representing about 44,000 different genes.
A subset of commonly upregulated genes in the 5‐aza‐dC‐treated ovarian cancer cell lines was selected by initial filtering on confidence at p‐value = 0.005, followed by filtering on expression level (≥3 fold). Using these stringent selection criteria, we found 81 genes to be upregulated at least in two of the four treated ovarian cancer cell lines (Supplemental Table 1). We initially narrowed the list of genes by selecting primarily those upregulated genes that contain CpG island(s) within their 5′ regulatory region. The 5′ untranscribed region or first exon of a target gene was identified using the USCS Human Genome Browser database (http://genome.ucsc.edu/cgi‐bin/hgGateway). This region was further analyzed for CpG rich areas, using the Methyl Primer Express Software. Thirty genes did not display any CpG islands in their genomic structure and were not considered for further analyses (see Supplemental Table 1 for details). Thirty three of the remaining 51 genes had been reported to undergo promoter hypermethylation and mRNA downregulation in human cancers in the literature; among these, three genes (CTGF, TGFBI and UCHL1), were found to be subject of epigenetic silencing via promoter methylation in EOC (see Supplemental Table 1 for details). The remaining 19 genes were designated as novel candidate methylation targets in ovarian cancer by our gene‐filtering strategy. The methylation status of some of these genes in EOC is currently under investigation.
Among these identified sequences, one of particular interest was DOK1, a candidate TSG that has been recently reported to be suppressed by DNA hypermethylation in HCC and head and neck cancers (Lambert et al., 2011). Initial validation by semi‐quantitative RT‐PCR showed moderate 5‐aza‐dC‐mediated induction of DOK1 in EOC cells, which was more evident in SCOV3 and TOV21 cells (Figure 1A). Consecutive BSP analysis of the 5′‐non‐coding region of the DOK1 gene identified a DNA region, stretching between nt −1158 to −850 upstream of the DOK1 start (ATG) codon, and containing 14 putative CpG methylation targets (Figure 1B). BSP analysis was indicative for a strong methylation of these targets in EOC tumors and EOC cell lines, compared to normal ovarian tissue (Figure 1B). However, further BSP analyses were not able to identify any other hypermethylated DNA regions, especially around or closer to the transcription initiation site, comprising the putative core promoter of the DOK1 gene (data not shown).
Figure 1.

Identification of DOK1 as a potentially hypermethylated gene in EOC cells. A. Semi‐quantitative RT‐PCR validating induction of DOK1 by 5‐aza‐dC treatment in EOC cells. B. BSP DNA methylation analysis of a 308 bp 5′ non‐coding region (nt −1158 to −850) of the DOK1 gene in EOC cells, EOC tumors and normal ovarian tissue samples. Filled circles represent methylated CpGs and open circles represent unmethylated CpGs. CpG plot of the analyzed is also presented (CpGs are indicated with vertical marks).
3.2. No effect of DOK1 hypermethylation on its expression in EOC tumors: correlation with progression‐free survival
Using TMAs, we evaluated DOK1 protein expression by immunohistochemistry (IHC) in EOC tumors and ovarian normal tissue samples. These TMAs included triplicate cores of 57 serous EOC adenocarcinoma samples and 15 normal ovarian tissue samples. Our cohort of 57 serous adenocarcinoma EOC patients comprised women with advanced disease, for whom extensive follow‐up clinical data (up to 5‐years) were available. Table 1 shows the major clinical characteristics of these patients. The age ranged from 41 to 83 years (median: 64 years). Tumors were mainly grade 3 (56%) and stage III (80%). Seven patients had a second cancer, of them 4 were from the breast, 2 from the colon, and one from the endometrium. The majority of patients (79%) received a combination of platinum and taxol. The median baseline CA125 was around 800. Thirty one percent of the patients had a progression or a recurrence within the first 6 months of follow‐up; for 49% of the patients the PFS interval was in the range of 7–24 months, and 19% of the patients displayed PFS values higher than 25 months (Table 1). At 5 years, only 9% of patients were recurrence‐free and 24% were alive.
Table 1.
Patients’ characteristics.
| Variable | Range | n/total | % |
|---|---|---|---|
| Age (years) | <50 | 8/57 | 14.0 |
| 50–69 | 29/57 | 50.9 | |
| >70 | 20/57 | 35.1 | |
| Median age | 64 | ||
| Grade | 1 | 6/57 | 10.5 |
| 2 | 19/57 | 33.3 | |
| 3 | 32/57 | 56.2 | |
| Stage | III (A, B and C) | 46/57 | 80.7 |
| IV | 11/57 | 19.3 | |
| Type of chemotherapy | Platinum + taxol | 51/57 | 79.5 |
| Platinum + cyclophopphamide | 6/57 | 10.5 | |
| CA125 initial | <800 | 27/57 | 47.4 |
| >800 | 24/57 | 42.1 | |
| N/D | 6/57 | 10.5 | |
| PFS (months) | 0–6 | 18/57 | 31.6 |
| 7–24 | 28/57 | 49.1 | |
| >25 | 11/57 | 19.3 |
Surprisingly, DOK1 displayed significantly higher expression in EOC adenocarcinoma tumors, as compared to normal tissue (see Table 2 and Figure 2). These findings indicate that the hypermethylation of CpG targets included in the nt −1158 to −850 5′‐region of the DOK1 gene does not impact its expression in advanced EOC. We further constructed a Kaplan–Meier survival curve based on DOK1 expression analyses in the cohort of 57 serous adenocarcinoma EOC patients. Our analyses revealed that higher DOK1 expression significantly correlated with an improved PFS of serous ovarian adenocarcinoma patients; i.e., women with higher DOK1 expression had a better survival without progression than those with lower DOK1 expression (p = 0.0106) (Figure 3).
Table 2.
DOK1 expression as a function of tissue type (based on signal intensity following IHC).
| Tissue type | Mean ± SD | Median |
|---|---|---|
| Serous ovarian carcinoma (n = 57) | 2.26 ± 0.85a | 2.0 |
| Normal ovarian tissue samples (n = 15) | 1.80 ± 0.68a | 2.0 |
Signal intensity is significantly higher in carcinoma samples, compared to normal samples: p = 0.025 (using the non‐parametric test of Wilcoxon).
Figure 2.
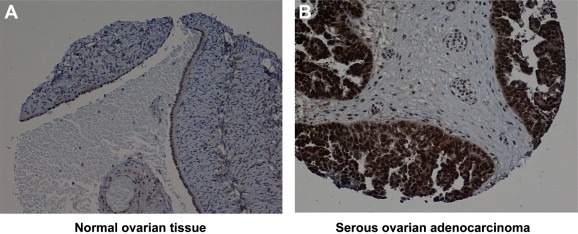
Representative IHC images of DOK1 protein expression in A, normal ovarian tissue and B, serous ovarian adenocarcinoma.
Figure 3.
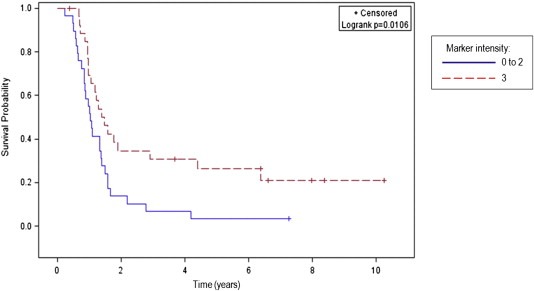
Kaplan–Meier curve for progression‐free survival according to the level of DOK1 IHC intensity in tumor samples of 57 serous EOC patients.
3.3. Phenotype analysis of DOK1 overexpression and suppression in EOC cells: possible implications in EOC cell migration, proliferation and cisplatin sensitivity
Next, we decided to verify if alteration of DOK1 gene expression could produce any cancer‐related phenotypic changes in EOC cells. We tested several EOC cell lines for endogenous DOK1 expression by sqRT‐PCR and Western analysis (data not shown). Among these, the TOV112 cell line displayed intermediate levels of endogenous DOK1 expression and was further used to generate stably transfected TOV112 clones, overexpressing (pCMV‐DOK1) or suppressing DOK1 expression (shRNA‐DOK1). Clone selection for further analyses was based on Western blot validation of the DOK1 protein expression in selected clones, compared with empty vector‐transfected/transduced clones (pCMV for overexpression and pLKO for suppression – see Figure 4). Based on the Western blot data, clones pCMV‐DOK1(c3) (Figure 4A) and shRNA‐DOK1 (sh1) (Figure 4B) were selected for further analyses.
Figure 4.
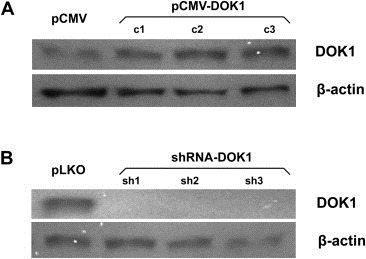
Western blot analysis of DOK1 expression in TOV112 cells. A. DOK1 expression analysis in DOK1‐overexpressing TOV112 clones pCMV‐DOK1(c1–c3), compared to the mock‐transfected clone pCMV. B. DOK1 expression analysis in DOK1 knockdown TOV112 clones shRNA‐DOK1 (sh1‐sh3), compared to the mock‐transduced clone pLKO. β‐actin was used as a loading control.
We investigated the impact of both ectopic overexpression or suppression of the DOK1 gene on TOV112 cell migration, cell proliferation and sensitivity to cisplatin (conventionally used for EOC chemotherapy). As expected, both opposite alterations in DOK1 expression correlated with the extent of cell migration (Figure 5). Interestingly, DOK1 expression displayed evident positive correlation with TOV112 proliferation, as judged by colony formation assay (Figure 6). DOK1 overexpression had no significant impact on TOV112 cisplatin sensitivity, as the IC50 values of the pCMV‐DOK1(c3) and pCMV clones were quite similar (in the range of 6–8 μM cisplatin) and didn't differ from IC50 of untreated TOV112 cells (Figure 7A). However, DOK1 downregulation significantly increased TOV112 resistance to cisplatin, as the shRNA‐DOK1(sh1) clone displayed IC50 33–35 μM for cisplatin, compared to control clones and untreated cells, showing again IC50 values between 6 and 8 μM (Figure 7B).
Figure 5.

Effect of ectopic DOK1 overexpression or shRNA‐mediated DOK1 knockdown on TOV112 cell migration. Migration was assessed by determining the ability of cells to migrate in a culture plate using a wound‐healing assay after 16–24 h of incubation. A. Effect of DOK1 overexpression on TOV112 cell migration. B. Migration profile of the DOK1‐overexpressing TOV112 clone pCMV‐DOK1(c3), compared with a mock‐transfected TOV112 clone (pCMV‐control). C. Effect of DOK1 knockdown on TOV112 cell migration. D. Migration profile of the DOK1 knockdown TOV112 clone shRNA‐DOK1(sh1), compared with a mock‐transduced TOV112 clone (pLKO‐control). ∗Statistical significance, P < 0.05.
Figure 6.

Ectopic alteration of DOK1 expression in TOV112 cells: effect on cell proliferation (colony formation assay). A. Representative images of colony forming assays following DOK1 overexpression. B. Representative images of colony forming assays following DOK1 knockdown. C. Colony formation assay showed a significant increase of colony number in DOK1 stably transfected TOV112 cells, compared to mock‐transfected cells. D. shRNA‐mediated DOK1 knockdown significantly decreased colony number in TOV112 cells, compared to cells, transduced with empty vector. Colonies were counted and colony numbers represent mean of 3 repeats for each clone. Standard deviations are indicated by error bars. ∗Statistical significance, P < 0.05.
Figure 7.
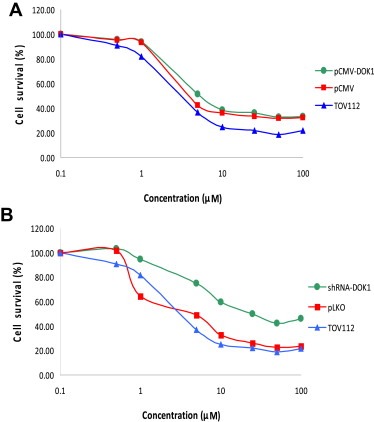
Dose–response cytotoxicity curves upon cisplatin treatment of TOV112 cells following ectopic DOK1 overexpression or shRNA‐mediated DOK1 knockdown. A. Dose–response cytotoxicity curves upon cisplatin treatment of the DOK1‐overexpressing TOV112 clone pCMV‐DOK1(c3). B. Dose–response cytotoxicity curves upon cisplatin treatment of the DOK1 knockdown TOV112 clone shRNA‐DOK1(sh1). Mock transfected/transduced clones and non‐treated TOV112 cells were used as controls. Dose range for cisplatin was 0.05–100 μM. All results were expressed as mean ± SD of three‐independent experiments.
3.4. Molecular mechanisms of DOK1 action in EOC cells
To better understand the molecular mechanisms of DOK1 action in EOC cells, we employed the Agilent Whole Human Genome microarrays, containing ∼44,000 genes to identify global gene expression changes upon DOK1 ectopic overexpression or suppression in TOV112 cells. We compared the gene expression of the previously selected clones pCMV‐DOK1(c3) and shRNA‐DOK1(sh1) against the corresponding control clones (pCMV and pLKO, respectively). All microarray experiments were performed in duplicates, as two hybridizations were carried out for the DOK1‐overexpressing/suppressing cell clone against the corresponding control, using a fluorescent dye reversal (dye‐swap) technique. For each comparison, a subset of differentially expressed genes was selected displaying at least 2‐fold difference in both duplicate microarray experiments. Differentially expressed genes with lower signal intensities (<500) were additionally subtracted. Using these selection criteria, we found 291 genes to be upregulated and 146 genes to be downregulated in TOV112 cells following DOK1 overexpression, while 115 genes were upregulated and 184 were downregulated in TOV112 cells upon DOK1 knockdown. Among these, DOK1 displayed 5.78‐fold induction in the pCMV‐DOK1(c3) clone and 3.39‐fold suppression in the shRNA‐DOK1(sh1) clone, compared to the corresponding controls (see Supplemental Tables 2 and 3). Table 3 shows a list of selected functionally related groups of genes that were differentially expressed (≥2‐fold) in TOV112 clones displaying DOK1 overexpression (Table 3A and B) and DOK1 knockdown (Table 3C and D). As seen from Table 3, there was a good concordance between gene expression data following DOK1 upregulation and suppression. Indeed, genes with previously shown implication in mechanisms of cell growth & proliferation, cell cycle control, signal transduction, cellular assembly & organization and cell adhesion, were mostly induced upon DOK1 overexpression, and predominantly suppressed following DOK1 knockdown (see Table 3A and D). Moreover, comparable numbers of genes, functionally related to metabolism and regulation of transcription, were equally up‐ and downregulated, both upon DOK1 overexpression and suppression. DOK1 overexpression also induced a number of genes implicated in transport and DNA replication, as well as suppression of genes, associated with immune response (Table 3A and B). Supplemental Tables 2 and 3 show the complete list of the differentially expressed genes (≥2‐fold; signal intensity ≥500) following DOK1 overexpression and DOK1 knockdown.
Table 3.
Selected differentially expressed gene groups in TOV112 cells upon DOK1 overexpression or knockdown.
| A. Upregulated genes in the pCMV‐DOK1(c3) cell clone, displaying DOK1 overexpression | |
| Signal transduction | SPRED1, ZNF219, SCAP2, MAPK11, EPHA3, HRMT1L1, AKAP12, CORO1C, CAP2, RASIP1, RASSF2, PLEKHK1, GDF15, GNAI1, GCG, AXIN2, WIF1, DOK1, APLP2, GRCA, TAC1, FLJ20186, SNX10, C20orf161, NUDT11, DLG7, DKK2, DKK1, KREMEN2, TMEM55A, TMEM2, PTPNS1, PLEKHG3, NUCB2, GRASP, CSH1 |
| Cell growth & proliferation | FGFR1, COL1A2, BMP7, IGFBP2, CYR61, C20orf129, HGF, SYNE2, JPH3, ACTN1, CENPE, PTTG2, PTTG1, CENPF, INCENP, KNTC2, BRRN1, BUB1, UBE2C, KIF2C, KIF15, APRIN, CRIP1 |
| Metabolism | ASL, SGSH, ALDH1A1, RTEL1, TYMS, APEH, RNF128, UCHL3, GAD1, ANXA1, PCCA, SCD, PLA2G4B, TFPI2, GSTM3, LHPP, ENOSF1, ZNRF3, LMO7, NUDT15, NUCKS1 |
| Cell cycle | KIF23, CCNB1, E2F7, CDK9, PLK1, CCNB2, KRAS, CCND2, RB1, CDT1, RGC32, CDKN3, CCNG1, CDKN2C, SPAG5, HCAP‐G, ASPM, MACF1 |
| Regulation of transcription | TRPS1, HMGA2, SLC2A4RG, MYCBP, RORA, NR2F1, HOXA9, DACH1, LEF1, FOXO1A, GLI1, HMG1L1, NFAT5, TLE1, ARNTL, HOXA7, CITED1, BASP1 |
| Transport | SQRDL, ACAD9, PYCRL, DHCR24, SLC25A11, SLN, SLC38A2, GJA1, PCLO, KCNN4, TRPV2, KCTD12, COL3A1, TOMM40L, RIMS3, SLC38A1, MLPH, RAP1B |
| DNA replication & repair | RAD51AP1, MGMT, HMGB1, ERCC1, RAD54L, UHRF1, FANCD2, TK1, Pfs2, CHTF18, TOP2A, HMGB2, POLD1, RRM2, S100A11 |
| Cellular assembly & organization | PRKG1, STK6, PBK, CDCA1, VIM, S100A10, CKAP2, ADD3, CENPA, SMARCA1 |
| Cell adhesion | LAMB1, KIRREL2, CNTNAP4, FAT, GPR56, NPHS1, MMRN1, DCBLD2, CDH19 |
| Apoptosis | BIRC5, AVEN, CARD10, TNFRSF19, P8, EMP1, HIP1 |
| B. Downregulated genes in the pCMV‐DOK1(c3) cell clone, displaying DOK1 overexpression | |
| Metabolism | TRIM7, ENPP4, WWOX, FLJ32370, SLC2A14, OSBPL3, OSBPL3, IMPA2, PLD1, TYRP1, KYNU, GCLC, IMMP2L, KLK1, PTPRK, PLOD2, FAM80B, PRKAB1, RBKS, AKR1B1, SF3B3, MMP1, TFB2M, THAP10, HEL308, HSPA5, MPPE1 |
| Regulation of transcription | TIGD7, ID4, IRX4, HES4, KIAA0543, LOC155060, DKFZp779O175, ESX1L, ZNF550, FOXC1, NR4A2, IFI16, NR4A3, FOXA3, ZNF350 |
| Immune response | FLJ20245, CSAG2, CFHL1, RGS1, DAF, DAF, CFH, MAGEA12, MAGEA6, MAGEA2B, RSAD2, MIG‐6 |
| Signal transduction | ARF4L, NTS, FGF13, CIT, TM2D2, AVPI1, TRA16, MUC20 |
| Cell cycle | RGS2, PINX1, GSPT2, FGF7, NDN |
| Cell growth & proliferation | SPANXA1, DNAH7, GPNMB, LAMP3 |
| Transport | SLC6A13, SLC6A15, ATP1B3, MT1F |
| Apoptosis | CASP9, MAL |
| C. Upregulated genes in the shRNA‐DOK1(sh1) cell clone, displaying DOK1 suppression | |
| Regulation of transcription | NFE2L2, MEF2C, GABPB2, SAP18, SAP18, ESX1L, TCF4, ID4, CBFB, OSR2, TAF15, TWISTNB, POLR1D, TWISTNB, EGR1, ZNF198, ELF1, MYCBP, PRDM13, IER2 |
| Metabolism | DCP2, GBE1, D4ST1, EXOSC8, DICER1, ALG5, ADAMTS5, UBE3A, MIPEP, C13orf22, C13orf22, GAD1, MAT2B, SCD, TFPI2, RNF6, GALNT14 |
| Signal transduction | NFAT5, KIFAP3, CXCL14, EDNRA, MIG‐6, IFIT1, GDF15, GCG, GPR126, AKAP11, RASGEF1A, LUM, S100A10, ARHGAP11A |
| Transport | SLC20A2, GLRB, ATP9A, COLEC12, MTX2, SNX10, SNX5, COG6 |
| Apoptosis | TNFRSF12A, IER3, TNFRSF19, IFIH1, PERP, SOCS2, AVEN |
| Cell growth & proliferation | CENPJ, TJP1, EMP1, S100A11, PLS3, VIM, THC2242927 |
| Cell cycle | CDK6, CDK8, GADD45A, RGS2 |
| D. Downregulated genes in the shRNA‐DOK1(sh1) cell clone, displaying DOK1 suppression | |
| Metabolism | EPHX2, USP9X, DHRS2, RNASE4, DHRS2, NPEPL1, DHRS7, UCHL1, TYRP1, ENPP4, DHRS4, UBE2S, CST3, IDH2, DHRS6, NPC2, B3GALT4, GLDC, FKBP9, WWOX, UBE2S, ADPRHL1, PCSK1N, UBE2S, FKBP3, ZAP128 |
| Signal transduction | NTS, PTGER4, DKK2, DKK2, ADM, DOK1, FCGRT, SNX3, TPD52L1, SNX3, FNBP1L, SPG7, SPG7, STK40, RASSF2, PLCG2, GNAL, RAB15, TUBB3, PLEKHG3, PORIMIN |
| Regulation of transcription | TCEAL3, ZNF219, MSRB2, TCEAL5, CREM, ZNF219, NR4A3, FUBP3, MECT1, THRA, ZFP36L1, ZFHX1B, FLJ14981, MGC16385, TLE2, ZNF618, ZFYVE26, HOXB13 |
| Cell growth & proliferation | NBEA, CYR61, ROBO1, EML4, CYR61, PAPSS2, KAZALD1, HGF, CDKN1C, SYNE2, ROBO3, LOXL1, NM_139290, FGFR3, SKB1, CAP2, PMP22 |
| Cell cycle | MDK, KRAS, CGREF1, ANKRD15, C10orf7, PTEN, CABLES1, DUSP6, CEP2, CDKN2C, CDT1, CDKN3 |
| Cellular assembly & organization | SEC14L4, EML4, TMSL8, DKK1, PAPSS2, HIST1H2AE, HIST1H1C, TCF7L1, EPB41L1, KLHL5 |
| Cell adhesion | CDH19, PCDHB5, PKP3, FARP1, SRPX |
| Transport | CYBRD1, CYP2U1, COX4I1, NPEPL1, ZFYVE1 |
Pathway and network analyses, generated through the use of the IPA software confirmed the major functionally related gene groups, found to be differentially expressed in the DOK1‐overexpressing or DOK1‐suppressing TOV112 cell clones. As seen from Figure 8, similar pathways were both induced upon DOK1 overexpression and suppressed upon DOK1 knockdown: these included pathways functionally related to cellular movement, cellular assembly and organization and DNA replication, recombination and repair. Alternatively, pathways implicated in gene expression, cell signaling, inflammation and drug metabolism were concordantly suppressed following DOK1 overexpression and induced upon DOK1 knockdown. Pathways linked to cell cycle control, cellular growth and proliferation, cell death, metabolism and molecular transport were equally up‐ and downregulated, both upon DOK1 overexpression and suppression (Figure 8).
Figure 8.
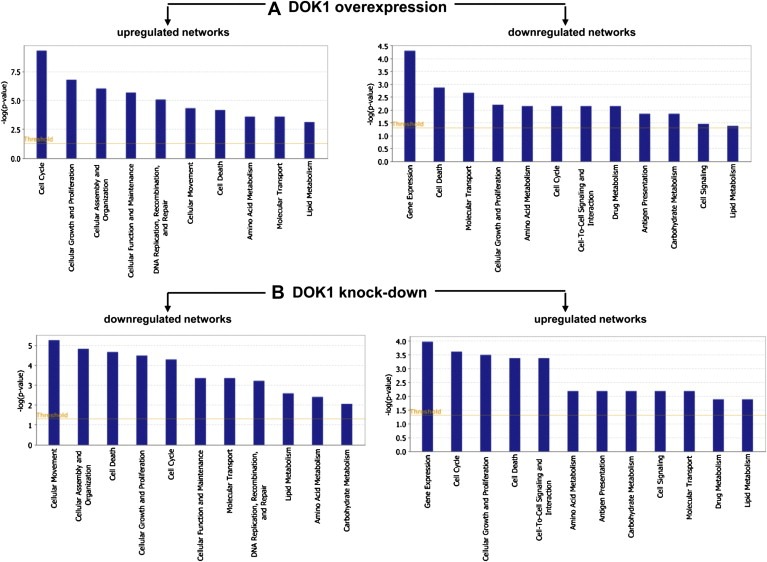
Functional analysis for a dataset of differentially expressed genes (≥2‐fold) following DOK1 overexpression and suppression in TOV112 cells. A. Functional analysis of up‐ and down‐regulated genes in TOV21 cells following DOK1 overexpression. B. Functional analysis of up‐ and down‐regulated genes in TOV21 cells following DOK1 suppression. Top functions that meet a p‐value cutoff of 0.05 are displayed.
Network analysis identified 22 highly significant networks with score ≥3 following DOK1 overexpression (see Supplemental Table 4) and 14 highly significant networks with score ≥3 upon DOK1 knockdown (see Supplemental Table 5). The five top‐scoring networks in DOK1‐overexpressing TOV112 cells were mostly associated with cellular development and morphology, cell cycle, cellular assembly and organization, DNA replication, recombination, and repair, metabolism and immune response. The five top‐scoring networks following DOK1 suppression were predominantly related to cellular morphology, cellular movement, cellular growth and proliferation, cell death and protein metabolism. Common networks obtained upon merging the five top‐scoring networks recognized some important nodes that are specifically regulated upon DOK1 overexpression or suppression in TOV112 cells (Figure 9). Thus, major nodes and associated interaction partners that were predominantly upregulated in DOK1‐overexpressing TOV112 cells, comprised different members of the collagen network (including collagens type I and type III, collagen alpha 1, COL1A2 and COL3A1), the cell cycle control protein cyclin B1 (CCNB1), and a number of genes generally involved in cell proliferation/signal transduction (MAPK, P38 MAPK, KRAS, TNNC1, TGFBR2, PPP3CA) and metabolism (GZMB, S100A10 and TFPI2) (Figure 9A). Members of the immunoglobulin complex also displayed predominant upregulation upon DOK1 induction (Figure 9A). Gene nodes, downregulated following DOK1 overexpression (Figure 9A) included members of the matrix metalloproteinase family (including MMP1), regulation of apoptosis (CASP9) and transcription (RUNX2).
Figure 9.
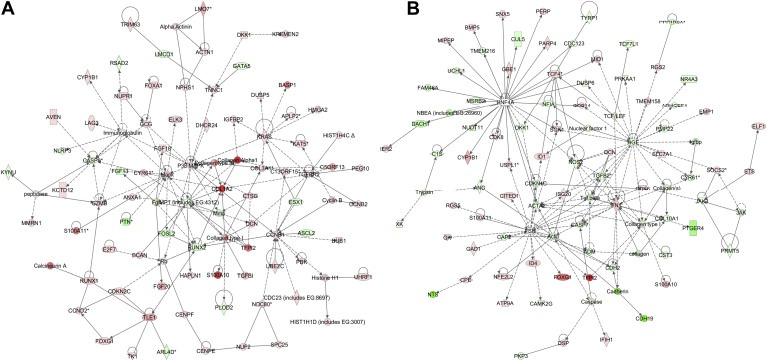
Network analysis of dynamic gene expression in TOV112 cells based on the 2‐fold common gene expression list obtained following ectopic DOK1 overexpression or shRNA‐mediated DOK1 knockdown. A. Network analysis of DOK1‐overexpressing TOV112 cells; B. Network analysis of TOV112 cells following DOK1 suppression. The five top‐scoring networks for each cell line were merged and are displayed graphically as nodes (genes/gene products) and edges (the biological relationships between the nodes). Intensity of the node color indicates the degree of up‐ (red) or downregulation (green). Nodes are displayed using various shapes that represent the functional class of the gene product (square, cytokine, vertical oval, transmembrane receptor, rectangle, nuclear receptor, diamond, enzyme, rhomboid, transporter, hexagon, translation factor, horizontal oval, transcription factor, circle, other). Edges are displayed with various labels that describe the nature of relationship between the nodes: binding only, → acts on. The length of an edge reflects the evidence supporting that node‐to‐node relationship, in that edges supported by article from literature are shorter. Dotted edges represent indirect interaction.
Gene nodes that were downregulated upon DOK1 knockdown in TOV112 cells are presented in Figure 9B; these were mostly involved in signal transduction (HGF, TGF beta, TGFB2, the HNF4A and the FSH gene networks), cell growth and maintenance (actin, ACTA2, and members of the collagen network, including collagen type I and COL10A1), metabolism (NOS2) and apoptosis (caspase, CASP7). Upregulated gene nodes following DOK1 suppression (Figure 9B) included fibronectin 1 (FN1) and the T cell factor 4 (TCF4). DOK1 knockdown also modulated different members of the hepatic nuclear factor 4α (HNF4α) network and the follicle‐stimulated hormone (FSH) network (Figure 9B).
4. Discussion
Here, we have combined pharmacologic inhibition of DNA methyltransferase with microarray analysis to identify candidate genes whose expression was silenced by aberrant DNA methylation in EOC. By cross‐referencing these genes with literature data, we identified DOK1 as a potential TSG, whose expression was induced by DNA demethylation in EOC cells. We have further shown that a stretch of DNA sequence, located between nt −1158 to −850 upstream of the DOK1 initiation (ATG) codon, is hypermethylated in ovarian tumors compared to normal ovarian tissue. However, no differences in DNA methylation were observed in regions, overlapping the transcription initiation site and the putative core promoter of the DOK1 gene. Surprisingly, DOK1 expression levels were significantly increased in EOC tumors, compared to normal tissue, indicating that the observed hypermethylation of the nt −1158 to −850 5′‐upstream non‐coding DNA domain does not influence its expression levels in EOC. Current data on aberrant DNA methylation of the DOK1 gene in cancer are rather scarce: only Lambert and colleagues (Lambert et al., 2011) have recently reported for frequent (63%) DOK1 hypermethylation in hepatocellular carcinoma (HCC) that positively correlated with decreased DOK1 expression in HCC tumors. However, the same group observed no aberrant DOK1 methylation in a number of non‐HCC liver malignancies, thus indicating that DOK1 methylation status in cancer could be tumor type‐specific (Lambert et al., 2011).
Our data are also indicative for a positive correlation of DOK1 overexpression with PFS in EOC patients, consistent with the suggested tumor suppressor function of this gene in other malignancies. Indeed, it was repeatedly revealed that DOK1, as well as DOK2, exhibit tumor‐suppressive activity in hematopoietic malignancies (Lee et al., 2004, 2007, 2004, 2004). Amongst the seven DOK family members, DOK1, DOK2 and DOK3 comprise a closely related subfamily that are believed to function together in negative‐feedback signaling loops that tightly modulate the duration and intensity of growth factor signaling (Jones and Dumont, 1999; Suzu et al., 2000; Zhao et al., 2006). These genes also display tumor suppressor roles in non‐hematopoietic malignancies. It was recently shown that triple (DOK1−/−, DOK2−/− and DOK3−/−) KO mice spontaneously develop aggressive histiocytic sarcoma (Mashima et al., 2010) and lung adenocarcinoma (Berger et al., 2010), as these studies were indicative for a strong combinatorial effect when more than one DOK gene was knocked out. Furthermore, DOK2 was identified as a haploinsufficient lung tumor suppressor in humans (Berger et al., 2010).
The above literature data, as well as our observation correlating DOK1 expression with EOC tumor‐free survival, prompted us to investigate more profoundly the possible mechanisms of DOK1 functional implication in EOC tumorigenesis; moreover, the role of DOK1 and the other DOK family genes in EOC has been not studied till now. We used the TOV112 cell line as a model EOC cell line to both ectopically overexpress and suppress the DOK1 gene, since this cell line displayed intermediate endogenous DOK1 expression levels when compared with other different EOC cell lines analyzed (data not shown). Indeed, the reverse modulation of DOK1 expression in the same EOC cells eliminates the artifacts associated with diverse genetic backgrounds of the different EOC cell lines, which is equally important for the functional analyses and the gene expression profiling experiments. Ectopic expression of DOK1 in TOV112 cells led to increased cellular motility and proliferation, whereas knockdown of endogenous DOK1 expression in TOV112 had the opposite effect. DOK1 upregulation had no significant effect on cisplatin cytotoxicity, which might be due to the existing endogenous DOK1 activity in TOV112 cells. However, DOK1 knockdown resulted in reduced sensitivity to cisplatin treatment; to certain extent, this could explain the correlation of DOK1 expression with improved PFS in EOC patients.
Our data are consistent with previous findings for a role of DOK1 in promoting cell spreading, migration and motility (Hosooka et al., 2001; Master et al., 2001; Noguchi et al., 1999; Woodring et al., 2004). The role of DOK1 in cell proliferation is rather enigmatic: while majority reports are indicative for its function as a negative regulator of the mitogen‐activated protein kinase (MAPK) pathway and cell proliferation (Lee et al., 2004a; Ott et al., 2002; Tamir et al., 2000; Yamanashi et al., 2000; Zhao et al., 2006), some data point to inverse role of DOK1 in enhancing MAPK, as well as c‐Jun amino‐terminal kinase (JNK) signaling, c‐Jun and Ras activation and cell growth (Jones and Dumont, 1999; Lamkin et al., 2006; Murakami et al., 2002). Our findings were indicative for a direct correlation of DOK1 expression with EOC cell proliferation, which could be again linked to the observed TOV112 resistance to cisplatin treatment upon DOK1 knockdown. Indeed, previous findings in our group and by others were strongly supportive of the concept that decreased cellular proliferation rate may be involved in the development of acquired EOC chemoresistance (Bachvarov et al., 2006; Cole et al., 2010; Itamochi et al., 2002; Jazaeri et al., 2005; L'Esperance et al., 2006; Tetu et al., 2008).
To better elucidate the molecular mechanisms and biological pathways implicated in DOK1‐mediated action in EOC cells, we used a complementary gene expression profiling using the DNA microarray technology to quantitatively monitor cellular changes in gene expression and discover the molecular targets of DOK1 in EOC cells. To our knowledge, the present work represents the first effort to define global changes in gene expression upon modulation of DOK1 expression in cancer cells. We analyzed both functionally related genes that were commonly differentially expressed in TOV112 EOC cells both upon DOK1 overexpression, as well as following DOK1 knockdown. The gene expression data and consecutive network and pathway analyses were quite confirmatory of the data obtained by the DOK1 functional assays. Indeed, microarray data sustained DOK1 association with increased cellular motility and proliferation, as pathways functionally related to cellular movement, cellular assembly and organization, cellular function and maintenance and DNA replication, recombination and repair, were mostly induced upon DOK1 overexpression and suppressed upon DOK1 knockdown (Figure 8). Pathways, associated with gene expression, cell signaling and cell interactions and antigen presentation were predominantly downregulated following DOK1 overexpression and induced after DOK1 knockdown. These results were not unexpected, since the DOK1 adapter protein has consistently been shown to be negatively involved in different signaling pathways (Gerard et al., 2004; Hosooka et al., 2001; Hubert et al., 1993; Nemorin et al., 2001; Tamir et al., 2000; Yamanashi et al., 2000; Yasuda et al., 2007; Zhao et al., 2006), including the antigen signaling cascade in T cells (Cole et al., 2010; Yasuda et al., 2007). Interestingly, pathways implicated in drug metabolism were also downregulated following DOK1 overexpression and induced upon DOK1 knockdown (Figure 8), which could be associated with the observed reduced sensitivity of the shRNA‐DOK1(sh1) clone to cisplatin treatment. DOK1‐mediated transcriptomics effects were relatively similar on genes and pathways linked to cell cycle control, cellular growth and proliferation, cell death, metabolism and molecular transport, both upon DOK1 overexpression and suppression (Figure 8).
IPA network analysis was indicative for some important gene nodes linked to DOK1 modulation in EOC cells, as most of these substantiate and/or complement the functional data obtained. Thus, major gene nodes that were both induced in the pCMV‐DOK1(c3) TOV112 clone and suppressed in the shRNA‐DOK1(sh1) TOV112 clone comprised genes encoding different structural cell components, including troponin C type 1 (TNNC1), actins and different members of the collagen network, which are known to be implicated in cellular morphology, as well as in increased cellular growth and migration (Babuin and Jaffe, 2005; Bartling et al., 2009; Ichii et al., 2001; Ip et al., 2011; Krudy et al., 1994; Petit et al., 2000; Piehl et al., 2007). Indeed, collagens type I and type III, collagen alpha 1, COL1A2, COL3A1 and TNNC1 were upregulated upon DOK1 overexpression (Figure 9A), while DOK1 knockdown caused downregulation of collagen type I, COL10A1, other collagens, as well as some members of the actin gene family, including actin and ACTA2 (Figure 9B).
Similarly different genes, mostly implicated in mechanisms of cell proliferation, were induced in DOK1‐overexpressing TOV112 cells and suppressed following DOK1 knockdown. Accordingly, cyclin B1 (CCNB1), MAPK, P38 MAPK, the v‐Ki‐ras2 Kirsten rat sarcoma viral oncogene homolog (KRAS), the transducin‐like enhancer of split 1 (TLE1), the tissue factor pathway inhibitor 2 (TFPI2) and the transforming growth factor, beta receptor II (TGFBR2) were upregulated following DOK1 overexpression (Figure 9A), while the hepatocyte growth factor (HGF), TGFB2 and the nitric oxide synthase 2 (NOS2) displayed downregulation upon DOK1 knockdown (Figure 9B). Several of these genes (CNNB1, TLE1; TFPI2; TGFBR2, TGFB2, NOS2), as well as the granzyme B (GZMB) gene (upregulated in DOK1‐overexpressing TOV112 cells) could be also involved in mechanisms of regulation of cell death (Dayyani et al., 2008; Porter et al., 2000; Shi et al., 2000; Sun et al., 2004; Sunde et al., 2006; Wang et al., 2010).
Additionally, the DOK1‐mediated modulation of some of these gene nodes was symptomatic for the presumed tumor suppressor role of this gene in EOC. Thus, DOK1 expression correlated with the expression of TFPI2, a suggested tumor suppressor in EOC (Zhong et al., 2003), as well as with the expression of TGFBR2 (induced upon DOK1 overexpression) and TGFB2 (suppressed following DOK1 knockdown). It has been repeatedly shown that EOC is resistant to the antiproliferative and pro‐apoptotic effects of the TGFB pathway (Massague et al., 2000; Yamada et al., 1999), and DOK1 could contribute to partially overcoming this resistance. Moreover, a number of metastasis‐related genes, including the Runt related transcription factor 2 (RUNX2), matrix metalloproteinase (MMP) and MMP1, fibronectin 1 (FN1) and the transcription factor 4 (TCF4) (Gialeli et al., 2011; Kolligs et al., 2002; Mitra et al., 2011; Pratap et al., 2005), were suppressed upon DOK1 overexpression (RUNX2, MMP, MMP1), or induced following DOK1 knockdown (FN, TCF4). Also, DOK1‐mediated induction of MAPK pathways may be consistent with the emerging paradigm of MAPK driven cell differentiation and apoptosis in cancer cells (Blagosklonny, 1998; Gallea et al., 2001; Lai et al., 2001; Woessmann and Mivechi, 2001).
Finally, alterations in DOK1 expression in TOV112 cells modulated the expression of different genes belonging to the immunoglobulin complex, as well as the HNF4α and the FSH networks. Indeed, DOK1 expression displayed a predominantly positive correlation with the expression of specific members of the immunoglobulin complex (Figure 9A), shown to potentially decrease tumor growth in leukemia and lymphoma animal models (Crepin et al., 2010). DOK1 knockdown triggered both predominant induction of different components of the FSH gene network, and suppression of most of the members of the HNF4α gene network (Figure 9B). The inverse correlation between FSH gene network and DOK1 expression supports a putative DOK1 protective function in EOC, since FSH and its related genes were previously shown to increase the risk of ovarian malignancy and to play an important role in ovarian carcinogenesis (Huang et al., 2010). As for the HNF4α gene network, the current literature data on the implications of HNF4α and its network members in cancerogenesis are rather conflicting. Indeed, HNF4α is a potent transcription factor, which regulates the expression of multiple components within all three key compartments of the cell–cell junction, namely the adherens junction, the tight junction and the desmosome (Battle et al., 2006). A role for HNF4α was suggested in tumor genesis, aggressiveness and metastases in various tumors, including lung, colorectal and mucinous ovarian tumors (Li et al., 2007; Schwartz et al., 2009; Sugai et al., 2008); however, recently HNF4α was also characterized as a HCC TSG (Ning et al., 2010). Thus, the HNF4α implication in ovarian carcinogenesis remains to be established.
5. Conclusions
By using a pharmacologic inhibition of DNA methyltransferase in EOC cells combined with microarray analysis, we have identified DOK1 as a potentially hypermethylated gene in EOC cells. Indeed, a 5′‐upstream non‐coding DNA domain, spanning between nt −1158 to −850 upstream of the DOK1 transcription initiating site, was identified to be hypermethylated in EOC tumors, compared to normal ovarian tissue. However, no hypermethylated DNA regions were identified around or closer to the core promoter of the DOK1 gene and consecutive analyses have shown no effect of this DNA hypermethylation on DOK1 expression in EOC tumors. Moreover, DOK1 was found to be significantly overexpressed in EOC tumors, as this overexpression was associated with improved PFS values of serous EOC patients. Further functional analyses of DOK in EOC cells pointed toward association of DOK1 expression with increased EOC cell migration and proliferation, and better sensitivity to cisplatin treatment. Gene expression profiling and consecutive network and pathway analyses were also confirmative for DOK1 association with EOC cell migration and proliferation. These analyses were also indicative for DOK1 protective role in EOC tumorigenesis, linked to DOK1‐mediated induction of some tumor suppressor factors and its suppression of metastasis‐related genes. Thus, the majority of our data point toward a possible tumor suppressor role of DOK1 in EOC; however its implication in enhanced EOC cell migration and proliferation restrain us to conclude that DOK1 represents a TSG in EOC. Moreover, DOK1 role in EOC should be also addressed in the context of its relations with other members of the DOK gene family, especially with its closer functional homologs DOK2 and DOK3. Further studies, including these and other DOK genes members are needed to more fully elucidate the functional implications of the members of the DOK gene family in ovarian tumorigenesis.
Conflict of interest
None declared.
Supporting information
The following are the Supplementary data related to this article:
Supplementary data
Supplementary data
Supplementary data
Supplementary data
Supplementary data
Acknowledgments
This study was sustained by grants to D.B. from the Cancer Research Society (CRS) of Canada and The Collaborative Health Research Projects (CHRP) Program of the Natural Sciences and Engineering Research Council (NSERC) of Canada, and by the support of the Cancer Research Network of the “Fonds de la Recherche en Santé du Québec” (FRSQ), Québec, Canada.
Supplementary material 1.
Supplementary data related to this article can be found online at doi:10.1016/j.molonc.2011.07.003.
Mercier Pierre-Luc, Bachvarova Magdalena, Plante Marie, Gregoire Jean, Renaud Marie-Claude, Ghani Karim, Têtu Bernard, Bairati Isabelle and Bachvarov Dimcho, (2011), Characterization of DOK1, a candidate tumor suppressor gene, in epithelial ovarian cancer, Molecular Oncology, 5, doi: 10.1016/j.molonc.2011.07.003.
References
- Babuin, L. , Jaffe, A.S. , 2005. Troponin: the biomarker of choice for the detection of cardiac injury. Canadian Medical Association Journal. 173, 1191–1202. [DOI] [PMC free article] [PubMed] [Google Scholar]
- Bachvarov, D. , L'Esperance, S. , Popa, I. , Bachvarova, M. , Plante, M. , Tetu, B. , 2006. Gene expression patterns of chemoresistant and chemosensitive serous epithelial ovarian tumors with possible predictive value in response to initial chemotherapy. International Journal of Oncology. 29, 919–933. [PubMed] [Google Scholar]
- Balch, C. , Huang, T.H. , Brown, R. , Nephew, K.P. , 2004. The epigenetics of ovarian cancer drug resistance and resensitization. American Journal of Obstetrics and Gynecology. 191, 1552–1572. [DOI] [PubMed] [Google Scholar]
- Bartling, B. , Desole, M. , Rohrbach, S. , Silber, R.E. , Simm, A. , 2009. Age-associated changes of extracellular matrix collagen impair lung cancer cell migration. Faseb Journal. 23, 1510–1520. [DOI] [PubMed] [Google Scholar]
- Barton, C.A. , Hacker, N.F. , Clark, S.J. , O'Brien, P.M. , 2008. DNA methylation changes in ovarian cancer: implications for early diagnosis, prognosis and treatment. Gynecologic Oncology. 109, 129–139. [DOI] [PubMed] [Google Scholar]
- Battle, M.A. , Konopka, G. , Parviz, F. , Gaggl, A.L. , Yang, C. , Sladek, F.M. , Duncan, S.A. , 2006. Hepatocyte nuclear factor 4alpha orchestrates expression of cell adhesion proteins during the epithelial transformation of the developing liver. Proceedings of the National Academy of Sciences of the United States of America. 103, 8419–8424. [DOI] [PMC free article] [PubMed] [Google Scholar]
- Baylin, S.B. , Esteller, M. , Rountree, M.R. , Bachman, K.E. , Schuebel, K. , Herman, J.G. , 2001. Aberrant patterns of DNA methylation, chromatin formation and gene expression in cancer. Human Molecular Genetics. 10, 687–692. [DOI] [PubMed] [Google Scholar]
- Berger, A.H. , Niki, M. , Morotti, A. , Taylor, B.S. , Socci, N.D. , Viale, A. , Brennan, C. , Szoke, J. , Motoi, N. , Rothman, P.B. , Teruya-Feldstein, J. , Gerald, W.L. , Ladanyi, M. , Pandolfi, P.P. , 2010. Identification of DOK genes as lung tumor suppressors. Nature Genetics. 42, 216–223. [DOI] [PMC free article] [PubMed] [Google Scholar]
- Blagosklonny, M.V. , 1998. The mitogen-activated protein kinase pathway mediates growth arrest or E1A-dependent apoptosis in SKBR3 human breast cancer cells. International Journal of Cancer. 78, 511–517. [DOI] [PubMed] [Google Scholar]
- Cai, D. , Dhe-Paganon, S. , Melendez, P.A. , Lee, J. , Shoelson, S.E. , 2003. Two new substrates in insulin signaling, IRS5/DOK4 and IRS6/DOK5. The Journal of Biological Chemistry. 278, 25323–25330. [DOI] [PubMed] [Google Scholar]
- Carpino, N. , Wisniewski, D. , Strife, A. , Marshak, D. , Kobayashi, R. , Stillman, B. , Clarkson, B. , 1997. p62(dok): a constitutively tyrosine-phosphorylated, GAP-associated protein in chronic myelogenous leukemia progenitor cells. Cell. 88, 197–204. [DOI] [PubMed] [Google Scholar]
- Cole, C. , Lau, S. , Backen, A. , Clamp, A. , Rushton, G. , Dive, C. , Hodgkinson, C. , McVey, R. , Kitchener, H. , Jayson, G.C. , 2010. Inhibition of FGFR2 and FGFR1 increases cisplatin sensitivity in ovarian cancer. Cancer Biology & Therapy. 10, 495–504. [DOI] [PMC free article] [PubMed] [Google Scholar]
- Crepin, R. , Goenaga, A.L. , Jullienne, B. , Bougherara, H. , Legay, C. , Benihoud, K. , Marks, J.D. , Poul, M.A. , 2010. Development of human single-chain antibodies to the transferrin receptor that effectively antagonize the growth of leukemias and lymphomas. Cancer Research. 70, 5497–5506. [DOI] [PubMed] [Google Scholar]
- Dayyani, F. , Wang, J. , Yeh, J.R. , Ahn, E.Y. , Tobey, E. , Zhang, D.E. , Bernstein, I.D. , Peterson, R.T. , Sweetser, D.A. , 2008. Loss of TLE1 and TLE4 from the del(9q) commonly deleted region in AML cooperates with AML1-ETO to affect myeloid cell proliferation and survival. Blood. 111, 4338–4347. [DOI] [PMC free article] [PubMed] [Google Scholar]
- Esteller, M. , 2006. Epigenetics provides a new generation of oncogenes and tumour-suppressor genes. British Journal of Cancer. 94, 179–183. [DOI] [PMC free article] [PubMed] [Google Scholar]
- Gallea, S. , Lallemand, F. , Atfi, A. , Rawadi, G. , Ramez, V. , Spinella-Jaegle, S. , Kawai, S. , Faucheu, C. , Huet, L. , Baron, R. , Roman-Roman, S. , 2001. Activation of mitogen-activated protein kinase cascades is involved in regulation of bone morphogenetic protein-2-induced osteoblast differentiation in pluripotent C2C12 cells. Bone. 28, 491–498. [DOI] [PubMed] [Google Scholar]
- Gerard, A. , Favre, C. , Garcon, F. , Nemorin, J.G. , Duplay, P. , Pastor, S. , Collette, Y. , Olive, D. , Nunes, J.A. , 2004. Functional interaction of RasGAP-binding proteins Dok-1 and Dok-2 with the Tec protein tyrosine kinase. Oncogene. 23, 1594–1598. [DOI] [PubMed] [Google Scholar]
- Gialeli, C. , Theocharis, A.D. , Karamanos, N.K. , 2011. Roles of matrix metalloproteinases in cancer progression and their pharmacological targeting. The FEBS Journal. 278, 16–27. [DOI] [PubMed] [Google Scholar]
- Hosooka, T. , Noguchi, T. , Nagai, H. , Horikawa, T. , Matozaki, T. , Ichihashi, M. , Kasuga, M. , 2001. Inhibition of the motility and growth of B16F10 mouse melanoma cells by dominant negative mutants of Dok-1. Molecular and Cellular Biology. 21, 5437–5446. [DOI] [PMC free article] [PubMed] [Google Scholar]
- Huang, Y. , Jin, H. , Liu, Y. , Zhou, J. , Ding, J. , Cheng, K.W. , Yu, Y. , Feng, Y. , 2010. FSH inhibits ovarian cancer cell apoptosis by up-regulating survivin and down-regulating PDCD6 and DR5. Endocrine-Related Cancer. 18, 13–26. [DOI] [PubMed] [Google Scholar]
- Hubert, P. , Debre, P. , Boumsell, L. , Bismuth, G. , 1993. Tyrosine phosphorylation and association with phospholipase C gamma-1 of the GAP-associated 62-kD protein after CD2 stimulation of Jurkat T cell. The Journal of Experimental Medicine. 178, 1587–1596. [DOI] [PMC free article] [PubMed] [Google Scholar]
- Ichii, T. , Koyama, H. , Tanaka, S. , Kim, S. , Shioi, A. , Okuno, Y. , Raines, E.W. , Iwao, H. , Otani, S. , Nishizawa, Y. , 2001. Fibrillar collagen specifically regulates human vascular smooth muscle cell genes involved in cellular responses and the pericellular matrix environment. Circulation Research. 88, 460–467. [DOI] [PubMed] [Google Scholar]
- Ip, C.K. , Cheung, A.N. , Ngan, H.Y. , Wong, A.S. , 2011. p70 S6 kinase in the control of actin cytoskeleton dynamics and directed migration of ovarian cancer cells. Oncogene. [DOI] [PubMed] [Google Scholar]
- Itamochi, H. , Kigawa, J. , Sugiyama, T. , Kikuchi, Y. , Suzuki, M. , Terakawa, N. , 2002. Low proliferation activity may be associated with chemoresistance in clear cell carcinoma of the ovary. Obstetrics and Gynecology. 100, 281–287. [DOI] [PubMed] [Google Scholar]
- Jazaeri, A.A. , Awtrey, C.S. , Chandramouli, G.V. , Chuang, Y.E. , Khan, J. , Sotiriou, C. , Aprelikova, O. , Yee, C.J. , Zorn, K.K. , Birrer, M.J. , Barrett, J.C. , Boyd, J. , 2005. Gene expression profiles associated with response to chemotherapy in epithelial ovarian cancers. Clinical Cancer Research. 11, 6300–6310. [DOI] [PubMed] [Google Scholar]
- Jemal, A. , Siegel, R. , Xu, J. , Ward, E. , 2010. Cancer statistics. CA: A Cancer Journal for Clinicians. 60, 277–300. [DOI] [PubMed] [Google Scholar]
- Jones, P.A. , Baylin, S.B. , 2007. The epigenomics of cancer. Cell. 128, 683–692. [DOI] [PMC free article] [PubMed] [Google Scholar]
- Jones, N. , Dumont, D.J. , 1999. Recruitment of Dok-R to the EGF receptor through its PTB domain is required for attenuation of Erk MAP kinase activation. Current Biology. 9, 1057–1060. [DOI] [PubMed] [Google Scholar]
- Jutras, S. , Bachvarova, M. , Keita, M. , Bascands, J.L. , Mes-Masson, A.M. , Stewart, J.M. , Gera, L. , Bachvarov, D. , 2010. Strong cytotoxic effect of the bradykinin antagonist BKM-570 in ovarian cancer cells–analysis of the molecular mechanisms of its antiproliferative action. The FEBS Journal. 277, 5146–5160. [DOI] [PubMed] [Google Scholar]
- Kolligs, F.T. , Nieman, M.T. , Winer, I. , Hu, G. , Van Mater, D. , Feng, Y. , Smith, I.M. , Wu, R. , Zhai, Y. , Cho, K.R. , Fearon, E.R. , 2002. ITF-2, a downstream target of the Wnt/TCF pathway, is activated in human cancers with beta-catenin defects and promotes neoplastic transformation. Cancer Cell. 1, 145–155. [DOI] [PubMed] [Google Scholar]
- Krudy, G.A. , Kleerekoper, Q. , Guo, X. , Howarth, J.W. , Solaro, R.J. , Rosevear, P.R. , 1994. NMR studies delineating spatial relationships within the cardiac troponin I-troponin C complex. The Journal of Biological Chemistry. 269, 23731–23735. [PubMed] [Google Scholar]
- L'Esperance, S. , Bachvarova, M. , Tetu, B. , Mes-Masson, A.M. , Bachvarov, D. , 2008. Global gene expression analysis of early response to chemotherapy treatment in ovarian cancer spheroids. BMC Genomics. 9, 99 [DOI] [PMC free article] [PubMed] [Google Scholar]
- L'Esperance, S. , Popa, I. , Bachvarova, M. , Plante, M. , Patten, N. , Wu, L. , Tetu, B. , Bachvarov, D. , 2006. Gene expression profiling of paired ovarian tumors obtained prior to and following adjuvant chemotherapy: molecular signatures of chemoresistant tumors. International Journal of Oncology. 29, 5–24. [PubMed] [Google Scholar]
- Lai, C.F. , Chaudhary, L. , Fausto, A. , Halstead, L.R. , Ory, D.S. , Avioli, L.V. , Cheng, S.L. , 2001. Erk is essential for growth, differentiation, integrin expression, and cell function in human osteoblastic cells. The Journal of Biological Chemistry. 276, 14443–14450. [DOI] [PubMed] [Google Scholar]
- Lambert, M.P. , Paliwal, A. , Vaissiere, T. , Chemin, I. , Zoulim, F. , Tommasino, M. , Hainaut, P. , Sylla, B. , Scoazec, J.Y. , Tost, J. , Herceg, Z. , 2011. Aberrant DNA methylation distinguishes hepatocellular carcinoma associated with HBV and HCV infection and alcohol intake. Journal of Hepatology. 54, 705–715. [DOI] [PubMed] [Google Scholar]
- Lamkin, T.J. , Chin, V. , Yen, A. , 2006. All-trans retinoic acid induces p62DOK1 and p56DOK2 expression which enhances induced differentiation and G0 arrest of HL-60 leukemia cells. American Journal of Hematology. 81, 603–615. [DOI] [PubMed] [Google Scholar]
- Lee, S. , Andrieu, C. , Saltel, F. , Destaing, O. , Auclair, J. , Pouchkine, V. , Michelon, J. , Salaun, B. , Kobayashi, R. , Jurdic, P. , Kieff, E.D. , Sylla, B.S. , 2004. IkappaB kinase beta phosphorylates Dok1 serines in response to TNF, IL-1, or gamma radiation. Proceedings of the National Academy of Sciences of the United States of America. 101, 17416–17421. [DOI] [PMC free article] [PubMed] [Google Scholar]
- Lee, S. , Roy, F. , Galmarini, C.M. , Accardi, R. , Michelon, J. , Viller, A. , Cros, E. , Dumontet, C. , Sylla, B.S. , 2004. Frameshift mutation in the Dok1 gene in chronic lymphocytic leukemia. Oncogene. 23, 2287–2297. [DOI] [PubMed] [Google Scholar]
- Lee, S. , Huang, H. , Niu, Y. , Tommasino, M. , Lenoir, G. , Sylla, B.S. , 2007. Dok1 expression and mutation in Burkitt's lymphoma cell lines. Cancer Letters. 245, 44–50. [DOI] [PubMed] [Google Scholar]
- Li, Y. , Du, H. , Qin, Y. , Roberts, J. , Cummings, O.W. , Yan, C. , 2007. Activation of the signal transducers and activators of the transcription 3 pathway in alveolar epithelial cells induces inflammation and adenocarcinomas in mouse lung. Cancer Research. 67, 8494–8503. [DOI] [PubMed] [Google Scholar]
- Maier, S. , Dahlstroem, C. , Haefliger, C. , Plum, A. , Piepenbrock, C. , 2005. Identifying DNA methylation biomarkers of cancer drug response. American Journal of Pharmacogenomics. 5, 223–232. [DOI] [PubMed] [Google Scholar]
- Marchetti, C. , Pisano, C. , Facchini, G. , Bruni, G.S. , Magazzino, F.P. , Losito, S. , Pignata, S. , 2010. First-line treatment of advanced ovarian cancer: current research and perspectives. Expert Review of Anticancer Therapy. 10, 47–60. [DOI] [PubMed] [Google Scholar]
- Mashima, R. , Honda, K. , Yang, Y. , Morita, Y. , Inoue, A. , Arimura, S. , Nishina, H. , Ema, H. , Nakauchi, H. , Seed, B. , Oda, H. , Yamanashi, Y. , 2010. Mice lacking Dok-1, Dok-2, and Dok-3 succumb to aggressive histiocytic sarcoma. Laboratory Investigation; A Journal of Technical Methods and Pathology. 90, 1357–1364. [DOI] [PubMed] [Google Scholar]
- Massague, J. , Blain, S.W. , Lo, R.S. , 2000. TGFbeta signaling in growth control, cancer, and heritable disorders. Cell. 103, 295–309. [DOI] [PubMed] [Google Scholar]
- Master, Z. , Jones, N. , Tran, J. , Jones, J. , Kerbel, R.S. , Dumont, D.J. , 2001. Dok-R plays a pivotal role in angiopoietin-1-dependent cell migration through recruitment and activation of Pak. The EMBO Journal. 20, 5919–5928. [DOI] [PMC free article] [PubMed] [Google Scholar]
- Mitra, A.K. , Sawada, K. , Tiwari, P. , Mui, K. , Gwin, K. , Lengyel, E. , 2011. Ligand-independent activation of c-Met by fibronectin and alpha(5)beta(1)-integrin regulates ovarian cancer invasion and metastasis. Oncogene. 30, 1566–1576. [DOI] [PMC free article] [PubMed] [Google Scholar]
- Mok, S.C. , Kwong, J. , Welch, W.R. , Samimi, G. , Ozbun, L. , Bonome, T. , Birrer, M.J. , Berkowitz, R.S. , Wong, K.K. , 2007. Etiology and pathogenesis of epithelial ovarian cancer. Disease Markers. 23, 367–376. [DOI] [PMC free article] [PubMed] [Google Scholar]
- Momparler, R.L. , 2003. Cancer epigenetics. Oncogene. 22, 6479–6483. [DOI] [PubMed] [Google Scholar]
- Murakami, H. , Yamamura, Y. , Shimono, Y. , Kawai, K. , Kurokawa, K. , Takahashi, M. , 2002. Role of Dok1 in cell signaling mediated by RET tyrosine kinase. The Journal of Biological Chemistry. 277, 32781–32790. [DOI] [PubMed] [Google Scholar]
- Nemorin, J.G. , Laporte, P. , Berube, G. , Duplay, P. , 2001. p62dok negatively regulates CD2 signaling in Jurkat cells. Journal of Immunology. 166, 4408–4415. [DOI] [PubMed] [Google Scholar]
- Niki, M. , Di Cristofano, A. , Zhao, M. , Honda, H. , Hirai, H. , Van Aelst, L. , Cordon-Cardo, C. , Pandolfi, P.P. , 2004. Role of Dok-1 and Dok-2 in leukemia suppression. The Journal of Experimental Medicine. 200, 1689–1695. [DOI] [PMC free article] [PubMed] [Google Scholar]
- Ning, B.F. , Ding, J. , Yin, C. , Zhong, W. , Wu, K. , Zeng, X. , Yang, W. , Chen, Y.X. , Zhang, J.P. , Zhang, X. , Wang, H.Y. , Xie, W.F. , 2010. Hepatocyte nuclear factor 4 alpha suppresses the development of hepatocellular carcinoma. Cancer Research. 70, 7640–7651. [DOI] [PubMed] [Google Scholar]
- Noguchi, T. , Matozaki, T. , Inagaki, K. , Tsuda, M. , Fukunaga, K. , Kitamura, Y. , Kitamura, T. , Shii, K. , Yamanashi, Y. , Kasuga, M. , 1999. Tyrosine phosphorylation of p62(Dok) induced by cell adhesion and insulin: possible role in cell migration. The EMBO Journal. 18, 1748–1760. [DOI] [PMC free article] [PubMed] [Google Scholar]
- Ott, V.L. , Tamir, I. , Niki, M. , Pandolfi, P.P. , Cambier, J.C. , 2002. Downstream of kinase, p62(dok), is a mediator of Fc gamma IIB inhibition of Fc epsilon RI signaling. Journal of Immunology. 168, 4430–4439. [DOI] [PubMed] [Google Scholar]
- Petit, V. , Boyer, B. , Lentz, D. , Turner, C.E. , Thiery, J.P. , Valles, A.M. , 2000. Phosphorylation of tyrosine residues 31 and 118 on paxillin regulates cell migration through an association with CRK in NBT-II cells. The Journal of Cell Biology. 148, 957–970. [DOI] [PMC free article] [PubMed] [Google Scholar]
- Piehl, M. , Lehmann, C. , Gumpert, A. , Denizot, J.P. , Segretain, D. , Falk, M.M. , 2007. Internalization of large double-membrane intercellular vesicles by a clathrin-dependent endocytic process. Molecular Biology of the Cell. 18, 337–347. [DOI] [PMC free article] [PubMed] [Google Scholar]
- Porter, L.A. , Singh, G. , Lee, J.M. , 2000. Abundance of cyclin B1 regulates gamma-radiation-induced apoptosis. Blood. 95, 2645–2650. [PubMed] [Google Scholar]
- Pratap, J. , Javed, A. , Languino, L.R. , van Wijnen, A.J. , Stein, J.L. , Stein, G.S. , Lian, J.B. , 2005. The Runx2 osteogenic transcription factor regulates matrix metalloproteinase 9 in bone metastatic cancer cells and controls cell invasion. Molecular and Cellular Biology. 25, 8581–8591. [DOI] [PMC free article] [PubMed] [Google Scholar]
- Schwartz, B. , Algamas-Dimantov, A. , Hertz, R. , Nataf, J. , Kerman, A. , Peri, I. , Bar-Tana, J. , 2009. Inhibition of colorectal cancer by targeting hepatocyte nuclear factor-4alpha. International Journal of Cancer. 124, 1081–1089. [DOI] [PubMed] [Google Scholar]
- Shi, Q. , Xiong, Q. , Wang, B. , Le, X. , Khan, N.A. , Xie, K. , 2000. Influence of nitric oxide synthase II gene disruption on tumor growth and metastasis. Cancer Research. 60, 2579–2583. [PubMed] [Google Scholar]
- Sugai, M. , Umezu, H. , Yamamoto, T. , Jiang, S. , Iwanari, H. , Tanaka, T. , Hamakubo, T. , Kodama, T. , Naito, M. , 2008. Expression of hepatocyte nuclear factor 4 alpha in primary ovarian mucinous tumors. Pathology International. 58, 681–686. [DOI] [PubMed] [Google Scholar]
- Sun, J. , Bird, C.H. , Thia, K.Y. , Matthews, A.Y. , Trapani, J.A. , Bird, P.I. , 2004. Granzyme B encoded by the commonly occurring human RAH allele retains pro-apoptotic activity. The Journal of Biological Chemistry. 279, 16907–16911. [DOI] [PubMed] [Google Scholar]
- Sunde, J.S. , Donninger, H. , Wu, K. , Johnson, M.E. , Pestell, R.G. , Rose, G.S. , Mok, S.C. , Brady, J. , Bonome, T. , Birrer, M.J. , 2006. Expression profiling identifies altered expression of genes that contribute to the inhibition of transforming growth factor-beta signaling in ovarian cancer. Cancer Research. 66, 8404–8412. [DOI] [PubMed] [Google Scholar]
- Suzu, S. , Tanaka-Douzono, M. , Nomaguchi, K. , Yamada, M. , Hayasawa, H. , Kimura, F. , Motoyoshi, K. , 2000. p56(dok-2) as a cytokine-inducible inhibitor of cell proliferation and signal transduction. The EMBO Journal. 19, 5114–5122. [DOI] [PMC free article] [PubMed] [Google Scholar]
- Tamir, I. , Stolpa, J.C. , Helgason, C.D. , Nakamura, K. , Bruhns, P. , Daeron, M. , Cambier, J.C. , 2000. The RasGAP-binding protein p62dok is a mediator of inhibitory FcgammaRIIB signals in B cells. Immunity. 12, 347–358. [DOI] [PubMed] [Google Scholar]
- Tetu, B. , Popa, I. , Bairati, I. , L'Esperance, S. , Bachvarova, M. , Plante, M. , Harel, F. , Bachvarov, D. , 2008. Immunohistochemical analysis of possible chemoresistance markers identified by micro-arrays on serous ovarian carcinomas. Modern Pathology. 21, 1002–1010. [DOI] [PubMed] [Google Scholar]
- Vergote, I. , Rustin, G.J. , Eisenhauer, E.A. , Kristensen, G.B. , Pujade-Lauraine, E. , Parmar, M.K. , Friedlander, M. , Jakobsen, A. , Vermorken, J.B. , 2000. Re: new guidelines to evaluate the response to treatment in solid tumors [ovarian cancer]. gynecologic cancer intergroup. Journal of the National Cancer Institute. 92, 1534–1535. [DOI] [PubMed] [Google Scholar]
- Wang, S. , Xiao, X. , Zhou, X. , Huang, T. , Du, C. , Yu, N. , Mo, Y. , Lin, L. , Zhang, J. , Ma, N. , Murata, M. , Huang, G. , Zhang, Z. , 2010. TFPI-2 is a putative tumor suppressor gene frequently inactivated by promoter hypermethylation in nasopharyngeal carcinoma. BMC Cancer. 10, 617 [DOI] [PMC free article] [PubMed] [Google Scholar]
- Woessmann, W. , Mivechi, N.F. , 2001. Role of ERK activation in growth and erythroid differentiation of K562 cells. Experimental Cell Research. 264, 193–200. [DOI] [PubMed] [Google Scholar]
- Woodring, P.J. , Meisenhelder, J. , Johnson, S.A. , Zhou, G.L. , Field, J. , Shah, K. , Bladt, F. , Pawson, T. , Niki, M. , Pandolfi, P.P. , Wang, J.Y. , Hunter, T. , 2004. c-Abl phosphorylates Dok1 to promote filopodia during cell spreading. The Journal of Cell Biology. 165, 493–503. [DOI] [PMC free article] [PubMed] [Google Scholar]
- Wu, L. , Bijian, K. , Shen, S.H. , 2009. CD45 recruits adapter protein DOK-1 and negatively regulates JAK-STAT signaling in hematopoietic cells. Molecular Immunology. 46, 2167–2177. [DOI] [PubMed] [Google Scholar]
- Yamada, S.D. , Baldwin, R.L. , Karlan, B.Y. , 1999. Ovarian carcinoma cell cultures are resistant to TGF-beta1-mediated growth inhibition despite expression of functional receptors. Gynecologic Oncology. 75, 72–77. [DOI] [PubMed] [Google Scholar]
- Yamakawa, N. , Tsuchida, K. , Sugino, H. , 2002. The rasGAP-binding protein, Dok-1, mediates activin signaling via serine/threonine kinase receptors. The EMBO Journal. 21, 1684–1694. [DOI] [PMC free article] [PubMed] [Google Scholar]
- Yamanashi, Y. , Baltimore, D. , 1997. Identification of the Abl- and rasGAP-associated 62 kDa protein as a docking protein, Dok. Cell. 88, 205–211. [DOI] [PubMed] [Google Scholar]
- Yamanashi, Y. , Tamura, T. , Kanamori, T. , Yamane, H. , Nariuchi, H. , Yamamoto, T. , Baltimore, D. , 2000. Role of the rasGAP-associated docking protein p62(dok) in negative regulation of B cell receptor-mediated signaling. Genes & Development. 14, 11–16. [PMC free article] [PubMed] [Google Scholar]
- Yasuda, T. , Shirakata, M. , Iwama, A. , Ishii, A. , Ebihara, Y. , Osawa, M. , Honda, K. , Shinohara, H. , Sudo, K. , Tsuji, K. , Nakauchi, H. , Iwakura, Y. , Hirai, H. , Oda, H. , Yamamoto, T. , Yamanashi, Y. , 2004. Role of Dok-1 and Dok-2 in myeloid homeostasis and suppression of leukemia. The Journal of Experimental Medicine. 200, 1681–1687. [DOI] [PMC free article] [PubMed] [Google Scholar]
- Yasuda, T. , Bundo, K. , Hino, A. , Honda, K. , Inoue, A. , Shirakata, M. , Osawa, M. , Tamura, T. , Nariuchi, H. , Oda, H. , Yamamoto, T. , Yamanashi, Y. , 2007. Dok-1 and Dok-2 are negative regulators of T cell receptor signaling. International Immunology. 19, 487–495. [DOI] [PubMed] [Google Scholar]
- Zhao, M. , Janas, J.A. , Niki, M. , Pandolfi, P.P. , Van Aelst, L. , 2006. Dok-1 independently attenuates Ras/mitogen-activated protein kinase and Src/c-myc pathways to inhibit platelet-derived growth factor-induced mitogenesis. Molecular and Cellular Biology. 26, 2479–2489. [DOI] [PMC free article] [PubMed] [Google Scholar]
- Zhong, R. , Huang, R.B. , Song, S.J. , 2003. [Role of tissue factor pathway inhibitor-2 in ovarian tumor migration and invasion]. Ai Zheng = Aizheng = Chinese Journal of Cancer. 22, 1038–1041. [PubMed] [Google Scholar]
Associated Data
This section collects any data citations, data availability statements, or supplementary materials included in this article.
Supplementary Materials
The following are the Supplementary data related to this article:
Supplementary data
Supplementary data
Supplementary data
Supplementary data
Supplementary data