

Abstract
The cellular response to DNA damage is vital for maintaining genomic stability and preventing undue cell death or cancer formation. The DNA damage response (DDR), most robustly mobilized by double‐strand breaks (DSBs), rapidly activates an extensive signaling network that affects numerous cellular systems, leading to cell survival or programmed cell death. A major component of the DDR is the widespread modulation of gene expression. We analyzed together six datasets that probed transcriptional responses to ionizing radiation (IR) – our novel experimental data and 5 published datasets – to elucidate the scope of this response and identify its gene targets. According to the mRNA expression profiles we recorded from 5 cancerous and non‐cancerous human cell lines after exposure to 5 Gy of IR, most of the responses were cell line‐specific. Computational analysis identified significant enrichment for p53 target genes and cell cycle‐related pathways among groups of up‐regulated and down‐regulated genes, respectively. Computational promoter analysis of the six datasets disclosed that a statistically significant number of the induced genes contained p53 binding site signatures. p53‐mediated regulation had previously been documented for subsets of these gene groups, making our lists a source of novel potential p53 targets. Real‐time qPCR and chromatin immunoprecipitation (ChIP) assays validated the IR‐induced p53‐dependent induction and p53 binding to the respective promoters of 11 selected genes. Our results demonstrate the power of a combined computational and experimental approach to identify new transcriptional targets in the DNA damage response network.
Keywords: DNA damage response, Ionizing radiation, Gene expression, Meta-analysis, Transcriptional regulation, p53
Highlights
Ionizing radiation‐induced transcriptional responses were compared in 5 human cell lines.
The majority of the transcriptional responses were cell line‐specific.
A common core of p53‐induced genes was identified.
Another common theme was down‐regulation of cell cycle‐related genes.
Meta‐analysis of publicly available datasets demonstrated the generality of our observations.
1. Introduction: the DNA damage response and transcriptional dynamics
Maintenance of genome stability and integrity is essential for cellular homeostasis and prevention of undue cell death or neoplasia (Negrini et al., 2010). DNA damage caused by internal or external damaging agents is a major threat to the integrity of the cellular genome. Failure to repair DNA lesions may result in obstruction of replication and transcription or mutagenesis, leading to cellular malfunction, undue cell death or cancer (Halazonetis et al., 2008; Jackson and Bartek, 2009). The cellular defense system against this threat is the DNA damage response (DDR) – an elaborate signaling network that repairs the damage while swiftly modulating many physiological processes (Ciccia and Elledge, 2010). One of the most powerful triggers of the DDR is the DNA double‐strand break (DSB) (Bassing and Alt, 2004; Hartlerode and Scully, 2009; Hiom, 2010). DSBs are induced by ionizing radiation (IR), radiomimetic chemicals, or reactive oxygen species formed during the course of normal metabolism, and may also result from replication fork stalling. DSBs also accompany normal genomic transactions such as meiotic recombination and the rearrangement of the antigen receptor genes in lymphocytes via V(D)J recombination.
One of the most potent exogenous inducers of DSBs is IR. As a major tool in cancer therapy, the success of IR relies on its ability to selectively kill tumor cells while minimizing the detrimental effect to normal surrounding tissues (Jen and Cheung, 2003; Snyder, 2004). It is therefore essential to understand the IR‐mediated responses at the molecular, cellular and tissue levels (Jen and Cheung, 2003).
The major DSB repair pathways in eukaryotic cells are error‐prone non‐homologous end‐joining (NHEJ) and a high‐fidelity process based on homologous recombination (HR) between sister chromatids (Hartlerode and Scully, 2009; Hiom, 2010). However, the global cellular response to DSBs goes far beyond repair. This broad, powerful signaling network works swiftly and vigorously to coordinate a large number of cellular systems simultaneously (Ciccia and Elledge, 2010) in a hierarchical process executed through a series of highly controlled steps. It is based on a signal transduction mechanism that begins with sensor proteins, which rapidly accumulate at the damaged sites (Bekker‐Jensen and Mailand, 2010). These proteins are thought to sense the damage and/or chromatin alterations following damage induction, initiate damage processing, and transmit a signal to transducers, which in turn relay the signal to numerous downstream effectors involved in specific pathways. The initial DSB response involves extensive dynamics of a host of protein post‐translational modifications (Al‐Hakim et al., 2010; Bensimon et al., 2010; Ciccia and Elledge, 2010; Polo and Jackson, 2011).
The primary transducer of the DSB alarm is the protein kinase ATM, which is rapidly activated in response to DSBs and proceeds to phosphorylate a plethora of key players in various damage response pathways (Derheimer and Kastan, 2010). ATM belongs to a conserved family of PI3K‐like protein kinases (PIKKs) (Lempiainen and Halazonetis, 2009) that includes, among others, two additional major DDR transducers: the DNA‐dependent protein kinase (DNA‐PK) (Neal and Meek, 2011), and the ataxia–telangiectasia and Rad3‐related (ATR) kinase (Lopez‐Contreras and Fernandez‐Capetillo, 2010). ATM, DNA‐PK and ATR share substrates in the DSB response but exhibit selective substrate specificities in response to different genotoxic stresses and different DSB inducers. These three kinases maintain close functional relationships (Lempiainen and Halazonetis, 2009).
In humans, germ‐line mutations in genes encoding DNA damage response proteins can lead to inherited genomic instability syndromes that involve various degrees of tissue degeneration (most notably in the nervous and immune systems), sensitivity to specific genotoxic stresses, cancer predisposition, and occasionally premature aging (Eyfjord and Bodvarsdottir, 2005; O'Driscoll and Jeggo, 2006). Null alleles in the human ATM locus lead to the genomic instability syndrome ataxia–telangiectasia (A–T) characterized by progressive cerebellar atrophy, immunodeficiency, cancer predisposition, and acute radiation sensitivity (Chun and Gatti, 2004; Lavin, 2008).
The DSB response involves a marked modulation of the cellular transcriptome (Begley and Samson, 2004; Elkon et al., 2005; Rashi‐Elkeles et al., 2006). One of the major transcription factors (TFs) that mobilizes this response is the tumor suppressor protein p53, known to regulate genomic integrity by stabilizing the genome and preventing polyploidization (Aylon & Oren; p53: Guardian of ploidity). p53 plays a major role in determining the cell's fate – whether it will survive DNA damage and growth arrest, or render such growth arrest irreversible and activate programmed cell death (Fei and El‐Deiry, 2003; Braithwaite et al., 2005; Zamzami and Kroemer, 2005; Helton and Chen, 2007; Riley et al., 2008; Jackson et al., 2011). p53 exerts its transcription regulatory activity mostly through direct binding to the regulatory sequences of its target genes. The list of p53 targets, which is constantly growing, currently exceeds 100 genes whose biological role in the p53‐mediated network has been studied in detail (Elkon et al., 2008; Riley et al., 2008; Paz et al., 2011). These genes are involved in a variety of pathways, including DNA repair (e.g., MSH2, MLH1, PCNA, XPC, DDB2 and RAD51), cell cycle progression (e.g., CDKN1A, GADD45A, BTG2, CCNG1 and 14‐3‐3σ), cell death (e.g., BAX, BCLL, FAS/APO and the death receptors TNFRSF10B and TNFRS6), transcription regulation (e.g., JUND, FOS and ATF3), and other signaling pathways (e.g., RRAD, SNX5 and HNRPK) (el‐Deiry, 1998; Wei et al., 2006; Zschenker et al., 2006; Helton and Chen, 2007). Dozens more potential p53 targets have been identified by genome‐wide profiling of p53 binding sites (Wei et al., 2006; Bandele et al., 2010), though the mere physical binding to the DNA does not automatically mean functional significance (Hiom, 2009).
Numerous wide‐scale expression studies collectively profiled cellular responses to a multitude of DNA‐damaging agents (Heinloth et al., 2003, 2003). They demonstrated that the transcriptional response to genotoxic stress goes beyond the core DDR pathways of DNA repair and cell cycle regulation to touch most aspects of cell physiology, including modulation of cell‐death pathways, energy metabolism, cell–cell communication, and RNA processing. We showed in both murine tissue and human cell lines that the extensive network induced in response to IR is to a large extent ATM‐dependent. Atm‐KO tissues (Rashi‐Elkeles et al., 2006) and human cells knocked‐down for ATM (Elkon et al., 2005) exhibited a significantly attenuated IR response. Profiling these responses in p53‐compromised cells revealed that p53 is indeed the major TF in the transcriptional response to DNA damage (Amundson et al., 2005; Elkon et al., 2005), although other key TFs participate as well, including NFkB, AP‐1, and SP1 (Criswell et al., 2003).
2. Questioning experimental setups: cell line variation in IR‐induced transcriptional response
Most experimental investigations of the DDR are carried out in commonly used cell lines, most of them derived from human tumors. Such cell lines are expected to exhibit a widespread variation in their response to DNA damage, most notably to IR. This variation stems primarily from genetic variation among the donors, which is known to markedly affect their radiation response (Turesson, 1990; Bentzen, 2006; Chistiakov et al., 2008; Andreassen and Alsner, 2009; Popanda et al., 2009; Pugh et al., 2009; Niu et al., 2010). Variations in response to IR also come from the multiple genetic changes that take place in the course of prolonged culturing, particularly in tumor cell lines.
We carried out large‐scale expression analysis to examine the transcriptional response induced by 5 Gy of IR in 5 malignant and non‐malignant cell lines (Table 1). Expression profiles were recorded in mock‐irradiated and irradiated cells 3 and 6 h after irradiation. Other than irradiation, all cultures underwent similar handling. The majority of the transcriptional response of these cell lines to IR was cell line‐specific, with substantial differences from one line to another. There was, however, a core of induced or repressed genes common to the different cell lines, with the induced ones consisting almost exclusively of validated p53 targets.
Table 1.
The studied cell lines.
| Cell line | Nature of Origin | Establishment |
|---|---|---|
| BJ‐hTert‐1 | Normal human foreskin fibroblast | (Bodnar et al., 1998) |
| G361 | Human Skin melanoma | (Peebles et al., 1978) |
| HepG2 | Human hepatocellular carcinoma | (Knowles et al., 1980) |
| Tk6 | Normal human B‐lymphoblastoids | (Skopek et al., 1978) |
| U2OS | Human Osteosarcoma | (Ponten and Saksela, 1967) |
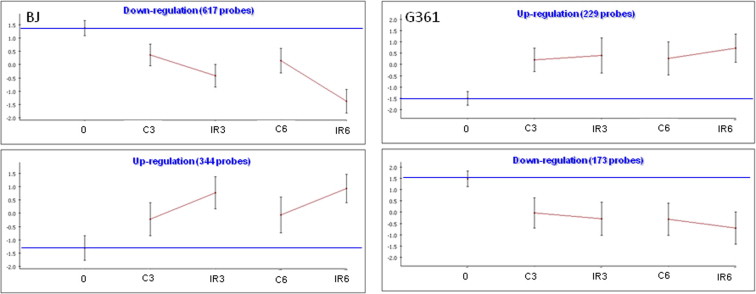
Hierarchical clustering clearly demonstrated that cell line was the principal determinant of the expression profiles (Figure 1). After identifying the set of genes in each cell line whose level was changed at least 1.5‐fold following irradiation, and subjecting these sets to cluster analysis, we found two major programs in each cell line: IR‐induced gene induction or gene repression (Figure 2 and Figure S1). The vast majority of the responding genes were cell line‐specific, with more than 90% of the responding genes responding to IR in only one cell line. A search for enriched biological processes in the various gene sets pointed to a motif shared by all cell lines: the clusters of induced genes were significantly enriched for p53 targets while clusters of down‐regulated genes were enriched for cell cycle‐related genes (Table 2). In some of the cell lines (e.g., G361; Figure S1), this core program was activated also in mock‐treated samples compared to the zero time point control, albeit to a lesser extent compared to the matched irradiated cultures, indicating that this response may represent a general stress program. This result highlights the importance of using matched mock‐treated controls while measuring transcriptional profiles.
Figure 1.
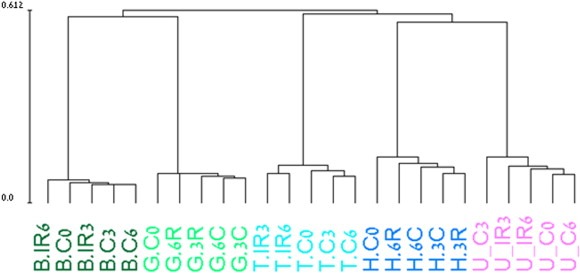
Hierarchical clustering of the conditions in our dataset. Samples were ordered in a hierarchical tree (dendrogram) according to similarity in their expression profiles: samples with similar profiles are connected by a short tree edges while samples with very different expression profiles have longer tree distance. The main divider of the samples in the dendrogram is cell line, demonstrating that cell type rather than irradiation is the major determinant of expression profile in our dataset. The name of each condition (shown below its location along the dendrogram) contains the initial of the corresponding cell line (B = Bj‐1; G = G361; T = TK6; H = HepG2 and U = U2OS); C stands for control and IR represents the irradiated sample. The scale at the side of the dendrogram indicates the relative distance between the different conditions.
Figure 2.
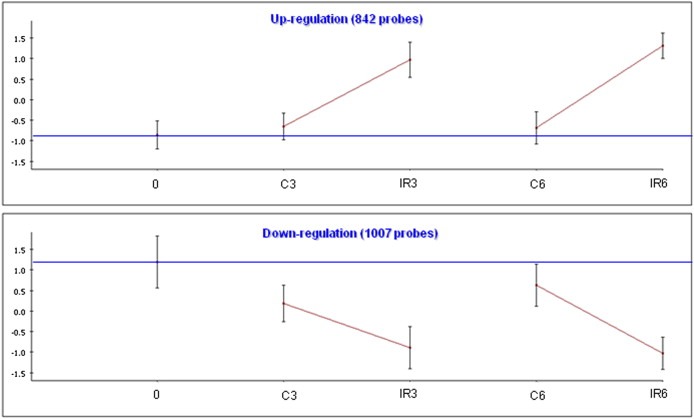
IR‐responsive gene clusters in TK6 cells. We used the clustering algorithm CLICK to divide the set of responding genes in each cell line into clusters, each of which represents a set of genes with similar expression patterns. The total number of genes in each cluster is indicated. For each cluster, the graph shows the mean expression pattern of all its genes. Error bars represent one S.D. Prior to clustering, gene expression levels were standardized to mean = 0 and SD = 1; the y‐axis corresponds to the standardized levels. The horizontal blue line represents the expression level in the untreated t0 sample (‘basal expression level’). The x‐axis corresponds to the examined conditions: C: untreated control. IR: irradiated cells. Post‐irradiation time points are indicated (0, 3 or 6 h).
Table 2.
Enriched biological pathways in the two major clusters obtained in each cell line.
| Cell line | Cluster (size) | Enriched pathway | p‐value |
|---|---|---|---|
| BJ‐1 | Up (344) | p53 signaling | 1.3 × 10⁻⁶ |
| Down (617) | Cell cycle | 5.7 × 10⁻²⁵ | |
| G361 | Up (229) | p53 signaling | 3.1 × 10⁻⁹ |
| Down (173) | Cell cycle | 8.4 × 10⁻⁶ | |
| HepG2 | Up (495) | p53 signaling | 2.0 × 10⁻¹⁰ |
| Down (373) | Cell cycle | 2.3 × 10⁻⁴ | |
| Tk6 | Up (842) | p53 signaling | 4.3 × 10⁻¹⁷ |
| Down (1007) | Cell cycle | 7.1 × 10⁻⁷ | |
| U2OS | Up (295) | p53 signaling | 1.7 × 10⁻¹⁶ |
| Down (330) | Cell cycle | 1.4 × 10⁻⁷ |
To further characterize the core response to IR, we selected the genes that responded in at least three of the 5 cell lines: 53 induced genes and 41 repressed genes met this criterion (Table 3), and examined their enrichments in SPIKE signaling maps (Paz et al., 2011). The IR‐induced core was significantly enriched in the p53 signaling map, and included key players in cell cycle regulation (e.g., CDKN1A), DNA repair (e.g., DDB2, REV3L and XPC), and apoptosis (e.g., FAS and DRAM) (Table 3, Figure 3A). The repressed core was significantly enriched in the G2/M map (e.g., AURKA, AURKB, CDC25C, PLK1 and WEE1; Table 3, Figure 3B).
Table 3.
Biological functions of the genes that responded in at least 3 of the 5 cell lines tested.
| Biological function | Induced genes | Repressed genes |
|---|---|---|
| Cell cycle regulation | CDKN1A, MDM2, PPM1D, PSMB4, PTP4A1, SESN1, SESN2 | ASPM, AURKA, AURKB, BUB1, C13orf34 (BORA), MIS18BP1, C15orf23 (SKAP), C9orf140 (p42.3), CCNB1, CCNF, CDC20, CDC25C, CDCA3, CENPA, CENPE, CKS2, FAM83D, GSPT1, GTSE1, HJURP, KIF18A, KIF20A, KIF23, NEK2, PLK1, PSRC1, SGOL2, WEE1, XPO |
| DNA repair | BTG2, DDB2, GADD45A, POLH, REV3L, RRM2B, XPC | |
| Apoptosis | ARHGEF3, CYFIP2, DRAM, FAS, PHLDA3, RPS27L, TP53INP1, ZMAT3 | G2E3 |
| Transcriptional regulation | ATF3, C5orf41, TRIM22 | CDCA7, DEPDC1 |
| Other/uncharacterized | ANKRA2, ASCC3, C12orf5, CCDC90B, DCP1B, DGKA, ENC1, F2R, FBXW7, FDXR, FEZ1, FST, GDF15, GREB1, KLHL24, C20orf107, LOC643401, LOC727770, LOC727916, ORAI3, PANK1, PGF, PLCXD2, PLK3, PRKX, RNF19B, RPS11, SERTAD1, TMEM68, TOB1 | CKAP2L, EIF4A1, FAM72A, GPSM2, KIF14, LRRC8C, PIF1, SLC20A1, TNIK, TRIB1, TROAP |
Figure 3.
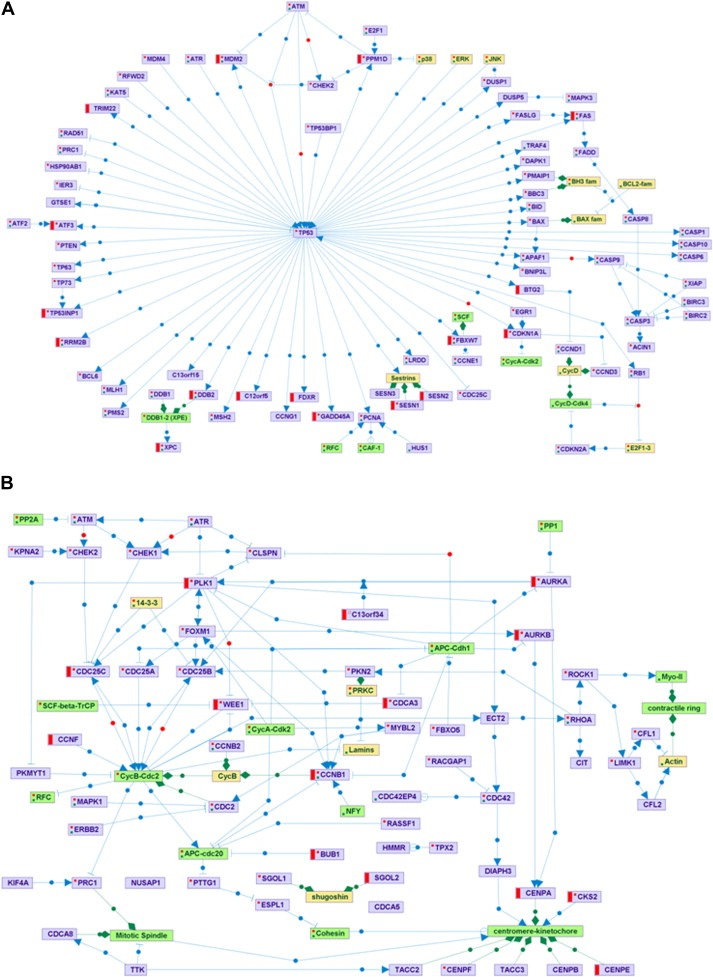
Core response to IR depicted using the SPIKE knowledge base of signaling pathways (Paz et al., 2011). Violet nodes are proteins, green nodes are protein complexes, and yellow nodes are protein families. Blue edges represent regulations: arrows correspond to activation; T‐shaped edges to inhibition, and open circles denote regulations whose effect is still not clear. Green edges represent association between nodes (e.g., association between a protein complex and its components). Red and green dots within a node indicate that not all the regulations and associations stored in SPIKE database for the node are displayed in the map. A. The core set of IR‐induced genes is significantly enriched for genes in the p53‐regulated network. Red bars denote genes that were induced in at least 3 of the 5 cell lines. B. The core set of IR‐repressed genes is significantly enriched for genes involved in the G2/M transition in the cell cycle. Red bars denote genes that were repressed in at least in 3 of the 5 cell lines.
3. Meta‐analysis of transcription profiles data and experimental validation
To further characterize the transcriptional networks induced by IR, we carried out a meta‐analysis of our own dataset and 5 publicly available ones in which transcriptional responses of human cells to IR had been examined (Supplementary Table A). The meta‐dataset included information on 7190 genes under 21 independent conditions (Supplementary Table B). IR‐induced or repressed genes were defined as those that were responsive (Z ≥ 2.5) in at least 4 of the 21 conditions (detailed information can be found in the Supplementary Methods section). Of the 248 genes that met this criterion, 199 were up‐regulated and 49 were down‐regulated (Supplementary Table C). The set of induced genes was enriched for genes that function in apoptosis, cell cycle regulation, stress responses, and metabolic processes (Table 4A), while the set of repressed genes was enriched mainly for genes that function in mitosis (Table 4B).
Table 4.
Enriched functional categories in the sets of genes that responded to IR in 4 out of 21 conditions compared in the meta‐analysis.
| GO category | Number of genes | p‐value |
|---|---|---|
| A: Induced genes | ||
| Regulation of apoptosis (GO:0042981) | 20 | 1.35 × 10−09 |
| Intracellular signaling cascade (GO:0007242) | 28 | 2.27 × 10−09 |
| Regulation of cell cycle (GO:0051726) | 15 | 6.91 × 10−09 |
| Response to stress (GO:0006950) | 28 | 4.70 × 10−08 |
| DNA damage response, signal transduction (GO:0042770) | 6 | 1.08 × 10−06 |
| Regulation of cellular metabolic process (GO:0031323) | 43 | 2.07 × 10−06 |
| Protein amino acid dephosphorylation (GO:0006470) | 8 | 2.42 × 10−06 |
| Cell cycle checkpoint (GO:0000075) | 6 | 3.07 × 10−06 |
| B: Repressed genes | ||
| Nuclear division (GO:0000280) | 14 | 2.31 × 10⁻²⁰ |
| Cell division (GO:0051301) | 13 | 9.20 × 10⁻¹⁷ |
| Organelle organization (GO:0006996) | 19 | 1.15 × 10⁻¹⁵ |
| Microtubule‐based process (GO:0007017) | 10 | 8.62 × 10⁻¹³ |
| Regulation of mitotic cell cycle (GO:0007346) | 6 | 2.36 × 10−08 |
Novel putative targets of p53 in the IR‐induced core were identified by computational analysis of cis‐regulatory elements embedded in the promoter regions of these genes, using the PRIMA algorithm (Elkon et al., 2003). The p53 binding signature was highly enriched in the promoters of the up‐regulated group, appearing in 61 genes (p = 4.72 × 10⁻¹⁰). p53 regulation had previously been documented for only 28 of these genes, making the remaining 33 a source of potential new p53 targets in response to IR. The set of down‐regulated genes was significantly enriched for the binding site signature of NF‐Y (22 out of 49 genes, p = 1.0 × 10⁻⁷), suggesting that this TF plays a major role in regulating the response of these genes to DNA damage.
Quantitative real‐time RT‐PCR (real‐time qPCR) was used to experimentally validate the response of selected known and potential p53 target genes. We used the TK6 cell line with functional p53 and its p53‐deficient derivative, NH32 (Chuang et al., 1999). TK6 cells have been extensively characterized and found to exhibit a robust IR response (Amundson et al., 2005). Fifteen genes that had been identified by PRIMA to contain p53‐binding sites were selected: 4 previously known p53 targets and 11 potential p53 targets. The CD164 gene served as a negative control. Good agreement was found between the RT‐PCR results, microarray data and PRIMA predictions: 14 of the 15 genes were indeed induced upon IR in a p53‐dependent manner, while the negative control showed no induction in either TK6 or NH32 cells (Figure 4A).
Figure 4.
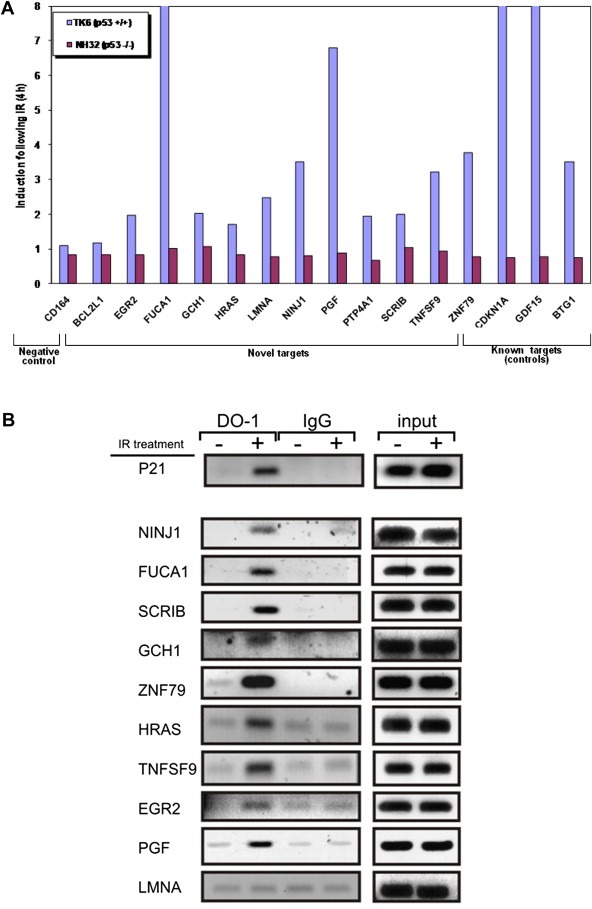
A. Validation of selected p53 novel targets using real‐time qPCR. The figure represents the fold‐induction of various genes 4 h after irradiation with 5 Gy. Blue bars: p53‐proficient TK6 cells; Red bars: p53‐deficient NH32 cells. The fold of induction represented is averaged over three independent measurements. B. Binding of p53 to selected novel p53 target promoters demonstrated using a ChIP assay. TK6 cells were harvested prior to and 1.5 h after irradiation with 10 Gy of IR, and ChIP was carried out as described in the supplementary methods section using a monoclonal antibody (DO‐1) against human p53. PCR was performed using the immune complexes as templates and 13 pairs of primers designed to identify p53 binding sites within the promoters of 12 selected genes (sequences are available in Supplementary Table D). GAPDH served as negative control. Input samples corresponding to eluted DNA before immunoprecipitation, as well as IgG‐immmunoprecipitated chromatin served as positive and negative controls, respectively, for the ChIP assay.
The novel candidate p53 targets were further examined by chromatin immunoprecipitation (ChIP) to measure the IR‐induced binding of p53 to the regulatory elements identified by PRIMA, 90 min after irradiation with 10 Gy of IR. We selected for this analysis 9 new p53 targets that we previously validated using real‐time qPCR and one bona fide p53 target (CDKN1A); GAPDH served as negative control. p53 physically bound all 9 targets and IR treatment enhanced its binding (Figure 4B). Thus, we unequivocally identified 9 new p53 targets in the core transcriptional response to IR (Table 5). Finally, we used the SPIKE database developed in our labs (Paz et al., 2011) to create an interaction map integrating the old and new p53 targets in the IR response (Figure 5).
Table 5.
Validated novel p53 targets.
| Gene name | Gene ID | Summary |
|---|---|---|
| EGR2 | 1959 | EGR2 encodes for the human early growth response protein 2 (EGR2), a transcription factor with three tandem C2H2‐type zinc fingers. Mutations in this gene are associated with the autosomal dominant Charcot‐Marie‐Tooth disease type 1D (CMT1D), Charcot‐Marie‐Tooth disease type 4E (CMT4E), and with Dejerine–Sottas syndrome (DSS). (Joseph et al., 1988; Warner et al., 1998; Bellone et al., 1999). |
| FUCA1 | 2517 | FUCA1 (fucosidase, alpha‐l‐ 1) encodes an enzyme called “tissue alpha‐l‐fucosidase”. This enzyme is found in the lysosomes, where it plays a role in the breakdown of complexes of sugar molecules (oligosaccharides) attached to glycoproteins and glycolipids. Its main target is the sugar molecule called fucose. Mutations in the FUCA1 gene cause Fucosidosis, an autosomal recessive lysosomal storage disease with accumulation of fucose in various tissues (e.g., brain, liver, spleen, skin, heart, pancreas, and kidneys) (Occhiodoro et al., 1989; Willems et al., 1991). |
| GCH1 | 2643 | GCH1 encodes a member of the GTP cyclohydrolase family. The encoded protein is the first and rate‐limiting enzyme in tetrahydrobiopterin (BH4) biosynthesis, catalyzing the conversion of GTP into 7,8‐dihydroneopterin triphosphate. BH4 is an essential co‐factor required by aromatic amino acid hydroxylases as well as nitric oxide synthases. Mutations in this gene are associated with malignant hyperphenylalaninemia and dopa‐responsive dystonia (Thony et al., 2000). |
| HRAS | 3265 | HRAS is a proto‐oncogene that belongs to the Ras oncogene family, whose members are related to the transforming genes of mammalian sarcoma retroviruses. The products encoded by these genes have intrinsic GTPase activity and they function in signal transduction pathways. HRas is involved in regulating cell division in response to growth factor stimulation. Mutations in HRAS cause Costello syndrome, a disease characterized by increased growth at the prenatal stage, growth deficiency at the postnatal stage, predisposition to tumor formation, mental retardation, skin and musculoskeletal abnormalities, distinctive facial appearance, and cardiovascular abnormalities. Defects in this gene are implicated in a variety of cancers, including bladder cancer, follicular thyroid cancer, and oral squamous cell carcinoma (Wong‐Staal et al., 1981; Aoki et al., 2005). |
| LMNA | 4000 | LMNA encodes for the human protein lamin A/C, also known as LMNA. Lamin A/C belongs to the lamin family of proteins. The nuclear lamina consists of a two‐dimensional matrix of proteins located next to the inner nuclear membrane. The proteins in the lamin family make up the matrix and are highly conserved in evolution. During mitosis, the lamina matrix is reversibly disassembled as the lamin proteins are phosphorylated. Lamin proteins are thought to be involved in nuclear stability, chromatin structure and gene expression. Mutations in the LMNA gene are associated with several diseases, including Emery–Dreifuss muscular dystrophy, familial partial lipodystrophy, limb girdle muscular dystrophy, dilated cardiomyopathy, Charcot‐Marie‐Tooth disease, and Hutchinson–Gilford progeria syndrome (Kamat et al., 1993; Rankin and Ellard, 2006). |
| NINJ1 | 4814 | NINJ1 encodes for the ninjurin 1 protein, which is up‐regulated after nerve injury both in dorsal root ganglion neurons and in Schwann cells. It demonstrates properties of a homophilic adhesion molecule and promotes neurite outgrowth from primary cultured dorsal root ganglion neurons. It was suggested to play a role in nerve regeneration and in the formation and function of other tissues (Araki and Milbrandt, 1996). |
| PGF | 5228 | PGF encodes for the human placental growth factor (PGF). This protein is a member of the VEGF (vascular endothelial growth factor) sub‐family – a key molecule in angiogenesis and vasculogenesis, in particular during embryogenesis. The main source of PGF during pregnancy is the placental trophoblast (Maglione et al., 1993; Fischer et al., 2007). |
| TNFSF9 | 8744 | The protein encoded by TNFSF9 is a cytokine that belongs to the tumor necrosis factor (TNF) ligand family. This transmembrane cytokine is a bi‐directional signal transducer that acts as a ligand for TNFRSF9/4‐1BB, which is a co‐stimulatory receptor molecule in T‐lymphocytes. This cytokine and its receptor are involved in the antigen presentation process and in the generation of cytotoxic T cells. The receptor, TNFRSF9/4‐1BB, is absent from resting T‐lymphocytes but rapidly expressed upon antigenic stimulation. The ligand, TNFSF9/4‐1BBL, has been shown to reactivate anergic T‐lymphocytes as well as promote T‐lymphocyte proliferation. It has also been shown to be required for the optimal CD8 responses in CD8 T cells. This cytokine is expressed in carcinoma cell lines, and is thought to be involved in T‐cell‐tumor cell interaction (Goodwin et al., 1993; Alderson et al., 1994). |
| ZNF79 | 7633 | ZNF79 encodes for the human zinc finger protein 79. cDNA clones encoding zinc finger motifs were isolated by screening human placenta and T cell (Peer) cDNA libraries with zinc finger (ZNF) consensus sequences. Unique cDNA clones were mapped in the human genome by rodent‐human somatic cell hybrid analysis, and in some cases in situ chromosomal hybridization. ZNF79 mapped to 9q34 centromeric to the ABL gene, and between a constitutional chromosomal translocation on the centromeric side and the CML‐specific ABL translocation on the telomeric side (Huebner et al., 1993). |
Figure 5.
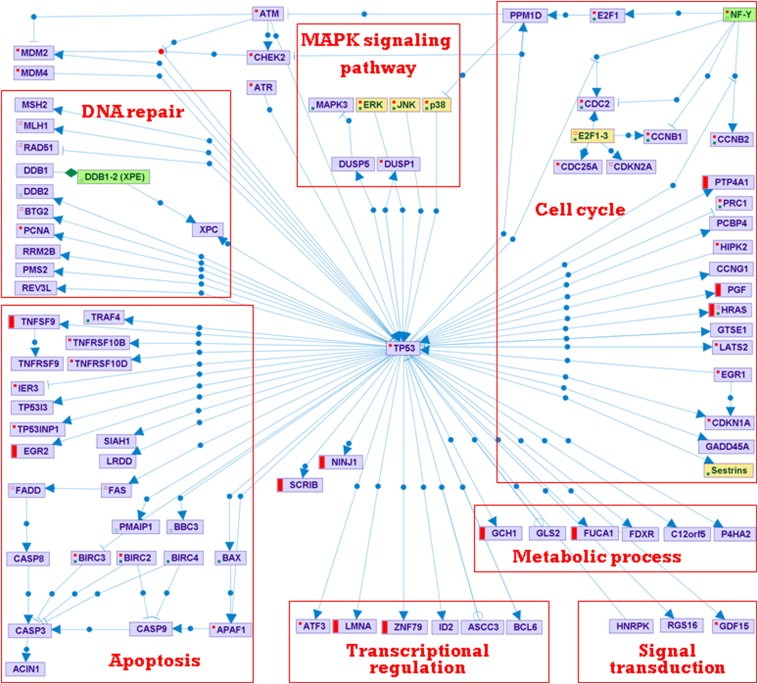
Integration of novel p53 targets in the IR‐induced, p53‐regulated network. The map was created using the SPIKE tool. New p53 targets are marked with red bars. Violet nodes are proteins, green nodes are protein complexes, and yellow nodes are protein families. Blue edges represent regulations: arrows correspond to activation; T‐shaped edges to inhibition, and open circles denote regulations whose effect is still not clear. Green edges represent association between nodes (e.g., association between a protein complex and its components). Red and green dots within a node indicate that not all the regulations and associations stored in SPIKE database for the node are displayed in the map.
4. Conclusions: the transcriptional response to IR
The cellular response to DNA damage consists of an integrated signaling network mobilized by protein modifications and gene regulation (Bekker‐Jensen et al. 2010; Ciccia and Elledge, 2010; Polo and Jackson, 2011). Transcriptional profiling is a major tool to monitor the DDR and identify new players in its web. We and others have characterized alterations in gene expression profiles following exposure to IR (Amundson et al., 2005, 1999, 2000, 2003, 2005, 2005, 2003, 2005, 2007, 2005, 2006, 2006, 2006). The results of our comparison of the responses of different cell lines, described above, highlight the susceptibility of this analysis to substantial variations that reflect differences in genetic backgrounds and possibly inherent genomic instability of commonly used cell lines, and call for prudence in interpreting such data. In view of this caveat, the emergence of p53 as a major determinant of the gene expression response to IR even in this dataset is remarkable, and emphasizes the pivotal and universal role of p53 in the induction of the transcriptional response to IR. Thus, it is not surprising that p53 emerged from the meta‐analysis of additional datasets as a key player in this response.
NF‐Y appeared as a central player among IR‐repressed genes. NF‐Y was reported to control the transcription of several key regulators of the cell cycle (Yun et al., 1999; Jung et al., 2001; Manni et al., 2001), and three bioinformatics studies tied it specifically to promoters regulated during the G2/M transition of the cell cycle (Elkon et al., 2003; Linhart et al., 2005; Zhu et al., 2006). NF‐Y was found to be involved in the modulation of cell cycle‐associated promoters in response to DNA damage, through wild‐type p53‐dependent transcription inhibition (Yun et al., 1999; Adachi et al., 2000; Ceribelli et al., 2006); and to be required for p53‐mediated transcriptional repression of several targets in the process of cellular transformation (Tabach et al., 2005). Our profiling results support the notion that upon DNA damage, NF‐Y represses the transcription of genes related to the G2/M transition. Recently, Benatti et al. (2008) suggested that a delicate balance between NF‐Y and p53 governs the pro‐ and anti‐apoptotic transcriptional response and enables fine control of cell cycle progression upon DNA damage.
Our meta‐analysis identified a core of 374 genes that respond to IR in several cell lines, pointing to a large group of genes that together control a significant volume of biological activity. It is important to note that this core is significantly enriched for genes involved in the apoptotic pathway. The combined use of microarrays and computational analysis, based on the PRIMA algorithm followed by real‐time qPCR and ChIP, and the subsequently use of the SPIKE database provides a robust experimental paradigm for the dissection of the IR response and identification of functional nodes and novel players in this network.
The ongoing process of identifying p53‐regulated genes, which began in the early 1990s with the discovery of p53's first documented transcription targets (CDKN1A, GADD45A, Cyclin G, Bax and others (Ko and Prives, 1996)), is resulting in a constantly growing list. p53 targets were identified either individually or using screening techniques such as DNA microarrays (Laptenko and Prives, 2006). Wei et al. (2006) recently coupled ChIP assay with PET sequencing in search of global localization of transcription factors binding sites and discovered p53‐binding sites throughout the human genome and identified 98 new p53 targets. Interestingly, our novel p53 targets were not identified in that study. Moreover, except for 6 known p53 targets (BAX, CDKN1A, TNFRSF10B, PCNA, XPC and DDB2) which were identified in both studies, there was no overlap between the two lists. Here too, our results attest to the power of using a combined computational and experimental approach to identify new transcriptional targets in the DNA damage response network.
p53 appears to activate conflicting response arms: DNA repair and cell cycle arrest, which help the cell cope with and survive genotoxic stress, and apoptosis, which eliminates the afflicted cell. Which arm prevails seems to be tissue‐specific. Indeed in p53‐null mice, some tissues show enhanced radiosensitivity (intestine) under genotoxic stress while others are turned more radio‐resistant (spleen, thymus, embryonic CNS) (Gudkov and Komarova, 2003; Komarova et al., 2004; Jackson et al., 2011). These conflicting effects of p53 activation also complicate the role of p53 in predicting cancer response to IR and chemotherapy (Bertheau et al., 2008). The dual functionality of p53 is also a major factor when considering p53 as a potential therapeutic target in cancer: its reactivation in p53‐deficient tumors can improve outcome by enhancing cell death or cellular senescence (Ventura et al., 2007), but in some circumstances its inhibition (for instance, in p53‐wt tumors) reduces tumor cell recovery (Gudkov and Komarova, 2003, 2005). Clearly, more research is needed in order to delineate the factors that affect the balance between p53's life and death choices.
Studies of gene expression profiles naturally draw functional conclusions based on the protein products of the identified transcripts. It is important to use the current proteomic technology to examine the correlation between the dynamics of gene expression and the corresponding proteins. Is there a direct correlation? Furthermore, next‐generation deep‐sequencing methods should be used to decipher alternative splicing on a genomic scale following DNA damage induction. The integration of these technologies may yield the long‐sought systems level, multi‐layered understanding of the DNA damage response.
Supporting information
The following are the supplementary data related to this article:
Supplementary data
Supplementary data
Supplementary data
Supplementary data
Supplementary data
Supplementary data
Supplementary data
Acknowledgments
This study was supported by the European Community's Seventh Framework Program (research grant HEALTH‐F4‐2009‐223575 for the TRIREME Project) and The Converging Technologies Program of the Israel Science Foundation (to RS and YS), The European Community's Seventh Framework Program (Grant HEALTH‐F4‐2007‐200767 for the APO‐SYS project to RS), and The Israel Cancer Research Fund and the A‐T Medical Research Foundation (to YS). YS is a Research Professor of the Israel Cancer Research Fund.
Supplementary data 1.
Supplementary data associated with this article can be found, in the online version, at doi:10.1016/j.molonc.2011.06.004.
Rashi‐Elkeles Sharon, Elkon Ran, Shavit Seagull, Lerenthal Yaniv, Linhart Chaim, Kupershtein Ana, Amariglio Ninette, Rechavi Gideon, Shamir Ron and Shiloh Yosef, (2011), Transcriptional modulation induced by ionizing radiation: p53 remains a central player, Molecular Oncology, 5, doi: 10.1016/j.molonc.2011.06.004.
References
- Adachi, N. , Nomoto, M. , 2000. Cell-cycle regulation of the DNA topoisomerase IIalpha promoter is mediated by proximal CCAAT boxes: possible involvement of acetylation. Gene. 245, (1) 49–57. [DOI] [PubMed] [Google Scholar]
- Akerman, G.S. , Rosenzweig, B.A. , 2005. "Alterations in gene expression profiles and the DNA-damage response in ionizing radiation-exposed TK6 cells.". Environ. Mol. Mutagen.. 45, (2–3) 188–205. [DOI] [PubMed] [Google Scholar]
- Al-Hakim, A. , Escribano-Diaz, C. , 2010. The ubiquitous role of ubiquitin in the DNA damage response. DNA Repair (Amst). 9, (12) 1229–1240. [DOI] [PMC free article] [PubMed] [Google Scholar]
- Alderson, M.R. , Smith, C.A. , 1994. Molecular and biological characterization of human 4-1BB and its ligand. Eur. J. Immunol.. 24, (9) 2219–2227. [DOI] [PubMed] [Google Scholar]
- Amundson, S.A. , Bittner, M. , 1999. Fluorescent cDNA microarray hybridization reveals complexity and heterogeneity of cellular genotoxic stress responses. Oncogene. 18, (24) 3666–3672. [DOI] [PubMed] [Google Scholar]
- Amundson, S.A. , Do, K.T. , 2000. Identification of potential mRNA biomarkers in peripheral blood lymphocytes for human exposure to ionizing radiation. Radiat. Res.. 154, (3) 342–346. [DOI] [PubMed] [Google Scholar]
- Amundson, S.A. , Lee, R.A. , 2003. Differential responses of stress genes to low dose-rate gamma irradiation. Mol. Cancer Res.. 1, (6) 445–452. [PubMed] [Google Scholar]
- Amundson, S.A. , Do, K.T. , 2005. Stress-specific signatures: expression profiling of p53 wild-type and -null human cells. Oncogene. 24, (28) 4572–4579. [DOI] [PubMed] [Google Scholar]
- Andreassen, C.N. , Alsner, J. , 2009. Genetic variants and normal tissue toxicity after radiotherapy: a systematic review. Radiother. Oncol.. 92, (3) 299–309. [DOI] [PubMed] [Google Scholar]
- Aoki, Y. , Niihori, T. , 2005. Germline mutations in HRAS proto-oncogene cause Costello syndrome. Nat. Genet.. 37, (10) 1038–1040. [DOI] [PubMed] [Google Scholar]
- Araki, T. , Milbrandt, J. , 1996. Ninjurin, a novel adhesion molecule, is induced by nerve injury and promotes axonal growth. Neuron. 17, (2) 353–361. [DOI] [PubMed] [Google Scholar]
- Bandele, O.J. , Wang, X. , 2010. Human single-nucleotide polymorphisms alter p53 sequence-specific binding at gene regulatory elements. Nucleic Acids Res.. 39, (1) 178–189. [DOI] [PMC free article] [PubMed] [Google Scholar]
- Bassing, C.H. , Alt, F.W. , 2004. The cellular response to general and programmed DNA double strand breaks. DNA Repair (Amst). 3, (8–9) 781–796. [DOI] [PubMed] [Google Scholar]
- Begley, T.J. , Samson, L.D. , 2004. Network responses to DNA damaging agents. DNA Repair (Amst). 3, (8–9) 1123–1132. [DOI] [PubMed] [Google Scholar]
- Bekker-Jensen, S. , Mailand, N. , 2010. Assembly and function of DNA double-strand break repair foci in mammalian cells. DNA Repair (Amst). [DOI] [PubMed] [Google Scholar]
- Bekker-Jensen, S. , Rendtlew Danielsen, J. , 2010. HERC2 coordinates ubiquitin-dependent assembly of DNA repair factors on damaged chromosomes. Nat. Cell Biol.. 12, (1) 80–86. sup pp. 81–12 [DOI] [PubMed] [Google Scholar]
- Bellone, E. , Di Maria, E. , 1999. A novel mutation (D305V) in the early growth response 2 gene is associated with severe Charcot-Marie-Tooth type 1 disease. Hum. Mutat.. 14, (4) 353–354. [DOI] [PubMed] [Google Scholar]
- Benatti, P. , Basile, V. , 2008. A balance between NF-Y and p53 governs the pro- and anti-apoptotic transcriptional response. Nucleic Acids Res. [DOI] [PMC free article] [PubMed] [Google Scholar]
- Bensimon, A. , Schmidt, A. , 2010. ATM-dependent and -independent dynamics of the nuclear phosphoproteome after DNA damage. Sci. Signal.. 3, (151) rs3 [DOI] [PubMed] [Google Scholar]
- Bentzen, S.M. , 2006. Preventing or reducing late side effects of radiation therapy: radiobiology meets molecular pathology. Nat. Rev. Cancer. 6, (9) 702–713. [DOI] [PubMed] [Google Scholar]
- Bertheau, P. , Espie, M. , 2008. TP53 status and response to chemotherapy in breast cancer. Pathobiology. 75, (2) 132–139. [DOI] [PubMed] [Google Scholar]
- Bodnar, A.G. , Ouellette, M. , 1998. Extension of life-span by introduction of telomerase into normal human cells. Science. 279, (5349) 349–352. [DOI] [PubMed] [Google Scholar]
- Braithwaite, A.W. , Royds, J.A. , 2005. The p53 story: layers of complexity. Carcinogenesis. 26, (7) 1161–1169. [DOI] [PubMed] [Google Scholar]
- Ceribelli, M. , Alcalay, M. , 2006. Repression of new p53 targets revealed by ChIP on chip experiments. Cell Cycle. 5, (10) 1102–1110. [DOI] [PubMed] [Google Scholar]
- Chistiakov, D.A. , Voronova, N.V. , 2008. Genetic variations in DNA repair genes, radiosensitivity to cancer and susceptibility to acute tissue reactions in radiotherapy-treated cancer patients. Acta Oncol.. 47, (5) 809–824. [DOI] [PubMed] [Google Scholar]
- Chuang, Y.Y. , Chen, Q. , 1999. Radiation-induced mutations at the autosomal thymidine kinase locus are not elevated in p53-null cells. Cancer Res.. 59, (13) 3073–3076. [PubMed] [Google Scholar]
- Chun, H.H. , Gatti, R.A. , 2004. Ataxia–telangiectasia, an evolving phenotype. DNA Repair (Amst). 3, (8–9) 1187–1196. [DOI] [PubMed] [Google Scholar]
- Ciccia, A. , Elledge, S.J. , 2010. The DNA damage response: making it safe to play with knives. Mol. Cell. 40, (2) 179–204. [DOI] [PMC free article] [PubMed] [Google Scholar]
- Criswell, T. , Leskov, K. , 2003. Transcription factors activated in mammalian cells after clinically relevant doses of ionizing radiation. Oncogene. 22, (37) 5813–5827. [DOI] [PubMed] [Google Scholar]
- Derheimer, F.A. , Kastan, M.B. , 2010. Multiple roles of ATM in monitoring and maintaining DNA integrity. FEBS Lett.. 584, (17) 3675–3681. [DOI] [PMC free article] [PubMed] [Google Scholar]
- el-Deiry, W.S. , 1998. Regulation of p53 downstream genes. Semin. Cancer Biol.. 8, (5) 345–357. [DOI] [PubMed] [Google Scholar]
- Elkon, R. , Linhart, C. , 2003. Genome-wide in silico identification of transcriptional regulators controlling the cell cycle in human cells. Genome Res.. 13, (5) 773–780. [DOI] [PMC free article] [PubMed] [Google Scholar]
- Elkon, R. , Rashi-Elkeles, S. , 2005. Dissection of a DNA-damage-induced transcriptional network using a combination of microarrays, RNA interference and computational promoter analysis. Genome Biol.. 6, (5) R43 [DOI] [PMC free article] [PubMed] [Google Scholar]
- Elkon, R. , Vesterman, R. , 2008. SPIKE–a database, visualization and analysis tool of cellular signaling pathways. BMC Bioinformatics. 9, 110 [DOI] [PMC free article] [PubMed] [Google Scholar]
- Eyfjord, J.E. , Bodvarsdottir, S.K. , 2005. Genomic instability and cancer: networks involved in response to DNA damage. Mutat. Res.. 592, (1–2) 18–28. [DOI] [PubMed] [Google Scholar]
- Fei, P. , El-Deiry, W.S. , 2003. P53 and radiation responses. Oncogene. 22, (37) 5774–5783. [DOI] [PubMed] [Google Scholar]
- Fischer, C. , Jonckx, B. , 2007. Anti-PlGF inhibits growth of VEGF(R)-inhibitor-resistant tumors without affecting healthy vessels. Cell. 131, (3) 463–475. [DOI] [PubMed] [Google Scholar]
- Goodwin, R.G. , Din, W.S. , 1993. Molecular cloning of a ligand for the inducible T cell gene 4-1BB: a member of an emerging family of cytokines with homology to tumor necrosis factor. Eur. J. Immunol.. 23, (10) 2631–2641. [DOI] [PubMed] [Google Scholar]
- Gudkov, A.V. , Komarova, E.A. , 2003. The role of p53 in determining sensitivity to radiotherapy. Nat. Rev. Cancer. 3, (2) 117–129. [DOI] [PubMed] [Google Scholar]
- Gudkov, A.V. , Komarova, E.A. , 2005. Prospective therapeutic applications of p53 inhibitors. Biochem. Biophys. Res. Commun.. 331, (3) 726–736. [DOI] [PubMed] [Google Scholar]
- Halazonetis, T.D. , Gorgoulis, V.G. , 2008. An oncogene-induced DNA damage model for cancer development. Science. 319, (5868) 1352–1355. [DOI] [PubMed] [Google Scholar]
- Hartlerode, A.J. , Scully, R. , 2009. Mechanisms of double-strand break repair in somatic mammalian cells. Biochem. J.. 423, (2) 157–168. [DOI] [PMC free article] [PubMed] [Google Scholar]
- Heinloth, A.N. , Shackelford, R.E. , 2003. ATM-dependent and -independent gene expression changes in response to oxidative stress, gamma irradiation, and UV irradiation. Radiat. Res.. 160, (3) 273–290. [DOI] [PubMed] [Google Scholar]
- Heinloth, A.N. , Shackelford, R.E. , 2003. Identification of distinct and common gene expression changes after oxidative stress and gamma and ultraviolet radiation. Mol. Carcinog.. 37, (2) 65–82. [DOI] [PubMed] [Google Scholar]
- Helton, E.S. , Chen, X. , 2007. p53 modulation of the DNA damage response. J. Cell Biochem.. 100, (4) 883–896. [DOI] [PubMed] [Google Scholar]
- Hiom, K. , 2009. DNA repair: a riddle at a double-strand break. Curr. Biol.. 19, (8) R331–R333. [DOI] [PubMed] [Google Scholar]
- Hiom, K. , 2010. Coping with DNA double strand breaks. DNA Repair (Amst). 9, (12) 1256–1263. [DOI] [PubMed] [Google Scholar]
- Huebner, K. , Druck, T. , 1993. Chromosomal localization of four human zinc finger cDNAs. Hum. Genet.. 91, (3) 217–222. [DOI] [PubMed] [Google Scholar]
- Jackson, S.P. , Bartek, J. , 2009. The DNA-damage response in human biology and disease. Nature. 461, (7267) 1071–1078. [DOI] [PMC free article] [PubMed] [Google Scholar]
- Jackson, J.G. , Post, S.M. , 2011. Regulation of tissue- and stimulus-specific cell fate decisions by p53 in vivo. J. Pathol.. 223, (2) 127–136. [DOI] [PubMed] [Google Scholar]
- Jen, K.Y. , Cheung, V.G. , 2003. Transcriptional response of lymphoblastoid cells to ionizing radiation. Genome Res.. 13, (9) 2092–2100. [DOI] [PMC free article] [PubMed] [Google Scholar]
- Jen, K.Y. , Cheung, V.G. , 2005. Identification of novel p53 target genes in ionizing radiation response. Cancer Res.. 65, (17) 7666–7673. [DOI] [PubMed] [Google Scholar]
- Joseph, L.J. , Le Beau, M.M. , 1988. Molecular cloning, sequencing, and mapping of EGR2, a human early growth response gene encoding a protein with “zinc-binding finger” structure. Proc. Natl. Acad. Sci. U S A. 85, (19) 7164–7168. [DOI] [PMC free article] [PubMed] [Google Scholar]
- Jung, M.S. , Yun, J. , 2001. p53 and its homologues, p63 and p73, induce a replicative senescence through inactivation of NF-Y transcription factor. Oncogene. 20, (41) 5818–5825. [DOI] [PubMed] [Google Scholar]
- Kamat, A.K. , Rocchi, M. , 1993. Lamin A/C gene and a related sequence map to human chromosomes 1q12.1–q23 and 10. Somat. Cell Mol. Genet.. 19, (2) 203–208. [DOI] [PubMed] [Google Scholar]
- Knowles, B.B. , Howe, C.C. , 1980. Human hepatocellular carcinoma cell lines secrete the major plasma proteins and hepatitis B surface antigen. Science. 209, (4455) 497–499. [DOI] [PubMed] [Google Scholar]
- Ko, L.J. , Prives, C. , 1996. p53: puzzle and paradigm. Genes Dev.. 10, (9) 1054–1072. [DOI] [PubMed] [Google Scholar]
- Komarova, E.A. , Kondratov, R.V. , 2004. Dual effect of p53 on radiation sensitivity in vivo: p53 promotes hematopoietic injury, but protects from gastro-intestinal syndrome in mice. Oncogene. 23, (19) 3265–3271. [DOI] [PubMed] [Google Scholar]
- Landmark, H. , Nahas, S.A. , 2007. "Transcriptional response to ionizing radiation in human radiation sensitive cell lines. Radiother. Oncol.. 83, (3) 256–260. [DOI] [PubMed] [Google Scholar]
- Laptenko, O. , Prives, C. , 2006. Transcriptional regulation by p53: one protein, many possibilities. Cell Death Differ.. 13, (6) 951–961. [DOI] [PubMed] [Google Scholar]
- Lavin, M.F. , 2008. Ataxia-telangiectasia: from a rare disorder to a paradigm for cell signalling and cancer. Nat. Rev. Mol. Cell Biol.. 9, (10) 759–769. [DOI] [PubMed] [Google Scholar]
- Lempiainen, H. , Halazonetis, T.D. , 2009. "Emerging common themes in regulation of PIKKs and PI3Ks. EMBO J.. 28, (20) 3067–3073. [DOI] [PMC free article] [PubMed] [Google Scholar]
- Linhart, C. , Elkon, R. , 2005. "Deciphering transcriptional regulatory elements that encode specific cell cycle phasing by comparative genomics analysis. Cell Cycle. 4, (12) 1788–1797. [DOI] [PubMed] [Google Scholar]
- Lopez-Contreras, A.J. , Fernandez-Capetillo, O. , 2010. The ATR barrier to replication-born DNA damage. DNA Repair (Amst). 9, (12) 1249–1255. [DOI] [PMC free article] [PubMed] [Google Scholar]
- Maglione, D. , Guerriero, V. , 1993. Two alternative mRNAs coding for the angiogenic factor, placenta growth factor (PlGF), are transcribed from a single gene of chromosome 14. Oncogene. 8, (4) 925–931. [PubMed] [Google Scholar]
- Manni, I. , Mazzaro, G. , 2001. NF-Y mediates the transcriptional inhibition of the cyclin B1, cyclin B2, and cdc25C promoters upon induced G2 arrest. J. Biol. Chem.. 276, (8) 5570–5576. [DOI] [PubMed] [Google Scholar]
- Mori, M. , Benotmane, M.A. , 2005. Transcriptional response to ionizing radiation in lymphocyte subsets. Cell Mol. Life Sci.. 62, (13) 1489–1501. [DOI] [PMC free article] [PubMed] [Google Scholar]
- Neal, J.A. , Meek, K. , 2011. Choosing the right path: does DNA-PK help make the decision?. Mutat. Res. [DOI] [PMC free article] [PubMed] [Google Scholar]
- Negrini, S. , Gorgoulis, V.G. , 2010. Genomic instability–an evolving hallmark of cancer. Nat. Rev. Mol. Cell Biol.. 11, (3) 220–228. [DOI] [PubMed] [Google Scholar]
- Niu, N. , Qin, Y. , 2010. Radiation pharmacogenomics: a genome-wide association approach to identify radiation response biomarkers using human lymphoblastoid cell lines. Genome Res.. 20, (11) 1482–1492. [DOI] [PMC free article] [PubMed] [Google Scholar]
- Occhiodoro, T. , Beckmann, K.R. , 1989. Human alpha-l-fucosidase: complete coding sequence from cDNA clones. Biochem. Biophys. Res. Commun.. 164, (1) 439–445. [DOI] [PubMed] [Google Scholar]
- O'Driscoll, M. , Jeggo, P.A. , 2006. The role of double-strand break repair – insights from human genetics. Nat. Rev. Genet.. 7, (1) 45–54. [DOI] [PubMed] [Google Scholar]
- Paz, A. , Brownstein, Z. , 2011. SPIKE: a database of highly curated human signaling pathways. Nucleic Acids Res.. 39, (Database issue) D793–D799. [DOI] [PMC free article] [PubMed] [Google Scholar]
- Peebles, T.P.T.T. , 1978. Isolation of four unusual pediatric solid tumor cell lines. Pediatr. Res.. 12, (Suppl. 4) [Google Scholar]
- Polo, S.E. , Jackson, S.P. , 2011. Dynamics of DNA damage response proteins at DNA breaks: a focus on protein modifications. Genes Dev.. 25, (5) 409–433. [DOI] [PMC free article] [PubMed] [Google Scholar]
- Ponten, J. , Saksela, E. , 1967. Two established in vitro cell lines from human mesenchymal tumours. Int. J. Cancer. 2, (5) 434–447. [DOI] [PubMed] [Google Scholar]
- Popanda, O. , Marquardt, J.U. , 2009. Genetic variation in normal tissue toxicity induced by ionizing radiation. Mutat. Res.. 667, (1–2) 58–69. [DOI] [PubMed] [Google Scholar]
- Pugh, T.J. , Keyes, M. , 2009. Sequence variant discovery in DNA repair genes from radiosensitive and radiotolerant prostate brachytherapy patients. Clin. Cancer Res.. 15, (15) 5008–5016. [DOI] [PubMed] [Google Scholar]
- Rankin, J. , Ellard, S. , 2006. The laminopathies: a clinical review. Clin. Genet.. 70, (4) 261–274. [DOI] [PubMed] [Google Scholar]
- Rashi-Elkeles, S. , Elkon, R. , 2006. Parallel induction of ATM-dependent pro- and anti-apoptotic signals in response to ionizing radiation in murine lymphoid tissue. Oncogene. 25, (10) 1584–1592. [DOI] [PubMed] [Google Scholar]
- Riley, T. , Sontag, E. , 2008. Transcriptional control of human p53-regulated genes. Nat. Rev. Mol. Cell Biol.. 9, (5) 402–412. [DOI] [PubMed] [Google Scholar]
- Skopek, T.R. , Liber, H.L. , 1978. Isolation of a human lymphoblastoid line heterozygous at the thymidine kinase locus: possibility for a rapid human cell mutation assay. Biochem. Biophys. Res. Commun.. 84, (2) 411–416. [DOI] [PubMed] [Google Scholar]
- Snyder, A.R. , 2004. Review of radiation-induced bystander effects. Hum. Exp. Toxicol.. 23, (2) 87–89. [DOI] [PubMed] [Google Scholar]
- Tabach, Y. , Milyavsky, M. , 2005. The promoters of human cell cycle genes integrate signals from two tumor suppressive pathways during cellular transformation. Mol. Syst. Biol.. 1, 0022 [DOI] [PMC free article] [PubMed] [Google Scholar]
- Thony, B. , Auerbach, G. , 2000. Tetrahydrobiopterin biosynthesis, regeneration and functions. Biochem. J.. 347, (Pt 1) 1–16. [PMC free article] [PubMed] [Google Scholar]
- Turesson, I. , 1990. Individual variation and dose dependency in the progression rate of skin telangiectasia. Int. J. Radiat. Oncol. Biol. Phys.. 19, (6) 1569–1574. [DOI] [PubMed] [Google Scholar]
- Ventura, A. , Kirsch, D.G. , 2007. Restoration of p53 function leads to tumour regression in vivo. Nature. 445, (7128) 661–665. [DOI] [PubMed] [Google Scholar]
- Warner, L.E. , Mancias, P. , 1998. Mutations in the early growth response 2 (EGR2) gene are associated with hereditary myelinopathies. Nat. Genet.. 18, (4) 382–384. [DOI] [PubMed] [Google Scholar]
- Wei, C.L. , Wu, Q. , 2006. A global map of p53 transcription-factor binding sites in the human genome. Cell. 124, (1) 207–219. [DOI] [PubMed] [Google Scholar]
- Willems, P.J. , Gatti, R. , 1991. Fucosidosis revisited: a review of 77 patients. Am. J. Med. Genet.. 38, (1) 111–131. [DOI] [PubMed] [Google Scholar]
- Wong-Staal, F. , Dalla-Favera, R. , 1981. Three distinct genes in human DNA related to the transforming genes of mammalian sarcoma retroviruses. Science. 213, (4504) 226–228. [DOI] [PubMed] [Google Scholar]
- Yun, J. , Chae, H.D. , 1999. p53 negatively regulates cdc2 transcription via the CCAAT-binding NF-Y transcription factor. J. Biol. Chem.. 274, (42) 29677–29682. [DOI] [PubMed] [Google Scholar]
- Zamzami, N. , Kroemer, G. , 2005. p53 in apoptosis control: an introduction. Biochem. Biophys. Res. Commun.. 331, (3) 685–687. [DOI] [PubMed] [Google Scholar]
- Zhu, Z. , Shendure, J. , 2006. Discovering functional transcription-factor combinations in the human cell cycle. Genome Res.. 15, 848–855. [DOI] [PMC free article] [PubMed] [Google Scholar]
- Zschenker, O. , Borgmann, K. , 2006. Lymphoblastoid cell lines differing in p53 status show clear differences in basal gene expression with minor changes after irradiation. Radiother. Oncol.. 80, (2) 236–249. [DOI] [PubMed] [Google Scholar]
Associated Data
This section collects any data citations, data availability statements, or supplementary materials included in this article.
Supplementary Materials
The following are the supplementary data related to this article:
Supplementary data
Supplementary data
Supplementary data
Supplementary data
Supplementary data
Supplementary data
Supplementary data