

Abstract
The alpha‐folate receptor (α‐FR) is highly‐expressed in various non‐mucinous tumors of epithelial origin, including ovarian carcinoma. The aim of this study was to investigate the relationship between alpha‐folate receptor (α‐FR) and the clinico‐pathologic features and outcomes of serous ovarian carcinoma patients and the possible mechanism of α‐FR to chemo‐resistance. Therefore, semi‐quantitative reverse‐transcription polymerase chain reactions for α‐FR expression were performed in the 91 specimens of serous ovarian carcinomas. The expression of α‐FR in each ovarian cancer tissue specimen was defined as the ratio of density of α‐FR to density of glyceraldehyde‐3‐phosphate dehydrogenase (GAPDH). In vitro apoptotic experiments were tested in the original OVCAR‐3 tumor cells and various OVCAR‐3 α‐FR‐transfectants. Patients with an increased α‐FR expression level had poorer responses to chemotherapy (per α‐FR expression level increase: odds ratio (OR): 8.97 (95% confidence interval (CI): 1.40–57.36), p = 0.021). An increased α‐FR expression level was an independently poor prognostic factor for disease free interval (DFI) (per α‐FR expression level increase: hazard ratio (HR): 2.45 (95% CI: 1.16–5.18), p = 0.02) and had a negative impact on overall survival (OS) of these serous ovarian cancer patients (per α‐FR expression level increase: HR: 3.6 (95% CI: 0.93–13.29), p = 0.03) by multivariate analyses. α‐FR inhibited cytotoxic drug‐induced apoptosis in our in vitro apoptotic assays. α‐FR could induce chemo‐resistance via regulating the expression of apoptosis‐related molecules, Bcl‐2 and Bax. Therefore, α‐FR can be a potential biomarker for the prediction of chemotherapeutic responses and clinical prognosis. It also could be the target of ovarian cancer treatment.
Keywords: Alpha-folate receptor, Ovarian serous carcinoma, Chemotherapy, Apoptosis, Overall survival
Highlights
Patients with an increased
alpha;‐FR expression level had poorer responses to chemotherapy.
Increased
alpha;‐FR expression level was a poor prognostic factor for overall survival of the patients.
#x025BA; Ovarian serous cancer patients with high levels of
alpha;‐FR had poor chemo‐response.
#x025BA;
alpha;‐FR can be a biomarker for the outcome of ovarian serous cancer patients.
1. Introduction
Ovarian carcinoma has become more and more important in recent years because it is the leading cause of death among all gynecologic malignancies (Boyle et al., 2000). The annual incidence rate of ovarian cancer in the United States was 12.2 per 100,000 and the death rate was 8.2 per 100,000 in 2007 (U.S. Cancer Statistics Working Group.). More than 90% are of epithelial origin, 43.5% of which are the serous histologic type (Quirk and Natarajan, 2005). No specific symptoms, difficulty in early diagnosis, insufficient accurate tumor markers, and a lack of information regarding ovarian tumor biology all contribute to a poor prognosis (Rustin, 1992). The 5‐year relative survival rate is 45% overall, but varies by stage and histologic type (Jemal et al., 2007). Most cases (∼68%) are diagnosed as distant stage diseases, so their overall 5‐year relative survival rate is around 30% (Jemal et al., 2007).
The standard treatment for ovarian cancer is surgical tumor debulking, followed by platinum‐containing chemotherapy (Agarwal and Kaye, 2003; DiSaia and Bloss, 2003). Conventional prognostic parameters are disease stage, histologic sub‐type, degree of malignancy, and residual tumor after surgical treatment (Malkasian et al., 1984; Swenerton et al., 1985). However, these factors do not present a comprehensive picture of the tumor biology of ovarian cancer and are frequently interrelated. Thus, identifying new biomarkers that are predictive of individual disease course and prognosis is extremely important.
Detection of tumor markers in the body circulation or from cancerous tissue can be helpful in the diagnosis and/or the monitoring of the therapeutic responses of patients with various tumors, including carcinomas of the ovary, prostate, gastro‐intestinal tract, or breast (Jacobs and Bast, 1989; Berek and Bast, 1995; Pannek and Partin, 1998; Hunerbein, 1998; Rubach et al., 1997; Cheng et al., 2009). Traditionally, carcinoma antigen 125 (CA‐125) is the most commonly used biomarker for patients with ovarian carcinoma (Jacobs and Bast, 1989). It is also clinically valuable in monitoring treatment response. However, elevation of CA‐125 is also found in some benign conditions, including endometriosis, uterine myoma, or pelvic inflammatory disease. Therefore, there is room for improvement.
Folate, a basic component of cell metabolism and DNA synthesis and repair, is an essential vitamin required by both normal and tumor cells (Choi and Mason, 2000). Folate receptors are glycosyl‐phosphatidylinositol‐linked membrane proteins of 38–40 kDa that preferentially bind to oxidized folates (Antony, 1996). Three isoforms of folate receptors have been identified, and each of them has tissue‐specific distribution and folate‐binding potential (Antony, 1996). The α‐isoform is the most widely studied and has restricted expression in normal cells, but is highly‐expressed in various non‐mucinous tumors of epithelial origin, including ovarian carcinoma (Parker et al., 2005; Elnakat and Ratnam, 2006). However, the reasons for the expression and function of folate receptor in tumors remain unclear. Modulating folate uptake from serum (Kane et al., 1988) or generating regulatory signals (Antony, 1996; Miotti et al., 2000) for tumor growth have been proposed.
The aim of this study was to evaluate whether alpha‐folate receptor (α‐FR) can be a biomarker on chemo‐response of serous ovarian carcinoma and to determine whether highly‐expressed levels of α‐FR is an independent prognostic factor on the outcome of serous ovarian carcinoma p;patients. The possible mechanism of α‐FR on chemo‐resistance of ovarian cancer cells was also investigated.
2. Materials and methods
2.1. Patients and specimens
Between July 2000 and June 2008, 91 patients with serous ovarian carcinoma undergoing staging or debulking surgery were recruited. Detailed records were retrospectively obtained until June 2010. The experimental protocols were reviewed and approved by the Institutional Review Board of National Taiwan University Hospital. After surgery, early‐ or advanced‐staged patients received four to six courses of adjuvant chemotherapy with platinum plus cyclophosphamide or paclitaxel regimens except those with stage IA and grade I disease. Histologic grading and disease staging were classified based on the International Federation of Gynecology and Obstetrics (FIGO) (International Federation of Gynecology and Obstetrics, 1971; International Federation of Gynecology and Obstetrics, 1987).
Other clinical information including age, obstetrical history, pre‐operative CA‐125, therapeutic history, surgical findings during surgery, recurrence, and survival, was obtained from the patients' medical records and surgical notes. The maximum diameter of the residual tumor during surgery was also reviewed. Optimal debulking surgery was defined as the maximum diameter of the residual tumor ≤1 cm. Otherwise, the surgery was categorized as sub‐optimal debulking.
Periodic examinations during follow‐up included history‐taking, pelvic and rectal examinations, and regional lymph node palpation every 3 months for 2 years, and every 6 months thereafter. A vault smear of the vaginal cuff and CA‐125 determination were done on each visit. Computerized tomography (CT) or magnetic resonance imaging (MRI) was done for suspected recurrence. Abnormal results of imaging studies, aspiration cytology from ascites, elevated tumor markers (≥2‐fold the upper limit of normal) in two consecutive tests in 2‐week intervals, or tissue proven from biopsy, if possible, was defined as recurrence.
2.2. Extraction of RNA in ovarian cancer tissues
Part of each cancerous tissue specimen collected during surgery was immediately frozen in liquid nitrogen and stored at −70 °C until analyzed, while the remaining tissue specimens were sent for pathology examinations. The total RNA of ovarian cancer tissues was isolated using TRIzol reagent (Invitrogen, Carlsbad, CA) following the manufacturer's instructions.
2.3. Quantitative analysis of α‐FR by semi‐quantitative reverse‐transcription polymerase chain reaction (SQ RT‐PCR)
RNA was first reverse‐transcribed to cDNA using a Moloney murine leukemia virus reverse transcriptase kit (Invitrogen Life Technologies, San Diego, CA). To generate α‐FR, a polymerase chain reaction (PCR) was performed using human ovarian cancer cDNA as the template, and a set of primers, 5′‐CCGGACTAGACTGAGCCAGACGGAGAGC‐3′ and 5′‐ CCGGAATTCGCAGGGATTTCCAGGTATCA‐3′ for 30 cycles. Glyceraldehyde‐3‐phosphate dehydrogenase (GAPDH) was used as the housekeeping gene to compare with the target gene, α‐FR. To generate GAPDH, the PCR was performed using human ovarian cancer cDNA as the template and a set of primers, 5′‐ACCCAGAAGACTGTGGATGG‐3′ and 5′‐TGCTGTAGCCAAATTCGTTG‐3′ for 30 cycles.
The PCR products were analyzed in 1% agarose gel with ethidium bromide staining in TBE solution. Periodic DNA sequencing was performed to confirm that the PCR products were exact, and gel images were taken using a CCD camera (Cohu, Inc., Poway, CA). The α‐FR and GAPDH levels were quantified by interpreting the density of bands from the gel images by a densitometer (Phoretix International Ltd., Newcastle upon Tyne, UK) as described previously (Mozzetti et al., 2005), where one band was the density of α‐FR and the other the density of GAPDH. The ratio of density of α‐FR to density of GAPDH was regarded as the expression level of α‐FR in each ovarian cancer tissue specimen.
2.4. Cell culture and transfection
The human ovarian cancer cell line‐ OVCAR‐3 was obtained from the ATCC (Manassas, VA). To generate pcDNA3‐α‐FR, α‐FR was first amplified by PCR using OVCAR‐3 cell cDNA as the template and 5′‐ CCGGTCTAGACAAGGGGGAGTGTAGAGCAG ‐3′ and 5′‐CGCAAGCTTGCAGGGATTTCCAGGTATCA‐3′ as the primers. The amplified product was then cloned into the XbaI/BamH1 sites of pcDNA3 vector (Invitrogen Corp., Carlsbad, California, USA). The transfection of α‐FR was performed using LipofectAMINE reagent (Life Technologies, Inc., Paisley, UK) according to the manufacturer's instructions. OVCAR‐3 cells were transfected with the pcDNA3 (mock) as the control. The expression levels of α‐FR in the α‐FR and mock‐OVCAR‐3 transfectants were examined by RT‐PCR and flow cytometric analysis. These OVCAR‐3 transfectants were further utilized in the subsequent experiments.
2.5. Detection of activated annexin V, caspase 3 and 7 by flow cytometric analysis
To evaluate the influence of α‐FR on cancer cells treated with cytotoxic drugs, apoptotic assays of various OVCAR‐3 transfectants were performed by flow cytometric analysis with some modifications (Tsao et al., 2004). Briefly, various OVCAR‐3 transfectants were harvested and treated with 25 μM of cisplatin, 5 μM of paclitaxel or 25 μM of topotecan. The cytotoxic drug‐treated OVCAR‐3 transfectants were incubated with FITC‐conjugated Annexin V (BD Bioscience, Heidelberg, Germany) at room temperature, and were then analyzed by flow cytometry (FACScan; Becton Dickinson). The OVCAR‐3 cells treated with PBS were regarded as the negative control.
Detection of the caspase 3 and 7 activities in various OVCAR‐3 transfectants was done using a Vybrant FAMCaspase‐3 and ‐7 Assay Kit V‐35118 (Molecular Probes, Invitrogen) according to the manufacturer's instructions (Chang et al., 2009). Briefly, cytotoxic drug‐treated OVCAR‐3 transfectants were first mixed with FLICA solution, incubated in 5% CO2 in a light‐protected environment for 60 min at 37 °C, and then analyzed by flow cytometry.
2.6. Immunoprecipitation and immunoblotting
Immunoprecipitation and immunoblotting were performed with some modifications (Chen et al., 1999). Briefly, the various OVCAR‐3 transfectants were seeded overnight and treated with 5 μM cisplatin for 24 h. The cells were then lysed in the immunoprecipitation assay buffer and analyzed. The protein extracts were quantified using a BCA Protein Assay Kit (Pierce, Rockford, IL). Then, 50 μg of each cell lysate was resolved by SDS/PAGE (12% gel), transferred onto a PVDF/nylon membrane (Millipore), and probed with antibodies specific to Bcl‐2, Bax (Upstate Biotechnology, Inc. Lake Placid, NY) or α‐FR (Leica Biosystems Newcastle Ltd. UK). The membrane was then probed with either horseradish peroxidase‐conjugated goat anti‐mouse or goat anti‐rabbit antibody. The specific bands were visualized by an ECL® (enhanced chemiluminescence) Western blotting system (GE Healthcare). The procedures of immunoprecipitation and immunoblotting were also applied for the detection of α‐FR in serous ovarian cancerous tissues.
2.7. Statistical analysis and clinical correlation
Patients with disease progression or disease recurrence ≤6 months after discontinuing chemotherapy were defined as chemo‐resistant, and those without recurrence >6 months after discontinuing chemotherapy were defined as chemo‐sensitive. At the time of completing primary treatment, the cancer patients without any manifestation of disease were considered as free of tumor. Therefore, disease free interval (DFI) was defined as the length of time, after completing the primary treatment for ovarian carcinoma, during which patients survived without any clinical sign of relapse (Cheng et al., 2009). Overall survival (OS) was calculated as the time of initial diagnosis of ovarian carcinoma until the date of disease‐related death or last follow‐up (Cheng et al., 2009). The disease‐related death was regarded as the death caused by the malignancy or malignancy‐associated complications. The values of α‐FR expression levels were treated as continuous variables in the statistical analysis. When the α‐FR expression level increased in one, the odds ratio (OR) of chemo‐resistance and the hazard ratio (HR) of DFI or OS in this studied population would be calculated (Lin et al., 2010). For the survival curve of DFI and OS, the values of α‐FR expression levels were further defined as categorical variables. GAPDH was used as the housekeeping gene in this study which was expressed at relatively constant level in the cells. When referenced the expression of GAPDH, the values of α‐FR expression level >1.0 in cancerous tissue were defined as highly‐expressed, and ≤1.0 as low‐expressed when referenced as GAPDH.
Statistical analyses were done with the Statistical Package of Social Studies (SPSS) version 15.0 (SPSS Inc., Chicago, IL) for Windows in this study. The Mann–Whitney U test and Kruskal–Wallis test for continuous variable analysis and chi‐square test for categorical variable evaluation were used for evaluation. Furthermore, the binary logistic regression model for adjusted odds ratio (OR) and 95% confidence interval (CI) and the Cox regression model for adjusted hazard ratio (HR) and 95% CI were employed for selected variables. The Cox regression model was also used for risk analysis of cancer recurrence and disease‐related death.
In the in vitro experiments of cytotoxic drug resistance, the one‐way analysis of variance (ANOVA) was used to analyze the percentages of apoptosis in various OVCAR‐3 α‐FR‐transfectants treated with various cytotoxic drugs. All the data were expressed as mean ± S.E., which represented at least two different experiments. A p value <0.05 was considered statistically significant.
3. Results
3.1. Tissue α‐FR expression correlated with the disease progression of ovarian cancer
The clinico‐pathologic characters of this studied population were shown in Table 1. The mean age at the time of disease diagnosis was 55.8 years (range: 28–80 years). The mean duration of follow‐up for the 91 serous ovarian carcinoma patients was 38.3 months (range: 2–125 months). All the patients underwent tumor debulking surgeries followed by the platinum‐contained chemotherapeutic modalities at a 21‐day interval for 4 to 6 courses. The regimens were platinum drug with cyclophosphamide or paclitaxel.
Table 1.
Clinico‐pathologic characteristics of the 91 ovarian serous carcinoma patients
| Characteristic | Patients (91 cases) |
|---|---|
| Follow‐up period [mean ± SD, months] | 38.3 ± 27.6 |
| Patients | |
| Age [mean ± SD, years] | 55.8 ± 11.4 |
| Parity [mean ± SD] | 2.8 ± 1.7 |
| Menopause [yes/no, cases] | 56/35 |
| Disease status | |
| FIGO stage [I&II/III&IV, cases] | 10/81 |
| Tumor grade [1&2/3, cases] | 28/63 |
| Debulking surgery [optimal/sub‐optimal, cases] | 40/51 |
| Lymph node metastasis [yes/no, cases] | 18/25 |
| Biomarkers | |
| Pre‐operative CA‐125 [mean (range), U/ml] | 2611.6 (38.9–26,136) |
| α‐FR level [mean (range)] | 0.67 (0.08–1.98) |
| Outcome | |
| Chemo‐therapeutic response [sensitive/resistant, cases] | 54/37 |
| Disease recurrence [yes/no, cases] | 68/23 |
| Disease‐related death [yes/no, cases] | 41/50 |
SD: standard deviation; FIGO: the International Federation of Gynecology and Obstetrics; CA‐125: carcinoma antigen 125; α‐FR: α‐folate receptor.
In these cancer specimens, α‐FR expression could be detected by Western blotting analysis (Figure 1A) and RT‐PCR (Figure 1B). The expression levels of α‐FR revealed good correlations between the protein (Western blotting) and mRNA (RT‐PCR) levels (Figure 1). Therefore, we used the ratio of PCR density of α‐FR to PCR density of GAPDH as the expression level of α‐FR in each ovarian serous cancerous tissue specimen. These ratios were further explored to examine the correlation between tissue α‐FR expression and the clinoco‐pathologic parameters, chemo‐response and prognosis of these patients. In this study, the mean level of tissue α‐FR expression by RT‐PCR was 0.67 (Table 1).
Figure 1.
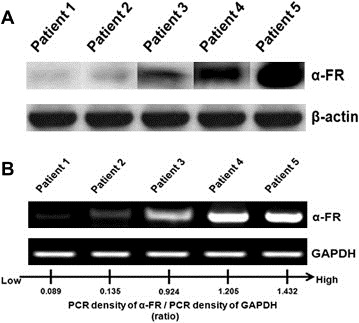
(A) α‐FR expression detected by Western blotting analysis on ovarian serous cancerous tissues. (B) Representative figures of PCR density of α‐FR/PCR density of GAPDH detected by densitometer. The ratio of α‐FR/GAPDH was defined as the α‐FR expression levels in cancerous tissues. Note: The α‐FR expression levels were 0.09 in patient 1, 0.14 in patient 2, 0.92 in patient 3, 1.21 in patient 4, and 1.43 in patient 5.
As shown in Table 2, The expression levels of α‐FR correlated well with the disease progression (stage I: 0.451, stage II: 0.415, stage III: 0.652, and stage IV: 0.768, p = 0.004, Kruskal–Wallis test). Patients with sub‐optimal debulking surgery had significantly higher tissue α‐FR expression levels than those with optimal debulking surgery (sub‐optimal: 0.766, optimal: 0.490, p = 0.003, Mann–Whitney U test). There were no differences in tissue α‐FR expression levels by tumor grade. Therefore, the higher levels of α‐FR in cancerous tissue would be associated with advanced disease and sub‐optimal surgical status.
Table 2.
Clinical correlations with tissue α‐folate receptor expression levels of the 91 ovarian serous carcinoma patients
| Patient no. | α‐FR expression level mean (range) | P value | |
|---|---|---|---|
| FIGO stage | |||
| I | 4 | 0.451 (0.177–0.481) | 0.004a |
| II | 6 | 0.415 (0.079–0.509) | |
| III | 65 | 0.652 (0.089–1.432) | |
| IV | 16 | 0.768 (0.426–1.983) | |
| Tumor grade | |||
| I | 8 | 0.805 (0.416–1.278) | 0.237a |
| II | 20 | 0.582 (0.089–1.983) | |
| III | 63 | 0.637 (0.079–1.432) | |
| Optimal surgery | |||
| Yes | 40 | 0.490 (0.079–1.278) | 0.003b |
| No | 51 | 0.766 (0.089–1.983) | |
α‐FR: α‐folate receptor; FIGO: the International Federation of Gynecology and Obstetrics.
Kruskal‐Wallis test.
Mann‐Whitney U test.
3.2. Expression levels of α‐FR in ovarian serous cancerous tissues correlated with the chemotherapeutic response of the patients
We then analyzed whether the expression level of α‐FR in cancerous tissue correlated with the chemo‐response of the cancer patients. As shown in Table 3, these 91 patients were divided into two sub‐groups, chemo‐sensitive (51 cases) and chemo‐resistant (37 cases) groups according to their disease relapse interval after adjuvant chemotherapy. In univariate analysis, the patients in the chemo‐resistant group had higher rates of sub‐optimal surgery (OR: 5.27 (95% confidence interval (CI): 2.0–13.67), p = 0.001), and increased mean expression level of tissue α‐FR (per α‐FR expression level increase: OR: 13.96 (95% CI: 2.71–71.88), p = 0.001), when compared with the chemo‐sensitive group. In multivariate analysis, higher α‐FR (per α‐FR expression level increase: OR: 8.97 (95% CI: 1.40–57.36), p = 0.021) was independent poor prognostic factors for the chemotherapeutic response in binary logistic regression analysis.
Table 3.
Prognostic factors for chemo‐resistancea of the 91 ovarian serous carcinoma patients
| Case No. of chemo‐resistance | Univariate analysis OR(95% CI)b | P value | Multivariate analysis OR(95% CI)b | P value | |
|---|---|---|---|---|---|
| FIGO stage [III&IV/I&II] | 34/3 | 0.59 (0.14–2.46) | 0.47 | ||
| Tumor grade [3/1&2] | 27/10 | 1.35 (0.54–3.34) | 0.52 | ||
| CA‐125 levels > 1000 U/mlc [yes/no] | 23/14 | 1.42 (0.60–3.32) | 0.42 | ||
| Lymph node metastasis [yes/no] | 9/7d | 0.88 (0.25–3.09) | 0.85 | ||
| Optimal surgery [no/yes] | 29/8 | 5.27 (2.0–13.67) | 0.001 | 2.54 (0.85–7.59) | 0.096 |
| α‐FR expression levele | 37 | 13.96 (2.71–71.88) | 0.001 | 8.97 (1.40–57.36) | 0.021 |
NO.: number; OR: odds ratio; CI: confidence interval; FIGO: the International Federation of Gynecology and Obstetrics; CA‐125: carcinoma antigen 125; α‐FR: α‐folate receptor.
The odds ratio referred as the risk of occurrence of chemo‐resistance.
Binary logistic regression.
Pre‐operative CA‐125 serum level.
Not every patient of advance disease underwent lymph node sampling or dissection in this study.
When the α‐FR expression level increased in one, the OR of chemo‐resistance in this studied population would be calculated.
3.3. α‐FR was the only independently prognostic factor on the outcome of ovarian serous carcinoma patients
Because the increased α‐FR expression in cancerous tissue was related to poor chemotherapeutic response (Table 3), the impact of increased tissue α‐FR level on the DFI and OS would be further evaluated. In this study, 68 patients had disease relapse and 37 of these 68 cases died of disease or disease‐associated complications at the tome of analysis. The prognostic factors for DFI of the 91 ovarian serous carcinoma patients were shown in Table 4. Neither FIGO stage, tumor grade, nor the status of lymph node metastasis had a significant effect on DFI. Pre‐operative serum CA‐125 level, when using 1000 U/ml as the cut‐off value, did not significantly correlate with DFI either. However, no optimal debulking surgery (no versus yes, HR: 1.94 (95% CI: 1.18–3.18), p = 0.009), and increased expression level of α‐FR (per α‐FR expression level increase: HR: 2.77 (95% CI: 1.29–5.93), p = 0.009) showed significantly poor impacts on the DFI by univariate analysis. In multivariate analysis, increased α‐FR levels (per α‐FR expression level increase: HR: 2.45 (95% CI: 1.16–5.18), p = 0.02) was independent poor prognostic factors for DFI.
Table 4.
Prognostic factors for disease free interval of the 91 ovarian serous carcinoma patients
| Case No. of disease relapse | Univariate analysis HR(95% CI)a | P value | Multivariate analysis HR(95% CI)a | P value | |
|---|---|---|---|---|---|
| FIGO stage [III&IV/I&II] | 62/6 | 1.65 (0.71–3.83) | 0.24 | ||
| Tumor grade [3/1&2] | 48/20 | 1.28 (0.75–2.16) | 0.37 | ||
| CA‐125 levels > 1000 U/ml [yes/no]b | 39/29 | 1.15 (0.71–1.87) | 0.56 | ||
| Lymph node metastasis [yes/no] | 18/14c | 0.97 (0.48–1.95) | 0.93 | ||
| Optimal surgery [no/yes] | 41/27 | 1.94 (1.18–3.18) | 0.009 | 1.3 (0.76–2.22) | 0.34 |
| α‐FR expression leveld | 68 | 2.77 (1.29–5.93) | 0.009 | 2.45 (1.16–5.18) | 0.02 |
No.: number; HR: Hazard ratio; CI: confidence interval; FIGO: the International Federation of Gynecology and Obstetrics; CA‐125: carcinoma antigen 125; α‐FR: α‐folate receptor.
Cox regression model.
Pre‐operative CA‐125 serum level.
Not every patient of advance disease underwent lymph node sampling or dissection in this study.
When the α‐FR expression level increased in one, the HR of DFI in this studied population would be calculated.
The prognostic factors for OS of the 91 ovarian serous carcinoma patients are shown in Table 5. No optimal debulking surgery (no versus yes, HR: 2.55 (95% CI: 1.28–5.09), p = 0.008), and increased α‐FR expression (per α‐FR expression level increase: HR: 4.76 (95% CI: 1.58–14.38), p = 0.006) had significantly poor impacts on OS by univariate analysis. Increased α‐FR level in cancerous tissue was an independent poor risk factor for the OS of these ovarian serous carcinoma patients (per α‐FR expression level increase: HR: 3.6 (95% CI: 0.93–13.29), p = 0.03) by multivariate analysis. Therefore, increased tissue α‐FR level was the only prognostic factor for predicting the poor OS of cancer patients in our study.
Table 5.
Prognostic factors for overall survival of the 91 ovarian serous carcinoma patients
| Case No. of disease‐related death | Univariate analysis HR(95% CI)a | P value | Multivariate analysis HR(95% CI)a | P value | |
|---|---|---|---|---|---|
| FIGO stage [III&IV/I&II] | 33/4 | 1.49 (0.52–4.23) | 0.46 | ||
| Tumor grade [3/1&2] | 22/15 | 0.73 (0.37–1.41) | 0.35 | ||
| CA‐125 levels > 1000 U/ml [yes/no]b | 21/16 | 1.28 (0.66–2.47) | 0.47 | ||
| Lymph node metastasis [yes/no] | 9/6c | 0.62 (0.21–1.80) | 0.38 | ||
| Optimal surgery [no/yes] | 24/13 | 2.55 (1.28–5.09) | 0.008 | 1.72 (0.80–3.70) | 0.17 |
| α‐FR expression leveld | 37 | 4.76 (1.58–14.38) | 0.006 | 3.6 (1.13–11.47) | 0.03 |
No.: number; HR: Hazard ratio; CI: confidence interval; FIGO: the International Federation of Gynecology and Obstetrics; CA‐125: carcinoma antigen 125; α‐FR: α‐folate receptor.
Cox regression model.
Pre‐operative CA‐125 serum level.
Not every patient of advance disease underwent lymph node sampling or dissection in this study.
When the α‐FR expression level increased in one, the HR of OS in this studied population would be calculated.
By referencing the PCR density of GAPDH, we further divided the patients into highly‐expressed (13 cases, α‐FR/GADPH > 1.0) and low‐expressed (78 cases, α‐FR/GADPH ≤ 1.0) α‐FR groups. The patients with highly‐expressed α‐FR had significantly shorter DFI (HR: 1.99 (1.02–3.87), p = 0.042) and poorer OS (HR: 3.72 (1.57–8.84), p = 0.003) compared with those with low‐expressed α‐FR. The corresponding survival curves of DFI and OS of the highly‐ and low‐expressed α‐FR groups were presented in Figure 2A and B, respectively.
Figure 2.
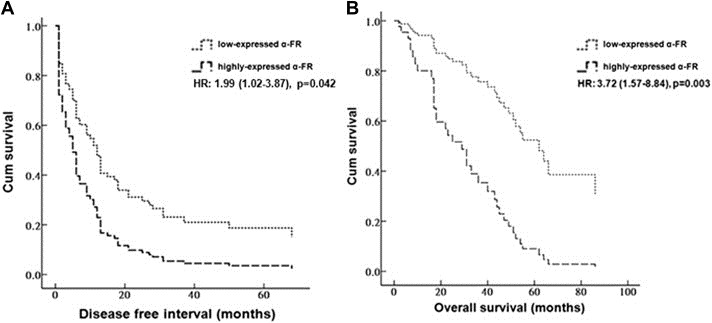
(A) Survival curves of disease free interval (DFI) of the 91 ovarian serous carcinoma patients in highly‐ and low‐expressed α‐FR groups by a cut‐off value of α‐FR as 1.0. (B) Curves of overall survival (OS) of the 91 ovarian serous carcinoma patients in highly‐ and low‐expressed α‐FR groups by a cut‐off value of α‐FR as 1.0. Note: The patients with highly‐expressed α‐FR had significantly shorter DFI (HR: 1.99 (1.02–3.87), p = 0.042) and poorer OS (HR: 3.72 (1.57–8.84), p = 0.003) compared with those with low‐expressed α‐FR.
3.4. α‐FR‐over‐expressed ovarian cancer cells inhibited apoptosis induced by cytotoxic drugs
We then investigated if the patients with highly‐expressed tissue α‐FR having shorter DFS and OS were due to α‐FR‐induced chemo‐resistance to cytotoxic drugs. To investigate the possible mechanism of α‐FR in the chemo‐resistance of ovarian cancer patients, in vitro apoptotic assays were performed. We first generated OVCAR‐3 α‐FR‐transfectants. The representative figures of α‐FR expression in original, mock‐transfected and two α‐FR‐transfected OVCAR‐3 clones by RT‐PCR were shown in Figure 3A. The OVCAR‐3 α‐FR‐transfectants expressed higher levels of α‐FR than the original and mock‐transfected OVCAR‐3 cells. The representative figures of flow cytometric analysis in the annexin V assays were shown in Figure 3B1. Annexin V‐positive cells were defined as apoptotic cells. As shown in Figure 3B2, the increasing percentages of annexin V‐positive cells were lower in the OVCAR‐3 α‐FR‐transfectants than those in the original and mock‐transfected OVCAR‐3 cells, when treated cells with 25 μM of cisplatin 24 h later (original OVCAR‐3 5.52 ± 0.59%, mock‐transfected OVACR‐3 8.60 ± 1.23%, OVCAR‐3 α‐FR‐transfectant (1) 1.47 ± 0.08%, OVCAR‐3 α‐FR‐transfectant (2) 0.79 ± 0.62%, p < 0.001, one‐way ANOVA). The same phenomena could be also observed in cancer cells treated with cisplatin 48 h alter (original OVCAR‐3 21.74 ± 9.03%, mock‐transfected OVACR‐3 20.45 ± 6.32%, OVCAR‐3 α‐FR‐transfectant (1) 7.00 ± 1.88%, OVCAR‐3 α‐FR‐transfectant (2) 1.48 ± 0.37%, p = 0.047, one‐way ANOVA).
Figure 3.
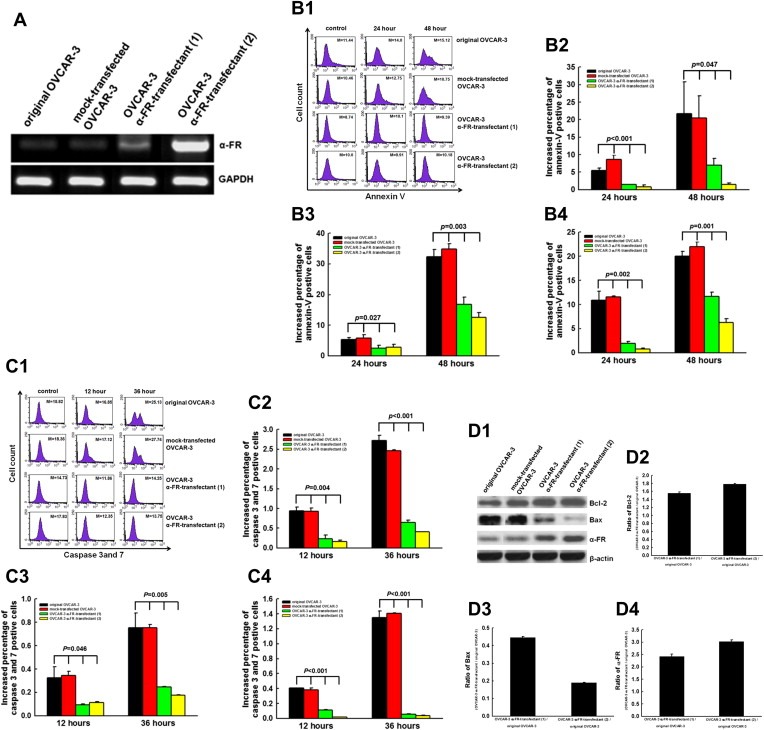
(A) α‐FR expression levels in various OVCAR‐3 transfectants by RT‐PCR analysis. (B) The annexin V assays for cells treated with various cytotoxic drugs. B1: Representative figures of flow cytometric analysis for annexin V‐stained in original and various OVCAR‐3 transfectants treated with 25 μM cisplatin. Note: The M values indicated the median value of total cell stained with annexin V in original and various OVCAR‐3 transfectants. B2: The bar figure of the increasing percentages of annexin‐v‐positive cells treated with 25 μM cisplatin at different intervals. B3: The bar figure of the increasing percentages of annexin‐v‐positive cells treated with 5 μM paclitaxel at different intervals. B4: The bar figure of the increasing percentages of annexin‐v‐positive cells treated with 25 μM topotecan at different intervals. Note: The OVCAR‐3 α‐FR‐transfectants had lower increasing percentages of apoptotic cells than the original OVCAR‐3 or mock‐OVCAR‐3 cells regardless treated with paclitaxel, cisplatin, topotecan for 24 or 48 h. Results were presented as mean ± S.E. (C) The caspase assays for cells treated with various cytotoxic drugs. C1: Representative figures of flow cytometric analysis for caspase 3 and 7‐positive cells in original and OVCAR‐3 transfectants treated with 25 μM cisplatin. Note: The M values indicated the median value of total cell stained with caspase 3 and 7 in original and various OVCAR‐3 transfectants. C2: The bar figure of the increasing percentages of caspase 3 and 7‐positive cells treated with 25 μM cisplatin at different intervals. C3: The bar figure of the increasing percentages of caspase 3 and 7‐positive cells treated with 5 μM paclitaxel at different intervals. C4: The bar figure of the percentages of caspase 3 and 7‐positive cells treated with 25 μM topotecan at different intervals. Note: The OVCAR‐3 α‐FR‐transfectants had lower increased percentages of caspase‐expressing cells than the original OVCAR‐3 or mock‐OVCAR‐3 cells regardless treated with paclitaxel, cisplatin, topotecan for 12 or 36 h. Results were presented as mean ± S.E. (D) Expression levels of apoptosis‐related molecules in original and OVCAR‐3 α‐FR‐transfectants by Western blotting analysis. D1: Representative figures of Western blotting. D2: The bar figures of the ratios of Bcl‐2 expressed in OVCAR‐3 α‐FR‐transfectants and original OVCAR‐3. Note: The expression levels of Bcl‐2 in OVCAR‐3 α‐FR‐transfectants were higher than those in the original and mock‐transfected OVCAR‐3 cells. D3: The bar figures of the ratios of Bax expressed in OVCAR‐3 α‐FR‐transfectants and original OVCAR‐3. Note: The expression levels of Bax in OVCAR‐3 α‐FR‐transfectants were lower than those in the original and mock‐transfected OVCAR‐3 cells. D4: The bar figures of the ratios of α‐FR expressed in OVCAR‐3 α‐FR‐transfectants and original OVCAR‐3. Note: α‐FR was expressed higher in OVCAR‐3 α‐FR‐transfectant (2) than OVCAR‐3 α‐FR‐transfectant (1).
The results of cells treated with 5 μM of paclitaxel or 25 μM topotecan were exhibited in Figure 3B3 and 3B4, respectively. The increasing percentages of annexin V‐positive cells (apoptotic cells) were lower in the two OVCAR‐3 α‐FR‐transfectants than those in original and mock‐transfected OVCAR‐3 cells when treated with paxlitaxel (p = 0.027, one‐way ANOVA) or topotecan (p = 0.003, one‐way ANOVA) 24 h later.
3.5. α‐FR inhibited cytotoxic drug‐induced apoptosis through the caspase pathway
We then evaluated the anti‐apoptotic caspase pathway induced by α‐FR. The representative figures of flow cytometric analysis in the caspase 3 and 7‐positive cells are shown in Figure 3C1. Regardless treated the cells with 25 μM of cisplatin 12 or 36 h later, the increasing percentages of caspase 3 and 7‐positive cells were significantly lower in the OVCAR‐3 α‐FR‐transfectants than the original and mock‐transfected OVCAR‐3 cells (in 12 h, original OVCAR‐3 0.95 ± 0.10%, mock‐transfected OVCAR03 0.93 ± 0.09%, OVCAR‐3 α‐FR‐transfectant (1) 0.24 ± 0.13%, OVCAR‐3 α‐FR‐transfectant (2) 0.16 ± 0.06%, p = 0.004; in 36 h, original OVCAR‐3 2.72 ± 0.13%, mock‐transfected OVCAR‐3 2.46 ± 0.03%, OVCAR‐3 α‐FR‐transfectant (1) 0.65 ± 0.08%, OVCAR‐3 α‐FR‐transfectant (2) 0.41 ± 0.07%, p < 0.001, one‐way ANOVA) (Figure 3C2).
The percentages of caspase 3 and 7‐positive cells in various OVCAR‐3 transfectants treated with paclitaxel or topotecan were exhibited in Figure 3C3 and C4, respectively. Similar phenomena were also observed like cells treated with cisplatin, the increasing percentages of caspase 3 and 7‐positive cells were significantly lower in the OVCAR‐3 α‐FR‐transfectants than the original and mock‐transfected OVCAR‐3 cells, when treated cells with paclitaxel or topotecan.
3.6. α‐FR generated anti‐apoptotic function via regulating the apoptosis‐related molecules
We further explored the possible apoptosis‐related molecules involved in the α‐FR‐related anti‐apoptotic mechanism. The expression levels of apoptosis‐related molecule, Bcl‐2 and Bax, in the original, mock‐transfected OVCAR‐3 cells, or OVCAR‐3 α‐FR‐transfectants were shown in Figure 3D1. After α‐FR was transfected, the anti‐apoptotic molecule, Bcl‐2, was expressed at 1.6–1.8 folds higher in OVCAR‐3 α‐FR‐transfectants than the original OVCAR‐3 cells (Figure 3D2). Besides, the expression levels of pro‐apoptotic molecule, Bax, were significantly reduced at 0.2–0.4 folds lower in OVCAR‐3 α‐FR‐transfectants than the original OVCAR‐3 cells (Figure 3D3). The OVCAR‐3 α‐FR‐transfectant (2) which expressed higher levels of α‐FR than the OVCAR‐3 α‐FR‐transfectant (1) (Figure 3D4) had higher level of Bcl‐2 (Figure 3D2) and lower expression of Bax (Figure 3D3).
Our results indicated that α‐FR could inhibit the cytotoxic drug‐induced apoptosis through caspase pathway and regulating the apoptosis‐related molecules, Bcl‐2 and Bax.
4. Discussion
CA‐125 has been used as a tumor marker for ovarian cancer by convention. Although several new biomarkers such as mesothelin, lysophosphatidic acid, prostasin, osteopontin, and VEGF have been recently identified, CA‐125 remains the only tumor marker to have a well‐defined and validated role in the monitoring of epithelial ovarian cancer, especially in non‐mucinous types (Scholler et al., 1999; Xu et al., 1998; Mok et al., 2001; Kim et al., 2002; Lu et al., 2004; Meyer and Rustin, 2000; Huang et al., 2006). However, the sensitivity of CA‐125 for early stage disease detection is very low (Terry et al., 2004). Therefore, more biomarkers should be explored for the early detection, treatment and biology of ovarian carcinoma.
The increasing levels of tissue α‐FR were noted (Table 2), when the tumor progressed from early to advanced stages. Toffoli et al. also reported that patients with advanced stages have higher α‐FR levels as compared to those in the early stages (Toffoli et al., 1997). Therefore, α‐FR seems to play an important role in the progression of ovarian carcinoma. In addition, the molecule can be over‐expressed in several non‐mucinous malignancies, including ovarian, renal, lung and breast cancers (Parker et al., 2005; Elnakat and Ratnam, 2006). It is also reported as a tumor antigen, such that 70% of women with ovarian or breast carcinoma show a measurable immune response against this protein (Knutson et al., 2006). However, Mantovani et al. stated that only 41% of cases can be detected as α‐FR positive in sera (Mantovani et al., 1994). A convenient and standard method has not yet been developed to measure the cancerous expression level of α‐FR. Therefore, we used GAPDH was used as the housekeeping gene to compare with the target gene, α‐FR. The PCR density of α‐FR/GAPDH exhibited the α‐FR expression level in ovarian serous cancerous tissues in this survey.
We demonstrated clinically that a higher expression of α‐FR in serous ovarian cancerous tissue could independently predict poor prognosis of cancer patients (3, 4, 5 and Figure 2). In contrast, Kalli et al. reported that α‐FR status was not associated with time to recurrence or overall survival (Kalli et al., 2008). Our explanation was that a variety of histologic types such as serous, mucinous, endometrioid and clear cell were recruited in their study. They reported that 72% of epithelial ovarian cancer patients (serous: 81.7%; endometrioid: 66.7; clear cell: 63.3%; and mucinous: 22.2%) had tumors that were positive for α‐FR by immunohistochemistry (Kalli et al., 2008). The percentage of α‐FR was different in different histologic types. It will be important to evaluate if α‐FR is also a prognostic factor for the other histologic types.
The possible mechanisms of α‐FR in carcinogenesis might be to modulate folate uptake from serum (Kane et al., 1988) or generating regulatory signals (Antony, 1996; Miotti et al., 2000) for tumor growth. However, we identified that α‐FR also can induce drug resistance by enhancing the anti‐apoptotic capabilities of tumor cells. Our results showed that α‐FR could inhibit the cytotoxic drug‐induced apoptosis through caspase pathway by regulating the apoptosis‐related molecule, Bcl‐2 and Bax (Figure 3). The process of apoptosis initiated by the chemotherapeutic drugs, including paclitaxel, cisplatin and topotecan could be inhibited after α‐FR being transfected into the cancer cells (Figure 3B and C). The anti‐apoptotic effect of α‐FR‐transfected cells could be related to the decreased expression of Bax and elevated level of Bcl‐2 (Figure 3D).
Because resistance to chemotherapeutic drugs plays a major role in tumor progression and poor outcome, choosing the optimal cytotoxic regimens and developing different strategies to target cancer cells becomes more and more important in the treatment of ovarian cancer. α‐FR can be expressed at high levels in non‐mucinous ovarian carcinoma, but is largely absent from normal tissue (Parker et al., 2005; Elnakat and Ratnam, 2006). Furthermore, it is also detected in metastatic foci and recurrent tumors (Kalli et al., 2008). Therefore, α‐FR can be a potential target for ovarian cancer treatment.
Farletuzumab (MORAb‐003), a monoclonal antibody to α‐FR, was evaluated in a recent phase II of patients with platinum‐sensitive relapsed disease (Armstrong et al., 2008). The combination of chemotherapy and Ab to α‐FR showed a longer interval of remission as compared to the patients' previous remission. Ongoing phase III trial will demonstrate the role of α‐FR Ab in the treatment of ovarian cancer patients. Therefore, antibody against α‐FR could be a new treatment strategy for ovarian cancer patients in the future. α‐FR Ab might be added to the first‐line adjuvant chemotherapy for serous ovarian cancer patients to reduce the chemo‐resistance induced by α‐FR after the tissue α‐FR levels being evaluated postoperatively.
Advanced stage, high grade disease and lymph nodal involvement are known to be poor prognostic factors for ovarian cancer patients (Malkasian et al., 1984; Swenerton et al., 1985). However, our study did not demonstrate these findings. The reason for these discrepancies might be the small numbers in the subsets. Therefore, multi‐center cooperation would be needed to resolve the limitations of our study in the future.
In conclusion, serous ovarian cancer patients with higher α‐FR expressions in cancerous tissue have poorer chemotherapeutic response, and significantly shorter DFI and poorer OS which might be related to α‐FR‐induced anti‐apoptosis. Target‐based therapy directed toward α‐FR can be a new therapeutic strategy for ovarian carcinoma patients.
Acknowledgements
This work was supported by grant from National Sicnece Committee of Taiwan (100‐2325‐B‐002‐003). And we thank the 2nd and 7th Core Lab of the Department of Medical Research of National Taiwan University Hospital for technical assistance.
Chen Yu-Li, Chang Ming-Cheng, Huang Chia-Yen, Chiang Ying-Cheng, Lin Han-Wei, Chen Chi-An, Hsieh Chang-Yao, Cheng Wen-Fang, (2012), Serous ovarian carcinoma patients with high alpha‐folate receptor had reducing survival and cytotoxic chemo‐response, Molecular Oncology, 6, doi: 10.1016/j.molonc.2011.11.010.
References
- Agarwal, R. , Kaye, S.B. , 2003. Ovarian cancer: strategies for overcoming resistance to chemotherapy. Nat. Rev. Cancer. 3, 502–516. [DOI] [PubMed] [Google Scholar]
- Antony, A.C. , 1996. Folate receptors. Annu. Rev. Nutr.. 16, 501–521. [DOI] [PubMed] [Google Scholar]
- Armstrong, D.K. , Bicher, A. , Coleman, R.L. , Gibbon, D.G. , Glenn, D. , Old, L. , 2008. Exploratory phase II efficacy study of MORAb-003, a monoclonal antibody against folate receptor alpha, in platinum- sensitive ovarian cancer in first relapse. J. Clin. Oncol.. 26, abstract 5500 [Google Scholar]
- Boyle, P. , Maisonneuve, P. , Autier, P. , 2000. Update on cancer control in women. Int. J. Gynecol. Obstet.. 70, 263–303. [DOI] [PubMed] [Google Scholar]
- Berek, J.S. , Bast, R.C. , 1995. Ovarian cancer screening. The use of serial complementary tumor markers to improve sensitivity and specificity for early detection. Cancer. 76, 2092–2096. [DOI] [PubMed] [Google Scholar]
- Chang, M.C. , Chen, C.A. , Hsieh, C.Y. , Lee, C.N. , Su, Y.N. , Hu, Y.H. , Cheng, W.F. , 2009. Mesothelin inhibits paclitaxel-induced apoptosis through the PI3K pathway. Biochem. J.. 424, 449–458. [DOI] [PubMed] [Google Scholar]
- Chen, R.H. , Chang, M.C. , Su, Y.H. , Tsai, Y.T. , Kuo, M.L. , 1999. Interleukin-6 inhibits transforming growth factor-β-induced apoptosis through the phosphatidylinositol 3-kinase/Akt and signal transducers and activators of transcription 3 pathways. J. Biol. Chem.. 274, 23013–23019. [DOI] [PubMed] [Google Scholar]
- Cheng, W.F. , Huang, C.Y. , Chang, M.C. , Hu, Y.H. , Chiang, Y.C. , Chen, Y.L. , Hsieh, C.Y. , Chen, C.A. , 2009. High mesothelin correlates with chemoresistance and poor survival in epithelial ovarian carcinoma. Br. J. Cancer. 100, 1144–1153. [DOI] [PMC free article] [PubMed] [Google Scholar]
- Choi, S.W. , Mason, J.B. , 2000. Folate and carcinogenesis: an integrated scheme. J. Nutr.. 130, 129–132. [DOI] [PubMed] [Google Scholar]
- DiSaia, P.J. , Bloss, J.D. , 2003. Treatment of ovarian cancer: new strategies. Gynecol. Oncol.. 90, S24–S32. [DOI] [PubMed] [Google Scholar]
- Elnakat, H. , Ratnam, M. , 2006. Role of folate receptor genes in reproduction and related cancer. Front. Biosci.. 11, 506–519. [DOI] [PubMed] [Google Scholar]
- Hunerbein, M. , 1998. The value of tumor markers in colorectal cancer. Recent Results Cancer Res.. 146, 48–55. [DOI] [PubMed] [Google Scholar]
- Huang, C.Y. , Cheng, W.F. , Lee, C.N. , Su, Y.N. , Chien, S.C. , Tzeng, Y.L. , Hsieh, C.Y. , Chen, C.A. , 2006. Serum mesothelin in epithelial ovarian carcinoma: a new screening marker and prognostic factor. Anticancer Res.. 26, 4721–4728. [PubMed] [Google Scholar]
- International Federation of Gynecology and Obstetrics, 1971. Classification and staging of malignant tumours in the female pelvis. Acta Obstet. Gynecol. Scand.. 50, 1–7. [DOI] [PubMed] [Google Scholar]
- International Federation of Gynecology and Obstetrics, 1987. Changes in definitions of clinical staging for carcinoma of the cervix and ovary: International Federation of Gynecology and Obstetrics. Am. J. Obstet. Gynecol.. 156, 263–264. [PubMed] [Google Scholar]
- Jemal, A. , Siegel, R. , Ward, E. , Murray, T. , Xu, J. , Thun, M. , 2007. Cancer statistics, 2007. CA. Cancer J. Clin.. 57, 43–66. [DOI] [PubMed] [Google Scholar]
- Jacobs, I. , Bast, R.C. , 1989. The CA 125 tumour-associated antigen: a review of the literature. Humanit. Rep.. 4, 1–12. [DOI] [PubMed] [Google Scholar]
- Kane, M.A. , Elwood, P.C. , Portillo, R.M. , Antony, A.C. , Najfeld, V. , Finley, A. , Waxman, S. , Kolhouse, J.F. , 1988. Influence on immunoreactive folate-binding-proteins of extracellular folate concentration in cultured human cells. J. Clin. Invest.. 81, 1398–1406. [DOI] [PMC free article] [PubMed] [Google Scholar]
- Kim, J.H. , Skates, S.J. , Uede, T. , Wong, K.K. , Schorge, J.O. , Feltmate, C.M. , Berkowitz, R.S. , Cramer, D.W. , Mok, S.C. , 2002. Osteopontin as a potential diagnostic for ovarian cancer. JAMA. 287, 1671–1679. [DOI] [PubMed] [Google Scholar]
- Knutson, K.L. , Krco, C. , Erskine, C.L. , Goodman, K. , Kelemen, L.E. , Wettstein, P.J. , Low, P.S. , Hartmann, L.C. , Kalli, K.R. , 2006. T cell immunity to folate receptor alpha is prevalent in women with breast or ovary cancer. J. Clin. Oncol.. 24, 4254–4261. [DOI] [PubMed] [Google Scholar]
- Kalli, K.R. , Oberg, A.L. , Keeney, G.L. , Christianson, T.J. , Low, P.S. , Knutson, K.L. , Hartmann, L.C. , 2008. Folate receptor alpha as a tumor target in epithelial ovarian cancer. Gynecol. Oncol.. 108, 619–626. [DOI] [PMC free article] [PubMed] [Google Scholar]
- Lin, C.Y. , Lin, L.Y. , Chiang, C.K. , Wang, W.J. , Su, Y.N. , Hung, K.Y. , Chen, P.C. , 2010. Investigation of the association between low-dose serum perfluorinated chemicals and liver enzymes in US adults. Am. J. Gastroenterol.. 105, 1354–1363. [DOI] [PubMed] [Google Scholar]
- Lu, K.H. , Patterson, A.P. , Wang, L. , Marquez, R.T. , Atkinson, E.N. , Baggerly, K.A. , Ramoth, L.R. , Rosen, D.G. , Liu, J. , Hellstrom, I. , Smith, D. , Hartmann, L. , Fishman, D. , Berchuck, A. , Schmandt, R. , Whitaker, R. , Gershenson, D.M. , Mills, G.B. , Bast, R.C. , 2004. Selection of potential markers for epithelial ovarian cancer with gene expression arrays and recursive descent partition analysis. Clin. Cancer Res.. 10, 3291–3300. [DOI] [PubMed] [Google Scholar]
- Malkasian, G.D. , Melton, L.J. , O'Brien, P.C. , Greene, M.H. , 1984. Prognostic significance of histologic classification and grading of epithelial malignancies of the ovary. Am. J. Obstet. Gynecol.. 149, 274–284. [DOI] [PubMed] [Google Scholar]
- Miotti, S. , Bagnoli, M. , Tomassetti, A. , Colnaghi, M.I. , Canevari, S. , 2000. Interaction of folate receptor with signaling molecules lyn and Ga13 in detergent-resistant complexes from the carcinoma cell lines. J. Cell Sci.. 113, 349–357. [DOI] [PubMed] [Google Scholar]
- Mozzetti, S. , Ferlini, C. , Concolino, P. , Filippetti, F. , Raspaglio, G. , Prislei, S. , Gallo, D. , Martinelli, E. , Ranelletti, F.O. , Ferrandina, G. , Scambia, G. , 2005. Class III beta-tubulin overexpression is a prominent mechanism of paclitaxel resistance in ovarian cancer patients. Clin. Cancer Res.. 11, 298–305. [PubMed] [Google Scholar]
- Mok, S.C. , Chao, J. , Skates, S. , Wong, K. , Yiu, G.K. , Muto, M.G. , Berkowitz, R.S. , Cramer, D.W. , 2001. Prostasin, a potential serum marker for ovarian cancer: identification through microarray technology. J. Natl. Cancer Inst.. 93, 1458–1464. [DOI] [PubMed] [Google Scholar]
- Meyer, T. , Rustin, G.J. , 2000. Role of tumour markers in monitoring epithelial ovarian cancer. Br. J. Cancer. 82, 1535–1538. [DOI] [PMC free article] [PubMed] [Google Scholar]
- Mantovani, L.T. , Miotti, S. , Menard, S. , Canevari, S. , Raspagliesi, F. , Bottini, C. , Bottero, F. , Colnaghi, M.I. , 1994. Folate binding protein distribution in normal tissues and biological fluids from ovarian carcinoma patients as detected by the monoclonal antibodies MOv18 and MOv19. Eur. J. Cancer. 30A, 363–369. [DOI] [PubMed] [Google Scholar]
- Pannek, J. , Partin, A.W. , 1998. The role of PSA and percent free PSA for staging and prognosis prediction in clinically localized prostate cancer. Semin. Urol. Oncol.. 16, 100–105. [PubMed] [Google Scholar]
- Parker, N. , Turk, M.J. , Westrick, E. , Lewis, J.D. , Low, P.S. , Leamon, C. , 2005. Folate receptor expression in carcinomas and normal tissues determined by a quantitative radioligand and binding assay. Anal. Biochem.. 338, 284–293. [DOI] [PubMed] [Google Scholar]
- Quirk, J.T. , Natarajan, N. , 2005. Ovarian cancer incidence in the United States, 1992–1999. Gynecol. Oncol.. 97, (2) 519–523. [DOI] [PubMed] [Google Scholar]
- Rustin, G.J. , 1992. Tumour markers for ovarian cancer. Eur. J. Cancer. 28, 2–3. [DOI] [PubMed] [Google Scholar]
- Rubach, M. , Szymendera, J.J. , Kaminska, J. , Kowalska, M. , 1997. Serum CA 15.3, CEA and ESR patterns in breast cancer. Int. J. Biol. Markers. 12, 168–173. [DOI] [PubMed] [Google Scholar]
- Swenerton, K.D. , Hislop, T.G. , Spinelli, J. , LeRiche, J.C. , Yang, N. , Boyes, D.A. , 1985. Ovarian carcinoma: a multivariate analysis of prognostic factors. Obstet. Gynecol.. 65, 264–270. [PubMed] [Google Scholar]
- Scholler, N. , Fu, N. , Yang, Y. , Ye, Z. , Goodman, G.E. , Hellstrom, K.E. , Hellström, I. , 1999. Soluble member(s) of the mesothelin/megakaryocyte potentiating factor family are detectable in the sera from patients with ovarian carcinoma. Proc. Natl. Acad. Sci. USA. 96, 11531–11536. [DOI] [PMC free article] [PubMed] [Google Scholar]
- Tsao, P.N. , Su, Y.N. , Li, H. , Huang, P.H. , Chien, C.T. , Lai, Y.L. , Lee, C.N. , Chen, C.A. , Cheng, W.F. , Wei, S.C. , Yu, C.J. , Hsieh, F.J. , Hsu, S.M. , 2004. Overexpression of placenta growth factor contributes to the pathogenesis of pulmonary emphysema. Am. J. Respir. Crit. Care Med.. 169, 505–511. [DOI] [PubMed] [Google Scholar]
- Terry, K.L. , Sluss, P.M. , Skates, S.J. , Mok, S.C. , Ye, B. , Vitonis, A.F. , Cramer, D.W. , 2004. Blood and urinemarkers for ovarian cancer: a comprehensive review. Dis. Markers. 20, 53–70. [DOI] [PMC free article] [PubMed] [Google Scholar]
- Toffoli, G. , Cernigoi, C. , Russo, A. , Gallo, A. , Bagnoli, M. , Boiocchi, M. , 1997. Overexpression of folate binding protein in ovarian cancers. Int. J. Cancer. 74, 193–198. [DOI] [PubMed] [Google Scholar]
- U.S. Cancer Statistics Working Group. United States Cancer statistics: 2007 incidence and Mortality. Available at: www.cdc.gov/uscs.
- Xu, Y. , Shen, Z. , Wiper, D.W. , Wu, M. , Morton, R.E. , Elson, P. , Kennedy, A.W. , Belinson, J. , Markman, M. , Casey, G. , 1998. Lysophosphatidic acid as a potent biomarker for ovarian and other gynecologic cancers. JAMA. 280, 719–723. [DOI] [PubMed] [Google Scholar]