

Abstract
PKN3 is an AGC‐family protein kinase implicated in growth of metastatic prostate cancer cells with phosphoinositide 3‐kinase pathway deregulation. The molecular mechanism, however, by which PKN3 contributes to malignant growth and tumorigenesis is not well understood. Using orthotopic mouse tumor models, we now show that inducible knockdown of PKN3 protein not only blocks metastasis, but also impairs primary prostate and breast tumor growth. Correspondingly, overexpression of exogenous PKN3 in breast cancer cells further increases their malignant behavior and invasiveness in‐vitro. Mechanistically, we demonstrate that PKN3 physically interacts with Rho‐family GTPases, and preferentially with RhoC, a known mediator of tumor invasion and metastasis in epithelial cancers. Likewise, RhoC predominantly associates with PKN3 compared to its closely related PKN family members. Unlike the majority of Rho GTPases and PKN molecules, which are ubiquitously expressed, both PKN3 and RhoC show limited expression in normal tissues and become upregulated in late‐stage malignancies. Since PKN3 catalytic activity is increased in the presence of Rho GTPases, the co‐expression and preferential interaction of PKN3 and RhoC in tumor cells are functionally relevant. Our findings provide novel insight into the regulation and function of PKN3 and suggest that the PKN3–RhoC complex represents an attractive therapeutic target in late‐stage malignancies.
Keywords: PKN3, RhoC, Breast cancer, Prostate cancer, Orthotopic tumor models, Turn-motif phosphorylation
Highlights
Inducible PKN3 knockdown inhibits primary prostate and breast tumor growth.
PKN3 associates with Rho‐family GTPases, and preferentially with RhoC.
RhoC predominantly associates with PKN3 compared to other PKN family members.
PKN3 catalytic activity is stimulated in the presence of RhoA and RhoC.
Turn‐motif phosphorylation at T860 closely correlates with PKN3 activity.
1. Introduction
PKN3 is a member of the PKN family, which resides in the protein kinase C (PKC) superfamily of serine/threonine kinases. PKN3 has previously been implicated in regulating malignant prostate cell growth downstream of activated phosphoinositide 3‐kinase (Leenders et al., 2004). A role for PKN3 in tumorigenesis was inferred by early reports indicating that PKN3 mRNA is barely detectable in normal human adult tissues, but abundantly expressed in various cancer cell lines (Oishi et al., 1999). In contrast, the other two members of the PKN family, PKN1 and PKN2, are ubiquitously expressed in human and rat tissues (Hashimoto et al., 1998; Mukai and Ono, 1994; Quilliam et al., 1996). Furthermore, PKN3 catalytic activity is significantly less responsive to fatty acid‐mediated stimulation compared to PKN1 and PKN2, thus underscoring the diversity of PKN isoform function and regulation.
The PKN family of PKC‐related protein kinases constitutes some of the major Rho GTPase‐associated protein kinase activities detected in mammalian tissues (Flynn et al., 1998; Lim et al., 2006, 2008; Vincent and Settleman, 1997). Although the interaction of PKN1/PKN2 with RhoA and RhoB has been reported, the biological significance of these interactions remains largely unknown. Members of the Rho family of small GTPases serve as molecular switches that regulate a diverse set of cellular functions and signaling pathways linked to oncogenesis, such as cell polarization and migration through actin cytoskeleton remodeling, transcription, cell cycle control, cellular transformation and metastasis (Hall, 2009; Karlsson et al., 2009). Importantly, several of these Rho‐dependent phenotypes are specifically attributed to the PKN family kinases (Dong et al., 2000; Vincent and Settleman, 1997). Moreover, loss of PKN function in Drosophila leads to cytoskeletal defects closely resembling those induced by loss of Rho1 (Lu and Settleman, 1999). In addition to cytoskeletal remodeling, the RhoA–PKN1/PKN2 signaling axis has been linked to the transcriptional activation of androgen receptor (AR) in prostate cancer tissues, which exhibit marked increases in PKN1 expression relative to normal prostate epithelium (Metzger et al., 2003).
A direct involvement of PKN3 in malignant growth was demonstrated by conditional depletion of PKN3 expression in an orthotopic mouse prostate cancer model (Leenders et al., 2004). In this context, PKN3 functions as a mediator of invasive prostate cancer cell growth downstream of a hyperactivated phosphoinositide 3‐kinase pathway in three‐dimensional (3D) culture environments as well as in in‐vivo tumor xenotransplants. PKN3 is regulated by chronic activation of phosphoinositide 3‐kinase signaling at both the expression and the activity level in an Akt‐independent manner. This suggests that PKN3 acts as an effector of an as of yet unexplored branch of the oncogenic phosphoinositide 3‐kinase signaling network and may, therefore, represent a unique opportunity for therapeutic intervention in metastatic phosphoinositide 3‐kinase‐dependent tumors (Leenders et al., 2004). PKN3 inhibition was also found to interfere with endothelial cell morphogenesis, while having no effect on proliferation (Aleku et al., 2008). Primary endothelial cells are among the few normal cell types expressing considerable amounts of PKN3 aside from tumor cells, which is in agreement with their naturally invasive characteristics. Systemic interference with PKN3 expression in the vasculature of mice transplanted with prostatic or pancreatic tumor xenografts inhibits tumor growth and lymph node metastasis (Aleku et al., 2008). This was accompanied by a specific reduction in lymph vessel density, arguing that PKN3 supports tumor growth and metastasis by cell‐autonomous as well as non‐cell‐autonomous mechanisms.
Given the importance of Rho GTPases in tumor growth and invasion as well as in the regulation of PKN1‐ and PKN2‐mediated effects, we have examined cooperation between PKN3 and Rho‐family members in mediating neoplastic cell growth. Our findings demonstrate that PKN3 preferentially interacts with RhoC, a well known mediator of EMT and metastasis, and we hypothesize that the PKN3–RhoC association results in the formation of a ‘pathological’ complex, which is assembled in tumor cells to promote increased malignant growth behavior.
2. Materials and methods
2.1. Antibodies
The anti‐Flag antibody was obtained from Sigma, the anti‐mER antibody from Millipore. HA (12CA5) and Myc (9E10) antibodies were from Roche and Santa Cruz Biotechnology. Akt, phospho‐AKT (S473), phospho‐PKN1/2 (T778/T816), PDK1 and RhoC antibodies were from Cell Signaling Technology. PKN3 and p110α antibodies were previously described (Leenders et al., 2004). Vimentin and p110β antibodies were from Epitomics. Rabbit phospho‐PKN3‐T860 antibodies were raised against a peptide encompassing the phosphorylated turn‐motif of PKN3 (P∗‐T860), EFTGLPPAL‐T(PO3)‐PPAP, and affinity purified.
2.2. Plasmids
The full‐length cDNA of human PKN3, PKN3wt, and its kinase‐defective version PKN3kd (K588E) were cloned into both pcDNA3 and pcDNA4/TO mammalian expression vectors (Invitrogen). In each case, the 5′ primer contained an ATG codon followed by a Flag‐epitope in‐frame with the coding region that was amplified. Corresponding PCR products were digested with EcoRI and XhoI restriction enzymes and ligated into either pcDNA3 or pcDNA4/TO to generate N‐terminal Flag epitope‐tagged PKN3 constructs. HA‐ and ER‐tagged full‐length PKN3wt, PKN3kd and the additional T718A and ΔN deletion variants have been described (Leenders et al., 2004).
The GSK3‐derived substrate for non‐radioactive assessment of PKN3 catalytic activity in in‐vitro protein kinase assays was generated by annealing the phosphorylated oligonucleotides described in the Supplementary Materials section and fusing the respective DNA fragment in‐frame to the GST moiety via Asp718/BamHI ends into vector pET41b (EMD Biosciences); S∗ denotes the phosphorylation site serine residue. PKN3 substrate amino acid sequence: GTGGGGPKGPGRRGRRRTSS∗FAEGGstop.
The PDK1 expression vector was a kind gift from Dr. Bing Guo (Pfizer, Oncology, Pearl River).
Human RhoA, RhoB and RhoC cDNAs were PCR‐amplified using primers overlapping the start codon by an Nde I restriction site and a BamH I site extending the stop codon. The cDNAs were fused in‐frame via Nde I to an N‐terminal Myc‐epitope tag and ligated via Xba I–BamH I ends into mammalian expression vector pCG, in which transcription is controlled by the cytomegalovirus promoter and translation initiation is controlled via the 5′ untranslated region of the herpes simplex virus thymidine kinase gene (Matthias et al., 1989). Wt, constitutively active (Q63L) and dominant‐negative (T19N) RhoA cDNAs from Upstate Biotechnology were PCR‐amplified using primers overlapping the start codon by an Nde I restriction site and a BamH I site extending the stop codon. Sequences were confirmed by DNA sequence analysis. Mutations were introduced using the QuickChange mutagenesis kit (Stratagene). Primers used to generate constitutively active (CA) and dominant‐negative (DN) forms of RhoC are described in the Supplementary Materials section. GFP‐tagged RhoA and RhoC plasmids were purchased from OriGene.
2.3. Immunoprecipitation and kinase assays
Cells were transfected using FuGene 6 according to the manufacturer instructions (Roche Applied Science). 48h after transfection, cells were washed with phosphate‐buffered saline (PBS) and lysed in lysis buffer (50mM Tris–HCl [pH 7.5], 150mM NaCl, 10mM β‐glycerophosphate, 10% glycerol, 1% Tween‐20, 0.1% NP‐40, 1mM Na3VO4, 1mM NaF and protease inhibitors [Roche Molecular Biochemicals]) for 30min on ice. Proteins were immunoprecipitated with anti‐Flag M2 affinity resin (Sigma) and eluted with Flag peptide as described previously (Unsal‐Kacmaz et al., 2005). For anti‐ER or Myc‐tag immunoprecipitates mERα C1355 (Millipore) or 9E10 epitope antibody sc‐789 (Santa Cruz Biotechnology) was used, and immunocomplexes were subjected to washes containing 0.5M LiCl and 0.5% NP‐40 as described previously (Klippel et al., 1998). Kinase assays were carried out as described previously (Leenders et al., 2004) except that a GSK3‐derived peptide fused to GST was used as a substrate (see above), the phosphorylation of which can be detected by phospho‐GSK3α/β antibody 37F11 (Santa Cruz Biotechnology).
2.4. siRNAs, shRNAs
Small interfering RNA (siRNA) duplexes were 21bp, including a 2‐base deoxynucleotide overhang synthesized by BioSpring, Germany. Cells were transfected using Profectin 65 transfection reagent following the manufacturer's suggested protocol (Silence Therapeutics, Germany). siRNA sequences are listed in the Supplementary Materials section.
Vectors for inducible expression of PKN3 and p110β shRNAs were described previously (Czauderna et al., 2003; Leenders et al., 2004). New PKN3 and ineffective control shRNAs also tested (see Supplementary Materials section) were cloned via BsmBI sites into a lentivirus‐adapted vector system allowing Dox‐inducible expression of shRNAs (Czauderna et al., 2003). Correct insertion of the respective sequences was confirmed first by diagnostic restriction analysis and then with DNA sequence analysis.
2.5. Cell lines and culture conditions
PC‐3 cells were cultured and transfected as previously described (Leenders et al., 2004). PC‐3 cells stably expressing various shRNA molecules were maintained in Blasticidin (10μg/ml) containing medium. For induction of the shRNA molecules 0.25ug/ml Dox was used, and 48–72h after Dox treatment cells were analyzed for protein knockdown. MDA‐MB‐231 cells were cultured in DMEM with 10% Fetal Bovine Serum, 2mM Glutamax, 1mM sodium pyruvate, 0.1mM nonessential amino acids, 1% penicillin/streptomycin. MDA‐MB‐231‐TRex cells stably overexpressing Dox‐inducible PKN3wt and PKN3kd were maintained in the same medium with Blasticidin (10μg/ml) and Zeocin (150μg/ml). MDA‐MB‐231 cells overexpressing various shRNA molecules were maintained in the same growth medium with Blasticidin (10μg/ml) only. HEK293T and HeLa cells were cultured as described previously (Unsal‐Kacmaz et al., 2005). HeLa cells stably expressing PKN3 with regulatable kinase activity or its kinase‐defective control have been described (Leenders et al., 2004).
2.6. Three‐dimensional cell culture assays
shRNA expression was induced in stably transfected PC‐3 cell populations in the presence of Doxycycline for 72h. The cells were seeded on 250μl solidified matrigel basement membrane matrix (11–12mg/ml; Becton Dickinson) in duplicate 24‐wells (typically 100,000–150,000 cells per well). After settling the cells were overlayed with 1ml medium plus additives and incubated for the indicated times.
MDA‐MB‐231 cells were embedded into Matrigel (Becton Dickinson) according to the manufacturer's recommendations. In brief, cells grown in 10cm dishes with or without Dox for 48–72h were detached from culture dishes and suspended in Matrigel solution at a concentration of 2.83×10⁵cells/ml at 4°C. 300μl of this Matrigel embedded cell suspension containing 85,000 cells was overlaid on a 300μl foot of Matrigel in a 24‐well plate. The plate was allowed to solidify at 37°C in the incubator. After 30min DMEM media±250ng/ml Dox was added for cell growth.
For spheroid assays, 5×10⁵ MDA‐MB‐231 PKN3 shRNA expressing cells were seeded on 6cm low binding plates in normal growth media supplemented to 2% matrigel in the presence or absence of Dox (250ng/ml). At day 5 spheroids were measured; those of similar size were re‐plated onto 24‐well plates for time course analysis. Additional measurements and photographs were taken at days 9 and 13.
2.7. Immunofluorescence analysis
For indirect immunofluorescence analysis cells grown on Labtek II chamberslides (Nunc) were fixed and permeabilized using Fix & Perm solutions (Invitrogen). Samples were incubated in blocking solution (10% FCS, 2% BSA, 0.1% Triton X‐100, 0.025% Tween‐20 in PBS) and then incubated with anti‐HA (12CA5) antibody (Roche) at 1:200, anti‐PKN3 antibody at 1:300 or anti‐P∗‐T860 antibody at 1:1000 diluted in blocking solution. After washing twice in PBS containing 0.1% Triton X‐100 the slides were incubated with a 1:500–1:1000 dilution of Alexa‐488 or Alexa‐546 labeled secondary antibody (Molecular probes). Slides were mounted in the presence of DAPI (Vectastain) for nuclear staining and analyzed on a confocal LSM510 Meta microscope (Zeiss).
The extent of co‐localization as assessed by Pearson's Co‐localization Correlation (PCC) was calculated using the Volocity 6.0 Image Analysis Software (Perkin Elmer) with background exclusion. The PCC is a standard statistical analysis to measure the strength of a linear relationship between fluorescent intensities from two images. The resulting PCC value is expressed relative to a maximum of 1±S.E.
2.8. Orthotopic mouse prostate and breast tumor models
Male nu/nu mice were inoculated with pooled 2×10⁶ stably transfected PC‐3 cells into the left dorsolateral lobe of the prostate gland under total body anesthesia (Stephenson et al., 1992; Czauderna et al., 2003; Leenders et al., 2004). Dox was administered via food at 625mg/kg; control groups received regular food. Animals were killed 49 days post transplantation and primary tumors (prostate gland) and lymph node metastases were measured as described previously (Leenders et al., 2004).
Stable pools of 2×10⁶ MDA‐MB‐231 cells expressing Dox‐inducible PKN3, p110β, or control shRNAs were orthotopically transplanted into the abdominal mammary fat pad of female nude mice. Dox was administered via food at 625mg/kg; control groups received regular food. Mammary tumor growth was measured weekly. All animals were completely dissected and photographically documented.
3. Results
3.1. Inhibition of PKN3 expression interferes with primary tumor growth and lymph node metastasis in a pre‐established orthotopic mouse prostate tumor model
Previous work revealed that PKN3 mediates malignant cell growth in‐vitro and in‐vivo downstream of activated phosphoinositide 3‐kinase in PTEN−/− prostate cancer cells (Leenders et al., 2004). To determine if PKN3 is a general mediator of neoplastic growth and to identify the stages of tumor development that are controlled by this kinase we reevaluated these results in a different mouse background as well as in an established tumor model. Human PC‐3 prostate cancer cells were stably transduced with viral vectors encoding Doxycycline‐(Dox‐)inducible shRNAs against PKN3 or p110β, the relevant isoform of the catalytic subunit of class I phosphoinositide 3‐kinase in prostate cancer cells (Jia et al., 2008). To limit the number of animals, in this experiment we used only one shRNA per target, because the general importance and efficacy of the respective targets and reagents has previously been validated in‐vitro and in‐vivo in PC‐3 cells using multiple shRNAs (Leenders et al., 2004). Dox treatment for 72h produced efficient knockdown of PKN3 and p110β protein expression, both of which were accompanied by a reduction in the EMT marker vimentin (Thiery et al., 2009) compared to control cell populations (Figure 1A). We tested these transduced cells in the ‘Matrigel on‐top’ assay (Kenny et al., 2007) and observed significant growth attenuation in cells expressing PKN3 or p110β shRNAs (Supplementary Fig. 1), consistent with the suggested role of PKN3 in prostate cancer cell growth (Leenders et al., 2004).
Figure 1.
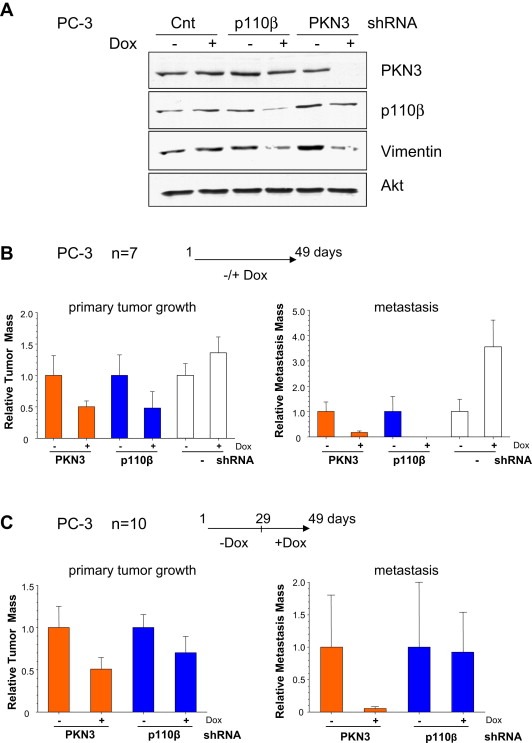
PKN3 mediates primary tumor growth and metastasis in an orthotopic mouse prostate cancer model. (A) PC‐3 cells stably engineered for Dox‐dependent expression of PKN3, p110β or control shRNAs were grown either in the presence or absence of Dox (250ng/ml) for 72h, and extracts were analyzed by immunoblotting with the indicated antibodies. Expression of Akt served as a loading control. (B) Stable PC‐3 cells expressing shRNAs targeting PKN3 (orange bars), p110β (blue bars) or PC‐3 control cells (white bars) were transplanted intraprostatically into nude mice. One group of animals received Dox (+), the second group received regular food without Dox (−) (n=7 animals per cohort). After 49 days, the mice were killed and evaluated for primary tumor (left) and lymph node metastases development (right). Each bar represents the mean tumor volume±S.E. (C) Mice with established tumors were divided into two groups 4 weeks after transplantation: One group of animals received Dox (+), while the second group continued to be mock treated (−) for 3 weeks (n=10 animals per cohort). After 49 days, the mice were sacrificed and analyzed for primary tumor and lymph node metastasis.
In parallel, PC‐3 cells stably engineered for inducible knockdown of either PKN3 or p110β were intraprostatically transplanted into nude (nu/nu) mice (Stephenson et al., 1992). As reported previously, Dox‐treated animals exhibited strong inhibition of metastatic burden (Figure 1B). However, compared to the previous report, which employed NMRI nude mice (Leenders et al., 2004), primary tumor formation in PKN3 or p110β knockdown cohorts, was impaired by about 50%. Mice transplanted with parental PC‐3 cells exhibited an increase of tumor burden after Dox administration (Figure 1B) as previously observed with transplanted control shRNA cells (Czauderna et al., 2003) indicating that the inhibitory effect observed in response to PKN3 or p110β knockdown may even represent an underestimate. Similar results were obtained in three separate experiments showing that PKN3 regulates the formation of both primary tumor and metastases.
Subsequently, we examined the effects of PKN3 knockdown in a pre‐established tumor setting. Transplanted cells were allowed to form primary tumors for 28 days before Dox administration for additional 21 days. As shown in Figure 1C, PKN3 knockdown also resulted in attenuation of pre‐established primary tumor growth and lymph node metastasis under these conditions.
3.2. PKN3 is a preferred binding partner for the metastasis regulator RhoC
The finding that PKN3 regulates both, primary prostate tumor growth and metastasis, together with the observed reduction of vimentin levels after PKN3 knockdown indicates that PKN3 can contribute at various stages of tumor development. Given the established role of Rho‐family GTPases in different stages of tumorigenesis and their role in regulating PKN1 and PKN2 (Mukai, 2003) we reasoned that PKN3 might also interact with Rho‐family molecules. We tested the interaction between PKN3 and GTPases by co‐expressing Flag‐tagged wild‐type PKN3, PKN3wt, or its catalytically inactive point mutant harboring a K588E mutation within the ATP binding site, PKN3kd, with or without Myc‐tagged RhoA, RhoB or RhoC. Unexpectedly, PKN3 preferentially interacted with RhoC compared to RhoA and RhoB, indicating that PKN3 represents a functional partner of RhoC (Figure 2A). Similar results were obtained in independent experiments using different cell lines such as HEK293 (Figure 2A and Supplementary Fig. 5), HeLa (Figure 2B, Supplementary Figs. 2 and 3) as well as PC‐3 (Figure 3B) cells highlighting the ability of PKN3 to bind to all three Rho proteins, as well as the preferential association with RhoC. The interaction between RhoC and PKN3 was somewhat weakened when RhoC was co‐expressed with PKN3kd (Figure 2A and Supplementary Fig. 2).
Figure 2.
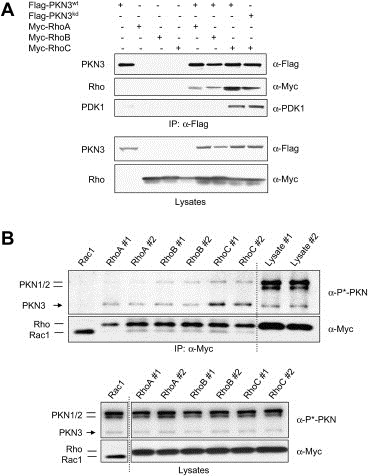
PKN3 and RhoC are preferred binding partners. (A) PKN3 preferentially interacts with RhoC. Recombinant Flag‐PKN3wt, Flag‐PKN3kd, Myc‐RhoA, Myc‐RhoB and Myc‐RhoC were transiently expressed in HEK293T cells either single or in combination. Cell lysates with equal protein concentration were mixed with anti‐Flag antibody beads, and bound protein complexes were eluted with Flag peptides and subsequently subjected to Western blotting analysis (top panel). Expression levels in the input lysates are shown using the indicated antibodies (bottom panel). (B) RhoC preferentially interacts with endogenous PKN3. Myc‐tagged RhoA, RhoB, RhoC (in duplicates) or Rac1 as a control were transiently expressed in HeLa cells. Anti‐Myc immune‐complexes prepared from cell lysates were analyzed for the levels of Rho and Rac proteins and for associated PKN1/2/3 proteins via detection of the shared activation‐loop phosphorylation site (P∗‐PKN) (top panel). Lysates were run in parallel to show relative expression levels of PKN proteins in the input material (right lanes). Expression levels of recombinant and endogenous proteins in the lysates are shown (bottom panel). Lysates from Rac1 transfected cells had been analyzed on a separate gel as indicated by the dotted line.
Figure 3.
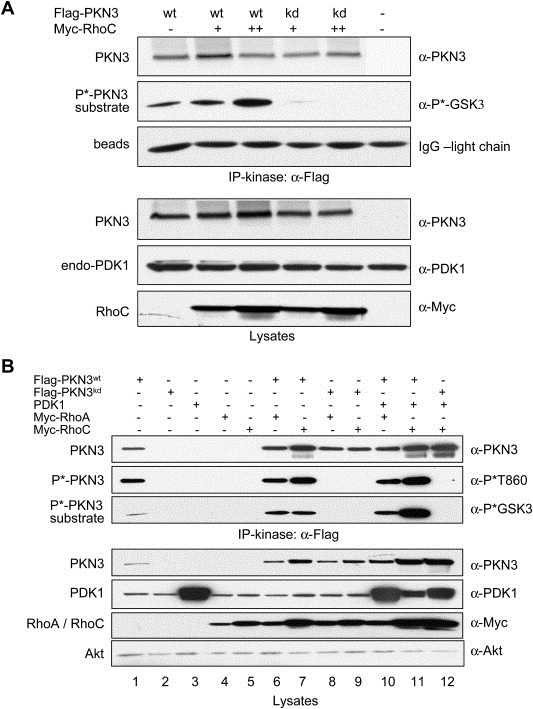
PKN3 catalytic activity is regulated by RhoC. (A) Flag‐tagged PKN3 was precipitated from equivalent amounts of HEK293T cell lysates, in which PKN3 was co‐expressed with increasing amounts of RhoC. Equal amounts of cell lysates were mixed with immobilized anti‐Flag antibodies, and bound complexes were eluted with Flag peptides. 1/3rd of each eluate was used for an in‐vitro protein kinase reaction and phosphorylated substrate was detected using a phospho‐GSK3α/β antibody. Comparable amounts of PKN3 in the complexes are shown by blotting for PKN3 levels; the anti‐Flag antibody light chain eluted from the beads serves as a loading control (top panel). Equivalent amounts of lysates were analyzed for expression levels (bottom panel). (B) PC‐3 cells were transfected with PKN3wt, PKN3kd, PDK1 or RhoA/C expression vectors individually (lanes 1–5) or in combinations (PKN3wt, PKN3kd with RhoA/C: lanes 6–9; PKN3wt, PKN3kd with PDK1 and RhoA/C: lanes 10–12). PKN3 complexes in the Flag‐eluates were subjected to an in‐vitro protein kinase reaction as described in (A) (top panel). Lysates from equivalent cell numbers were immunoblotted as shown; endogenous Akt served as a loading control (bottom panel).
Previous findings suggested that 3‐phosphoinositide‐dependent protein kinase 1 (PDK1) associates with PKN1 and PKN2 and phosphorylates these proteins at a conserved threonine residue located in the activation loop of the PKN1/2 kinase domain, a modification that leads to catalytic activation of PKN family members (Flynn et al., 2000). Therefore, we examined whether the immunoprecipitated PKN3–RhoC complex also contains PDK1. Figure 2A shows that endogenous PDK1 is readily detected in precipitates of PKN3 bound to RhoC indicating that the PKN3–RhoC interaction may facilitate ternary complex formation by recruiting PDK1 to the complex analogous to the Rho–PKN1/2–PDK1 ternary complex described previously (Flynn et al., 2000). Alternatively, the association with RhoC may lead to a conformational change in PKN3 facilitating binding of PDK1. Yet in another scenario the dimeric RhoC could simultaneously bind PKN3 and PDK1 molecules via individual monomers and form mixed dimers.
To study the binding of Rho proteins to endogenous PKN3, we transiently expressed Myc‐tagged Rac and Rho GTPases and after stringent washes using 0.5M LiCl/0.5% NP‐40 anti‐Myc precipitates were analyzed for the presence of endogenous PKN1, PKN2 and PKN3 (Figure 2B and Supplementary Fig. 5). The relative levels of the PKN isoforms can be directly compared using an antibody detecting an identical epitope spanning the activation‐loop phosphorylation site in all three PKN molecules. The results indicate first that RhoC represents the preferred binding partner for endogenous PKN3 compared to RhoA or RhoB. Secondly, PKN3 was preferentially bound by RhoC over PKN1 or PKN2 despite the relative higher abundance of the latter isoforms as shown in lysate controls run in parallel (Figure 2B and Supplementary Fig. 5). The results also show that, compared to Rho proteins Rac1 does not form a complex with PKN3 under the stringent conditions employed.
3.3. The catalytic activity of PKN3 is stimulated in the presence of RhoC
Both, PKN3 and RhoC have been implicated in regulating malignant prostate cancer cell growth (Iiizumi et al., 2008; Leenders et al., 2004), albeit independent of each other. Therefore, we investigated whether RhoC binding can stimulate PKN3 activity. To compensate for a somewhat stabilizing effect of Rho proteins on PKN3 levels, we adjusted the PKN3 cDNA amount during transfection: While increasing the amounts of RhoC cDNA to examine its dose‐dependent stimulation of PKN3 activity, we correspondingly lowered the amounts of PKN3 cDNA in parallel. As shown in Figure 3A, relatively equal amounts of PKN3 were present in anti‐Flag immunoprecipitates allowing a direct comparison of the catalytic activity between samples (top panel). The in‐vitro protein kinase assay performed indicates that PKN3 catalytic activity is further stimulated in the presence of increasing amounts of RhoC.
The experiment in Figure 2A using HEK293T cells indicated that recruitment of endogenous PDK1 is favored especially upon co‐expression of recombinant PKN3 and RhoC. To assess the function of complex formation (PKN3·RhoC·PDK1) also in PC‐3 cells, we monitored expression and activity of PKN3 after co‐transfection with recombinant PDK1 and RhoA or RhoC. As shown in Figure 3B, both RhoA and RhoC co‐expression increase PKN3 levels (bottom panel; compare lane 1 with lanes 6 and 7). Upon co‐expression of PDK1, this stimulatory effect was even more pronounced (lanes 10–11) suggesting that complex formation leads to increased stability of the complex components as compared to a PKN3·RhoA/C complex or when expressed individually. Anti‐Flag immunoprecipitates of the lysates were subjected to an in‐vitro protein kinase reaction: PKN3 expressed alone was found to have intrinsic kinase activity as monitored by using a GSK3‐derived peptide as a substrate (Figure 3B, top panel; lane 1). In the presence of RhoA or RhoC, the catalytic activity of PKN3 was further increased (lanes 6–7) and the highest kinase activity levels were obtained when PKN3 was co‐expressed simultaneously with Rho proteins and PDK1 (lanes 10–11). The catalytic activity correlated with phosphorylation of threonine 860 (T860) within the turn‐motif of PKN3 as detected by a novel polyclonal antibody that specifically recognizes phospho‐T860 (see next section). Control reactions containing recombinant PDK1 alone (lane 3) or PDK1 co‐expressed with PKN3kd (lane12) demonstrate that PDK1 does not phosphorylate the PKN3 substrate under the conditions used. Compared to HEK293T cells (shown above in Figure 3A) in PC‐3 cells it is more difficult to completely separate increased activity from expression level due to mutual stabilizing effect in response to complex formation as mentioned above.
We also compared RhoA and RhoC‐mediated stimulation of PKN3 activity in HeLa cells, where it was easier to maintain comparable expression levels (Supplementary Fig. 3A). PKN3 showed increased kinase activity when RhoC was present compared to RhoA as shown in anti‐Myc and anti‐HA immune precipitates, which may result from the preferential association of PKN3 and RhoC (Supplementary Fig. 3B).
3.4. Activated PKN3 is localized to nucleus
Previous experiments indicated that PKN3 is not only regulated at the transcriptional level in response to oncogenic pathway deregulation, but also post‐transcriptionally and at the level of its catalytic activity (Leenders et al., 2004). Increased phosphorylation of AGC‐type kinases at key residues located in the activation loop, the turn‐motif, and the hydrophobic motif contribute to increased protein stability as well as activity (Newton, 2003). Since the hydrophobic motif in PKN3 is occupied by a phospho‐mimetic amino acid and the epitope around the activation loop (T718) is shared with other AGC‐family kinases, we aimed to develop an activation‐state specific antibody against the unique turn‐motif phosphorylation site at T860, previously suggested to constitute an invariant site for PKN3 activity (Leenders et al., 2004) because even phospho‐mimetic amino acid substitutions such as glutamic acid or aspartic acid completely abrogate its activity (data not shown). As shown in Figure 4A affinity‐purified rabbit antibodies that were raised against an epitope encompassing the phosphorylated turn‐motif (P∗‐T860) specifically detected PKN3wt by Western blotting, but not PKN3kd or PKN1 and PKN2 in HeLa cells stably expressing a 4‐hydroxytamoxifen (4‐OHT) inducible form of PKN3, PKN3wt‐ER, or the kinase‐defective PKN3kd‐ER (Leenders et al., 2004). PKN3wt‐ER had no detectable kinase activity in the absence of 4‐OHT (Figure 4A) and its ability to phosphorylate a substrate increased over the course of 18h after addition of 4‐OHT to the medium. The increase in activity is closely mirrored by the phospho‐signal detected using the turn‐motif specific P∗‐T860 antibody as indicated by quantification of the relative signal intensities (Figure 4A). The activation‐loop specific phospho‐antibody signal showed a certain increase over time as well; however, since PKN3kd‐ER and PKN1/2 are also detected, it is less suitable as an indicator for PKN3 catalytic activity.
Figure 4.
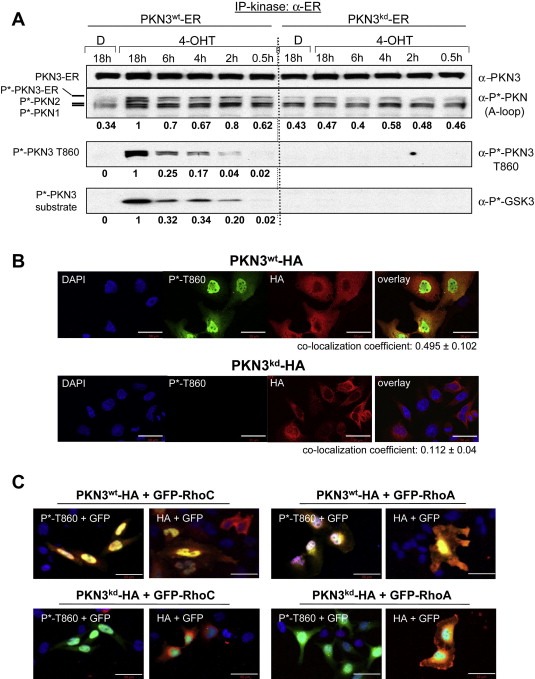
PKN3 and RhoC can localize to the nucleus. (A) PKN3 phosphorylation at the turn‐motif correlates with catalytic activity. HeLa cells stably expressing PKN3wt‐ER or PKN3kd‐ER were treated in the presence of 10μg/ml insulin with vehicle (D: DMSO) or 200nM 4‐OHT for the indicated times and extracts were analyzed by Western blotting using pan‐PKN3, activation loop (A‐loop) or turn‐motif (T860) specific phospho‐antibodies (top panels 1–3). PKN3‐ER molecules were precipitated from equal amounts of lysates using an ER‐tag antibody and subjected to an in‐vitro protein kinase assay; substrate phosphorylation was detected by a phospho‐GSK3α/β antibody (bottom panel). Relative signal intensities of A‐loop, T860 and substrate phosphorylation of the PKN3wt samples were quantified by densitometric scanning of the luminescence signals and are shown below each panel; the maximum activation achieved after 18h 4‐OHT treatment was set at a value of 1. (B) Active PKN3 is localized to the nucleus. Confocal IF was performed on coverslips using anti‐P∗‐T860 (Alexa‐488 Green) and anti‐HA antibodies (Alexa‐546 Red) on HeLa cells overexpressing HA‐tagged PKN3wt or HA‐tagged PKN3kd; the nuclei were DAPI stained. For co‐localization analysis Pearson's Correlation Coefficient (PCC±S.E.) for PKN3wt (n=15) and PKN3kd (n=25) cells was calculated using Volocity Image analysis software. Size bars indicate 50μm. (C) Active PKN3 and RhoC can co‐localize in the nucleus. IF was conducted using anti‐P∗‐T860 and anti‐HA antibodies (Alexa‐546 Red) on HeLa cells overexpressing either GFP‐tagged RhoC or RhoA (Green) together with PKN3wt‐HA or PKN3kd‐HA. Nuclei were detected by DAPI staining. All pictures were taken at 20× magnification; images are shown enlarged to provide details of the intracellular localization. Size bars indicate 50μm.
To evaluate activation‐state specific localization of PKN3, HA‐tagged wt PKN3 or its catalytic site mutant (K588E) were transiently expressed and recombinant proteins were detected using confocal immunofluorescence (IF) microscopy (Figure 4B). Transfected cells were identified with an HA‐antibody, which does not discriminate between active and inactive PKN3 molecules. The P∗‐T860 antibody specifically recognizes wild‐type, but not inactive versions of PKN3 as shown in 3, 4, B and Supplementary Fig. 3. Surprisingly, PKN3 molecules detected by the P∗‐T860 antibody predominantly localized to the nucleus, whereas the anti‐HA signal was prevalent in all cellular compartments. This suggests that when overexpressed only a limited fraction of the total PKN3 protein can become phosphorylated at T860, whereas a major proportion of the overexpressed recombinant protein remains unmodified and dispersed throughout the cells. The predominant nuclear localization is mostly apparent in the overlay analysis and is indicated by a nuclear co‐localization coefficient of 0.495 for DAPI and P∗‐T860 of wt PKN3 (Figure 4B, upper panel) using Pearson's Correlation Coefficient (PCC) analysis compared to 0.112 of kinase‐defective PKN3 (Figure 4B, lower panel). Taken together, these results indicate that turn‐motif phosphorylation at T860 correlates with PKN3 catalytic activity and that active PKN3 localizes predominantly to the nuclear compartment.
Since our experiments demonstrate that Rho GTPases form a specific complex with PKN3, we wanted to test whether they can associate with active PKN3 in the nucleus. We co‐expressed HA‐tagged wt and kd PKN3 in the presence of GFP‐RhoC or GFP‐RhoA in HeLa cells and analyzed their intracellular localization by confocal immunofluorescence. Yellow staining indicates co‐localization of active PKN3 detected either by P∗‐T860 or anti‐HA antibodies with GFP‐RhoA/C predominantly in the nucleus (Figure 4C, upper panel). By contrast, PKN3kd was only detected by the HA‐antibody and appeared to be excluded from the inner nuclear area occupied by Rho proteins (lower panel). Compared to RhoC, there was increased co‐staining of PKN3 with RhoA detectable in the perinuclear and cytoplasmic region. These results suggest that Rho GTPases can co‐localize with active PKN3 in the nucleus when highly expressed, but they do not explain the preference of PKN3 for interacting with RhoC over RhoA.
We also analyzed the localization of GFP‐RhoC and GFP‐RhoA overexpressed individually indicating predominantly nuclear and membrane localization plus some cytoplasmic staining for RhoA (Supplementary Fig. 4).
3.5. PKN3 regulates growth of breast cancer cells in‐vitro and in‐vivo
Previously, a study using RhoC‐deficient mice demonstrated that RhoC is dispensable for normal development and for tumorigenesis, while being essential for metastasis in a mouse breast cancer model (Hakem et al., 2005). In addition, RhoC expression is upregulated during breast cancer progression and correlates with the aggressiveness of invasive carcinomas of the breast (Fritz et al., 2002; Kleer et al., 2002, 2005). Since our studies implicate PKN3 as a functional binding partner of RhoC, we analyzed the expression of PKN3 and RhoC in a panel of breast cancer cell lines. Figure 5A shows that PKN3 is expressed in all mammary tumor lines examined, with the highest level being detected in the basal‐like triple negative (estrogen receptor, progesterone receptor and ErbB2 negative) lines, BT549 and MDA‐MB‐231. Elevated PKN3 protein levels in these samples also correlate with increased PKN3 catalytic activity as measured by T860 phosphorylation. Similarly, the highest level of RhoC expression was detected in the triple negative cell lines. Subsequently, we chose MDA‐MB‐231 cells, which exhibit tumor‐initiating cell characteristics (Fillmore and Kuperwasser, 2008), to generate stable lines expressing Dox‐inducible PKN3, p110β, or non‐targeting shRNAs. Lysates from stably transduced cell populations exhibited efficient knockdown of PKN3 or p110β after 72h Dox treatment (Figure 5B). Knockdown of either PKN3 or p110β significantly attenuated growth of MDA‐MB‐231 cells in Matrigel compared to control‐treated samples (Figure 5C). Furthermore, we observed that PKN3 regulates the ability of MDA‐MB‐231 cells to form multi‐cellular spheroids, a hallmark of tumor‐initiating cells in breast cancer (Mani et al., 2008). After only 4 days, the effect of PKN3 knockdown became visible, as reflected by the smaller mammosphere size of the Dox‐treated samples (Figure 5D, left). We isolated spheroids of comparable size and propagated them individually in 24‐wells for additional 13 days. Compared to mock‐treated control samples mammosphere growth was substantially impaired in response to PKN3 knockdown with the occasional appearance of apoptotic blebs on the spheroid surface (Figure 5D, right). Collectively, the attenuated growth of PKN3 knockdown cells observed in these 3D culture environments supports the hypothesis that PKN3 can contribute to the phenotype of invasive breast cancer cells, similar to the perceived role of its binding partner RhoC in late‐stage aggressive disease (Hakem et al., 2005).
Figure 5.

Malignant growth of MDA‐MB‐231 cells is mediated by PKN3. (A) PKN3 and RhoC expression levels in breast cancer cell lines. Lysates from the indicated breast cancer lines grown in the presence or absence of serum were analyzed for expression and activation of PKN3 as well as for RhoC levels by immunoblotting; p110α served as a loading control. Subsequent experiments were carried out in MDA‐MB‐231 cells (underlined). (B) Stably transduced MDA‐MB‐231 cells with Dox‐dependent expression of either PKN3 or p110β shRNAs were analyzed in parallel with samples expressing an unrelated control shRNA. Cells were grown with or without 250ng/ml Dox for 72h and extracts were immunoblotted with antibodies against PKN3, p110β and phospho‐Akt (T308). Akt served as a loading control. (C) The engineered cells were pre‐treated with or without Dox for 72h, embedded in 80% Matrigel (11–12mg/ml) and photographed after 7 days at 10× magnification. Medium was replaced every 2–3 days ±Dox. (D) In parallel, cells were cultured as mammospheres in low binding plates with or without Dox. Representative spheroids from mock or Dox‐treated plates were photographed after 4 days at 5× magnification (left). Comparable size spheroids were selected and cultured individually in 24‐wells and photographed on days 9 and 13 (right). (E) Stable PKN3 (orange bars), p110β (blue bars) or control (white bars) shRNA expressing cells were transplanted into the mammary fat pad of female mice. The animals were split into two groups, one group was treated with Dox to induce shRNA expression and the second group was mock treated; with 15 animals per group (n). Primary mammary tumors were measured weekly for 6 weeks, and on day 42 the animals were killed and evaluated. Each bar represents the mean tumor volume±S.E.
To analyze the role of PKN3 in an in‐vivo breast cancer model, the MDA‐MB‐231 cells engineered for inducible expression of PKN3, p110β or non‐targeting shRNAs, were transplanted into the mammary fat pad of female mice. While Dox administration of animals transplanted with cells expressing non‐targeting shRNAs did not affect primary mammary tumor growth, strong attenuation of mammary tumor development was observed in mice harboring PKN3 shRNA xenotransplants similar to that of p110β shRNA (Figure 5E). In the latter case, due to leakiness of p110β shRNA expression in the uninduced state (see Figure 5B), the mock‐treated animals also exhibited a reduction in tumor size compared to mice harboring uninduced PKN3‐ and non‐targeting shRNA transplants (Figure 5E). To further substantiate this novel finding in an orthotopic breast cancer model, we employed additional PKN3 shRNAs and observed a dose‐dependent effect on tumor formation in mice treated with and without Dox (Supplementary Fig. 6). The in‐vivo analysis is in agreement with the results obtained in the in‐vitro studies described above indicating that PKN3 can regulate breast cancer development.
3.6. PKN3 overexpression is sufficient for enhanced growth of MDA‐MB‐231 cells in Matrigel, and this effect is RhoC‐dependent
A further functional connection between RhoC and PKN3 was documented by analyzing MDA‐MB‐231 lysates from cells with Dox‐induced PKN3 knockdown: Compared to uninduced samples, lysates from PKN3‐depleted cells exhibited reduced levels of RhoC protein (Figure 6A). Also, RhoA levels were reduced in response to PKN3 knockdown, albeit to a lesser extent. RhoB could not be detected. As a molecule with tumor suppressive function it is frequently downregulated in cancer cells (Huang and Prendergast, 2006). The identity of the Rho protein signals in the immunoblot was confirmed using siRNAs targeting either RhoC or RhoA. The RhoC antibody may crossreact to some extent with RhoA as indicated by a slight reduction in the RhoC band after RhoA siRNA treatment. Similarly, the RhoA signal was somewhat reduced by RhoC knockdown due to slight crossreactivity of the RhoA antibody. Taken together, the results indicate that complex formation with PKN3 can stabilize the RhoC protein; alternatively, PKN3 may regulate RhoC expression via an mRNA or miRNA‐dependent mechanism.
Figure 6.
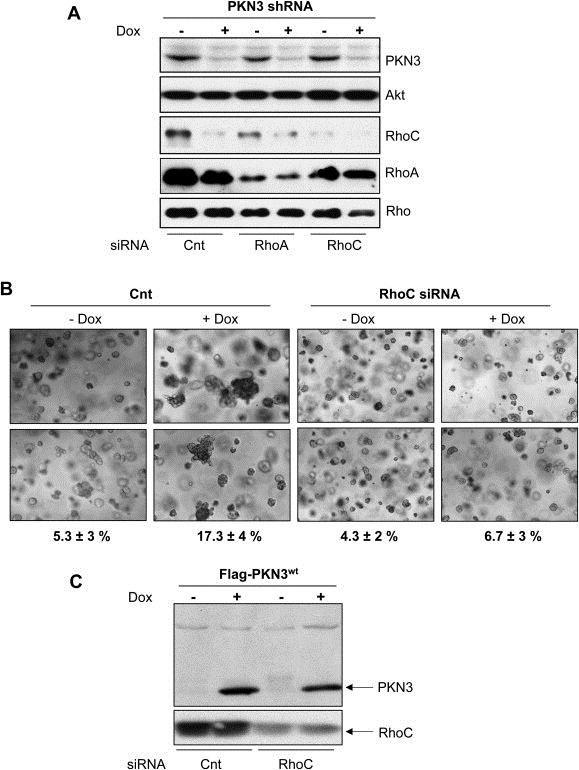
PKN3 mediates growth of MDA‐MB‐231 cells in a RhoC‐dependent manner. (A) MDA‐MB‐231 cells stably engineered for Dox‐dependent PKN3 knockdown were transfected with siRNAs targeting either RhoA or RhoC, in parallel to an unrelated control siRNA. 72h after Dox addition or 48h after siRNA transfection, cells were lysed and analyzed by immunoblotting. (B) Stable MDA‐MB‐231 cells with Dox‐dependent overexpression of PKN3 were transfected with siRNA targeting RhoC or mock transfected, and then embedded in 80% Matrigel (11–12mg/ml). Medium was replaced every 2–3 days ±Dox. Multi‐cellular clusters (>10 cells) indicating proliferating cells were quantified relative to individual cells or small cell aggregates on day 7: Counts from five photographic sections were averaged per sample and expressed as mean percentage±S.E. Photographs were taken at 5× magnification; two enlarged images for each sample are shown. (C) Parallel Matrigel samples were lysed on day 4 and both the induced overexpression of PKN3wt and knockdown of RhoC were confirmed by immunoblotting.
To investigate the role of PKN3 and RhoC in mammary tumor formation in more detail, we established stable MDA‐MB‐231 lines overexpressing wt PKN3 in a Dox‐inducible manner and examined the growth of these cells embedded in Matrigel. Surprisingly, cells with inducible PKN3 expression adopted a more aggressive behavior as indicated by their growth advantage in extracellular matrix compared to uninduced cells (Figure 6B): The enhanced growth potential upon PKN3 overexpression is reflected by an increased percentage of cells growing as multi‐cellular clusters in the semi‐solid 3D environment (∼17%) compared to control cells with wt PKN3 expression levels (∼5%). This suggests that increased expression of active PKN3 is sufficient to further augment the ability of MDA‐MB‐231 cells to grow in Matrigel. The correlation between induced PKN3 levels and the enhanced growth observed in the 3D matrix (Figure 6B and C) indicates that elevated PKN3 expression can worsen the phenotype of breast cancer cells.
To interrogate a possible involvement of RhoC in this PKN3‐driven phenotype, we depleted RhoC in these cells with siRNA (Figure 6C). Indeed, knockdown of RhoC in cells overexpressing PKN3 resulted in a normalization of the enhanced growth phenotype in Matrigel (Figure 6B) and the percentage of cells growing as multi‐cellular clusters was reduced to basal levels. RhoC knockdown had no apparent effect on the isogenic control samples, which were not induced for increased PKN3 expression. These results indicate that RhoC not only stimulates the catalytic activity of PKN3, but also it represents a mediator of PKN3‐induced growth. Taken together, these results suggest that the functional complex between PKN3 and RhoC supports a more advanced malignant phenotype in breast cancer cells.
4. Discussion
The results of this study delineate PKN3 as a crucial regulator of neoplastic growth in prostate and breast cancer cells in‐vitro and in‐vivo and provide new insight into the molecular mechanism of regulation of this tumor‐promoting kinase. PKN3 has previously been found to be required for prostate cancer cell growth downstream of oncogenic phosphoinositide 3‐kinase (Leenders et al., 2004). In agreement with this, we observed that knockdown of PKN3 was as effective at inhibiting PC‐3 cell growth as was knockdown of p110β (Figure 1 and Supplementary Fig. 1), the predominant isoform of the catalytic subunit of class I phosphoinositide 3‐kinase in prostate cancer cells (Jia et al., 2008; Leenders et al., 2004). However, in contrast to earlier findings stating that PKN3 promotes metastatic growth in NMRI nude mice xenotransplants, we now report that PKN3 supports both primary and metastatic tumor growth when transplanted into nude (nu/nu) mice (Figure 1B). Since both studies were performed using PC‐3 cells and employed identical PKN3 and p110β shRNAs we attribute the more profound effect in the current data set to the use of a different mouse strain (nu/nu). We observed a similar 50–60% reduction in primary tumor growth and block of metastasis, whether shRNA induction was induced early after transplantation or in an established tumor setting (Figure 1B and C). This may indicate that PKN3 function is more relevant during later phases of tumor growth, e.g. when the tumor reaches a size that demands neovascularization to provide sufficient oxygen and nutrients to sustain tumor growth. Alternatively, PKN3 may assist in maintaining aspects of tumor‐initiating or tumor stem cells such as EMT (Figure 1A) or mammosphere growth (Figure 5D). In support of this possibility, EMT was shown to regulate tumor stem cell growth and metastasis (Mani et al., 2008; Thiery, 2002), and also RhoC is a known mediator of both EMT and metastasis (Bellovin et al., 2006; Hakem et al., 2005; Ma et al., 2007).
By investigating the molecular mechanism of how PKN3 exerts its function in regulating malignant growth, we demonstrate that PKN3 undergoes complex formation with members of the Rho family of GTPases. Among a set of prototype family members tested (Rac1, Cdc42, RhoA, RhoB and RhoC) PKN3 preferentially interacts with RhoC (Figure 2, and Supplementary Figs. 2, 3 and 5). Considering the reciprocal and preferred interaction of PKN3 with RhoC over the closely related RhoA and RhoB, and of RhoC with PKN3 over its homologs PKN1 and PKN2, our data suggests a functional role for the PKN3–RhoC complex in late‐stage aggressive forms of prostate and breast tumors, where both molecules become upregulated (Iiizumi et al., 2008; Leenders et al., 2004). Notably, the PKN3–RhoC interaction was found to facilitate recruitment of PDK1 to the complex, thereby further stimulating PKN3 catalytic activity (Figures 2A and 3B).
Rho GTPases are temporally and spatially activated by their requisite guanine nucleotide exchange factors (GEFs), thus determining the status of the interaction with their effector kinases (Hall, 2009; Manser, 2002). Therefore, we employed dominant‐negative forms of the GTPases, which act by entering into a nonproductive interaction with their GEFs. As expected, endogenous PKN3 exhibited decreased affinity to dominant‐negative RhoC compared to wild‐type RhoC (Supplementary Fig. 5). Although the overall affinity of PKN3 toward RhoA was reduced relative to RhoC, it was even lower when dominant‐negative RhoA was used as bait, indicating that the interaction of PKN3 with both RhoC and RhoA is GTP‐dependent. However, PKN3 also exhibited reduced capacity for interacting with a constitutively active form of RhoC compared to wild‐type RhoC (Supplementary Fig. 5). Overexpression of constitutively active RhoC may not allow co‐precipitation of PKN3 as efficiently as wt RhoC, because of possible alterations in localization and/or competition with many other GTPase effectors known to selectively associate with the activated form of the GTPase (Heasman and Ridley, 2008).
RhoC represents one of few Rho GTPase family members with a Canonical Nuclear Localization Signal (CNLS) (Williams, 2003). This CNLS overlaps with the polybasic region (PBR) in RhoC and may regulate its nucleocytoplasmic shuttling, as shown for select Rho and Ras family members (Chelsky et al., 1989; Chook and Blobel, 2001; Christophe et al., 2000; Hodel et al., 2001). When highly expressed, RhoA and RhoC can also be found in the nucleus and co‐localize with the activated form of PKN3, as measured by the turn‐motif specific phospho‐T860 antibody (Figure 4B).
Expression of RhoC correlates with late‐stage aggressive behavior of several cancer types as characterized by increased invasive and metastatic capacity (Iiizumi et al., 2008; Kleer et al., 2005, 2006; Kondo et al., 2004; Liu et al., 2007; Marionnet et al., 2003; Shikada et al., 2003; Suwa et al., 1998; van Golen et al., 1999; Wang et al., 2003, 2004). RhoC overexpression is sufficient to enhance the metastatic potential of tumor cells (Hakem et al., 2005). In a mouse mammary adenocarcinoma model with 100% penetrance for lung metastasis, markedly reduced numbers of metastases were formed in the absence of RhoC (Clark et al., 2000). More recently, RhoC upregulation in metastatic breast cancer was linked to miRNA10b expression (Ma et al., 2007): Mir10b expression is elevated in metastatic breast cancer and its expression is positively controlled by the EMT‐inducing transcription factor, TWIST. Expression of mir10b indirectly affects expression of RhoC through inhibition of the negatively regulating transcription factor homeobox protein D10, Hoxd10 (Ma et al., 2007). However, while this report describes a model for how RhoC expression is regulated during metastasis, the molecular mechanism by which RhoC stimulates increased malignant potential of cancer cells remains unclear. Through shRNA‐mediated depletion and overexpression, we demonstrate that PKN3 is both necessary and sufficient for promoting an increased malignant phenotype in a breast cancer model (Figure 6). Moreover, the growth stimulation caused by PKN3 overexpression was reversed by knocking down RhoC suggesting that PKN3 and RhoC can be functionally coupled in late‐stage breast cancer cells (Figure 6B and C).
In total, we employed four different PKN3 shRNAs to substantiate a novel role of PKN3 in breast cancer growth using an orthotopic breast tumor model, where we observed a dose‐dependent reduction in tumor formation in mice treated with Dox (Figure 5E and Supplementary Fig. 6). Taken together, our in‐vivo studies in breast and prostate cancer models suggest that PKN3 promotes malignant growth at the level of primary tumor growth. Furthermore, given the strong and preferential interaction of PKN3 and RhoC, we hypothesize that PKN3 and RhoC form a complex, in which both deregulated proteins functionally cooperate to promote increased growth and invasion of breast cancer cells. While RhoC appears to promote metastasis without effecting primary tumor growth (Clark et al., 2000; Hakem et al., 2005), the ubiquitously expressed RhoA has been implicated in the formation of primary tumors (Dohda et al., 2004). Since PKN3 can also interact with RhoA, albeit with reduced affinity compared to RhoC, we cannot rule out that a complex consisting of PKN3 and RhoA also regulates neoplastic growth. RhoA may become substituted by RhoC during EMT‐assisted progression to more aggressive disease stages, when RhoC levels become upregulated.
5. Conclusion
In summary, we propose a model suggesting that aberrantly expressed PKN3 and RhoC can cooperate in advanced disease stages. Complex formation leads to increased PKN3 catalytic activity. The complex formed between PKN3 and RhoC in aggressive tumor cells may, therefore, represent an attractive target for therapeutic intervention.
Disclosure statement
The authors are Pfizer employees and declare competing financial interests; a patent application may be affected by publication.
Supporting information
The following are the Supplementary data related to this article:
Supplementary data
Supplementary data
Acknowledgments
We are grateful to Wolfgang Arnold and Manuela Aleku for many helpful suggestions on establishing the orthotopic mouse prostate cancer model. We thank Joerg Kaufmann and Ansgar Santel for generously providing lentiviral vectors for inducible PKN3 and p110β shRNA expression. We thank Danielle Vitale for expert technical assistance. We acknowledge Bing Guo and Kim Arndt for the generous gift of the PDK1 expression vector. We are grateful to Robert Abraham, Sabine Werner, Aziz Sancar, Marc Damelin, Brion Murray and Ken Geles for critical reading of the manuscript. We thank our Pfizer Oncology and former Wyeth Oncology colleagues for many helpful suggestions during the course of these studies.
Supplementary material 1.
1.1.
Supplementary data related to this article can be found online at doi:10.1016/j.molonc.2011.12.001.
Unsal-Kacmaz Keziban, Ragunathan Shoba, Rosfjord Edward, Dann Stephen, Upeslacis Erik, Grillo Mary, Hernandez Richard, Mack Fiona, Klippel Anke, (2012), The interaction of PKN3 with RhoC promotes malignant growth, Molecular Oncology, 6, doi: 10.1016/j.molonc.2011.12.001.
Contributor Information
Keziban Unsal-Kacmaz, Email: Keziban.Unsal-Kacmaz@Pfizer.com.
Shoba Ragunathan, Email: Shoba.Ragunathan@Pfizer.com.
Edward Rosfjord, Email: Edward.Rosfjord@Pfizer.com.
Stephen Dann, Email: Stephen.Dann@Pfizer.com.
Erik Upeslacis, Email: Eric.Upeslacis@Pfizer.com.
Mary Grillo, Email: grillom@optonline.net.
Richard Hernandez, Email: hernandez.richard2@gmail.com.
Fiona Mack, Email: Fiona.Mack@Pfizer.com.
Anke Klippel, Email: Anke.Klippel-Giese@Pfizer.com.
References
- Aleku, M. , Schulz, P. , Keil, O. , Santel, A. , Schaeper, U. , Dieckhoff, B. , Janke, O. , Endruschat, J. , Durieux, B. , Roder, N. , Loffler, K. , Lange, C. , Fechtner, M. , Mopert, K. , Fisch, G. , Dames, S. , Arnold, W. , Jochims, K. , Giese, K. , Wiedenmann, B. , Scholz, A. , Kaufmann, J. , 2008. Atu027, a liposomal small interfering RNA formulation targeting protein kinase N3, inhibits cancer progression. Cancer Res.. 68, 9788–9798. [DOI] [PubMed] [Google Scholar]
- Bellovin, D.I. , Simpson, K.J. , Danilov, T. , Maynard, E. , Rimm, D.L. , Oettgen, P. , Mercurio, A.M. , 2006. Reciprocal regulation of RhoA and RhoC characterizes the EMT and identifies RhoC as a prognostic marker of colon carcinoma. Oncogene. 25, 6959–6967. [DOI] [PubMed] [Google Scholar]
- Chelsky, D. , Ralph, R. , Jonak, G. , 1989. Sequence requirements for synthetic peptide-mediated translocation to the nucleus. Mol. Cell Biol.. 9, 2487–2492. [DOI] [PMC free article] [PubMed] [Google Scholar]
- Chook, Y.M. , Blobel, G. , 2001. Karyopherins and nuclear import. Curr. Opin. Struct. Biol.. 11, 703–715. [DOI] [PubMed] [Google Scholar]
- Christophe, D. , Christophe-Hobertus, C. , Pichon, B. , 2000. Nuclear targeting of proteins: how many different signals?. Cell Signal.. 12, 337–341. [DOI] [PubMed] [Google Scholar]
- Clark, E.A. , Golub, T.R. , Lander, E.S. , Hynes, R.O. , 2000. Genomic analysis of metastasis reveals an essential role for RhoC. Nature. 406, 532–535. [DOI] [PubMed] [Google Scholar]
- Czauderna, F. , Santel, A. , Hinz, M. , Fechtner, M. , Durieux, B. , Fisch, G. , Leenders, F. , Arnold, W. , Giese, K. , Klippel, A. , Kaufmann, J. , 2003. Inducible shRNA expression for application in a prostate cancer mouse model. Nucleic Acids Res.. 31, e127 [DOI] [PMC free article] [PubMed] [Google Scholar]
- Dohda, T. , Nakamura, Y. , Kamihira, M. , Iijima, S. , 2004. Functional role of RhoA in growth regulation of primary hepatocytes. J. Biochem.. 135, 631–637. [DOI] [PubMed] [Google Scholar]
- Dong, L.Q. , Landa, L.R. , Wick, M.J. , Zhu, L. , Mukai, H. , Ono, Y. , Liu, F. , 2000. Phosphorylation of protein kinase N by phosphoinositide-dependent protein kinase-1 mediates insulin signals to the actin cytoskeleton. Proc. Natl. Acad. Sci. U.S.A.. 97, 5089–5094. [DOI] [PMC free article] [PubMed] [Google Scholar]
- Fillmore, C.M. , Kuperwasser, C. , 2008. Human breast cancer cell lines contain stem-like cells that self-renew, give rise to phenotypically diverse progeny and survive chemotherapy. Breast Cancer Res.. 10, R25 [DOI] [PMC free article] [PubMed] [Google Scholar]
- Flynn, P. , Mellor, H. , Casamassima, A. , Parker, P.J. , 2000. Rho GTPase control of protein kinase C-related protein kinase activation by 3-phosphoinositide-dependent protein kinase. J. Biol. Chem.. 275, 11064–11070. [DOI] [PubMed] [Google Scholar]
- Flynn, P. , Mellor, H. , Palmer, R. , Panayotou, G. , Parker, P.J. , 1998. Multiple interactions of PRK1 with RhoA. Functional assignment of the Hr1 repeat motif. J. Biol. Chem.. 273, 2698–2705. [DOI] [PubMed] [Google Scholar]
- Fritz, G. , Brachetti, C. , Bahlmann, F. , Schmidt, M. , Kaina, B. , 2002. Rho GTPases in human breast tumours: expression and mutation analyses and correlation with clinical parameters. Br. J. Cancer. 87, 635–644. [DOI] [PMC free article] [PubMed] [Google Scholar]
- Hakem, A. , Sanchez-Sweatman, O. , You-Ten, A. , Duncan, G. , Wakeham, A. , Khokha, R. , Mak, T.W. , 2005. RhoC is dispensable for embryogenesis and tumor initiation but essential for metastasis. Genes Dev.. 19, 1974–1979. [DOI] [PMC free article] [PubMed] [Google Scholar]
- Hall, A. , 2009. The cytoskeleton and cancer. Cancer Metastasis Rev.. 28, 5–14. [DOI] [PubMed] [Google Scholar]
- Hashimoto, T. , Mukai, H. , Kawamata, T. , Taniguchi, T. , Ono, Y. , Tanaka, C. , 1998. Localization of PKN mRNA in the rat brain. Brain Res. Mol. Brain Res.. 59, 143–153. [DOI] [PubMed] [Google Scholar]
- Heasman, S.J. , Ridley, A.J. , 2008. Mammalian Rho GTPases: new insights into their functions from in vivo studies. Nat. Rev. Mol. Cell Biol.. 9, 690–701. [DOI] [PubMed] [Google Scholar]
- Hodel, M.R. , Corbett, A.H. , Hodel, A.E. , 2001. Dissection of a nuclear localization signal. J. Biol. Chem.. 276, 1317–1325. [DOI] [PubMed] [Google Scholar]
- Huang, M. , Prendergast, G.C. , 2006. RhoB in cancer suppression. Histol. Histopathol.. 21, 213–218. [DOI] [PubMed] [Google Scholar]
- Iiizumi, M. , Bandyopadhyay, S. , Pai, S.K. , Watabe, M. , Hirota, S. , Hosobe, S. , Tsukada, T. , Miura, K. , Saito, K. , Furuta, E. , Liu, W. , Xing, F. , Okuda, H. , Kobayashi, A. , Watabe, K. , 2008. RhoC promotes metastasis via activation of the Pyk2 pathway in prostate cancer. Cancer Res.. 68, 7613–7620. [DOI] [PMC free article] [PubMed] [Google Scholar]
- Jia, S. , Liu, Z. , Zhang, S. , Liu, P. , Zhang, L. , Lee, S.H. , Zhang, J. , Signoretti, S. , Loda, M. , Roberts, T.M. , Zhao, J.J. , 2008. Essential roles of PI(3)K-p110beta in cell growth, metabolism and tumorigenesis. Nature. 454, 776–779. [DOI] [PMC free article] [PubMed] [Google Scholar]
- Karlsson, R. , Pedersen, E.D. , Wang, Z. , Brakebusch, C. , 2009. Rho GTPase function in tumorigenesis. Biochim. Biophys. Acta. 1796, 91–98. [DOI] [PubMed] [Google Scholar]
- Kenny, P.A. , Lee, G.Y. , Myers, C.A. , Neve, R.M. , Semeiks, J.R. , Spellman, P.T. , Lorenz, K. , Lee, E.H. , Barcellos-Hoff, M.H. , Petersen, O.W. , Gray, J.W. , Bissell, M.J. , 2007. The morphologies of breast cancer cell lines in three-dimensional assays correlate with their profiles of gene expression. Mol. Oncol.. 1, 84–96. [DOI] [PMC free article] [PubMed] [Google Scholar]
- Kleer, C.G. , Griffith, K.A. , Sabel, M.S. , Gallagher, G. , van Golen, K.L. , Wu, Z.F. , Merajver, S.D. , 2005. RhoC-GTPase is a novel tissue biomarker associated with biologically aggressive carcinomas of the breast. Breast Cancer Res. Treat.. 93, 101–110. [DOI] [PubMed] [Google Scholar]
- Kleer, C.G. , Teknos, T.N. , Islam, M. , Marcus, B. , Lee, J.S. , Pan, Q. , Merajver, S.D. , 2006. RhoC GTPase expression as a potential marker of lymph node metastasis in squamous cell carcinomas of the head and neck. Clin. Cancer Res.. 12, 4485–4490. [DOI] [PubMed] [Google Scholar]
- Kleer, C.G. , van Golen, K.L. , Zhang, Y. , Wu, Z.F. , Rubin, M.A. , Merajver, S.D. , 2002. Characterization of RhoC expression in benign and malignant breast disease: a potential new marker for small breast carcinomas with metastatic ability. Am. J. Pathol.. 160, 579–584. [DOI] [PMC free article] [PubMed] [Google Scholar]
- Klippel, A. , Escobedo, M.A. , Wachowicz, M.S. , Apell, G. , Brown, T.W. , Giedlin, M.A. , Kavanaugh, W.M. , Williams, L.T. , 1998. Activation of phosphatidylinositol 3-kinase is sufficient for cell cycle entry and promotes cellular changes characteristic of oncogenic transformation. Mol. Cell Biol.. 18, 5699–5711. [DOI] [PMC free article] [PubMed] [Google Scholar]
- Kondo, T. , Sentani, K. , Oue, N. , Yoshida, K. , Nakayama, H. , Yasui, W. , 2004. Expression of RHOC is associated with metastasis of gastric carcinomas. Pathobiology. 71, 19–25. [DOI] [PubMed] [Google Scholar]
- Leenders, F. , Mopert, K. , Schmiedeknecht, A. , Santel, A. , Czauderna, F. , Aleku, M. , Penschuck, S. , Dames, S. , Sternberger, M. , Rohl, T. , Wellmann, A. , Arnold, W. , Giese, K. , Kaufmann, J. , Klippel, A. , 2004. PKN3 is required for malignant prostate cell growth downstream of activated PI 3-kinase. EMBO J.. 23, 3303–3313. [DOI] [PMC free article] [PubMed] [Google Scholar]
- Lim, W.G. , Chen, X. , Liu, J.P. , Tan, B.J. , Zhou, S. , Smith, A. , Lees, N. , Hou, L. , Gu, F. , Yu, X.Y. , Du, Y. , Smith, D. , Verma, C. , Liu, K. , Duan, W. , 2008. The C-terminus of PRK2/PKNgamma is required for optimal activation by RhoA in a GTP-dependent manner. Arch. Biochem. Biophys.. 479, 170–178. [DOI] [PubMed] [Google Scholar]
- Lim, W.G. , Tan, B.J. , Zhu, Y. , Zhou, S. , Armstrong, J.S. , Li, Q.T. , Dong, Q. , Chan, E. , Smith, D. , Verma, C. , Tan, S.L. , Duan, W. , 2006. The very C-terminus of PRK1/PKN is essential for its activation by RhoA and downstream signaling. Cell Signal.. 18, 1473–1481. [DOI] [PubMed] [Google Scholar]
- Liu, N. , Zhang, G. , Bi, F. , Pan, Y. , Xue, Y. , Shi, Y. , Yao, L. , Zhao, L. , Zheng, Y. , Fan, D. , 2007. RhoC is essential for the metastasis of gastric cancer. J. Mol. Med. (Berl.). 85, 1149–1156. [DOI] [PubMed] [Google Scholar]
- Lu, Y. , Settleman, J. , 1999. The Drosophila Pkn protein kinase is a Rho/Rac effector target required for dorsal closure during embryogenesis. Genes Dev.. 13, 1168–1180. [DOI] [PMC free article] [PubMed] [Google Scholar]
- Ma, L. , Teruya-Feldstein, J. , Weinberg, R.A. , 2007. Tumour invasion and metastasis initiated by microRNA-10b in breast cancer. Nature. 449, 682–688. [DOI] [PubMed] [Google Scholar]
- Mani, S.A. , Guo, W. , Liao, M.J. , Eaton, E.N. , Ayyanan, A. , Zhou, A.Y. , Brooks, M. , Reinhard, F. , Zhang, C.C. , Shipitsin, M. , Campbell, L.L. , Polyak, K. , Brisken, C. , Yang, J. , Weinberg, R.A. , 2008. The epithelial-mesenchymal transition generates cells with properties of stem cells. Cell. 133, 704–715. [DOI] [PMC free article] [PubMed] [Google Scholar]
- Manser, E. , 2002. Small GTPases take the stage. Dev. Cell. 3, 323–328. [DOI] [PubMed] [Google Scholar]
- Marionnet, C. , Lalou, C. , Mollier, K. , Chazal, M. , Delestaing, G. , Compan, D. , Verola, O. , Vilmer, C. , Cuminet, J. , Dubertret, L. , Basset-Seguin, N. , 2003. Differential molecular profiling between skin carcinomas reveals four newly reported genes potentially implicated in squamous cell carcinoma development. Oncogene. 22, 3500–3505. [DOI] [PubMed] [Google Scholar]
- Matthias, P. , Muller, M.M. , Schreiber, E. , Rusconi, S. , Schaffner, W. , 1989. Eukaryotic expression vectors for the analysis of mutant proteins. Nucleic Acids Res.. 17, 6418 [DOI] [PMC free article] [PubMed] [Google Scholar]
- Metzger, E. , Muller, J.M. , Ferrari, S. , Buettner, R. , Schule, R. , 2003. A novel inducible transactivation domain in the androgen receptor: implications for PRK in prostate cancer. EMBO J.. 22, 270–280. [DOI] [PMC free article] [PubMed] [Google Scholar]
- Mukai, H. , 2003. The structure and function of PKN, a protein kinase having a catalytic domain homologous to that of PKC. J. Biochem.. 133, 17–27. [DOI] [PubMed] [Google Scholar]
- Mukai, H. , Ono, Y. , 1994. A novel protein kinase with leucine zipper-like sequences: its catalytic domain is highly homologous to that of protein kinase C. Biochem. Biophys. Res. Commun.. 199, 897–904. [DOI] [PubMed] [Google Scholar]
- Newton, A.C. , 2003. Regulation of the ABC kinases by phosphorylation: protein kinase C as a paradigm. Biochem. J.. 370, 361–371. [DOI] [PMC free article] [PubMed] [Google Scholar]
- Oishi, K. , Mukai, H. , Shibata, H. , Takahashi, M. , Ona, Y. , 1999. Identification and characterization of PKNbeta, a novel isoform of protein kinase PKN: expression and arachidonic acid dependency are different from those of PKNalpha. Biochem. Biophys. Res. Commun.. 261, 808–814. [DOI] [PubMed] [Google Scholar]
- Quilliam, L.A. , Lambert, Q.T. , Mickelson-Young, L.A. , Westwick, J.K. , Sparks, A.B. , Kay, B.K. , Jenkins, N.A. , Gilbert, D.J. , Copeland, N.G. , Der, C.J. , 1996. Isolation of a NCK-associated kinase, PRK2, an SH3-binding protein and potential effector of Rho protein signaling. J. Biol. Chem.. 271, 28772–28776. [DOI] [PubMed] [Google Scholar]
- Shikada, Y. , Yoshino, I. , Okamoto, T. , Fukuyama, S. , Kameyama, T. , Maehara, Y. , 2003. Higher expression of RhoC is related to invasiveness in non-small cell lung carcinoma. Clin. Cancer Res.. 9, 5282–5286. [PubMed] [Google Scholar]
- Stephenson, R.A. , Dinney, C.P. , Gohji, K. , Ordonez, N.G. , Killion, J.J. , Fidler, I.J. , 1992. Metastatic model for human prostate cancer using orthotopic implantation in nude mice. J. Natl. Cancer Inst.. 84, 951–957. [DOI] [PubMed] [Google Scholar]
- Suwa, H. , Ohshio, G. , Imamura, T. , Watanabe, G. , Arii, S. , Imamura, M. , Narumiya, S. , Hiai, H. , Fukumoto, M. , 1998. Overexpression of the rhoC gene correlates with progression of ductal adenocarcinoma of the pancreas. Br. J. Cancer. 77, 147–152. [DOI] [PMC free article] [PubMed] [Google Scholar]
- Thiery, J.P. , 2002. Epithelial-mesenchymal transitions in tumour progression. Nat. Rev. Cancer. 2, 442–454. [DOI] [PubMed] [Google Scholar]
- Thiery, J.P. , Acloque, H. , Huang, R.Y. , Nieto, M.A. , 2009. Epithelial-mesenchymal transitions in development and disease. Cell. 139, 871–890. [DOI] [PubMed] [Google Scholar]
- Unsal-Kacmaz, K. , Mullen, T.E. , Kaufmann, W.K. , Sancar, A. , 2005. Coupling of human circadian and cell cycles by the timeless protein. Mol. Cell Biol.. 25, 3109–3116. [DOI] [PMC free article] [PubMed] [Google Scholar]
- van Golen, K.L. , Davies, S. , Wu, Z.F. , Wang, Y. , Bucana, C.D. , Root, H. , Chandrasekharappa, S. , Strawderman, M. , Ethier, S.P. , Merajver, S.D. , 1999. A novel putative low-affinity insulin-like growth factor-binding protein, LIBC (lost in inflammatory breast cancer), and RhoC GTPase correlate with the inflammatory breast cancer phenotype. Clin. Cancer Res.. 5, 2511–2519. [PubMed] [Google Scholar]
- Vincent, S. , Settleman, J. , 1997. The PRK2 kinase is a potential effector target of both Rho and Rac GTPases and regulates actin cytoskeletal organization. Mol. Cell Biol.. 17, 2247–2256. [DOI] [PMC free article] [PubMed] [Google Scholar]
- Wang, W. , Yang, L.Y. , Huang, G.W. , Lu, W.Q. , Yang, Z.L. , Yang, J.Q. , Liu, H.L. , 2004. Genomic analysis reveals RhoC as a potential marker in hepatocellular carcinoma with poor prognosis. Br. J. Cancer. 90, 2349–2355. [DOI] [PMC free article] [PubMed] [Google Scholar]
- Wang, W. , Yang, L.Y. , Yang, Z.L. , Huang, G.W. , Lu, W.Q. , 2003. Expression and significance of RhoC gene in hepatocellular carcinoma. World J. Gastroenterol.. 9, 1950–1953. [DOI] [PMC free article] [PubMed] [Google Scholar]
- Williams, C.L. , 2003. The polybasic region of Ras and Rho family small GTPases: a regulator of protein interactions and membrane association and a site of nuclear localization signal sequences. Cell Signal.. 15, 1071–1080. [DOI] [PubMed] [Google Scholar]
Associated Data
This section collects any data citations, data availability statements, or supplementary materials included in this article.
Supplementary Materials
The following are the Supplementary data related to this article:
Supplementary data
Supplementary data