

Abstract
Endoplasmic reticulum (ER) stress and autophagy are two basic cell survival mechanisms often occurring in concert. Extensive ER stress in cancer cells deliberately induced by chemotherapeutic drugs may lead to growth arrest and cell death. However, the link between ER stress and autophagy is not well understood. In this study, the treatment of cancer cells with ER stress‐inducing drug nelfinavir resulted in the expression of endogenous mTOR inhibitor sestrin‐2 (SESN2). Upregulation of SESN2 expression was associated with expression of ER stress markers ATF4, ATF3, and CHOP. SESN2 upregulation also occurred in cells treated with the proteasome inhibitor bortezomib. Ectopic expression of ATF4, but not of ATF3 or CHOP, caused transcriptional upregulation of SESN2 expression, indicating expressional regulation of SESN2 by ATF4. Transient overexpression of ectopic SESN2 resulted in mTOR inhibition and autophagy, confirming a link between ER stress, SESN2 upregulation, and mTOR inhibition. Accordingly, cancer cells treated with the ER stress‐inducing agent nelfinavir showed reduced mTOR activity and associated increases in the expression levels of ATF4 and SESN2. These results show that ATF4‐regulated SESN2 expression presents a new link between ER stress and mTOR inhibition and autophagy. mTOR inhibition by nelfinavir, which is currently in clinical trials for cancer patients, may also explain its observed ability to induce autophagy, growth arrest, and radiosensitization in cancer cells.
Keywords: mTOR, SESN2, Endoplasmic reticulum stress, Autophagy, Nelfinavir, Bortezomib
Highlights
Nelfinavir inhibits mTOR activity.
Endoplasmic reticulum stress induces SESN2 expression.
SESN2 is a target gene of the ATF4 transcription factor.
Expressional regulation of SESN2 by ATF4 links endoplasmic reticulum stress to mTOR inhibition and autophagy.
1. Introduction
The endoplasmic reticulum (ER) is a highly productive and sensitive cellular organelle, essential for diverse vital functions, including secretory and membrane protein biosynthesis, lipid biosynthesis, and calcium storage (Dara et al., 2011; Walter and Ron, 2011; Cao and Kaufman, 2012). For the ER to function properly, the maintenance of an oxidative environment, ion homeostasis, high energy levels, and sufficient protein folding and processing capacity are vital (Dara et al., 2011; Walter and Ron, 2011; Cao and Kaufman, 2012). Disturbances of this balance cause a rapid adaptation process that either leads to an extension of the ER network or improved ER protein folding capacity through enhanced chaperone expression (Dara et al., 2011; Walter and Ron, 2011; Cao and Kaufman, 2012). To avoid an overload with newly synthesized proteins that cannot be properly processed and may result in cytotoxic protein aggregates, ER stress signaling also mediates transiently reduced bulk protein expression (Dara et al., 2011; Walter and Ron, 2011; Cao and Kaufman, 2012). Signaling of ER stress is primarily mediated by three integral ER membrane proteins, IRE1, PERK, and ATF6. After ER stress‐coupled activation, these stress sensors can confer a partially overlapping intracellular signaling cascade, finally activating the transcriptions factors XBP1, nuclear ATF6, and ATF4. Most of the transcriptional target genes of XBP1, ATF6, and ATF4 function as molecular chaperones that allow increased protein folding capacity in both the ER and cytosol (Dara et al., 2011; Walter and Ron, 2011; Cao and Kaufman, 2012). ATF4 also regulates the expression of CHOP (Rzymski et al., 2009), a member of the pro‐apoptotic arm of the ER stress pathway. The pro‐apoptotic branch becomes activated after prolonged or unmanageable ER stress, when cells cannot cope with or cannot adapt to ER stress (Fimia and Piacentini, 2010; Suh et al., 2012; Schönthal, 2013). This pro‐apoptotic feature of the ER stress reaction has led to increased interest in ER stress‐inducing drugs like nelfinavir, bortezomib, and HSP90 inhibitors for the treatment of cancer (Fimia and Piacentini, 2010; Suh et al., 2012; Schönthal, 2013; Brüning et al., 2010a). Another cellular process often associated with enhanced ER stress is autophagy. Autophagy may help to digest misfolded proteins, to engulf overloaded or superfluous parts of the ER (reticulophagy), or to overcome energy or nutrient restrictions by recycling cellular compounds (Yorimitsu et al., 2006; Brech et al., 2009). The mechanistic link between ER stress and autophagy is not well understood, but autophagy has frequently been observed as a consequence of excessive ER stress (Suh et al., 2012; Yorimitsu et al., 2006; Brech et al., 2009; Benbrook and Long, 2012; Appenzeller‐Herzog and Hall, 2012). At the molecular level, autophagy is tightly controlled by the mTOR complex (Bai and Jiang, 2010). The anti‐cancer drugs nelfinavir and bortezomib have both been shown to induce ER stress and autophagy in human cancer cells (Brüning et al., 2009a). Bortezomib also acts as an efficient proteasome inhibitor, resulting in accumulation of poly‐ubiquitinated and non‐degraded proteins, including ATF4 (Milani et al., 2009). In this study, we show that proteaasome inhibitors and ER stress‐inducing drugs like bortezomib and nelfinavir cause upregulation of the endogenous mTOR inhibitor sestrin‐2 (SESN2), ensuing in impaired mTOR activity.
2. Materials and methods
2.1. Cells and cell culture
All cell lines, including the MDA‐MB‐453 breast cancer cell line (ATCC HTB‐131), ovarian cancer cell line OVCAR3 (ATCC HTB‐161), and cervical adenocarcinoma cell line HeLa (ATCC CCL‐2) were purchased from ATCC (LGC Standards, Wesel, Germany). Cells were cultured in DMEM cell culture medium (Biochrom, Berlin, Germany), supplemented with 10% FBS, 100 U/ml penicillin, and 100 μg/ml streptomycin in a humidified atmosphere with 5% CO2. All cell culture reagents were from Biochrom (Berlin, Germany).
2.2. Chemotherapeutic drugs
Carboplatin, cisplatin, taxol, etoposide, and doxorubicin were provided by the University Hospital Pharmacy (Munich‐Grosshadern, Germany) as ready‐to‐use solutions for clinical use. Bortezomib was purchased from Selleck Chemicals (Munich Germany). Nelfinavir, thapsigargin, and tunicamcin were purchased from Sigma (Munich, Germany).
2.3. Western blot analysis
For generation of cell lysates, cells were cultured in 10 cm diameter cell culture plates, incubated with the indicated drugs for various periods, washed with PBS, and solubilized in RIPA‐buffer (Cell Signal, Munich, Germany). 20 μg of protein extracts (BioRad Bradford Assay, BioRad, München, Germany) were subjected to SDS‐polyacrylamide gel electrophoresis (BioRad Mini Protean II Cell; BioRad, Munich, Germany). Proteins were transferred to PVDF membranes in a BioRad Mini Protean II blotting chamber at 1 mA/cm2 membrane in 10% methanol, 192 mM glycine, 25 mM Tris, pH 8.2. After blocking of membranes with 4% non‐fat milk powder in PBS‐0.05% Tween for 4 h, primary antibodies were applied in blocking buffer and incubated at 4 °C overnight. Antibodies against PARP, cleaved caspase 7, Akt, phospho‐Akt, cyclin D3, LC3B, eIF2, phospho‐eIF2, ribosomal protein S6, phospho‐S6, 4E‐BP1, p53, phospho‐p53 (Ser15), and PathScan antibody cocktail III were all purchased from Cell Signaling Technology (NEB, Frankfurt, Germany). Antibodies against Sestrin‐2 (41‐K), BiP (H‐129), ATF3 (C‐19), and ATF4 (C‐20) were from SantaCruz Biotech (Heidelberg, Germany). β‐actin antibodies were purchased from Sigma (Munich, Germany). Anti‐V5 antibodies were obtained from AbD Serotech (Martinsried, Germany). Secondary, alkaline phosphatase (AP)‐coupled antibodies against the corresponding primary antibodies were from Dianova, Hamburg, Germany. AP detection was performed by the chromogenic BCIP/NBT assay (Promega, Mannheim, Germany).
2.4. PCR analysis
RT‐PCR analysis, PCR conditions and primer sequences for the detection of CHOP, ATF3, and β‐actin expression and XBP1 splicing have previously been described in detail (Brüning, 2011). In brief, HeLa cells (5 × 10⁵ cells per well) were seeded in 6‐well cell culture plates and incubated for 16 h with 100 nM thapsigargin. RNA preparation and cDNA synthesis was performed with the RNA extraction kit (Macherey–Nagel, Düren, Germany) and MMLV‐reverse transcriptase (Promega, Mannheim, Germany), according to the manufacturer's recommendations.
2.5. Cloning and expression of SESN2 cDNA
The full length coding sequence of SESN2 was amplified by PCR on cDNAs generated from nelfinavir‐treated MCF7 cells using primer pairs GCGCACCATGATCGTGGCGGACTCC and GGTCATGTAGCGGGTGATGGCACGG. The same primer pair was also used for semi‐quantitative RT‐PCR analysis. Amplified PCR products were inserted into the pcDNA3.1‐V5/HIS TOPO cloning vector as recommended by the supplier (Invitrogen, Karlsruhe, Germany). Primer sequences for ATF4, ATF3, CHOP, XBP1, CMV, and β‐actin have previously been described (Brüning et al., 2012). Generation of ATF3, ATF4, and CHOP expression plasmids has also been described (Brüning et al., 2012). Plasmids were transfected with Lipofectamin 2000 (Invitrogen, Karlsruhe, Germany) into HeLa cells either grown on glass cover slips (for immunofluorescence) or in 6‐well cell culture dishes (for RNA preparation). After further incubation in cell culture, cells were either fixed with ice‐cold methanol for immunofluorescence analysis or RNA was extracted for PCR analysis.
2.6. Immunofluorescence analysis
HeLa cells grown for 24 h under cell culture conditions on sterile glass cover slips were transfected for 18 h (Figure 3A) or 32 h (Figure 4) with a SESN2‐V5 expression plasmid as described above, and fixed for 5 min with ice‐cold methanol. After washing with PBS, slides were incubated for 2 h at room temperature with either a 1:200 dilution of a monoclonal anti‐SESN2 antibody (SantaCruz, Heidelberg, Germany) or a 1:500 dilution of a monoclonal anti‐V5 antibody (AbD Serotech, Martinsried, Germany). A Cy3‐conjugated secondary anti‐mouse antibody (Dianova, Hamburg, Germany) was used for the detection of primary antibodies. Slides were embedded in mounting medium (Vectashield mounting medium with DAPI, Axxora, Lörrach, Germany) and observed and microphotographed with a Zeiss Axiophot fluorescence microscope (Zeiss, Jena, Germany).
Figure 3.

SESN2 overexpression causes mTOR inhibition. A) HeLa cells were transfected with a SESN2‐expression plasmid (pcDNA3.1‐SESN2‐V5) and analyzed after 18 h by immunofluorescence for the expression of SESN2 or its V5 tag (A), and by immunoblots for the time‐dependent expression of SESN2, V5, phosphorylated ribosomal protein S6, phosphorylated hsp27, and cleavage of PARP (B). Phosphorylated ribosomal protein S6 was analyzed by a combination antibody (PathScan® Multiplex Western Cocktail III, Cell Signal), simultaneously detecting phosphorylated ribosomal protein S6 (p‐S6) and phosphorylated heat shock protein 27 (p‐hsp27).
Figure 4.
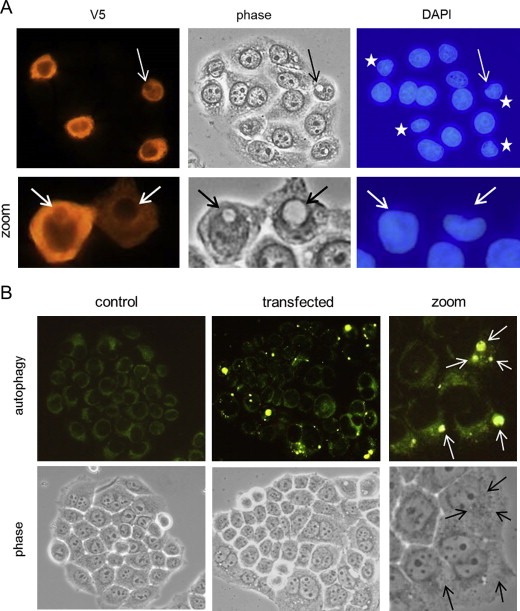
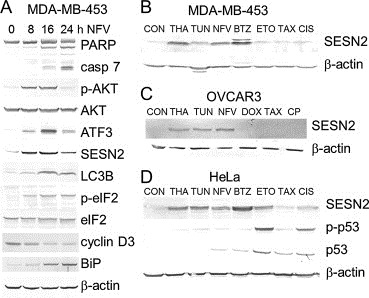
SESN2 overexpression induces macroautophagy. A) HeLa cells were transfected with the pcDNA3.1‐SESN2‐V5 expression plasmid as in Figure 3 and analyzed after a prolonged incubation of 32 h by immunofluorescence for the expression of SESN2‐V5 (V5 tag antibody) in combination with DAPI‐mediated DNA staining (VECTASHIELD Mounting Medium with DAPI, Axxora, Lörrach, Germany). Asterisks indicate SESN2‐transfected cells with an altered nuclear morphology, arrows indicate macroautophagic vacuoles. B) HeLa cells, either mock‐transfected with empty pcDNA3.1 vector (control), or transfected with the pcDNA3.1‐SESN2‐V5 expression plasmid for 32 h, were stained for 1 h as viable cells with an autophagy detection marker (Cyto‐ID™ autophagy detection kit, Enzo Life Sciences, Lörrach, Germany) and visualized as viable cells under a fluorescence microscope (40x lens; zoom: further digital magnification). Arrows indicate macroautophagic vesicles that were not detectable by phase contrast microscopy.
3. Results
3.1. ER stress causes SESN2 induction
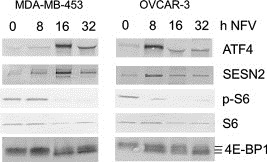
The MDA‐MB‐453 breast cancer cell line, previously shown to be highly responsive to nelfinavir (Brüning et al., 2010b), was used to study the effect of nelfinavir on cell cycle regulation, autophagy, and apoptosis. A time‐dependent immunoblot analysis of proteins induced and modified in MDA‐MB‐453 cells showed a biphasic reaction to nelfinavir treatment (Figure 1A). Although prolonged nelfinavir treatment resulted in the expression of indicators of apoptosis, caspase and PARP cleavage, MDA‐MB‐453 cells first and primarily responded to nelfinavir with the induction of cell survival mechanisms, including Akt phosphorylation, autophagy (LC3B expression), and ER stress (ATF3 expression). Notably, a marked induction of the endogenous mTOR inhibitor SESN2 occurred (Figure 1A), which was apparently time‐dependent and similar to the induction of ATF4 target genes ATF3 and LC3B (Figure 1A). To test further whether the increase in SESN2 expression was a specific reaction to nelfinavir or a general response to ER stress, MDA‐MB‐453 cells were treated with various known inducers of the ER stress (thapsigargin, tunicamycin, and bortezomib) and compared to standard chemotherapeutics (etoposide, taxol, and cisplatin). Figure 1B shows that all ER stress‐related agents caused SESN2 induction in MDA‐MB‐453 cells, whereas etoposide, taxol, and cisplatin did not induce SESN2. Similar observations could be made in OVCAR3 ovarian cancer cells treated with ER stress‐inducing agents and standard ovarian cancer chemotherapeutics carboplatin, taxol, and doxorubicin (Figure 1C). All ER stress‐inducing agents caused elevated SESN2 expression, whereas carboplatin, taxol, and doxorubicin, although used at cytotoxic concentrations, proved to be ineffective in inducing SESN2 expression. SESN2 has previously been shown to be induced by genotoxic agents in a p53‐dependent manner (Budanov and Karin, 2008). Since MDA‐MB‐453 and OVCAR3 cells do not express functional p53, we used HeLa cells expressing low level of wild‐type p53 to compare the induction of SESN2 by ER stress‐inducing agents and genotoxic drugs. In fact, SESN2 expression in HeLa cells was found to be upregulated by both ER stress‐ and genotoxic stress‐inducing agents through p53‐dependent and p53‐independent mechanisms (Figure 1D).
Figure 1.
Upregulation of SESN2 by the endoplasmic reticulum stress reaction. A) MDA‐MB‐453 breast cancer cells were treated with 15 μg/mL nelfinavir (NFV) for the indicated time periods, and cell extracts were subjected to Western blot analysis. B) MDA‐MB‐453 cells were treated with 100 nM thapsigargin (THA), 1 μg/mL tunicamycin (TUN), 15 μg/mL nelfinavir (NFV), 15 ng/mL bortezomib (BTZ), 25 μg/mL etoposide (ETO), 50 ng/mL taxol (TAX), and 1.5 μg/mL cisplatin (CIS) for 16 h and investigated by Western blot analysis. C) OVCAR3 cells were treated with 50 nM thapsigargin (THA), 1 μg/mL tunicamycin (TUN), 15 μg/mL nelfinavir (NFV), 60 ng/mL doxorubicin (DOX), 100 ng/mL taxol (TAX), and 100 μg/mL carboplatin (CP) for 16 h and analyzed as above. D) HeLa cells were treated and analyzed as in (b).
3.2. SESN2 is regulated by the transcription factor ATF4
The apparent time‐dependent relation between SESN2 protein expression and the expression of ER stress marker ATF3 indicates transcriptional regulation of SESN2 by downstream targets of the ER stress pathway. In fact, RT‐PCR analysis of thapsigargin‐treated HeLa cells revealed a close time‐dependent association between ER stress‐specific XPB1 splicing, transcriptional induction of CHOP, and transcriptional regulation of SESN2 (Figure 2A). Since ATF3 and CHOP are transcriptional regulators but also represent typical target genes of the transcription factor ATF4, we generated expression plasmids of ATF3, CHOP, and ATF4 to test whether SESN2 could act as a downstream target of ATF3, CHOP, or ATF4. In HeLa cells transiently transfected with plasmids for these transcription factors, a marked induction of SESN2 could be observed in ATF4‐overexpressing cells (Figure 2B), indicating ATF4 as a major upstream regulator of SESN2.
Figure 2.

Transcriptional regulation of SESN2 by ER stress and ATF4. A) HeLa cervical cancer cells were treated with ER stress‐inducing drug thapsigargin (THA, 100 nM) for the indicated periods and analyzed by RT‐PCR for the expression of SESN2 and the expression and splicing of ER stress‐regulated transcription factors. B) HeLa cells were transfected with expression plasmids for ATF4 (pcDNA3.1‐ATF4‐V5), ATF3 (pcDNA3.1‐ATF3‐V5), and CHOP (pcDNA3.1‐CHOP‐V5), and analyzed for the expression of SESN2 by RT‐PCR analysis. Since ATF4 protein expression is mainly regulated at the posttranscriptional level and transfected ATF4 mRNA cannot be distinguished from endogenous mRNA, a combination PCR of CMV promoter‐specific primers and ATF4 reverse primers was used to prove for high transfection efficiency.
To confirm that SESN2 is responsible for mTOR inhibition in HeLa cells, we also generated a SESN2 expression plasmid that was transiently transfected into HeLa cells (Figure 3A). Overexpression of SESN2 caused pronounced dephosphorylation of the major mTOR downstream target ribosomal protein S6 (Figure 3B), confirming the mTOR inhibiting activity of SESN2 in HeLa cells. Notably, prolonged SESN2 overexpression led in part to apoptotic cell death, as indicated by PARP cleavage (Figure 3B). Short term transfection of SESN2 into HeLa cells apparently caused no marked morphological signs of autophagy (e.g., macroautophagosomes) or apoptosis (e.g., membrane blebbing, cell detachment) when viewed by phase contrast microscopy (Figure 3A, 18 h incubation period). However, prolonged overexpression of SESN2 in HeLa cells (Figure 4A, 36 h incubation period) eventually led to the formation of large macroautophagic vacuoles within cells that expressed high levels of SESN2 (Figure 4A, arrows). These large, often singular and paranuclear vacuoles appeared highly similar to those previously observed in nelfinavir‐treated HeLa cells (Brüning, 2011). Simultaneous DNA staining with DAPI revealed that the nuclear structure, besides being dented by the vacuoles, remained largely intact without apparent signs of chromatin condensation (Figure 4A). Notably, several SESN2‐overexpressing HeLa cells revealed distorted or slightly smaller nuclei (Figure 4A, asterisks) without visible autophagosomes, indicating that not all autophagic vacuoles formed in SESN2‐overexpressing cells may have become visible by phase contrast microscopy. We therefore performed a specific fluorescence dye‐based labeling for autophagic vesicles (Figure 4B). Although this vital staining procedure did not allow simultaneous immunofluorescence labeling for SESN2, which is technically limited to fixed cell samples, the overall number and extent of macroautophagic vesicles markedly increased in batches of HeLa cells transfected with SESN2 (Figure 4B). A higher magnification of SESN2‐transfected HeLa cells also revealed that several fluorescent autophagic vesicles (arrows) could not be detected by phase contrast microscopy (Figure 4B), confirming an underestimation of autophagy when visualized solely by phase contrast microscopy.
3.3. Nelfinavir causes mTOR inhibition
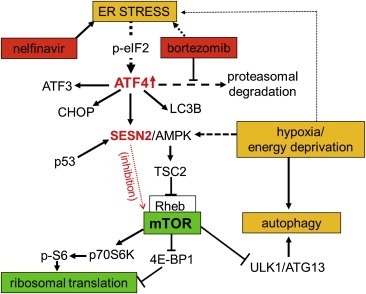
Although several studies have shown ER stress and autophagy induction by nelfinavir in cancer cells (Pyrko et al., 2007; Gills et al., 2008; Brüning et al., 2009b), no investigations on the effect of nelfinavir on mTOR activity have yet been demonstrated. Therefore, we further investigated the effect of nelfinavir on mTOR activity in MDA‐MB‐453 and OVCAR3 cells. Figure 5 shows a close association between nelfinavir‐induced ATF4 upregulation, SESN2 expression, and mTOR inhibition in MDA‐MB‐453 (A) and OVCAR3 (B) cells. The time‐dependent analysis also confirms the phasic reaction mechanism of the ER stress reaction in nelfinavir‐treated cancer cells (Figure 1A, Figure 5A, B).
Figure 5.
Nelfinavir causes mTOR inhibition in cancer cells. MDA‐MB‐453 and OVCAR3 cells were incubated with 15 μg/mL nelfinavir for the indicated periods and subjected to Western blot analysis. mTOR inhibition was shown by reduced ribosomal protein S6 phosphorylation and hypophosphorylation (faster migration) of 4E‐BP1.
4. Discussion
Autophagy is a highly conserved cell protective mechanism that promotes cell survival in cases of nutrient or energy deprivation (Ding et al., 2007; Brech et al., 2009; Benbrook and Long, 2012). Autophagy is also involved in the degradation of possible proteotoxic protein aggregates or ER compartments after excessive ER stress (Ding et al., 2007; Brech et al., 2009; Benbrook and Long, 2012). The importance of autophagy in cellular homeostasis and survival is reflected in its tight regulation by the mTOR complex (Laplante and Sabatini, 2012; Cornu et al., 2013), whose activity itself is regulated by a variety of survival and stress‐regulated factors, including growth factors, cellular energy levels, and amino acid availability (Laplante and Sabatini, 2012; Cornu et al., 2013). Activity of mTOR is primarily maintained by an active PI3K/Akt kinase pathway, while adenosine monophosphate‐responsive protein kinase (AMPK) can act as a major inhibitor of mTOR activity (Laplante and Sabatini, 2012; Cornu et al., 2013). SESN2 has been shown to interact with and stimulate AMPK to mediate phosphorylation of tuberous sclerosis 2 (TSC2), an upstream mTOR inhibitor (Budanov and Karin, 2008; Sanli et al., 2012). Phosphorylation of TSC2 stimulates its GTPase activity, converting mTOR‐activating ras‐homolog enriched in brain (Rheb) into its inactive GDP‐bound form (Laplante and Sabatini, 2012; Cornu et al., 2013). Thus, upregulation of SESN2 by endoplasmic stress leads to direct inhibition of the main regulatory subunits of the mTOR complex (Figure 6). Such an mTOR‐inhibitory and autophagy‐promoting mechanism has previously been described for p53‐mediated SESN2 expression after induction of genotoxic stress (Budanov and Karin, 2008; Maiuri et al., 2009). However, most cancer cells lack functional p53, indicating induction of ATF4‐mediated SESN2 expression as an essential factor linking ER stress or proteasome inhibition to mTOR inhibition and autophagy in cancer cells.
Figure 6.
Interaction of ER stress, proteasome inhibition, ATF4 expression, SESN2 expression, and mTOR activity. This schematic represents an integrated view of ATF4‐regulated SESN2 expression in the context of current knowledge about the relations between ER stress, proteasome inhibition, mTOR activity, and autophagy. Both nelfinavir and bortezomib lead to mTOR inhibition through elevating ATF4 and SESN2 expression. mTOR itself is a positive regulator of protein biosynthesis and a negative regulator of autophagy.
SESN2 was originally identified and named Hi95, a protein induced by prolonged hypoxia in a p53‐independent manner (Budanov et al., 2002). Hypoxia is well known to cause ER stress and autophagy in cancer cells (Rzymski et al., 2009). Serum deprivation, a further activator of ER stress and AMPK, has also been shown to induce activation of SESN2 (Zhang et al., 2013). SESN2 has further been described as a protein with redox‐related functions, primarily mediated by its interaction with peroxiredoxin proteins (Budanov, 2011). Interestingly, several ER stress‐inducing agents, including nelfinavir, have been associated with increased oxidative stress (Brüning et al., 2010b; Kraskiewicz and FitzGerald, 2012). Thus, the anti‐oxidant activity of SESN2 may represent an additional cellular protection mechanism against ER stress/oxidative stress‐inducing agents.
Nelfinavir, originally approved as an HIV protease inhibitor, has recently become of interest to cancer scientists because of its anti‐tumor effects observed in vitro and in vivo (Brüning et al., 2010a; Schönthal, 2013). These anti‐tumor effects have been primarily ascribed to its ER stress‐inducing effects, to which cancer cells seem to be particularly vulnerable. The data presented here also indicate that nelfinavir can act as an effective mTOR inhibitor. mTOR inhibitors are being tested in clinical studies as possible chemo‐ and radiosensitizers (Burris, 2013). mTOR inhibition by nelfinavir, currently tested as an anti‐cancer drug in more than 30 clinical studies on humans (www.clincaltrials.gov), may explain its often observed chemo‐ and radiosensitizing effects in vitro and in vivo (Brüning et al., 2010a; Schönthal, 2013).
Induction or stabilization of ATF4 does not only occur as a result of ER stress and proteasome inhibition, but also in amino acid deprivation and hypoxic conditions (Rzymski et al., 2009). Similar to p53, which functions as a key regulator and integrator of several primarily genotoxic cellular stress responses, the transcription factor ATF4 seems to act as a key regulator and coordinator of metabolic stress responses (Rzymski et al., 2009; Singleton and Harris, 2012). Also, similarly to p53, ATF4 seems to affect a wide variety of physiologically different target genes (Singleton and Harris, 2012; Brüning et al., 2012). Given their ability to regulate SESN2 expression, both p53 and ATF4 apparently share a common target gene.
In summary, the data presented here show that ER stress causes upregulation of SESN2, a physiological mTOR inhibitor, linking ER stress to mTOR inhibition and autophagy. Since both nelfinavir and bortezomib are currently being tested in clinical trials of patients with solid cancers, the identification of the mTOR‐inhibitory activities of these drugs may help to understand and explore their growth‐inhibiting and chemosensitizing effects better.
Conflict of interest statement
The authors have no conflicts of interest to declare.
Acknowledgment
This work was supported by the German Cancer Aid (Deutsche Krebshilfe; project 110310).
Brüning Ansgar, Rahmeh Martina, Friese Klaus, (2013), Nelfinavir and bortezomib inhibit mTOR activity via ATF4‐mediated sestrin‐2 regulation, Molecular Oncology, 7, doi: 10.1016/j.molonc.2013.07.010.
References
- Appenzeller-Herzog, C. , Hall, M.N. , 2012. Bidirectional crosstalk between endoplasmic reticulum stress and mTOR signaling. Trends in Cell Biology. 22, 274–282. [DOI] [PubMed] [Google Scholar]
- Bai, X. , Jiang, Y. , 2010. Key factors in mTOR regulation. Cellular and Molecular Life Sciences. 67, 239–253. [DOI] [PMC free article] [PubMed] [Google Scholar]
- Benbrook, D.M. , Long, A. , 2012. Integration of autophagy, proteasomal degradation, unfolded protein response and apoptosis. Experimental Oncology. 34, 286–297. [PubMed] [Google Scholar]
- Brech, A. , Ahlquist, T. , Lothe, R.A. , Stenmark, H. , 2009. Autophagy in tumour suppression and promotion. Molecular Oncology. 3, 366–375. [DOI] [PMC free article] [PubMed] [Google Scholar]
- Brüning, A. , Burger, P. , Vogel, M. , Rahmeh, M. , Friese, K. , Lenhard, M. , Burges, A. , 2009. Bortezomib treatment of ovarian cancer cells mediates endoplasmic reticulum stress, cell cycle arrest, and apoptosis. Investigational New Drugs. 27, 543–551. [DOI] [PubMed] [Google Scholar]
- Brüning, A. , Burger, P. , Vogel, M. , Rahmeh, M. , Gingelmaiers, A. , Friese, K. , Lenhard, M. , Burges, A. , 2009. Nelfinavir induces the unfolded protein response in ovarian cancer cells, resulting in ER vacuolization, cell cycle retardation and apoptosis. Cancer Biology and Therapy. 8, 226–232. [DOI] [PubMed] [Google Scholar]
- Brüning, A. , Gingelmaier, A. , Friese, K. , Mylonas, I. , 2010. New prospects for nelfinavir in non-HIV-related diseases. Current Molecular Pharmacology. 3, 91–97. [DOI] [PubMed] [Google Scholar]
- Brüning, A. , Friese, K. , Burges, A. , Mylonas, I. , 2010. Tamoxifen enhances the cytotoxic effects of nelfinavir in breast cancer cells. Breast Cancer Research. 12, (4) R45 [DOI] [PMC free article] [PubMed] [Google Scholar]
- Brüning, A. , 2011. Analysis of nelfinavir-induced endoplasmic reticulum stress. Methods in Enzymology. 491, 127–142. [DOI] [PubMed] [Google Scholar]
- Brüning, A. , Matsingou, C. , Brem, G.J. , Rahmeh, M. , Mylonas, I. , 2012. Inhibin beta E is upregulated by drug-induced endoplasmic reticulum stress as a transcriptional target gene of ATF4. Toxicology and Applied Pharmacology. 264, 300–304. [DOI] [PubMed] [Google Scholar]
- Budanov, A.V. , Shoshani, T. , Faerman, A. , Zelin, E. , Kamer, I. , Kalinski, H. , Gorodin, S. , Fishman, A. , Chajut, A. , Einat, P. , Skaliter, R. , Gudkov, A.V. , Chumakov, P.M. , Feinstein, E. , 2002. Identification of a novel stress-responsive gene Hi95 involved in regulation of cell viability. Oncogene. 21, 6017–6031. [DOI] [PubMed] [Google Scholar]
- Budanov, A.V. , Karin, M. , 2008. p53 target genes sestrin1 and sestrin2 connect genotoxic stress and mTOR signaling. Cell. 134, 451–460. [DOI] [PMC free article] [PubMed] [Google Scholar]
- Budanov, A.V. , 2011. Stress-responsive sestrins link p53 with redox regulation and mammalian target of rapamycin signaling. Antioxidants and Redox Signaling. 15, 1679–1690. [DOI] [PMC free article] [PubMed] [Google Scholar]
- Burris, H.A. , 2013. Overcoming acquired resistance to anticancer therapy: focus on the PI3K/AKT/mTOR pathway. Cancer Chemotherapy and Pharmacology. 71, 829–842. [DOI] [PubMed] [Google Scholar]
- Cao, S.S. , Kaufman, R.J. , 2012. Unfolded protein response. Current Biology. 22, R622–R626. [DOI] [PubMed] [Google Scholar]
- Cornu, M. , Albert, V. , Hall, M.N. , 2013. mTOR in aging, metabolism, and cancer. Current Opinion in Genetics and Development. 23, 53–62. [DOI] [PubMed] [Google Scholar]
- Dara, L. , Ji, C. , Kaplowitz, N. , 2011. The contribution of endoplasmic reticulum stress to liver diseases. Hepatology. 53, 1752–1763. [DOI] [PMC free article] [PubMed] [Google Scholar]
- Ding, W.X. , Ni, H.M. , Gao, W. , Yoshimori, T. , Stolz, D.B. , Ron, D. , Yin, X.M. , 2007. Linking of autophagy to ubiquitin-proteasome system is important for the regulation of endoplasmic reticulum stress and cell viability. American Journal of Pathology. 171, 513–524. [DOI] [PMC free article] [PubMed] [Google Scholar]
- Fimia, G.M. , Piacentini, M. , 2010. Regulation of autophagy in mammals and its interplay with apoptosis. Cellular and Molecular Life Sciences. 67, 1581–1588. [DOI] [PMC free article] [PubMed] [Google Scholar]
- Gills, J.J. , Lopiccolo, J. , Dennis, P.A. , 2008. Nelfinavir, a new anti-cancer drug with pleiotropic effects and many paths to autophagy. Autophagy. 4, 107–109. [DOI] [PubMed] [Google Scholar]
- Kraskiewicz, H. , FitzGerald, U. , 2012. InterfERing with endoplasmic reticulum stress. Trends in Pharmacological Sciences. 33, 53–63. [DOI] [PubMed] [Google Scholar]
- Laplante, M. , Sabatini, D.M. , 2012. mTOR Signaling. Cold Spring Harbor Perspectives in Biology. 4, [DOI] [PMC free article] [PubMed] [Google Scholar]
- Maiuri, M.C. , Malik, S.A. , Morselli, E. , Kepp, O. , Criollo, A. , Mouchel, P.L. , Carnuccio, R. , Kroemer, G. , 2009. Stimulation of autophagy by the p53 target gene sestrin2. Cell Cycle. 8, 1571–1576. [DOI] [PubMed] [Google Scholar]
- Milani, M. , Rzymski, T. , Mellor, H.R. , Pike, L. , Bottini, A. , Generali, D. , Harris, A.L. , 2009. The role of ATF4 stabilization and autophagy in resistance of breast cancer cells treated with Bortezomib. Cancer Research. 69, 4415–4423. [DOI] [PubMed] [Google Scholar]
- Pyrko, P. , Kardosh, A. , Wang, W. , Xiong, W. , Schönthal, A.H. , Chen, T.C. , 2007. HIV-1 protease inhibitors nelfinavir and atazanavir induce malignant glioma death by triggering endoplasmic reticulum stress. Cancer Research. 67, 10920–10928. [DOI] [PubMed] [Google Scholar]
- Rzymski, T. , Milani, M. , Singleton, D.C. , Harris, A.L. , 2009. Role of ATF4 in regulation of autophagy and resistance to drugs and hypoxia. Cell Cycle. 8, 3838–3847. [DOI] [PubMed] [Google Scholar]
- Sanli, T. , Linher-Melville, K. , Tsakiridis, T. , Singh, G. , 2012. Sestrin2 modulates AMPK subunit expression and its response to ionizing radiation in breast cancer cells. PLoS One. 7, e32035 [DOI] [PMC free article] [PubMed] [Google Scholar]
- Schönthal, A.H. , 2013. Pharmacological targeting of endoplasmic reticulum stress signaling in cancer. Biochemical Pharmacology. 85, 653–666. [DOI] [PubMed] [Google Scholar]
- Singleton, D.C. , Harris, A.L. , 2012. Targeting the ATF4 pathway in cancer therapy. Expert Opinion on Therapeutic Targets. 16, 1189–1202. [DOI] [PubMed] [Google Scholar]
- Suh, D.H. , Kim, M.K. , Kim, H.S. , Chung, H.H. , Song, Y.S. , 2012. Unfolded protein response to autophagy as a promising druggable target for anticancer therapy. Annals of New York Academy of Sciences. 1271, 20–32. [DOI] [PMC free article] [PubMed] [Google Scholar]
- Walter, P. , Ron, D. , 2011. The unfolded protein response: from stress pathway to homeostatic regulation. Science. 334, 1081–1086. [DOI] [PubMed] [Google Scholar]
- Yorimitsu, T. , Nair, U. , Yang, Z. , Klionsky, D.J. , 2006. Endoplasmic reticulum stress triggers autophagy. Journal of Biological Chemistry. 281, 30299–30304. [DOI] [PMC free article] [PubMed] [Google Scholar]
- Zhang, X.Y. , Wu, X.Q. , Deng, R. , Sun, T. , Feng, G.K. , Zhu, X.F. , 2013. Upregulation of sestrin 2 expression via JNK pathway activation contributes to autophagy induction in cancer cells. Cell Signaling. 25, 150–158. [DOI] [PubMed] [Google Scholar]