

Abstract
Germ cell cancers (GCC) are the most frequent malignancy in young Caucasian males. GCC can consist of seminomas (SE) and non‐seminomas (malignant NS: embryonal carcinoma (EC), yolk sac tumor (YS), choriocarcinoma (CH) and teratoma (TE)). Current serum‐markers used for diagnosis and follow‐up (AFP, hCG) are predominantly related to YS and CH and marker positivity can vary during disease. Therefore, stable markers consistently identifying more GCC components, specifically the stem cell components SE and EC, are of interest. Expression of the embryonic stem cell miR‐371‐3 and miR‐302/367 clusters in SE/EC/YS suggest possible application of these micro‐RNAs as GCC tumor‐markers. The TSmiR protocol constitutes a complete, quality‐controlled pipeline for the detection of miRs in serum, based on magnetic bead‐based purification and qPCR quantification. As a proof of principle, TSmiR was applied to five independent serum sample series including 80 GCCs, 47 controls, 11 matched pre/post orchidectomy samples and 12 no‐GCC testicular masses. GCC serum samples showed a consistent, significant (p < 0.0064) increase of miR‐371/372/373/367 levels. Analogous, serum levels returned to baseline after orchidectomy (stage‐I disease). Moreover, there was a trend toward higher miR levels in patients with metastasis. These results imply suitability for diagnosis and follow‐up. TSmiR showed an overall sensitivity of 98%, clearly outperforming the traditional serum markers AFP/hCG (36%/57%, sensitivityAFP = 3%/45%; sensitivityhCG = 62%/66%, SE/NS). TSmiR misclassified one tumor as a control. Serum AFP/hCG and TSmiR combined identified all T samples correctly. In conclusion, TSmiR constitutes a highly sensitive and reproducible serum test for GCC patients, suitable to be prospectively tested for diagnostic and follow‐up purposes.
Keywords: Testicular cancer, Germ cell cancer, Serum markers, AFP, hCG, miRNA
1. Introduction
Human germ cell tumors are a heterogenous group of neoplasms, derived from the germ cell lineage and originating at various stages of development with different cells of origin and pathogenesis (Oosterhuis and Looijenga, 2005). The proposed classification system has been adopted by the World Health Organization (WHO) (Woodward et al., 2004), and specialized pathologists (Reuter, 2005; Ye and Ulbright, 2012). Malignant germ cell tumors, referred to as germ cell cancer (GCC), include seminoma (SE) and nonseminoma (NS) and are predominantly found in adolescents and young adults, although also diagnosed in neonates and infants (Bray et al., 2006). It is the most frequent malignancy in young Caucasian males and incidence is increasing. GCC originate from a pluripotent embryonic germ cell (primordial germ cell/gonocyte) blocked in its maturation. This is referred to as carcinoma in situ (CIS) (Skakkebæk, 1972) or intratubular germ cell neoplasia unclassified (IGCNU) (Woodward et al., 2004) in the context of testicular GCC of adolescents and adults. Their pluripotency is reflected in the capacity to form the germ cell lineage (CIS/IGCNU, SE, de novo germ cells (Honecker et al., 2006)), embryonic stem cell components (embryonal carcinoma, EC) and all differentiation lineages (teratoma (TE), yolk sac tumor (YS) and choriocarcinoma (CH)) as found in adolescents and adults. In neonates and infants, TE and YS are distinguished, in which YS is the malignant component. Pluripotent GCC (including their precursor lesions) exhibited expression of various embryonic pluripotency markers of significant diagnostic value (OCT3/4 (POU5F1) (Looijenga et al., 2003; Rijlaarsdam et al., 2011), NANOG (Hart et al., 2005), SOX2/SOX17 (Looijenga, 2009) and LIN28 (Gillis et al., 2011; Looijenga, 2008)). In addition, CIS/SE/EC/YS components, diagnosed at pediatric and adult age, express a specific set of embryonic stem cell related micro‐RNAs (miRs), including the miR‐371‐372‐373 (miR‐371‐3) and miR302a,b,c,d/367 (miR‐302/367) clusters (Gillis et al., 2007; Novotny et al., 2012; Palmer et al., 2010; Voorhoeve et al., 2006).
Depending on tumor stage and histology, pediatric and adult GCC (SE/EC/YS/CH) are effectively treatable by surgery, possibly followed by either irradiation and/or chemotherapy (Horwich et al., 2006). However, significant long term effects of the systemic treatment protocols have become evident (Haugnes et al., 2010; Van Leeuwen et al., 1993). Therefore, early and accurate diagnosis as well as detailed follow‐up of GCC patients is of crucial relevance for optimal treatment, preventing possible under‐ or overtreatment. In clinical management of GCC, evaluation of a set of serum markers is informative for diagnosis, risk assessment and follow‐up. Alpha Feto‐Protein (AFP) is predominantly informative for YS and sporadically positive in EC and human Chorionic Gonadotrophine (hCG) is predominantly informative for CH with sporadic positivity in SE/EC (Horwich et al., 2006). LDH‐1 has also been reported as a (less informative) serum marker (von Eyben et al., 2000). So far, no consistent markers for the stem cell components SE and EC are available, which limits the use of serum markers for diagnosis/follow‐up in a large proportion of GCC patients.
Recently, three studies reported that a higher expression of members of the embryonic miR clusters miR‐371‐3 and miR‐302/367 can be detected in serum of GCC patients (adult and pediatric) as compared to controls (Belge et al., 2012; Murray and Coleman, 2012; Murray et al., 2011). One study showed a decline to normal levels after surgical removal of stage I GCC (Belge et al., 2012). These findings could be a significant step forwards in clinical management (diagnosis and follow‐up) of GCC patients, especially for the high number of “marker‐negative” cases, i.e., those without elevated AFP or hCG serum levels.
The TSmiR protocol described in the manuscript constitutes a complete, quality‐controlled pipeline for the detection of miRs in serum, based on magnetic bead‐based purification and qPCR quantification. Using five independent sample series we show that TSmiR shows high sensitivity and specificity (GCC vs control). Also, the effect of metastasis/surgical removal of the tumor on miR levels, is investigated. This proof of concept indicates TSmiR as a potential additional tool for diagnosis & follow‐up of GCC.
2. Materials and methods
2.1. Patient and control serum samples
Detailed information on the composition of the various independent sample series (R V/R L/UK/D/no‐GCC) is presented in Figure 1A. Samples in the R V/R L/no‐GCC series were selected to be distributed over different clinical stages and histological subtypes. R V/R L samples were extracted at the Department of Pathology, Erasmus MC, Rotterdam, the Netherlands. Use of tissue samples for scientific reasons was approved by an institutional review board (MEC 02.981 and CCR2041). Samples were used according to the “Code for Proper Secondary Use of Human Tissue in The Netherlands” developed by the Dutch Federation of Medical Scientific Societies (FMWV (Version 2002, update 2011). The UK and D samples were sent frozen to Rotterdam, handled similarly, and used in accordance to regulations set by the local institutional review boards.
Figure 1.
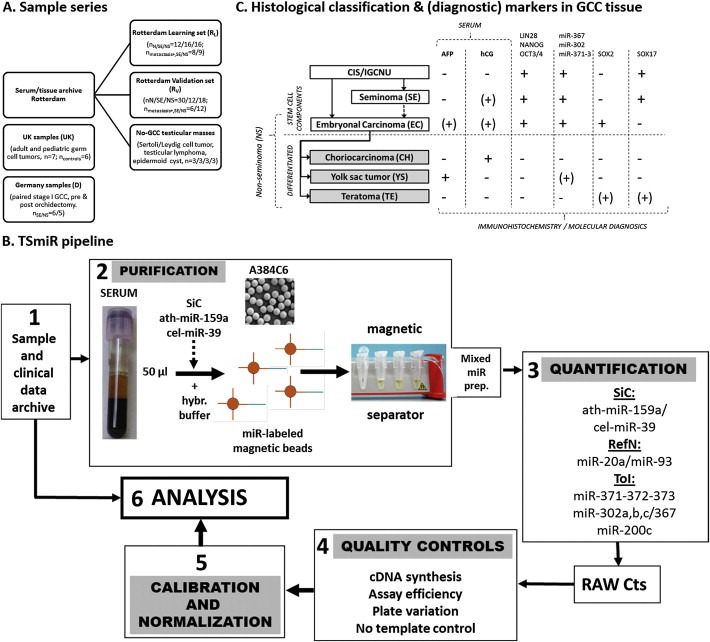
Sample series, histological classification/markers & TSmiR pipeline. (A) Sample series investigated. Five independent series were investigated: the Rotterdam‐Learning (RL) and Validation (RV) sets including GCC cases and controls, a series of serum samples of patients with a testicular tumor other than GCC (no‐GCC) and two previously published series: UK, including GCC samples (pediatric and adult) and controls (Murray and Coleman, 2012; Murray et al., 2011) and Germany (D), composed of pre‐ and post orchidectomy samples (local disease only, stage I) (Belge et al., 2012). (B) Histological classification & overview of immunohistochemical, molecular and serum GCC markers (Gillis et al., 2011; Gillis et al., 2007; Hart et al., 2005; Looijenga, 2009; Looijenga, 2008; Looijenga et al., 2003; Novotny et al., 2012; Palmer et al., 2010; Voorhoeve et al., 2006). GCC originates from a common progenitor, further developing into the stem cell components SE and EC. EC can further differentiate into the various types of differentiated NS. Markers are summarized as described throughout the main text. += consistently positive; −= consistently negative; (+)= sporadic positivity (inconsistent). (C) Complete pipeline of the TSmiR test. See Sections 2.3–2.5 for explanation. SiC = Spike in control; RefN = reference miRs/normalizers, ToI = Target of interest.
2.2. miR analysis of primary GCC and normal testis
Small RNA was prepared from 47 primary, independent GCC and three normal testis samples as described in (Gillis et al., 2007). Expression of 156 miRs was analyzed, quantified and normalized according to (Mestdagh et al., 2009).
2.3. miRNA purification using anti‐miRNA magnetic beads and quantification
For the purification, target‐specific anti‐miRNA magnetic beads were supplied by Applied Biosystems, Foster City, California, USA (Part Number 4473087, TaqMan® miRNA ABC Purification Kit – Human Panel A). This panel consists of superparamagnetic Dynabeads® covalently bound to a unique set of ∼380 anti‐miRNA oligonucleotides including endo‐/exogenous controls, allowing for purification and quantification without pre‐amplification step. Detailed protocol was provided by the supplier (Applied Biosystems/Invitrogen). miRs were purified from 50 μl serum using the Taqman miRNA ABC Purification Kit (Applied Biosystems). 100 μl of lysis buffer was added as provided by the supplier as well as 2 μl of a 1 nM Spike in Controls (SiC: 6 different non‐human control miR) solution and 80 × 106 washed human panel A magnetic beads in 1.5 ml LoBind tubes (Eppendorf). Of note, hsa‐miR‐302d is not represented in the panel A bead set and was therefore not included in the study. After shaking at 12,000 rpm at 30 °C for 40 min, unbound RNA was removed by three wash steps using a magnetic bead separator. Bound miRs were eluted from the beads with 100 μl of elution buffer (Applied Biosystems) at 12,000 rpm at 70 °C for 3 min and stored at −80 °C. cDNA synthesis was performed using the TaqMan Micro‐RNA Reverse Transcription kit (Applied Biosystems, PN: 4,366,597) according to the instructions of the supplier. Quantification of miR levels was performed in duplicate (except for the R L series) using the various TaqMan assays (Applied Biosystems catalog ID: hsa‐miR‐371‐3p (002124); hsa‐miR‐372 (000560); hsa‐miR‐373 (000561); hsa‐miR‐302a (000529); hsa‐miR‐302b (000531); hsa‐miR‐302c (000533); hsa‐miR‐367 (000555); hsa‐miR‐200c (002300); RNU6b (001093); RNU44 (001094); RNU48 (001006); U6 snRNA (001973); ath‐miR‐159a (000338); cel‐miR‐39 (000200); hsa‐miR‐103 (000439); hsa‐miR‐16 (000391); hsa‐miR‐192 (000491); hsa‐miR‐20a (000580); hsa‐miR‐451 (001105); hsa‐miR‐93 (000432), hsa‐let‐7a (000377). Expression levels were measured on the TaqMan 7900HT using standard procedures.
2.4. Quality control and missing data
miR‐200c, implicated in carcinomas (e.g. breast cancer) but not in GCC was included as a control (Shimono et al., 2009). This miR is of additional interest because it is mapped to the short arm of chromosome 12 which is found to be consistently gained in invasive GCC (Van Echten‐Arends et al., 1995). Amplification curves of all targets and samples were inspected individually. Only in the R L set nine samples showed irregular curves with no semi‐linear phase. These were set to UNDETERMINED, and replaced with the top Ct value measured per assay in the R V set + 2 (Ctmax). Ctmax indicates a miR level just outside the known sensitivity of the assay. This way the risk of underestimating the miR‐level by choosing a fixed Ctmax (for example the total number of runs) is reduced. Assay‐specific cDNA was generated separately from TCam‐2 cells (SE cell line (de Jong et al., 2008)) diluted in serum from a healthy donor to be used for inter‐plate calibration (plate controls (PlC)) and positive control (PC). Four tubes (50,000 TCam‐2 cells in 50 μl normal serum) were pooled for lysis, followed by RNA pull down as described above. The resulting RNA was used as positive control (PC) for cDNA synthesis when analyzing patient samples. cDNA was generated separately as well to be used for inter‐plate calibration (plate controls (PlC)). Reference measurements for the PlCs were calculated as the average of triplicate PCRs for each assay. PlC and PC were included in duplicate (per assay) on each plate with patient samples. Inter‐plate variation and variation in assay efficiency was investigated in most samples and found to be constant (below 0.3 Ct) with the exception of the miR‐93 and miR‐302b assays (0.6–0.8 Ct, consistent between plates), without affecting suitability for usage. Non‐human Spike In Controls (SICs) (ath‐miR‐159a and cel‐miR‐39) were included to monitor RNA recovery. One sample (N‐UK) showed 22‐fold less recovery and was discarded. For negative control (No Template Control: NTC) elution buffer was added instead of the bead eluate. Ct values > NTC were treated as UNDETERMINED (R V set, n = 1).
2.5. Calibration & normalization
Stable target recovery using the magnetic bead method was investigated and demonstrated using SiCs in all subgroups with occasionally different distributions between subgroups (p < 0.01, Kruskal–Wallis test), warranting calibration for recovery before determination of the most stable reference miRs for normalization. Some samples in the UK set were corrected for <50 ul input volume. A panel of possible targets for normalization (RefN) was selected based on published data: RNU44, U6 snRNA, hsa‐miR‐16, ‐93, ‐103, ‐192, ‐451 miR‐20a, let‐7a (Zubakov et al., 2010). Based on established algorithms for stability analysis (Normfinder (Vandesompele et al., 2002) and geNorm (Andersen et al., 2004)), miR‐20a and miR‐93 were the most stable combination for normalization in the R L set after calibration, which was validated in the R V set (Figure S3). Normalization was carried out using the mean of these normalizers according to the ΔCt method (Livak and Schmittgen, 2001).
2.6. Statistical analysis & software
Data pre‐processing was performed in Microsoft Excel 2010 & GenEx 5.3.7.332. Comparison of mean miR levels (ΔCt) was performed using a Mann–Whitney U test, two‐sided in GenEx. If not otherwise specified, significant indicates p ≤ 0.000639, yielding a risk of type I error of 5% after correction for multiple testing (Bonferroni). Uncorrected comparisons are indicated separately (p < 0.05 = significant), as putative additional interesting results might be lost because of too stringent selection. Principal Component Analysis (PCA), Kohonen Self Organizing Map (SOM) and Heatmap analysis were performed in GenEx. ROC analysis and SiC stability testing were performed in SPSS 18 & 20. Visualizations were generated using Microsoft Powerpoint and Excel 2010 and Photoshop CS4 & 5.5. Analyses were performed on a 64‐bit Windows 7 system.
3. Results
A quality controlled pipeline for miR purification, recovery and quantification from serum (TSmiR) was developed as discussed extensively in Sections 2.3–2.5 and Figure 1B. To ensure standardized results, the pipeline includes a number of quality control steps and spike in miRs to assess and compensate for differences in assay efficiency, inter‐plate variability and cDNA/qPCR reaction efficiency. Regarding normalization, a panel of nine potential reference miRs was investigated, identifying miR‐93 and miR‐20a as the most stable combination for normalization in both a learning and a validation sample series (R L, R V, Figure 1A).
The miR‐371‐3 and miR‐302/367 clusters are known to be expressed in SE, EC and YS (Figure 1C) (Gillis et al., 2007; Palmer et al., 2010; Voorhoeve et al., 2006). In this study their serum levels were evaluated in five sample series (Figure 1A). First, the strength of the various miRs to distinguish between GCC samples (T) and controls (N) (or the presence/absence of metastasis) was investigated in the Rotterdam learning (R L) series. These results were verified in three independent series (Rotterdam validation (R V, Erasmus MC Rotterdam Pathology), UK (Murray and Coleman, 2012) and D (Belge et al., 2012)). Specificity of the miRs was verified in twelve serum samples from patients with testicular masses other than GCC (no‐GCC). Next, The R L, R v, UK and D series were combined to investigate the performance (sensitivity/specificity) of the most discriminative miRs. Finally, results from cases with and without metastasis and eleven matched stage I pre‐ and post orchidectomy serum samples (D series) were investigated to draw preliminary conclusions regarding the applicability of TSmiR to follow‐up. Additional results, methods and raw data are presented in the supplementary data. By applying TSmiR to these sample series, the potential value in GCC diagnosis and follow‐up of the serum levels of these GCC specific miRs was assessed in a controlled setup.
3.1. Serum miR‐371‐3/367 levels were significantly higher in tumor samples and were strongly correlated
miR‐371‐3/367 showed significant high differences between tumor and control samples, also when stratified for histological subtype. These observations were consistent between the learning and validation sample series. miR‐373 showed higher differences between N and T in the R v as compared to the R L series due to lower baseline levels in N samples and consistently higher levels in both the SE and the NS groups. Although there is no known difference between the samples in these series, this observation does not challenge the hypothesis that T samples exhibit higher miR levels than N samples. Even though miR‐371 and miR‐367 (uncorrected p‐value) showed consistently higher levels in tumor versus normal, the results in the UK series were less consistent possibly due to the low number of samples and the inclusion of pediatric GCCs. miR‐302a and to a lesser extend miR‐302c showed significantly higher levels in many comparisons of T vs N but the fold difference was lower than that of miR‐371‐3/367, limiting their usefulness (Figure 2A, C). As expected miR‐200c showed no increased levels in T vs N. There were no consistent significant differences between SE and NS. miR‐371‐3 and miR‐302abc levels correlated most strongly within their own clusters but miR‐367 correlated most strongly and consistently with the miR‐371‐3 cluster instead of its own miR‐302abc cluster.
Figure 2.
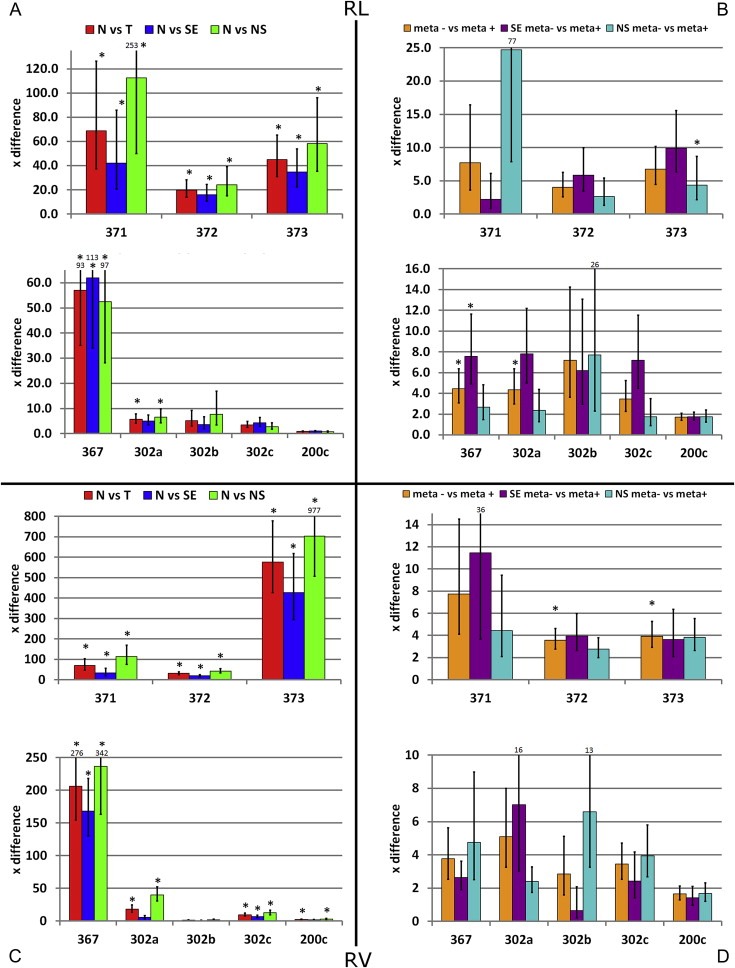
Bars represent times (×) difference between groups, defined as difference between the mean of the ΔCt of group A vs B (fold change = ). High values represent relatively higher levels in group B. Error bars depict standard error of the mean. * = group A and B show significantly different levels based on the dCt values (Bonferroni corrected)). RL/RV series: (A, C) Comparison of N versus histological subtype (SE or malignant NS) and all tumor samples (T = SE + NS); (B, D) Comparison of miR levels in serum samples from patients with localized and metastatic disease (stage I vs pooled stage II, III and IV) for all tumor samples together (meta+/meta−) and SE/NS separately.
3.2. Combined serum miR‐371‐3/367 levels allowed for clear separation of tumor samples and controls
Based on the consistent, significant and large fold differences in serum miR‐371‐3/367 levels between tumor and control samples, only these miRs were selected for further analysis. The power of these miRs to separate tumor from control samples was investigated using a Kohonen Self Organizing Map (SOM), principal component analysis (PCA) and hierarchical clustering/heat map visualization (Figure 3A, B and Figure S4). The SOM was generated using the R L data and then applied to the other datasets. The results of these different analyses were highly consistent. In the R L series a tumor‐only group and a second group containing all control and some tumor samples were distinguishable. Tumor and control samples were even more stringently separated in the R V series. The UK series showed separation of most of the controls from the tumor samples and illustrated a trend in which the pediatric cases showed more similarity to the control samples than the adult GCC serum samples.
Figure 3.
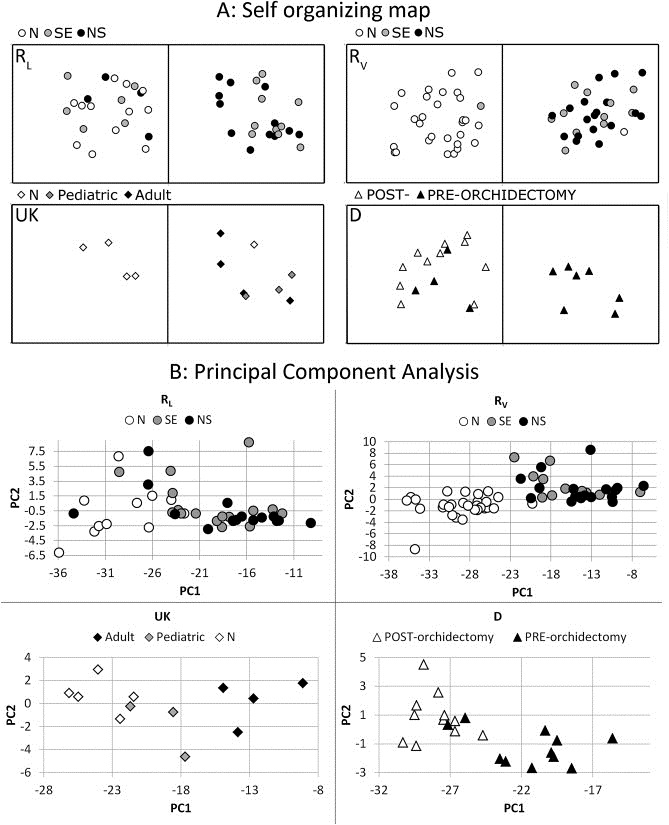
(A) A Kohonen Self‐Organizing‐Map (SOM) was generated using the RL series as training data. The SOM was set to identify two groups (alpha = 0.40, 500 iterations). Only miR‐371‐3/367 data were included because these showed the highest, most significant and most consistent difference between serum samples of patients with a GCC and controls. The generated SOM was then applied to the RV, D and UK series. RL: In the RL series, the right group only contained tumor samples, however the left group contained a mixed set of samples; RV: The same SOM identified a left group with almost only control samples (N) and one SE in the RV series. The right group contained all other tumor samples and one control sample; UK: The same SOM proved to also be able to separate all but one N samples from the T cases in the UK samples; D: All post‐orchidectomy samples from the D set clustered together, together with some pre‐orchidectomy samples. (B) Principal component analyses for all individual datasets. In all cases the first and second PC based on miR371‐3 explained > 99% of the variance. RL: although most of the tumor samples are clearly clustered and separated from the controls, there are some T (n = 7) intermixed with N; RV: All T and N samples cluster separately. One N (testicular torsion) is situated on the edge of the T/N border; UK: all N samples and T samples cluster separately. The pediatric YS are situated between the N samples and the adult GCC clusters; D: all but two pre‐orchidectomy samples cluster together. All post‐orchidectomy samples cluster together. This cluster also included two pre‐orchidectomy samples.
3.3. Serum levels of miR‐371‐3/302abc/367 were not increased in patients with testicular masses other than GCC
A number of no‐GCC testicular masses were investigated. Consistently, none of the miRs showed significant elevation in the serum compared to all pooled controls (N) samples. All no‐GCC samples group together with the unaffected cases in PCA/SOM analysis. This confirmed the specificity of the investigated serum miR markers for GCC in the context of differentially diagnosing testicular masses (Figure S5).
3.4. miR‐371‐3/367 levels in serum showed high sensitivity/specificity in the classification of tumor versus control samples and outperformed current markers (AFP/hCG)
The trade‐off between specificity and sensitivity was assessed for all miRs by receiver operating curve (ROC) analysis using all samples (pooled). As expected, the discriminative power was very high for miR‐371‐3/367 (Figure 4A–E) and much lower for miR‐302abc/200c. Classification/inclusion of the post‐orchidectomy samples as part of the control group did not significantly influence the Area Under the Curve (AUC) and results only differed marginally when the SE or NS subgroups were analyzed separately. Cutoffs of miR levels were set for a sensitivity of 90%, preserving a specificity of 60–91% for individual miRs (Figure 4F). Combining the resulting classification (T/N) for miR‐371‐3/367 lead to a sensitivity of 98% (specificitymiR‐371‐3/367 = 48.3%). Addition of miR‐302abc reduced the discriminative power and was therefore omitted (specificityall miRs = 8.6%).
Figure 4.
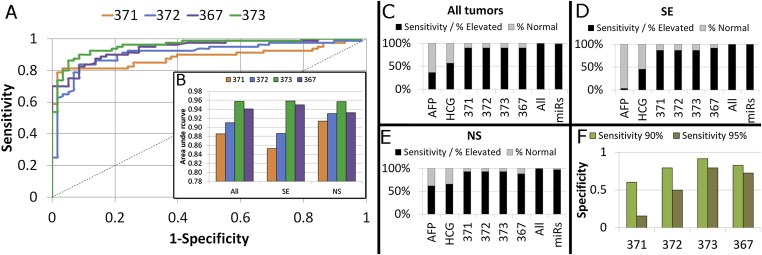
(A) ROC curves were generated for the four most differentiating miRs (371‐3/367). Samples from the RL/RV UK/D series were pooled for analysis; (B) The AUC varied from 0.89 to 0.96 for all ROCs. Separate ROCs generated for only the SE or the NS showed minor differences between the quality of these miRs as marker. (C‐E) Stacked bar diagrams of the sensitivity and false negative rate for the conventional “gold standard” in current clinical use (AFP, hCG) and the four miRs: miR‐371‐3/372/373/367. Sensitivity was calculated when all miRs were assessed in combination, and again in combination with AFP/hCG. Missing values were discarded in the calculation of the frequencies; C) All tumors; D) SE; E) NS; (F) A sensitivity of 90% (green) in the ROC analysis lead to an acceptable remaining specificity ( y‐axis). A sensitivity of 95% (brown) resulted in a big loss of specificity, especially for miR‐371‐3p/372. Cutoffs for dCt values indicating T were identified using the ROC including all pooled samples: miR‐371‐3p ≤ 15.62, miR372 ≤ 11.02, miR‐373 ≤ 10.45, miR‐367 ≤ 12.48.
Sensitivity was compared to markers currently used as golden standard (AFP and hCG, only available for tumor samples). miR‐371‐3/367 levels were more informative than AFP and hCG, particularly for SE (Figure 4C–E). Even when the YS subgroup was investigated specifically, investigation of the miR levels showed higher sensitivity than AFP. Overall, application of the serum markers AFP and hCG alone resulted in ≈50% false‐negative cases. Investigation of only the miR‐levels resulted in one false negative NS serum sample (sensitivity = 98%). Combined interpretation of the established serum markers AFP/hCG and miR‐371‐3/367 levels led to the correct classification of all cases with a malignancy.
3.5. miR levels returned to baseline after surgical removal of a local tumor & there was a trend towards higher GCC‐specific miR levels in metastasized disease
A series of matched sera from patients with local GCC was analyzed before and after orchidectomy to assess the reduction in serum miR levels after surgery. As expected, miR‐371‐3/367 showed significantly higher serum levels in the pre‐orchidectomy samples. miR‐302ac showed a similar trend without correction for multiple testing. SOM, PCA and clustering analysis illustrated that the majority of the pre‐ and post‐orchidectomy cases could be clearly separated based on serum miR‐371‐3/367 levels (Figure 3), analogous to the results of the T vs N comparisons (Section 3.1). After surgery serum miR‐371‐3/367 levels returned to baseline, i.e. they were not significantly different from the levels in all pooled controls (Figure 5A). Consistent with the observations described above, miR‐371‐3/367 showed an overall steeper reduction in serum levels than miR 302abc (Figure 5B).
Figure 5.
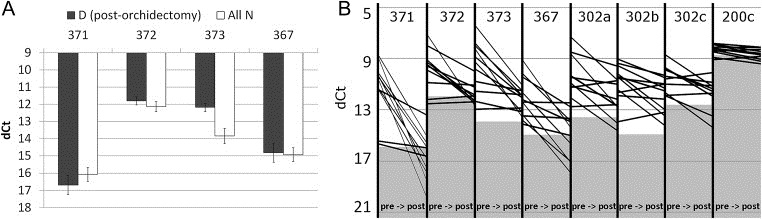
(A) When all N from the RL, RV and UK series are pooled and compared to the post‐orchidectomy D samples, there is no significant difference between the serum‐miR levels in both groups for the most differentiating miRs (371‐3/367). X‐axis: most consistently differentially present miR (between N and T). Y‐axis: dCt; (B) Plot of all pre (left) and post (right) orchidectomy dCt levels per miR per case. Gray area indicates the average baseline level in all pooled N. This does not necessarily constitute a valid cutoff (see Figure 4).
When metastasized disease was compared to local GCC, miR‐371‐3/367/302ac showed overall higher levels in metastasized cases. However, the fold difference in serum miR levels was much lower than in the tumor vs control comparisons (Section 3.1), results were not always consistent between the different sample series and the statistical strength was limited. miR‐372‐3/367/302a remained significant after correction for multiple testing (Figure 2B and D).
These results indicate possible applicability of serum miR‐371‐3/367 levels not only for diagnosis (Sections 3.1–3.4), but also for follow‐up. However, these observations need to be validated and extended in a larger, prospective setup with longer follow‐up period.
4. Discussion
GCC patients require intensive follow‐up after primary diagnosis and treatment (Horwich et al., 2006). For diagnosis and follow‐up, various approaches are currently used, including the established diagnostic/follow‐up serum‐markers AFP and hCG (Figure 1C). AFP is primarily related to YS and hCG to CH although they can be positive in sporadic cases of SE and SE/EC respectively as well. Therefore, a significant number of GCC patients without YS and CH, will be negative for these serum markers. In addition, positivity for either marker can change during disease progression. Because of this, there is need for additional serum markers, particularly ones that are consistently positive in SE and EC. Several possible candidates have been suggested, including demethylated promoter regions of the XIST gene (Kawakami et al., 2004) (sensitivity of 64% in serum of GCC patients, small single series). More recently, a selected number of miRs are reported to be highly expressed in SE, EC and YS (both pediatric and adult patients). They belong to the embryonic stem cell miR‐371‐3 and miR‐302/367 clusters and were validated in multiple independent GCC series (Gillis et al., 2007; Palmer et al., 2010; Voorhoeve et al., 2006).
Levels of these miRs have proven to be detectable in the serum of GCC patients (Belge et al., 2012; Murray and Coleman, 2012; Murray et al., 2011). Although exosomes have been suggested as a miR‐transporters/‐repository, the mechanism behind miR release into serum remains to be elucidated (Chen et al., 2012; Somasundaram and Herlyn, 2012). The protocols applied in earlier studies lacked the relevant quality controls, calibration and normalization steps required for clinical implementation. Although amplification steps were performed, no specific miR purification/recovery step was included, resulting in possible underscoring of miR levels in serum by qPCR. The TSmiR protocol addresses these quality control issues, resulting in a robust and informative pipeline to detect the levels of these miRs in serum of GCC patients and controls (Figure 1B). Specific quality control steps for miR purification and recovery artifacts were implemented and suitable targets for normalization of Ct values in serum identified. Moreover, inter‐plate and inter‐assay variations were evaluated and corrected for. The described pipeline is potentially suitable for clinical serum analysis in the context of other malignancies. miRs identified as candidate markers need to show a specific and consistent high level of expression in serum samples from patients with cancer compared to those from normal, healthy individuals.
The value of GCC specific miR‐detection in serum using the TSmiR pipeline was demonstrated in learning and validation sets of independent serum samples from controls and GCC patients. miR‐371‐3 and miR‐367 were most informative (Figure 2). At time of diagnosis, these specific serum miR levels allowed almost complete separation of control‐ and patient samples (Figure 3). When the miR‐371‐3 and miR‐367 results were combined, only one tumor sample was misclassified as control, independent of the histology of the tumor (no consistent difference between SE and NS) (sensitivity 98%). In contrast, the sensitivity of AFP/hCG was worse (max ≈60%), especially in the SE (max ≈40%) samples (Figure 4). This proof of concept demonstrates the additional value of TSmiR as a “liquid biopsy” in primary GCC diagnosis, indicating superiority over the currently applied AFP/hCG test for the detection of the stem cell components (SE/EC). This is further confirmed by investigating a series of patients with a testicular mass of other origin, showing a pattern similar to the control group (Figure S5). Although the primary aim of this study was to investigate the additional value of quality controlled detection of GCC specific miRs in primary diagnosis of GCC, differences between cases with and without metastasis (Figure 2B and D) and complete normalization of levels after complete resection of a local tumor (Figure 5) suggest an important role for TSmiR in follow‐up as well as diagnosis (prospective setup currently initiated).
5. Conclusions
TSmiR constitutes a pipeline with stringent QC for the detection of miRs in serum, based on magnetic bead‐based purification and qPCR quantification. In five independent GCC‐sample series, TSmiR shows high sensitivity and specificity (GCC/control), especially for GCC stem cell components not consistently identified by current markers. Moreover, a higher miR levels in patients with metastasis were identified as well as normalization of miR levels after surgical removal of local disease. This proof of concept indicates that TSmiR has the potential to be of significant importance in the context of additional diagnostic (“liquid biopsy”) and follow‐up tools for GCC patients, warranting further investigation.
Conflict of interest
The authors have no conflict of interest.
Supporting information
The following are the supplementary data related to this article:
Supplementary data
Supplementary data
Supplementary data
Supplementary data
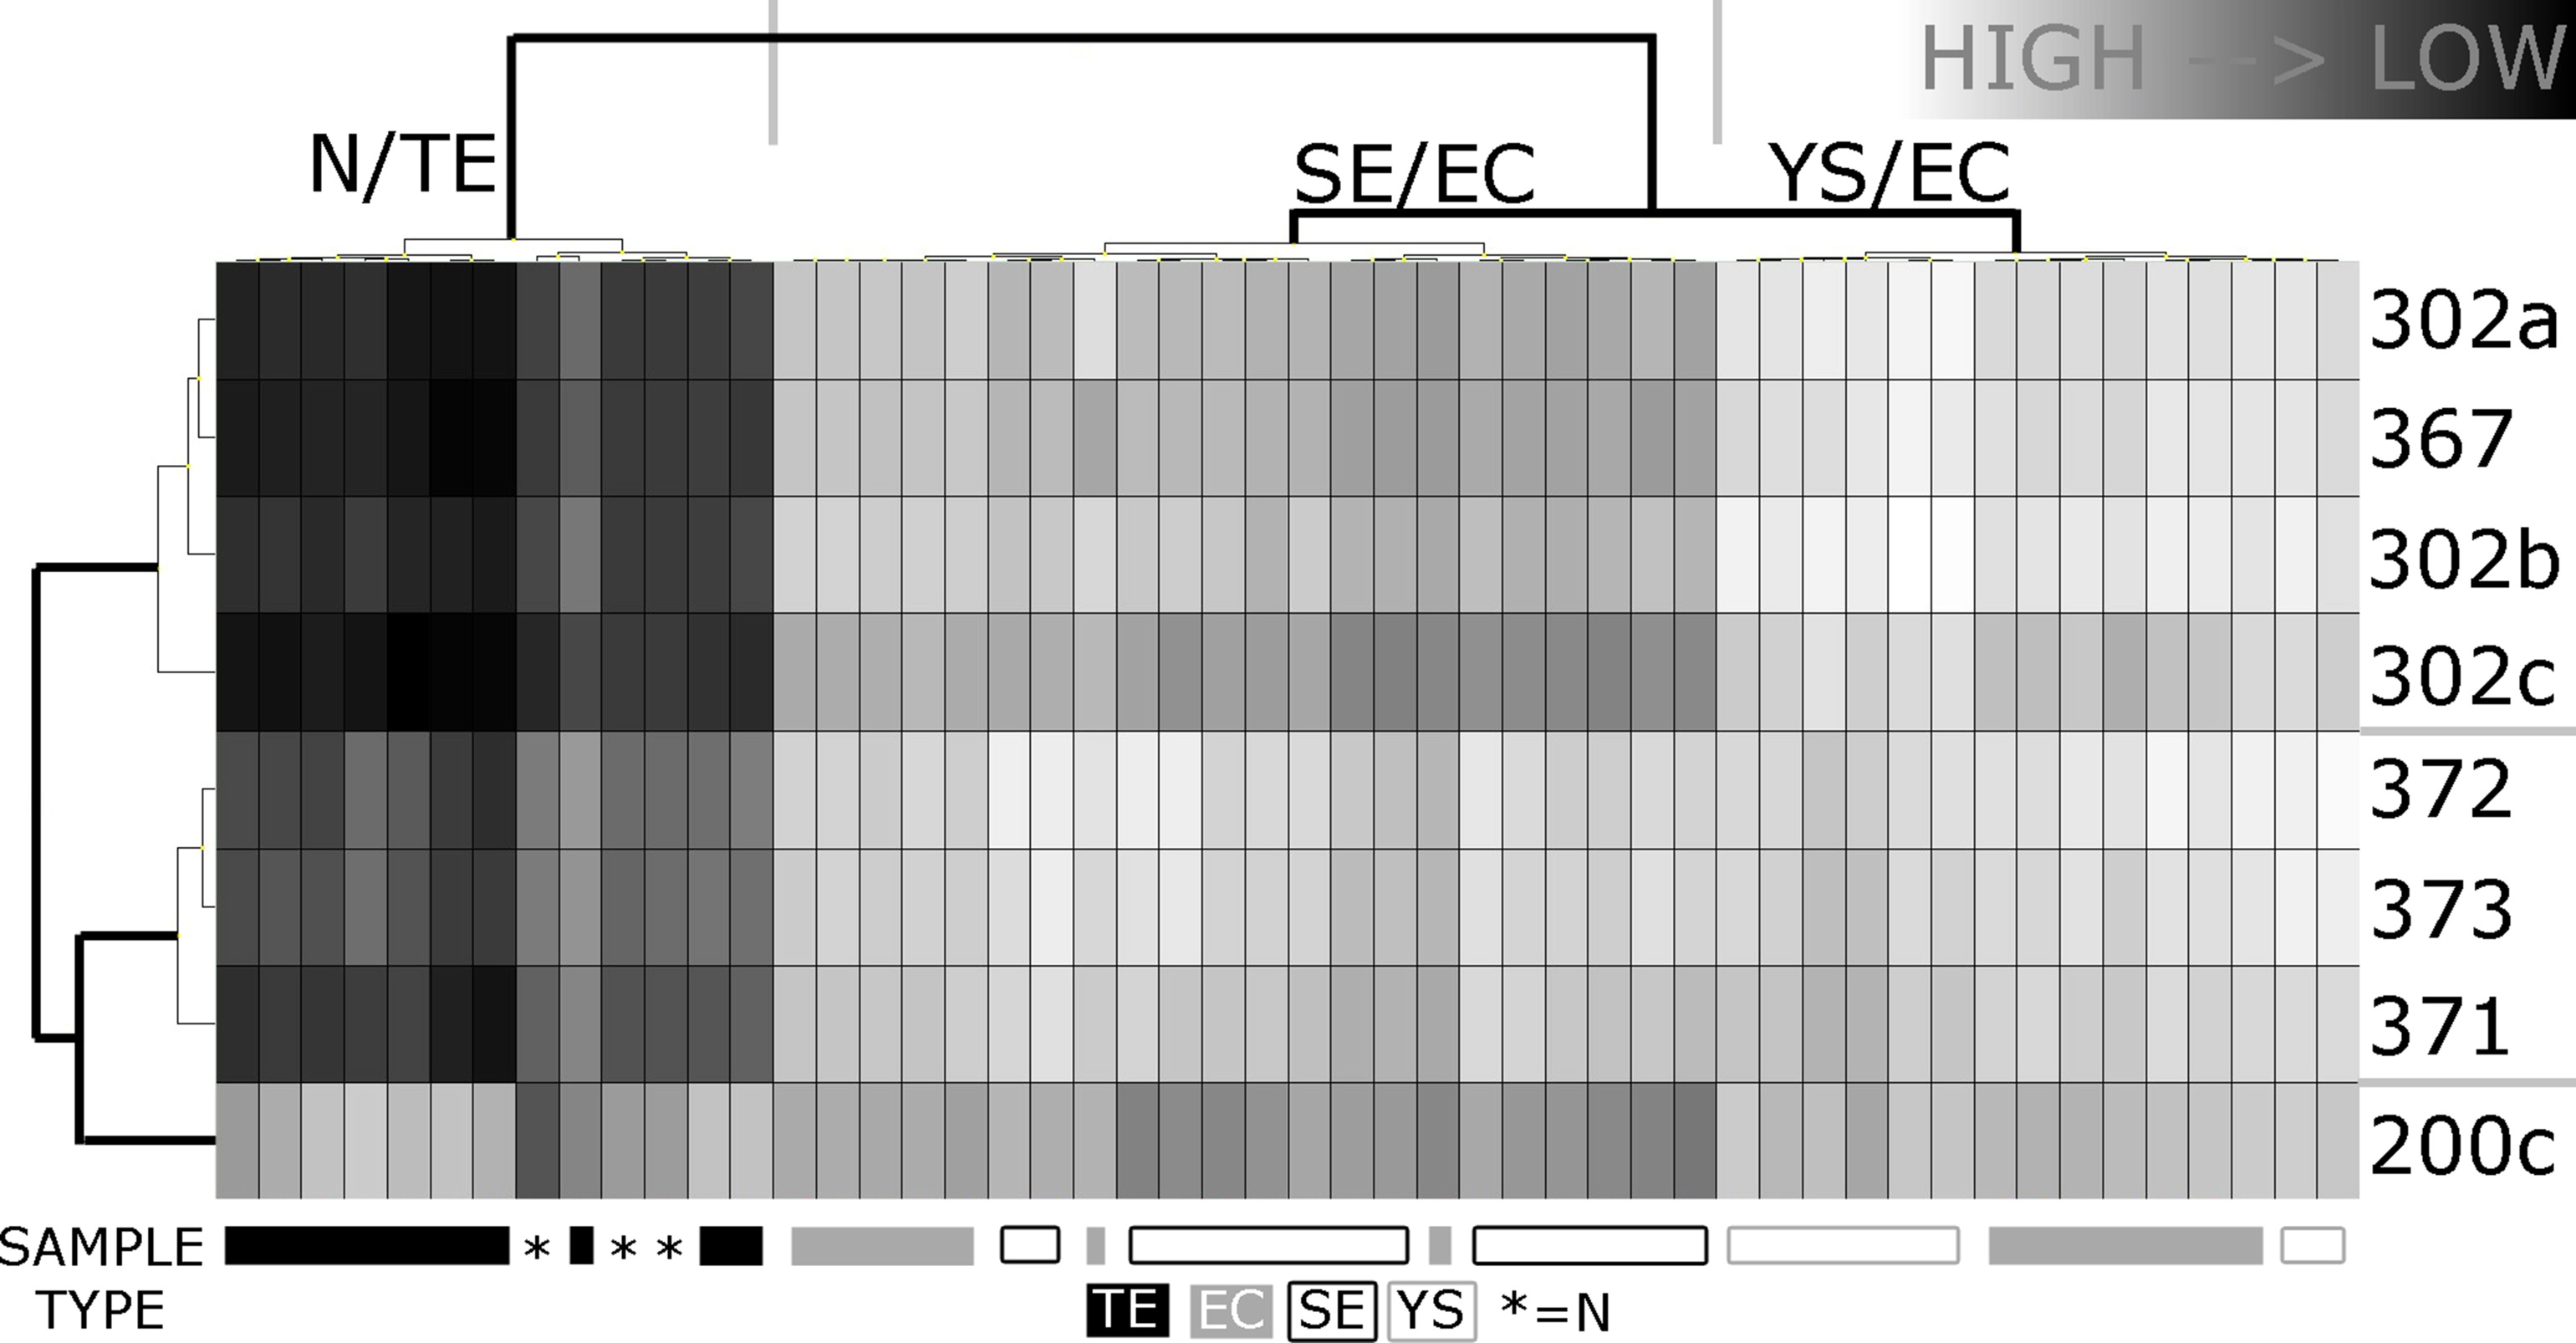
Figure S1Expression analyses of the ToI (miR‐371‐372‐373, miR‐302, miR‐367, 200c) in a series of GCC tumor samples and controls. All miRs (n = 156) on the plate were used to normalize using the mean expression of all genes (threshold Ct 40). Samples included are N (n = 3), TE (n = 10), SE (n = 15), EC (n = 14), YS (yolk sac tumor) (n = 8). Clustering was performed using Ward's algorithm; both dendrograms were formatted according to Euclidean distance. The clustering clearly distinguished between N + TE (differentiated tumor types with expected low level) and SE/EC/YS (known high level). The vertical dendrogram correctly separated the miR clusters (miR‐371‐3 vs miR 302abc/367). miR‐200c clustered separately and did not contribute significantly to the clustering. Mean expression levels were significantly higher in the pooled SE/EC/YS or SE/EC groups when compared to N for all miRs shown, except 200c (as expected).
Figure S2Spike in levels in the various sample series. (A, B) Stable spike in control (SiC) expression was observed in both the RL and the RV datasets. However, the distribution of the values was different between the N/SE/malignant NS groups (p < 0.01, Kruskal–Wallis test). This warranted calibration for recovery efficiency as applied in all cases before analysis; (C) SiC expression in the D and UK series; no significant difference between the groups (UK and GM compared separately) (p > 0.05, Mann Whitney, two‐sided); (D) Spike‐in levels in the no‐GCC samples were highly stable, although statistical testing revealed non‐similar distributions for ath‐miR‐159a based on n = 3 per group (p = 0.04, Kruskal–Wallis test, cel‐miR‐39 p = 0.79). Calibration was applied.
Figure S3Selection of stable normalizers in serum. In both sets: miR‐93 and miR‐20a were top‐scoring with respect to (inter‐/intragroup) stability. Ct values (series RV: average of technical replicates) were normalized against the average expression of these RefNs using GenEx. (A) Normfinder was used to assess intra‐group variability (N/SE/malignant NS). RefNs with variation >1 for one or more groups were discarded; (B) Normfinder was run again on the remaining RefNs using all samples WITHOUT group classification. From this analysis the optimal number of RefNs was assessed; (C) geNorm was run separately using all RefNs to obtain an independent ranking of the stability of the RefNs. geNorm does not take group classification into concern; RL set: A) Normfinder WITH groups: miR‐192/451, U6 snRNA & RNU44 were discarded; B) Normfinder WITHOUT groups: Combining 2 RefNs showed the lowest acc. SD (variation) = miR‐20a/93 (sorted desc.); C) geNorm: 3 RefNs reached the arbitrary threshold of <0.5 (M‐value) = miR‐93/20a/16 (sorted descending); RV set: Normfinder WITH groups: miR‐16, U6 snRNA & RNU44 were discarded; B) Normfinder WITHOUT groups: Combining 4 RefNs showed the lowest acc. SD (variation) = miR‐20a/192/93/103 (sorted desc.); C) geNorm: 0 RefNs reached the arbitrary threshold of <0.5 (M‐value).
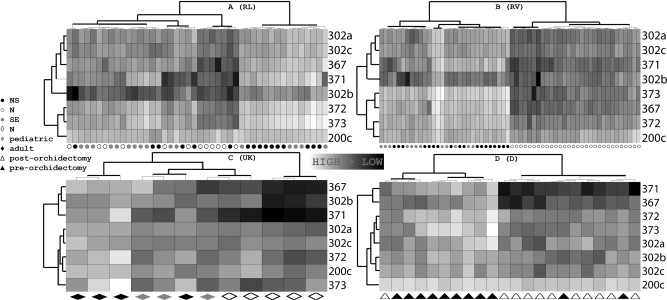
Figure S4Heatmaps of the four main datasets. (A) RL dataset. Clustering showed one group with only tumor samples (SE/NS) and a second group containing all N samples and 11 SE and 6 NS; (B) RV dataset. Clustering completely separated the SE/NS and the N samples; (C) UK dataset. The N and T samples cluster separately, but two controls and one tumor were placed under one branch; D) D dataset. The clustering separated the pre‐ and post‐orchidectomy samples quite well, although one post‐orchidectomy sample was placed in the pre‐orchidectomy branch and two pre‐orchidectomy samples were situated in the post‐orchidectomy branch. Clustering was performed using Ward's algorithm; both dendrograms were formatted according to Euclidean distance. These results matched the patterns observed in the SOMs and PCA.
Figure S5Analysis of no‐GCC samples in comparison to the GCC series. Comparison of control (N), Post‐orchidectomy, Non‐GCC testicular tumor (no‐GCC), Non‐seminoma (NS) and Seminoma (SE) groups. Samples from all series were pooled. (A) Bar graph of dCt values (high values = low expression), indicating similar (miR371‐3p/373/367/302abc/200c, p > 0.05) or even significantly lower expression (miR‐371‐3p, p = 0.002) in the no‐GCC cases as compared to all N (two sided Mann–Whitney test, black vs. green bar). The difference between the top‐miRs (371‐3/367) for the N/post‐orchidectomy/no‐GCC groups as opposed to the NS/SE groups is again much more apparent than in the miR‐302abc/200c cluster; (B) PCA applied to all pooled samples. PCA separates the N/post‐orchidectomy/no‐GCC samples with some SE/NS samples intermixed in the area of the controls, especially on the border of both groups. Only one N sample is clearly clustering with the SE/NS samples; (C) The SOM learned from the RL series was applied to all pooled samples. The right group contains almost exclusively tumor samples: only two N samples cluster with the SE/NS samples. The left group contains all other N samples, all post‐orchidectomy samples and all no‐GCC samples together with some SE/NS samples.
Figure S6Extended ROC analysis. (A) ROC curves were generated for all TOIs using different datasets & subsets of samples (columns). ALL indicates the analysis of the aggregated samples of the RL, RV, UK and D datasets. AUC = Area Under Curve (0–1) of each ROC. AUCs >0.8 are displayed using increasing shades of gray to indicate better discriminative power. The inclusion of the D dataset in ALL does not significantly change the AUCs of any of the miRs investigated (ALL vs. no D column): (B) ROC curves were generated for all TOIs using the aggregated data of all datasets (ALL). Top‐miRs (371‐3p/372/373/367) are indicated in solid lines while the rest are plotted using a dashed pattern; (C, left) A sensitivity of 90% (gray) in the ROC analysis lead to an acceptable remaining specificity (y‐axis). A sensitivity of 95% (black) lead to a big loss of specificity, especially for miR‐371‐3p/372/302ab. Cutoffs for dCt values indicating T were identified using the ROC (sensitivity 90%) including all samples: miR‐371‐3p ≤ 15.6175, miR372 ≤ 11.0175, miR‐373 ≤ 10.45, miR‐367 ≤ 12.4825, miR‐302a≤13.9075, miR‐302b ≤ 19.025, miR‐302c ≤ 13.255, miR‐200c ≤ 9.4175; (C, right) Using the chosen sensitivity of 90%, the array of miRs including miR‐302abc shows a much lower specificity than the array of the top‐miRs; (D) Stacked bar diagrams of the sensitivity and false negative rate for the golden standard (AFP, hCG) and miR‐371‐3p/372/373/367/302abc/200c. Sensitivity was calculated when all combining all or only the top‐miRs with and without the established GCC serum markers AFP and bHCG (coded as elevated (1) or normal (0) as indicated in medical information or based on the cutoffs used in the Erasmus MC Rotterdam (AFP <= 9, hCG <= 1.9). The minimal detected concentration of <2 (hCG, UK) was interpreted as normal. miR expression data was also dichotomized (0 normal, 1 elevated) per miR based on the ROC data, retaining a sensitivity of 90%. Missing values were discarded in the calculation of the frequencies. The observations for the tumor markers are in line with the known hGC positivity of some SE and a higher sensitivity of AFP/hCG in NS (especially YS) as opposed to the SE subgroup. (left top) All tumors; (right top) SE; (left bottom) NS; (right bottom) YS.
Acknowledgments
The authors would like to thank all the patients and clinicians who contributed to the study. Ronak Eini is financially supported by a Grant from the Dutch Cancer Society (NKI 2007‐3081) and Martin Rijlaarsdam by a Translational Grant, Erasmus MC.
Supplementary data 1.
Supplementary data related to this article can be found at http://dx.doi.org/10.1016/j.molonc.2013.08.002.
Gillis Ad J.M., Rijlaarsdam Martin A., Eini Ronak, Dorssers Lambert C.J., Biermann Katharina, Murray Matthew J., Nicholson James C., Coleman Nicholas, Dieckmann Klaus-Peter, Belge Gazanfer, Bullerdiek Jörn, Xu Tom, Bernard Nathalie, Looijenga Leendert H.J., (2013), Targeted serum miRNA (TSmiR) test for diagnosis and follow‐up of (testicular) germ cell cancer patients: A proof of principle, Molecular Oncology, 7, doi: 10.1016/j.molonc.2013.08.002.
References
- Andersen, C.L. , Jensen, J.L. , Orntoft, T.F. , 2004. Normalization of real-time quantitative reverse transcription-PCR data: a model-based variance estimation approach to identify genes suited for normalization, applied to bladder and colon cancer data sets. Cancer Res.. 64, 5245–5250. [DOI] [PubMed] [Google Scholar]
- Belge, G. , Dieckmann, K.P. , Spiekermann, M. , Balks, T. , Bullerdiek, J. , 2012. Serum levels of MicroRNAs miR-371-3: a novel class of serum biomarkers for testicular germ cell tumors?. Eur. Urol.. 61, (5) 1068–1089. 10.1016/j.eururo.2012.02.037 [DOI] [PubMed] [Google Scholar]
- Bray, F. , Richiardi, L. , Ekbom, A. , Pukkala, E. , Cuninkova, M. , Moller, H. , 2006. Trends in testicular cancer incidence and mortality in 22 European countries: continuing increases in incidence and declines in mortality. Int. J. Cancer. 118, 3099–3111. [DOI] [PubMed] [Google Scholar]
- Chen, X. , Liang, H. , Zhang, J. , Zen, K. , Zhang, C.Y. , 2012. Horizontal transfer of microRNAs: molecular mechanisms and clinical applications. Protein Cell. 3, 28–37. [DOI] [PMC free article] [PubMed] [Google Scholar]
- de Jong, J. , Stoop, H. , Gillis, A.J. , Hersmus, R. , van Gurp, R.J. , van de Geijn, G.J. , van Drunen, E. , Beverloo, H.B. , Schneider, D.T. , Sherlock, J.K. , Baeten, J. , Kitazawa, S. , van Zoelen, E.J. , van Roozendaal, K. , Oosterhuis, J.W. , Looijenga, L.H. , 2008. Further characterization of the first seminoma cell line TCam-2. Genes. Chromosomes. Cancer.. 47, 185–196. [DOI] [PubMed] [Google Scholar]
- Gillis, A.J. , Stoop, H. , Biermann, K. , van Gurp, R.J. , Swartzman, E. , Cribbes, S. , Ferlinz, A. , Shannon, M. , Oosterhuis, J.W. , Looijenga, L.H. , 2011. Expression and interdependencies of pluripotency factors LIN28, OCT3/4, NANOG and SOX2 in human testicular germ cells and tumours of the testis. Int. J. Androl.. 34, e160–174. [DOI] [PubMed] [Google Scholar]
- Gillis, A.J. , Stoop, H.J. , Hersmus, R. , Oosterhuis, J.W. , Sun, Y. , Chen, C. , Guenther, S. , Sherlock, J. , Veltman, I. , Baeten, J. , van der Spek, P.J. , de Alarcon, P. , Looijenga, L.H. , 2007. High-throughput microRNAome analysis in human germ cell tumours. J. Pathol.. 213, 319–328. [DOI] [PubMed] [Google Scholar]
- Hart, A.H. , Hartley, L. , Parker, K. , Ibrahim, M. , Looijenga, L.H.J. , Pauchnick, M.C.W.C. , Robb, L. , 2005. The pluripotency homeobox gene NANOG is expressed in human germ cell tumors. Cancer. 104, 2092–2098. [DOI] [PubMed] [Google Scholar]
- Haugnes, H.S. , Wethal, T. , Aass, N. , Dahl, O. , Klepp, O. , Langberg, C.W. , Wilsgaard, T. , Bremnes, R.M. , Fossa, S.D. , 2010. Cardiovascular risk factors and morbidity in long-term survivors of testicular cancer: a 20-year follow-up study. J. Clin. Oncol.. 28, 4649–4657. [DOI] [PubMed] [Google Scholar]
- Honecker, F. , Stoop, H. , Mayer, F. , Bokemeyer, C. , Castrillon, D.H. , Chris Lau, Y.F. , Looijenga, L.H.J. , Oosterhuis, J.W. , 2006. Germ cell lineage differentiation in nonseminomatous germ cell tumors. J. Pathol.. 208, 395–400. [DOI] [PubMed] [Google Scholar]
- Horwich, A. , Shipley, J. , Huddart, R. , 2006. Testicular germ-cell cancer. Lancet. 367, 754–765. [DOI] [PubMed] [Google Scholar]
- Kawakami, T. , Okamoto, K. , Ogawa, O. , Okada, Y. , 2004. XIST unmethylated DNA fragments in male-derived plasma as a tumour marker for testicular cancer. Lancet. 363, 40–42. [DOI] [PubMed] [Google Scholar]
- Livak, K.J. , Schmittgen, T.D. , 2001. Analysis of relative gene expression data using real-time quantitative PCR and the 2(-Delta Delta C(T)) Method. Methods. 25, 402–408. [DOI] [PubMed] [Google Scholar]
- Looijenga, L.H. , 2009. Human testicular (non)seminomatous germ cell tumours: the clinical implications of recent pathobiological insights. J. Pathol.. 218, 146–162. [DOI] [PubMed] [Google Scholar]
- Looijenga, L.H.J. , 2008. Human testicular (non)seminomatous germ cell tumors: patho-biology and optimal diagnostics. J. Pathol.. 218, 146–162. [DOI] [PubMed] [Google Scholar]
- Looijenga, L.H.J. , Stoop, H. , De Leeuw, P.J.C. , De Gouveia Brazao, C.A. , Gillis, A.J.M. , Van Roozendaal, K.E.P. , Van Zoelen, E.J.J. , Weber, R.F.A. , Wolffenbuttel, K.P. , Van Dekken, H. , Honecker, F. , Bokemeyer, C. , Perlman, E.J. , Schneider, D.T. , Kononen, J. , Sauter, G. , Oosterhuis, J.W. , 2003. POU5F1 (OCT3/4) identifies cells with pluripotent potential in human germ cell tumors. Cancer Res.. 63, 2244–2250. [PubMed] [Google Scholar]
- Mestdagh, P. , Van Vlierberghe, P. , De Weer, A. , Muth, D. , Westermann, F. , Speleman, F. , Vandesompele, J. , 2009. A novel and universal method for microRNA RT-qPCR data normalization. Genome Biol.. 10, R64 [DOI] [PMC free article] [PubMed] [Google Scholar]
- Murray, M.J. , Coleman, N. , 2012. Testicular cancer: a new generation of biomarkers for malignant germ cell tumours. Nat Rev Urol. 9, (6) 298–300. 10.1038/nrurol.2012.86 [DOI] [PubMed] [Google Scholar]
- Murray, M.J. , Halsall, D.J. , Hook, C.E. , Williams, D.M. , Nicholson, J.C. , Coleman, N. , 2011. Identification of microRNAs from the miR-371∼373 and miR-302 clusters as potential serum biomarkers of malignant germ cell tumors. Am. J. Clin. Pathol.. 135, 119–125. [DOI] [PubMed] [Google Scholar]
- Novotny, G.W. , Belling, K.C. , Bramsen, J.B. , Nielsen, J.E. , Bork-Jensen, J. , Almstrup, K. , Sonne, S.B. , Kjems, J. , Rajpert-De Meyts, E. , Leffers, H. , 2012. MicroRNA expression profiling of carcinoma in situ cells of the testis. Endocr. Relat. Cancer. 19, 365–379. [DOI] [PubMed] [Google Scholar]
- Oosterhuis, J.W. , Looijenga, L.H. , 2005. Testicular germ-cell tumours in a broader perspective. Nat. Rev. Cancer. 5, 210–222. [DOI] [PubMed] [Google Scholar]
- Palmer, R.D. , Murray, M.J. , Saini, H.K. , van Dongen, S. , Abreu-Goodger, C. , Muralidhar, B. , Pett, M.R. , Thornton, C.M. , Nicholson, J.C. , Enright, A.J. , Coleman, N. , Children's, C. , Leukaemia, G. , 2010. Malignant germ cell tumors display common microRNA profiles resulting in global changes in expression of messenger RNA targets. Cancer Res.. 70, 2911–2923. [DOI] [PMC free article] [PubMed] [Google Scholar]
- Reuter, V.E. , 2005. Origins and molecular biology of testicular germ cell tumors. Mod. Pathol.. 18, (Suppl. 2) S51–S60. [DOI] [PubMed] [Google Scholar]
- Rijlaarsdam, M.A. , van Herk, H.A. , Gillis, A.J. , Stoop, H. , Jenster, G. , Martens, J. , van Leenders, G.J. , Dinjens, W. , Hoogland, A.M. , Timmermans, M. , Looijenga, L.H. , 2011. Specific detection of OCT3/4 isoform A/B/B1 expression in solid (germ cell) tumours and cell lines: confirmation of OCT3/4 specificity for germ cell tumours. Br. J. Cancer. 105, 854–863. [DOI] [PMC free article] [PubMed] [Google Scholar]
- Shimono, Y. , Zabala, M. , Cho, R.W. , Lobo, N. , Dalerba, P. , Qian, D. , Diehn, M. , Liu, H. , Panula, S.P. , Chiao, E. , Dirbas, F.M. , Somlo, G. , Pera, R.A. , Lao, K. , Clarke, M.F. , 2009. Downregulation of miRNA-200c links breast cancer stem cells with normal stem cells. Cell. 138, 592–603. [DOI] [PMC free article] [PubMed] [Google Scholar]
- Skakkebæk, N.E. , 1972. Possible carcinoma-in-situ of the testis. Lancet. 516–517. [DOI] [PubMed] [Google Scholar]
- Somasundaram, R. , Herlyn, M. , 2012. Melanoma exosomes: messengers of metastasis. Nat. Med.. 18, 853–854. [DOI] [PubMed] [Google Scholar]
- Van Echten-Arends, J. , Oosterhuis, J.W. , Looijenga, L.H.J. , Wiersma, J. , Te Meerman, G. , Schraffordt Koops, H. , Sleijfer, D.T. , De Jong, B. , 1995. No recurrent structural abnormalities in germ cell tumors of the adult testis apart from i(12p). Genes Chromosom. Cancer. 14, 133–144. [DOI] [PubMed] [Google Scholar]
- Van Leeuwen, F.E. , Stiggelbout, A.M. , Van den Belt-Dusebout, A.W. , Noyon, R. , Eliel, M.R. , Van Kerkhoff, E.H.M. , Delemarre, J.F.M. , Somers, R. , 1993. Second cancer risk following testicular cancer: a follow-up study of 1,909 patients. J. Clin. Oncol.. 11, 415–424. [DOI] [PubMed] [Google Scholar]
- Vandesompele, J. , De Preter, K. , Pattyn, F. , Poppe, B. , Van Roy, N. , De Paepe, A. , Speleman, F. , 2002. Accurate normalization of real-time quantitative RT-PCR data by geometric averaging of multiple internal control genes. Genome Biol.. 3, RESEARCH0034 [DOI] [PMC free article] [PubMed] [Google Scholar]
- von Eyben, F.E. , Liu, F.J. , Amato, R.J. , Fritsche, H.A. , 2000. Lactate dehydrogenase isoenzyme 1 is the most important LD isoenzyme in patients with testicular germ cell tumor. Acta Oncol.. 39, 509–517. [DOI] [PubMed] [Google Scholar]
- Voorhoeve, P.M. , le Sage, C. , Schrier, M. , Gillis, A.J. , Stoop, H. , Nagel, R. , Liu, Y.P. , van Duijse, J. , Drost, J. , Griekspoor, A. , Zlotorynski, E. , Yabuta, N. , De Vita, G. , Nojima, H. , Looijenga, L.H. , Agami, R. , 2006. A genetic screen implicates miRNA-372 and miRNA-373 as oncogenes in testicular germ cell tumors. Cell. 124, 1169–1181. [DOI] [PubMed] [Google Scholar]
- Woodward, P.J. , Heidenreich, A. , Looijenga, L.H.J. , Oosterhuis, J.W. , McLeod, D.G. , Moller, H. , 2004. Testicular germ cell tumors. In Eble J.N., Sauter G., Epstein J.I., Sesterhann I.A.(Eds.), World Health Organization Classification of Tumours. Pathology and Genetics of the Urinary System and Male Genital Organs. IARC Press; Lyon: 217–278. [Google Scholar]
- Ye, H. , Ulbright, T.M. , 2012. Difficult differential diagnoses in testicular pathology. Arch. Pathol. Lab Med.. 136, 435–446. [DOI] [PubMed] [Google Scholar]
- Zubakov, D. , Boersma, A.W. , Choi, Y. , van Kuijk, P.F. , Wiemer, E.A. , Kayser, M. , 2010. MicroRNA markers for forensic body fluid identification obtained from microarray screening and quantitative RT-PCR confirmation. Int. J. Leg. Med.. 124, 217–226. [DOI] [PMC free article] [PubMed] [Google Scholar]
Associated Data
This section collects any data citations, data availability statements, or supplementary materials included in this article.
Supplementary Materials
The following are the supplementary data related to this article:
Supplementary data
Supplementary data
Supplementary data
Supplementary data
Figure S1Expression analyses of the ToI (miR‐371‐372‐373, miR‐302, miR‐367, 200c) in a series of GCC tumor samples and controls. All miRs (n = 156) on the plate were used to normalize using the mean expression of all genes (threshold Ct 40). Samples included are N (n = 3), TE (n = 10), SE (n = 15), EC (n = 14), YS (yolk sac tumor) (n = 8). Clustering was performed using Ward's algorithm; both dendrograms were formatted according to Euclidean distance. The clustering clearly distinguished between N + TE (differentiated tumor types with expected low level) and SE/EC/YS (known high level). The vertical dendrogram correctly separated the miR clusters (miR‐371‐3 vs miR 302abc/367). miR‐200c clustered separately and did not contribute significantly to the clustering. Mean expression levels were significantly higher in the pooled SE/EC/YS or SE/EC groups when compared to N for all miRs shown, except 200c (as expected).
Figure S2Spike in levels in the various sample series. (A, B) Stable spike in control (SiC) expression was observed in both the RL and the RV datasets. However, the distribution of the values was different between the N/SE/malignant NS groups (p < 0.01, Kruskal–Wallis test). This warranted calibration for recovery efficiency as applied in all cases before analysis; (C) SiC expression in the D and UK series; no significant difference between the groups (UK and GM compared separately) (p > 0.05, Mann Whitney, two‐sided); (D) Spike‐in levels in the no‐GCC samples were highly stable, although statistical testing revealed non‐similar distributions for ath‐miR‐159a based on n = 3 per group (p = 0.04, Kruskal–Wallis test, cel‐miR‐39 p = 0.79). Calibration was applied.
Figure S3Selection of stable normalizers in serum. In both sets: miR‐93 and miR‐20a were top‐scoring with respect to (inter‐/intragroup) stability. Ct values (series RV: average of technical replicates) were normalized against the average expression of these RefNs using GenEx. (A) Normfinder was used to assess intra‐group variability (N/SE/malignant NS). RefNs with variation >1 for one or more groups were discarded; (B) Normfinder was run again on the remaining RefNs using all samples WITHOUT group classification. From this analysis the optimal number of RefNs was assessed; (C) geNorm was run separately using all RefNs to obtain an independent ranking of the stability of the RefNs. geNorm does not take group classification into concern; RL set: A) Normfinder WITH groups: miR‐192/451, U6 snRNA & RNU44 were discarded; B) Normfinder WITHOUT groups: Combining 2 RefNs showed the lowest acc. SD (variation) = miR‐20a/93 (sorted desc.); C) geNorm: 3 RefNs reached the arbitrary threshold of <0.5 (M‐value) = miR‐93/20a/16 (sorted descending); RV set: Normfinder WITH groups: miR‐16, U6 snRNA & RNU44 were discarded; B) Normfinder WITHOUT groups: Combining 4 RefNs showed the lowest acc. SD (variation) = miR‐20a/192/93/103 (sorted desc.); C) geNorm: 0 RefNs reached the arbitrary threshold of <0.5 (M‐value).
Figure S4Heatmaps of the four main datasets. (A) RL dataset. Clustering showed one group with only tumor samples (SE/NS) and a second group containing all N samples and 11 SE and 6 NS; (B) RV dataset. Clustering completely separated the SE/NS and the N samples; (C) UK dataset. The N and T samples cluster separately, but two controls and one tumor were placed under one branch; D) D dataset. The clustering separated the pre‐ and post‐orchidectomy samples quite well, although one post‐orchidectomy sample was placed in the pre‐orchidectomy branch and two pre‐orchidectomy samples were situated in the post‐orchidectomy branch. Clustering was performed using Ward's algorithm; both dendrograms were formatted according to Euclidean distance. These results matched the patterns observed in the SOMs and PCA.
Figure S5Analysis of no‐GCC samples in comparison to the GCC series. Comparison of control (N), Post‐orchidectomy, Non‐GCC testicular tumor (no‐GCC), Non‐seminoma (NS) and Seminoma (SE) groups. Samples from all series were pooled. (A) Bar graph of dCt values (high values = low expression), indicating similar (miR371‐3p/373/367/302abc/200c, p > 0.05) or even significantly lower expression (miR‐371‐3p, p = 0.002) in the no‐GCC cases as compared to all N (two sided Mann–Whitney test, black vs. green bar). The difference between the top‐miRs (371‐3/367) for the N/post‐orchidectomy/no‐GCC groups as opposed to the NS/SE groups is again much more apparent than in the miR‐302abc/200c cluster; (B) PCA applied to all pooled samples. PCA separates the N/post‐orchidectomy/no‐GCC samples with some SE/NS samples intermixed in the area of the controls, especially on the border of both groups. Only one N sample is clearly clustering with the SE/NS samples; (C) The SOM learned from the RL series was applied to all pooled samples. The right group contains almost exclusively tumor samples: only two N samples cluster with the SE/NS samples. The left group contains all other N samples, all post‐orchidectomy samples and all no‐GCC samples together with some SE/NS samples.
Figure S6Extended ROC analysis. (A) ROC curves were generated for all TOIs using different datasets & subsets of samples (columns). ALL indicates the analysis of the aggregated samples of the RL, RV, UK and D datasets. AUC = Area Under Curve (0–1) of each ROC. AUCs >0.8 are displayed using increasing shades of gray to indicate better discriminative power. The inclusion of the D dataset in ALL does not significantly change the AUCs of any of the miRs investigated (ALL vs. no D column): (B) ROC curves were generated for all TOIs using the aggregated data of all datasets (ALL). Top‐miRs (371‐3p/372/373/367) are indicated in solid lines while the rest are plotted using a dashed pattern; (C, left) A sensitivity of 90% (gray) in the ROC analysis lead to an acceptable remaining specificity (y‐axis). A sensitivity of 95% (black) lead to a big loss of specificity, especially for miR‐371‐3p/372/302ab. Cutoffs for dCt values indicating T were identified using the ROC (sensitivity 90%) including all samples: miR‐371‐3p ≤ 15.6175, miR372 ≤ 11.0175, miR‐373 ≤ 10.45, miR‐367 ≤ 12.4825, miR‐302a≤13.9075, miR‐302b ≤ 19.025, miR‐302c ≤ 13.255, miR‐200c ≤ 9.4175; (C, right) Using the chosen sensitivity of 90%, the array of miRs including miR‐302abc shows a much lower specificity than the array of the top‐miRs; (D) Stacked bar diagrams of the sensitivity and false negative rate for the golden standard (AFP, hCG) and miR‐371‐3p/372/373/367/302abc/200c. Sensitivity was calculated when all combining all or only the top‐miRs with and without the established GCC serum markers AFP and bHCG (coded as elevated (1) or normal (0) as indicated in medical information or based on the cutoffs used in the Erasmus MC Rotterdam (AFP <= 9, hCG <= 1.9). The minimal detected concentration of <2 (hCG, UK) was interpreted as normal. miR expression data was also dichotomized (0 normal, 1 elevated) per miR based on the ROC data, retaining a sensitivity of 90%. Missing values were discarded in the calculation of the frequencies. The observations for the tumor markers are in line with the known hGC positivity of some SE and a higher sensitivity of AFP/hCG in NS (especially YS) as opposed to the SE subgroup. (left top) All tumors; (right top) SE; (left bottom) NS; (right bottom) YS.