

Abstract
The backbone of current cytotoxic treatment of metastatic colorectal cancer (mCRC) consists of a fluoropyrimidine together with either oxaliplatin (XELOX/FOLFOX) or irinotecan (XELIRI/FOLFIRI). With an overall objective response rate of approximately 50% for either treatment combination, a major unsolved problem is that no predictors of response to these treatments are available. To address this issue, we profiled 742 microRNAs in laser‐capture microdissected cancer cells from responding and non‐responding patients receiving XELOX/FOLFOX as first‐line treatment for mCRC, and identified, among others, high expression of miR‐625‐3p, miR‐181b and miR‐27b to be associated with poor clinical response. In a validation cohort of 94 mCRC patients treated first‐line with XELOX, high expression of miR‐625‐3p was confirmed to be associated with poor response (OR = 6.25, 95%CI [1.8; 21.0]). Independent analyses showed that miR‐625‐3p was not dysregulated between normal and cancer samples, nor was its expression associated with recurrence of stage II or III disease, indicating that miR‐625‐3p solely is a response marker. Finally, we also found that these miRNAs were up‐regulated in oxaliplatin resistant HCT116/oxPt (miR‐625‐3p, miR‐181b and miR‐27b) and LoVo/oxPt (miR‐181b) colon cancer cell lines as compared with their isogenic parental cells. Altogether, our results suggest an association between miR‐625‐3p and response to first‐line oxaliplatin based chemotherapy of mCRC.
Keywords: Metastatic colorectal cancer, XELOX/FOLFOX, Oxaliplatin, Chemotherapy resistance, MicroRNA-625
Highlights
-
►
High miR‐625‐3p levels were associated with resistance to oxaliplatin based chemotherapy and a shortened overall survival.
-
►
High miR‐625‐3p levels were not prognostic, but solely predictive of oxaliplatin response.
-
►
miR‐625‐3p was up‐regulated in an oxaliplatin resistant colon cancer cell line.
1. Introduction
Colorectal cancer (CRC) is one of the most prevalent cancers in Europe and USA with more than 700,000 new cases per year, and the second leading cause of cancer mortality (Jemal et al., 2011). Patients with localized disease can to a large degree be treated successfully with surgery alone, but unfortunately, half of CRC patients survive less than five years, which mainly is a result of metastatic disease to the liver and lungs. The mainstay first‐line cytotoxic treatment of patients with metastatic CRC (mCRC) consists of a fluoropyrimidine (5FU or capecitabine) in combination with the alkylating agent oxaliplatin (FOLXOX or XELOX) or the topoisomerase I inhibitor irinotecan (FOLFIRI or XELIRI) (Van Cutsem et al., 2010). Upon failure of one regime (e.g. FOLFOX) the other (e.g. FOLFIRI) is typically initiated as second‐line therapy. These combination therapies have resulted in considerable improved outcome compared with 5FU alone (de Gramont et al., 2000; Douillard et al., 2000; Kohne et al., 2005). The effectiveness of the regimens, measured as response rate, progression free survival (PFS), and overall survival (OS), are independent of the sequence in which they are administrated (Tournigand et al., 2004). A major challenge, however, is that only approximately half of the patients obtain an objective response to either first‐line regimen (Pfeiffer et al., 2007), and that only partial cross‐resistance exist between these drugs (Tournigand et al., 2004). For this reason, it is of utmost importance to identify molecular bio‐ markers allowing patients with a low predicted treatment efficacy of a given treatment regime to be offered an alternative treatment with a better predicted efficacy. Further, identification of predictive molecules may point to signaling pathways causally involved in cellular resistance, and ultimately support the development of novel targeted therapies.
MicroRNAs (miRNAs) constitute a class of small 21–24 nt non‐coding RNA molecules that play important post‐transcriptional regulatory roles in diverse organisms including vertebrates, worms and plants (Berezikov, 2011; Voinnet, 2009). miRNAs exert their function by binding to semi‐complementary target mRNAs resulting in mRNA destabilization and translation repression (Bartel, 2009). In humans, perhaps more than half of mRNAs are regulated by the approximately 1000 miRNAs described, of which a subset has confidently been connected to developmental, physiological, and disease‐associated processes, including cancer development and progression (Bartel, 2009; Berezikov, 2011; Friedman et al., 2009). More recently, a growing body of publications suggests that aberrant miRNA expression could play pivotal roles in anti‐cancer drug response as well (Allen and Weiss, 2010). Using in vitro models for CRC, deregulation of several miRNAs has been linked to 5FU resistance (for instance, miR‐19b (Kurokawa et al., 2012), miR‐21 (Valeri et al., 2010), miR‐34 (Wang et al., 2010a), miR‐140 (Song et al., 2009) and miR‐192/miR‐215 (Boni et al., 2010)), as well as to oxaliplatin resistance (miR‐20a (Chai et al., 2011) and miR‐1915 (Xu et al., 2011)). In a clinical context, only two recent studies have investigated individual miRNAs for their association to oxaliplatin based chemotherapy of mCRC. Hansen et al. found low expression of miR‐126 in vessel structures of primary tumors associated with poor response to first‐line XELOX therapy (Hansen et al., 2012). More recently, in a screening of 21 candidate miRNAs, low expression of miR‐148a was associated with poor response to 5FU/oxaliplatin chemotherapy in stage IV mCRCs (Takahashi et al., 2012). Here, we present the first genome‐wide miRNA profiling study aiming at identifying novel miRNAs predicting response to first‐line 5FU/oxaliplatin treatment of patients with mCRC.
2. Materials and methods
2.1. Patient characteristics
For the initial screening study (Cohort A in fig1a) we used freshly frozen primary tumor tissue from un‐protocolled patients who had received oxaliplatin and 5FU (XELOX or FOLFOX) as first‐line treatment of mCRC (during the period 2004–2008) in the oncological departments of Odense University Hospital and Aarhus University Hospital, Denmark (Table 1). In total, 17 responders (best response to treatment being ‘Complete Response’ (CR; n = 7) or ‘Partial Response’ (PR; n = 10)), and 9 non‐responders (best response being ‘Stable Disease’ (SD; n = 7) or ‘Progressive Disease’ (PD; n = 2)). Since we hypothesized that certain miRNAs are associated with response, we enriched the responder group for CR cases and only included non‐responders with a PFS below 8 months in order to facilitate identification of predictive miRNAs. The validation Cohort B consisted of unselected patients from two independent clinical trials assessing 1st line XELOX treatment of mCRC between 2004 and 2008 (Table 2) (Hansen et al., 2011; Qvortrup et al., 2010). Response was evaluated according to Response Evaluation Criteria In Solid Tumors (RECIST) criteria (Therasse et al., 2000). PFS was defined as the time from inclusion to progressive disease or death of any cause, and OS was defined as the time from inclusion to death of any cause. OS was updated on 1 February 2012. Histological verified formalin fixed paraffin‐embedded (FFPE) primary tumor biopsies and data on best response were available for 94 patients. Cohort C consisted of FFPE primary tumors from 117 patients operated for stage II or III CRC at the Surgery Department at Aarhus University Hospital during the period between 2005 and 2007 (Table S1). The cohort was deliberately enriched for recurrence cases (n = 37, 32%) to facilitate evaluation of a potential prognostic component of candidate biomarkers. All patients received standardized follow‐up including CT‐scans of the chest and abdomen at 12 and 36 month after surgery. Cohort D consisted of freshly frozen stage II primary tumors from 23 recurrence and 23 non‐recurrence CRC patients from Denmark, Poland and Australia from which at least three years of follow up time after operation (conducted in the period 1999–2006) was available (Table S2) (Christensen et al., 2012). Written informed consent was obtained from all patients, according to local ethical regulations.
Figure 1.
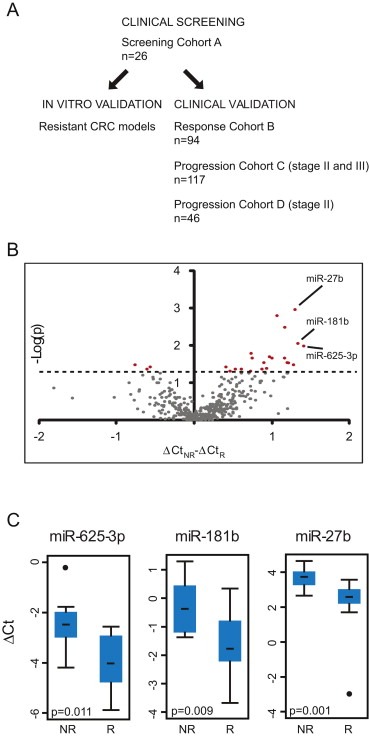
Identification of miRNAs associated with response to treatment of mCRC. (A) Schematic overview of the strategy employed. (B) Volcano plot of 404 miRNA assays indicating a general up‐regulation in non‐responders (ΔCtNR – ΔCtR > 0, x‐axis) as compared to responders. Assays potentially associated with response to treatment (p < 0.05, Wilcoxon rank‐sum test, y‐axis, indicated with the horizontal line) are colored red. (C) miR‐185 normalized expression levels (ΔCt) of miR‐625‐3p, miR‐181b and miR‐27b in non‐responders (NR, n = 9) and responders (R, n = 17). Median ΔCt is indicated with a bar.
Table 1.
Clinico‐pathological data of the screening Cohort A.
| Response (CR + PR, n = 17) | No response (SD + PD, n = 9) | |
|---|---|---|
| Age, years | ||
| Median (range) | 58 (49–76) | 65 (49–74) |
| Gender | ||
| Female/Male | 2/15 | 4/5 |
| Microsatellite status | ||
| MSS/MSI | 17/0 | 9/0 |
| Best response (RECIST) | ||
| CR | 7 | 0 |
| PR | 10 | 0 |
| SD | 0 | 7 |
| PD | 0 | 2 |
| PFS, months | ||
| Median (range) | 10.6 (4.3–61.7) | 3.6 (1.7–7.9) |
| OS, months | ||
| Median (range) | 27.4 (8.8–62.4) | 5.3 (2.6–24.2) |
Table 2.
Clinico‐pathological data of the validation Cohort B.
| Response (CR + PR, n = 56) | No response (SD + PD, n = 38) | |
|---|---|---|
| Age, years | ||
| Median (range) | 64 (45–77) | 61 (37–74) |
| Gender | ||
| Female/Male | 19/37 | 21/17 |
| Microsatellite status | ||
| MSS/MSI | 56/0 | 33/5 |
| Best response (RECIST) | ||
| CR | 2 | 0 |
| PR | 54 | 0 |
| SD | 0 | 32 |
| PD | 0 | 6 |
| PFS, months | ||
| Median (range) | 9.1 (3.9–19.0) | 6.2 (0.3–27.8) |
| OS, months | ||
| Median (range) | 21.8 (8.0–69.4) | 11.2 (0.3–74.9) |
2.2. Cell lines
Cell lines were obtained from ATCC, Maryland, USA. Oxaliplatin resistant cells were generated by passaging HCT116 and LoVo cells in increasing concentrations of oxaliplatin for at least 45 passages (Jensen et al., unpublished). IC50 values were determined colorimetrically using 3‐(4,5‐Dimethylthiazol‐2‐yl)‐2,5‐diphenyltetrazolium bromide (MTT)‐assay. Briefly, 10.000 cells per well were plated in 96 well‐plates 24 h before addition of increasing concentrations of oxaliplatin, and cultured for 48 h before addition of MTT. Cells were grown in RPMI 1640 with Hepes (Gibco, Invitrogen) and supplemented with 10% Fetal Calf Serum (FCS) (Gibco, Invitrogen) and 1% Penicillin‐Streptomycin (Gibco, Invitrogen), and cultured at 37 °C in an atmosphere of 5% CO2. All cell lines were authenticated according to the recommendation of American Type Tissue Collection (ATCC, Manassas, VA, USA) using short tandem repeat (STR) profiling. The obtained STR profiles all matched those published by ATCC (data not shown).
2.3. Laser‐capture microdissection
Pure cancer cell fractions (85% to >95% pure) from 26 freshly frozen tumors (Cohort A), and pure normal epithelial cell fractions from 9 adjacent normal biopsies was procured by laser‐capture microdissection using a Veritas 704 apparatus (Arcturus Molecular Devices) as previously described (Thorsen et al., 2011).
2.4. RNA isolation
Laser microdissected cells were incubated with RLT buffer (Qiagen) for 20 min at room temperature in the presence of 30 mM β‐mercaptoethanol (Sigma–Aldrich), and total RNA extracted on RNeasy MinElute spin columns according to manufacturer's recommendations (Qiagen). miRNAs were obtained from the <200 bp‐RNA flow‐through fraction of the MinElute spin column by adding 0.65 volumes of 100% EtOH and purified using the RNeasy micro kit (Qiagen). From formalin‐fixed paraffin embedded (FFPE) tumors non‐cancerous cells were first manually removed using a scalpel to ensure a final cancer cell percentage >50%. Total RNA (including miRNA) was subsequently extracted from several 10 μm‐sections using with the miRNeasy FFPE kit (Qiagen). MicroRNAs from pairs of sensitive and resistant cell lines were isolated using the same protocol used for microdissected tissue.
2.5. Microsatellite stability determination
Microsatellite status was determined by fluorescent pentaplex PCR of the mono‐ and dinucleotide repeats BAT‐25, BAT‐26, NR‐21, NR‐22 and NR‐24 (Suraweera et al., 2002). Tumors with two or more aberrant sized markers were classified as microsatellite instable.
2.6. miRNA qRT‐PCR and data analysis
Genome‐wide expression profiles of 742 different miRNAs were generated using the miRCURY Human panel I and II V.2 (Exiqon) real‐time PCR platform according to the manufacturer's recommendations on an ABI7900HT instrument (Applied Biosystems). Using manually set threshold and background subtraction settings raw real‐time PCR data were calculated in the SDS 2.4 software (Applied Biosystems). Samples were then split into responder (n = 17) and non‐responder (n = 9) response groups. To focus on miRNA assays that at least in one response group were expressed at a reasonable level we included only assays whose raw Ct value was below the 80th percentile in more than 80% of the samples in at least one of the response groups, resulting in the inclusion of 404 confidently measured miRNA assays. We subsequently used the NormFinder algorithm (Andersen et al., 2004) to determine miR‐185 as an optimally stable normalization gene. In addition to normalizing with mir‐185, we made a data set by normalization to the mean of the 50 highest expressed miRNAs as an alternative ‘robust’ strategy (Mestdagh et al., 2009). Normalization was done according to the formula ΔCt = Ct Normalization factor − Ct Target gene. The two normalization strategies resulted in very similar data in terms of top differentially expressed miRNAs as well as in the overall ranking of miRNAs, thus supporting the validity of miR‐185 as a normalization gene (See Table S3). Single assay‐qRT‐PCR (Cohort B and Cohort C, and cell lines) were done in triplicate using miRCURY LNA™ Universal RT microRNA PCR (Exiqon) according to the manufacturer's recommendations, except that 180 ng total RNA were used per cDNA reaction. Measurements were excluded in case of faulty melting point curves or with a standard deviation on triplicates above 2 Ct. In Cohort B, miR‐185 and miR‐625‐3p, miR‐181b and miR‐27b could be measured confidently in 77, 92 and 93 samples, respectively. In Cohort C miR‐185 and miR‐625‐3p could confidently be measured in 91 samples. Relative quantities (RQ) were determined for each reaction using the formula RQ = 10ˆ[(Ct‐b)/a] (where Ct is the threshold cycle, and a and b are the slope and intersection, respectively, of a standard curve generated from a pool of randomly chosen samples) and the average for each triplicate determined. Data was normalized to miR‐185 (clinical samples) or to U6 snRNA (cell lines) using the ratio RQ Target gene/RQ Normalization gene. Normalized qRT‐PCR data from Cohort B and C were log2‐transformed to obtain normal distributed data on which statistical analyses were performed. miR‐625‐3p expression levels in Cohort D patients were obtained as part of a profiling study using Multiplex RT for TaqMan MicroRNA Assays (Applied Biosystems) (Christensen et al., 2012).
2.7. Statistical analysis
For Cohort A, differences in miRNA expression levels were tested using Wilcoxon rank‐sum tests. For Cohort B, C, D, cell lines and tumor vs normal, miRNA expression levels were treated as continuous variables and differences in mean expression were tested using a t‐test. The patients in Cohort B were dichotomized into a low and a high miR‐625‐3p expression group. The low/high cut‐point was defined as the expression value resulting in the highest number of correctly classified samples (responders/non‐responders) in a receiver operator characteristic (ROC) analysis. The low and high miR‐625‐3p expression groups were used as covariates in a logistic regression to estimate the risk of not responding to therapy, as well to perform Kaplan–Meier survival statistics. Difference in survival curves was estimated using log‐rank tests, and hazard ratios estimated by Cox proportional hazards models. Statistical analyses were done in GeneSpring version 11 (Agilent) and Intercooled Stata 9.2 (StataCorp) as appropriate. Unsupervised cluster analysis was done using Cluster3.0 (de Hoon et al., 2004), and visualized using Java Treeview (Saldanha, 2004).
3. Results
3.1. Identification of miRNAs associated with response to first‐line XELOX treatment
Our main strategy to identify novel miRNAs involved in response to combination therapy with 5‐fluorouracil and oxaliplatin is outlined in Figure 1a. To increase the likelihood of identifying predictive miRNAs, the screening cohort (Cohort A in Figure 1a and Table 1) was enriched for patients with extreme responses to oxaliplatin based first‐line therapy (see Material and Methods). Cancer cells were procured by laser‐capture microdissection, and 742 mature miRNAs profiled using quantitative real‐time polymerase chain reaction (qRT‐PCR). Out of 404 confidently measured miRNA assays (see Material and Methods), we were left with 24 miRNAs, which were associated with response to treatment (p < 0.05, Wilcoxon rank‐sum test) (Table S3). Twenty‐one of these were on average higher expressed in non‐responders than responders indicating that therapy resistance was generally associated with increased miRNA expression. This trend also carries through for many of the miRNAs that did not reach significance (Figure 1b). The three miRNAs with the largest fold change (FC) – all up‐regulated in non‐responders ‐ were selected for further study: miR‐625‐3p (FC = 2.7, p = 0.011), miR‐181b (FC = 2.5, p = 0.009) and miR‐27b (FC = 2.5, p = 0.001) (Figure 1c).
3.2. miR‐625‐3p, miR‐27b and miR‐181b are up‐regulated in oxPt‐resistant cells in vitro
In order to substantiate the involvement of miR‐625‐3p, miR‐181b and miR‐27b in chemotherapy response, and to address whether this association was related to oxaliplatin, we generated two independent in vitro oxaliplatin resistant colorectal cancer models ‐ HCT116/oxpt and LoVo/oxpt ‐ by passaging HCT116 and LoVo colon cancer cells in increasing concentrations of oxaliplatin for more than 45 passages. The increase in IC50 of HCT116/oxpt and LoVo/oxpt as compared to the parental isogenic HCT116 and LoVo cancer cells were 76 and 13 times, respectively, as determined by MTT assay (Figure 2a). In the resistant HCT116/oxpt cells we found significantly increased levels of miR‐625‐3p, miR181b and in miR27b (approximately 2.8, 3.9 and 1.7 times higher than in parental cells, respectively; p < 0.05) (Figure 2b). We also quantified mir‐181a, which is transcribed from the same cluster as miR‐181b, and furthermore was significantly up‐regulated among our non‐responder patients (see Table S3). In agreement, miR‐181a was 3.6 times up‐regulated in the resistant HCT116/oxpt cells (Figure 2b). In order to exclude the possibility of a global transcriptional up‐regulation related to the resistant phenotype we quantified three arbitrarily chosen miRNAs – miR‐93, miR‐192 and miR‐103 – which were not associated with response in our clinical data set. None of these miRNAs were differentially expressed between resistant and parental cells (Figure 2b). We next quantified the same miRNAs in the LoVo parental and resistant cells. In this model, mir‐181b and mir‐181a were again significantly up‐regulated in the resistant cells (both by 2.2 fold; p < 0.05) (Figure 2c). However, neither miR‐625‐3p nor miR‐27b was differentially expressed.
Figure 2.
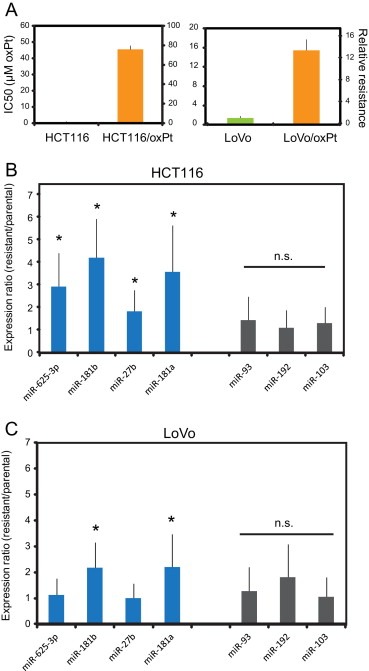
miR‐625‐3p, miR‐181b and miR‐27b are up‐regulated in oxaliplatin resistant colon cancer cells. (A) IC50 (left y‐axis) of oxaliplatin and corresponding relative resistance (right y‐axis) of HCT116 and HCT116/oxPt, and LoVo and LoVo/oxPt cell lines. (B) and (C) qRT‐PCR assays against individual miRNAs were done on isogenic parental and oxaliplatin resistant HCT116 (B) and LoVo (C) cell pairs. The expression levels in the resistant cells are plotted relative to the expression levels in the parental cells (set to 1). From each cell line two separate cell passages were obtained and from each passage qRT‐PCR was done twice and the average resistant/parental expression ratio from totally n = 4 qRT‐PCRs calculated, except for the unrelated miR‐93, miR‐192 and miR‐103, which were quantitated only once in each cell passage. S.E.M. is indicated, as well as significant different expression between parental and resistant isogenic cells (*, p < 0.05; t‐test).
3.3. miR‐625‐3p is associated with response to XELOX treatment in independent FFPE samples
We next sought to validate the association between miR‐625‐3p, miR‐181b and miR‐27b and response to treatment in an independent set of clinical samples consisting of primary tumor FFPE biopsies from patients with mCRC treated first‐line with XELOX (Cohort B in Figure 1a, Table 2) (Hansen et al., 2011; Qvortrup et al., 2010). While neither miR‐181b nor miR‐27b were associated with response (data not shown), the mean expression level of miR‐625‐3p was 2.0 times higher in patients who did not respond to treatment (p = 0.006, 95%CI [1.23; 3.42], t‐test) (Figure 3a). Multiple miRNAs are known to be differentially expressed between microsatellite stable (MSS) and instable (MSI) CRCs (Schepeler et al., 2008), and having included a few MSI patients in Cohort B, we speculated if this could bias our result. However, excluding the five MSI patients gave similar results (p = 0.006, 95%CI [1.26; 3.76]); in the following, we have included the MSI patients. When we stratified patients into a low (n = 62) and a high (n = 15) miR‐625‐3p expressing group using a receiver operating characteristic analysis, the proportion of patients not responding to chemotherapy (best response being either SD or PD) was significantly higher in the higher expressing group (p = 0.009, Fischer's exact test) (Figure 3b). The corresponding positive and negative predictive values were 0.73 (11/15) and 0.71 (44/62), respectively. Under a logistic regression model, this translates into a 6.7 times increased risk of being non‐responsive to therapy in the high miR‐625‐3p expressing group as compared to the low expressing group (p = 0.003, 95%CIOR [1.9; 23.9]). Finally, high expression of miR‐625‐3p was also associated with a shorter OS (p = 0.039, log‐rank test; this translates into a hazard ratio of 1.87, 95%CIHR [1.02; 3.41]) (Figure 3c and Table S4). A similar trend was seen for PFS although this was not significant (p = 0.316, log‐rank test) (Figure 3c and Table S4).
Figure 3.
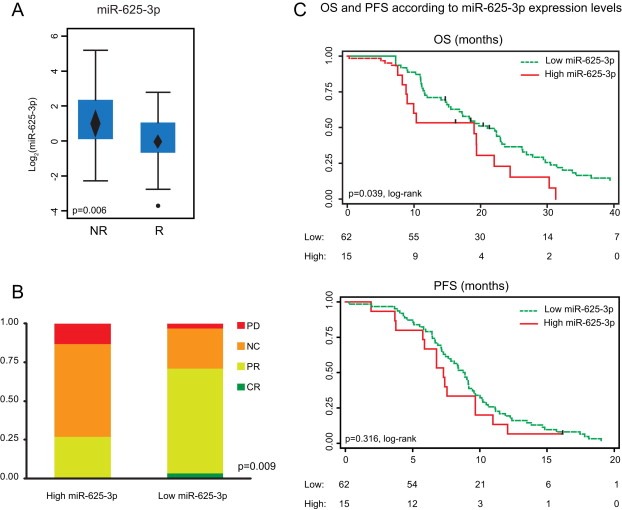
miR‐625‐3p is up‐regulated in non‐responder patients in independent FFPE samples from XELOX treated mCRC patients. (A) Expression levels of miR‐625‐3p in validation Cohort B was significantly higher in non‐responder as compared to responder patients (t‐test). Mean expression and 95%CI is indicated with a diamond. (B) The proportions of patients that did not experience response to therapy (PD or SD) were higher in primary tumors with high miR‐625‐3p expression levels (n = 15) as compared to primary tumors with low miR‐625‐3p expression levels (n = 62) (Fischer's exact test). (C) Kaplan–Meier curves for OS and PFS according to high and low miR‐625‐3p expression levels (log‐rank test).
3.4. miR‐181b but not miR‐625‐3p and miR‐27b is dysregulated in CRC epithelium
To explore experimentally whether our candidate miRNAs were dysregulated in tumors compared to normal tissue, miRNA profiles of 9 adjacent normal cells (laser microdissected epithelial cells) were compared to the 26 adenocarcinoma. Sixteen of the 24 miRNAs initially associated with response to 5FU and oxaliplatin treatment were either up‐regulated or down‐regulated in the cancer epithelium (p < 0.05, t‐test) (Table S5). The most up‐regulated miRNAs were miR‐135a (FC = 14.28), miR‐96 (FC = 8.86) and miR‐182 (FC = 7.44), while the most down‐regulated miRNAs were miR‐342‐5p (FC = 4.43), and 194‐3p (FC = 3.01) and miR‐124 (FC = 2.27). In agreement, unsupervised clustering based on the 24 candidate predictive miRNAs was able to separate normal epithelium from cancer tissue (Figure 4a). Among our top 3‐candidate predictive miRNAs, miR181b was up‐regulated (FC = 1.74) in cancer (p = 0.004, 95%CIFC [1.22; 2.54], t‐test) (Figure 4b), whereas miR‐27b and miR‐625‐3p were not dysregulated in this small sample set (Figure 4b and data not shown).
Figure 4.
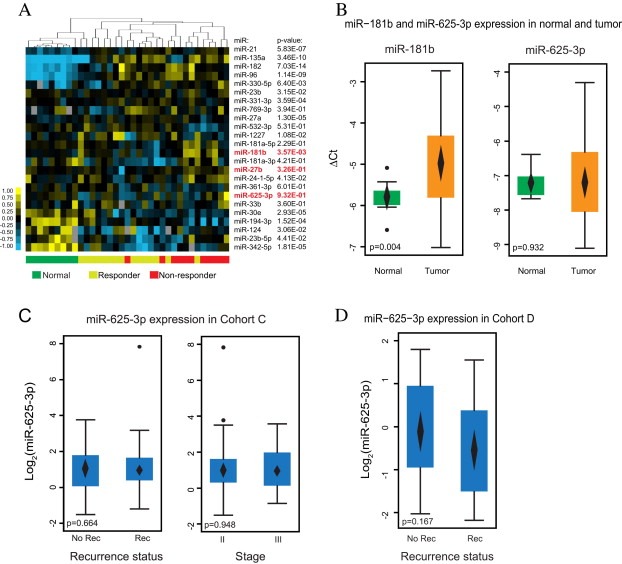
miR‐625‐3p is not a general marker for CRC. (A) The 24 miRNAs associated with response can separate tumor cells from normal mucosa epithelial cells. The miRNA name and corresponding p‐value for the difference in mean expression in normal vs. tumor using top 50‐normalized data is indicated (t‐test). Below are indicated normal (green), response (yellow) and no response (red) samples. (B) miR‐181b, but not miR‐625‐3p, is up‐regulated in cancer as compared to normal mucosa epithelium (t‐test). (C) Levels of miR‐625‐3p is similar in stage II and III tumors (right), as well as in tumors from recurrence and non‐recurrence Cohort C patients (left) (t‐test). (D) In non‐treated stage II Cohort D cancers no difference in miR‐625‐3p levels were found between recurrent and non‐recurrent patients (t‐test). In B, C and D mean expression and 95%CI is indicated with a diamond.
3.5. miR‐625‐3p is not a prognostic marker for CRC
Since miR‐625‐3p was found significantly correlated to OS in our cohort of patients treated with XELOX (Figure 3c), we considered the possibility that miR‐625‐3p might be prognostic in addition to predictive. To address this possibility, we examined whether the level of miR‐625‐3p was associated with metastatic recurrence of disease after curatively intended surgery in two independent cohorts (Cohort C and D). Cohort C consisted of 117 stage II (n = 64) and III (n = 53) patients of which 37 recurred (Table S1), while Cohort D consisted of 46 stage II patients of which 23 recurred (Table S2). In neither Cohort C (p = 0.664, t‐test) (Figure 4c) or Cohort D (p = 0.167, t‐test) (Figure 4d) was miR‐625‐3p differentially expressed between recurrent and non‐recurrent patients. Furthermore, miR‐625‐3p was not differentially expressed in stage II versus stage III cancers in Cohort C (p = 0.948, t‐test) (Figure 4c). In agreement, there was no difference in time to recurrence between low and high levels of miR‐625‐3p in neither Cohort C (p = 0.591, log‐rank test) or Cohort D (p = 0.162, log‐rank test).
4. Discussion
There is currently an urgent need to identify predictors of therapy in mCRC since approximately 50% of treated patients do not obtain any benefit while they all experience drug‐associated side effects. The presented data suggest that high miR‐625‐3p level is positively associated with a lack of objective response in mCRC patients receiving oxaliplatin based therapy. Our initial genome‐wide screening, conducted in a small panel (n = 26) of laser microdissected and thereby nearly pure, cancer epithelial cell populations from CRC patients treated with 1st line XELOX/FOLFOX chemotherapy, pointed to a list of 24 candidate miRNAs associated with response. From this list we focused on the three most differentially expressed miRNAs: miR‐625‐3p, miR‐181b and miR‐27b. Although our efforts to validate the association between miR‐181b and miR‐27b and response in independent clinical samples were unsuccessful, both were up‐regulated in oxaliplatin resistant colon cancer cell lines, suggesting that they anyhow could be implicated in chemotherapy resistance. The mir‐181 and miR‐27b genes are transcribed from the mir‐23b/mir‐27b/mir‐24‐1 and mir‐181b/mir‐181a clusters, respectively, and the observation that all miRNAs in the two clusters are among the 24 candidate miRNAs indicates a genuine biological difference between responders and non‐responders for miR‐181b and miR‐27b. We find it likely that the higher percentage of non‐epithelial cells in the FFPE validation cohort as compared to the highly enriched screening cohort (as well as the epithelial cell lines) might be a critical restriction on our opportunity to validate miR‐27b and miR‐181b. In fact, in a small set of microdissected adenocarcinomas, the level of stromal miR‐27b was twice as high as in the epithelial fraction (supplementary data in (Wang et al., 2010b)). A second possible shortcoming relates to the fact that we have compared miRNAs from snap frozen tissue (Cohort A) with FFPE biopsies (Cohort B). Although there generally is a good correlation between miRNA expression in archival FFPE blocks and fresh frozen tissue (Xi et al., 2007), a subset of miRNAs display considerable differences between FFPE and fresh frozen tissue when systematically examined (Li et al., 2007). A role for miR‐181b in chemoresistance may also find support in several studies. Most importantly, increased levels of miR‐181b has been linked with poor response to S‐1 (a drug combination based on the 5FU prodrug tegafur) in colon cancer (Nakajima et al., 2006), as well as to S‐1/oxaliplatin treated metastatic gastric cancers (Jiang et al., 2011). While no studies directly have linked miR‐27b to therapy resistance, it has recently emerged as a positive regulator of angiogenesis by targeting of the anti‐angiogenic factors Sprouty 2 (Zhou et al., 2011) and Semaphorin 6A (Urbich et al., 2012). Not much is known about the regulation and function of the mir‐625 gene, nor has a validated target gene been described. Based on a small number of deep sequencing experiments, the miRBASE data repository (http://www.mirbase.org) (Griffiths‐Jones, 2004) indicates that both strands of the mir‐625 gene (i.e. miR‐625‐5p and miR‐625‐3p) are expressed at similar levels. This is somewhat at odds with the usual conception of miRNA biogenesis, which holds that only one strand (the guide strand) of the mature miRNA‐5p/miRNA‐3p duplex is retained upon stabilization into the RNA‐induced silencing complex (RISC), while the other (the passenger strand) is rapidly degraded (Bartel, 2009). In support of functional roles of both mature mir‐625 strands, Yang et al. (Yang et al., 2011) used ectopic expression of artificial luciferase sensors with perfect match sequences for miR‐625‐5p and miR‐625‐3p (alongside 21 other miRNA‐5p/miRNA‐3p pairs) and observed almost equal suppressing capabilities. In our clinical data sets, high miR‐625‐3p expression predicted poor response to therapy, and also showed an associated to OS while the association to PFS did not reach significance. The latter may not be surprising, especially for relatively small cohorts like ours, since the correlation between objective response and PFS is only moderate and is confounded by methodological and biological aspects (Michaelis and Ratain, 2006; Wilkerson and Fojo, 2009). The association to OS could indicate a prognostic component in miR‐625‐3p as well. Nevertheless, lack of association between miR‐625‐3p and recurrence of disease in stage II and III cancers from two cohorts suggested that high miR‐625‐3p is not a prognostic marker. If translated into the clinical setting the reported findings would be significant considering the current lack of established predictive markers for mCRC chemotherapy. However, it will be important to address whether high miR‐625‐3p levels also predicts lack of response to irinotecan based therapy. If this is not the case, FOLFIRI or XELIRI could be offered to patients with high miR‐625‐3p primary tumor expression levels. Further validations in larger cohorts, and ultimately in a randomized intervention study, will be needed in this regard.
Cellular resistance to oxaliplatin can probably be invoked by multiple independent mechanisms including cellular drug uptake and efflux, DNA repair, DNA damage response, and cell cycle control (Ahmad, 2010). It is likely that different mechanisms are involved to variable degrees in individual patients as a consequence of tumor heterogeneity and differences in the degree of tumor clone selection during the process of metastasis and in the course of therapy. A simple miRNA ‘profile’ is therefore not be expected to predict resistance in all patients. We envision that combining miR‐625‐3p with other promising predictors, such as miR‐126 (Hansen et al., 2012) and miR‐148a (Takahashi et al., 2012), may results in improved clinical benefit, especially if each of these miRNAs hold information on independent resistance mechanisms.
In conclusion, the presented work have identified miR‐625‐3p as a non‐coding RNA related to the response to oxaliplatin based treatment both in patient CRC samples and in in vitro grown colon cancer cell lines.
Supporting information
The following are the supplementary data related to this article:
Supplementary data
Supplementary data
Supplementary data
Supplementary data
Supplementary data
Acknowledgments
Excellent technical assistance from Birgitte Trolle, Margaret Elizabeth Gellett and Mette Primdahl Rasmussen is acknowledged.
Supplementary data 1.
1.1.
Supplementary data related to this article can be found at http://dx.doi.org/10.1016/j.molonc.2013.02.016.
Rasmussen Mads H., Jensen Niels F., Tarpgaard Line S., Qvortrup Camilla, Rømer Maria U., Stenvang Jan, Hansen Tine P., Christensen Lise L., Lindebjerg Jan, Hansen Flemming, Jensen Benny V., Hansen Torben F., Pfeiffer Per, Brünner Nils, Ørntoft Torben F., Andersen Claus L., (2013), High expression of microRNA‐625‐3p is associated with poor response to first‐line oxaliplatin based treatment of metastatic colorectal cancer, Molecular Oncology, 7, doi: 10.1016/j.molonc.2013.02.016.
References
- Ahmad, S. , 2010. Platinum-DNA interactions and subsequent cellular processes controlling sensitivity to anticancer platinum complexes. Chem. Biodivers. 7, 543–566. [DOI] [PubMed] [Google Scholar]
- Allen, K.E. , Weiss, G.J. , 2010. Resistance may not be futile: microRNA biomarkers for chemoresistance and potential therapeutics. Mol. Cancer Ther. 9, 3126–3136. [DOI] [PubMed] [Google Scholar]
- Andersen, C.L. , Jensen, J.L. , Orntoft, T.F. , 2004. Normalization of real-time quantitative reverse transcription-PCR data: a model-based variance estimation approach to identify genes suited for normalization, applied to bladder and colon cancer data sets. Cancer Res. 64, 5245–5250. [DOI] [PubMed] [Google Scholar]
- Bartel, D.P. , 2009. MicroRNAs: target recognition and regulatory functions. Cell 136, 215–233. [DOI] [PMC free article] [PubMed] [Google Scholar]
- Berezikov, E. , 2011. Evolution of microRNA diversity and regulation in animals. Nat. Rev. Genet. 12, 846–860. [DOI] [PubMed] [Google Scholar]
- Boni, V. , Bitarte, N. , Cristobal, I. , Zarate, R. , Rodriguez, J. , Maiello, E. , Garcia-Foncillas, J. , Bandres, E. , 2010. miR-192/miR-215 influence 5-fluorouracil resistance through cell cycle-mediated mechanisms complementary to its post-transcriptional thymidilate synthase regulation. Mol. Cancer Ther. 9, 2265–2275. [DOI] [PubMed] [Google Scholar]
- Chai, H. , Liu, M. , Tian, R. , Li, X. , Tang, H. , 2011. miR-20a targets BNIP2 and contributes chemotherapeutic resistance in colorectal adenocarcinoma SW480 and SW620 cell lines. Acta Biochim. Biophys. Sin (Shanghai) 43, 217–225. [DOI] [PubMed] [Google Scholar]
- Christensen, L.L. , Tobiasen, H. , Holm, A. , Schepeler, T. , Ostenfeld, M.S. , Thorsen, K. , Rasmussen, M.H. , Birkenkamp-Demtroeder, K. , Sieber, O.M. , Gibbs, P. , Lubinski, J. , Lamy, P. , On behalf of the, C.s.g.S.L, Øster, B. , Hansen, K.Q. , Hagemann-Madsen, R. , Byskov, K. , Ørntoft, T.F. , Andersen, C.L. , The first authorship is shared by Lise Lotte, C., Heidi, T. , 2012. MiRNA-362-3p induces cell cycle arrest through targeting of E2F1, USF2 and PTPN1 and is associated with recurrence of colorectal cancer. Int. J. Cancer 10.1002/ijc.28010 [Epub ahead of print] [DOI] [PubMed] [Google Scholar]
- de Gramont, A. , Figer, A. , Seymour, M. , Homerin, M. , Hmissi, A. , Cassidy, J. , Boni, C. , Cortes-Funes, H. , Cervantes, A. , Freyer, G. , Papamichael, D. , Le Bail, N. , Louvet, C. , Hendler, D. , de Braud, F. , Wilson, C. , Morvan, F. , Bonetti, A. , 2000. Leucovorin and fluorouracil with or without oxaliplatin as first-line treatment in advanced colorectal cancer. J. Clin. Oncol. 18, 2938–2947. [DOI] [PubMed] [Google Scholar]
- de Hoon, M.J. , Imoto, S. , Nolan, J. , Miyano, S. , 2004. Open source clustering software. Bioinformatics 20, 1453–1454. [DOI] [PubMed] [Google Scholar]
- Douillard, J.Y. , Cunningham, D. , Roth, A.D. , Navarro, M. , James, R.D. , Karasek, P. , Jandik, P. , Iveson, T. , Carmichael, J. , Alakl, M. , Gruia, G. , Awad, L. , Rougier, P. , 2000. Irinotecan combined with fluorouracil compared with fluorouracil alone as first-line treatment for metastatic colorectal cancer: a multicentre randomised trial. Lancet 355, 1041–1047. [DOI] [PubMed] [Google Scholar]
- Friedman, R.C. , Farh, K.K. , Burge, C.B. , Bartel, D.P. , 2009. Most mammalian mRNAs are conserved targets of microRNAs. Genome Res. 19, 92–105. [DOI] [PMC free article] [PubMed] [Google Scholar]
- Griffiths-Jones, S. , 2004. The microRNA Registry. Nucleic Acids Res. 32, D109–D111. [DOI] [PMC free article] [PubMed] [Google Scholar]
- Hansen, T.F. , Garm Spindler, K.L. , Andersen, R.F. , Lindebjerg, J. , Brandslund, I. , Jakobsen, A. , 2011. The predictive value of genetic variations in the vascular endothelial growth factor A gene in metastatic colorectal cancer. Pharmacogenomic. J. 11, 53–60. [DOI] [PubMed] [Google Scholar]
- Hansen, T. , Sorensen, F. , Lindebjerg, J. , Jakobsen, A. , 2012. The predictive value of microRNA-126 in relation to first line treatment with capecitabine and oxaliplatin in patients with metastatic colorectal cancer. BMC Cancer 12, 83 [DOI] [PMC free article] [PubMed] [Google Scholar]
- Jemal, A. , Bray, F. , Center, M.M. , Ferlay, J. , Ward, E. , Forman, D. , 2011. Global cancer statistics. CA Cancer J. Clin. 61, 69–90. [DOI] [PubMed] [Google Scholar]
- Jiang, J. , Zheng, X. , Xu, X. , Zhou, Q. , Yan, H. , Zhang, X. , Lu, B. , Wu, C. , Ju, J. , 2011. Prognostic significance of miR-181b and miR-21 in gastric cancer patients treated with S-1/Oxaliplatin or Doxifluridine/Oxaliplatin. PLoS One 6, e23271 [DOI] [PMC free article] [PubMed] [Google Scholar]
- Kohne, C.H. , van Cutsem, E. , Wils, J. , Bokemeyer, C. , El-Serafi, M. , Lutz, M.P. , Lorenz, M. , Reichardt, P. , Ruckle-Lanz, H. , Frickhofen, N. , Fuchs, R. , Mergenthaler, H.G. , Langenbuch, T. , Vanhoefer, U. , Rougier, P. , Voigtmann, R. , Muller, L. , Genicot, B. , Anak, O. , Nordlinger, B. , 2005. Phase III study of weekly high-dose infusional fluorouracil plus folinic acid with or without irinotecan in patients with metastatic colorectal cancer: European Organisation for Research and Treatment of Cancer Gastrointestinal Group Study 40986. J. Clin. Oncol. 23, 4856–4865. [DOI] [PubMed] [Google Scholar]
- Kurokawa, K. , Tanahashi, T. , Iima, T. , Yamamoto, Y. , Akaike, Y. , Nishida, K. , Masuda, K. , Kuwano, Y. , Murakami, Y. , Fukushima, M. , Rokutan, K. , 2012. Role of miR-19b and its target mRNAs in 5-fluorouracil resistance in colon cancer cells. J. Gastroenterol. 47, 883–895. [DOI] [PubMed] [Google Scholar]
- Li, J. , Smyth, P. , Flavin, R. , Cahill, S. , Denning, K. , Aherne, S. , Guenther, S.M. , O'Leary, J.J. , Sheils, O. , 2007. Comparison of miRNA expression patterns using total RNA extracted from matched samples of formalin-fixed paraffin-embedded (FFPE) cells and snap frozen cells. BMC Biotechnol. 7, 36 [DOI] [PMC free article] [PubMed] [Google Scholar]
- Mestdagh, P. , Van Vlierberghe, P. , De Weer, A. , Muth, D. , Westermann, F. , Speleman, F. , Vandesompele, J. , 2009. A novel and universal method for microRNA RT-qPCR data normalization. Genome Biol. 10, R64 [DOI] [PMC free article] [PubMed] [Google Scholar]
- Michaelis, L.C. , Ratain, M.J. , 2006. Measuring response in a post-RECIST world: from black and white to shades of grey. Nature reviews. Cancer 6, 409–414. [DOI] [PubMed] [Google Scholar]
- Nakajima, G. , Hayashi, K. , Xi, Y. , Kudo, K. , Uchida, K. , Takasaki, K. , Yamamoto, M. , Ju, J. , 2006. Non-coding MicroRNAs hsa-let-7g and hsa-miR-181b are Associated with Chemoresponse to S-1 in Colon Cancer. Cancer Genom. Proteom. 3, 317–324. [PMC free article] [PubMed] [Google Scholar]
- Pfeiffer, P. , Qvortrup, C. , Eriksen, J.G. , 2007. Current role of antibody therapy in patients with metastatic colorectal cancer. Oncogene 26, 3661–3678. [DOI] [PubMed] [Google Scholar]
- Qvortrup, C. , Jensen, B.V. , Fokstuen, T. , Nielsen, S.E. , Keldsen, N. , Glimelius, B. , Bjerregaard, B. , Mejer, J. , Larsen, F.O. , Pfeiffer, P. , 2010. A randomized study comparing short-time infusion of oxaliplatin in combination with capecitabine XELOX(30) and chronomodulated XELOX(30) as first-line therapy in patients with advanced colorectal cancer. Annals of oncology. Off. J. Eur. Soc. Med. Oncol./ESMO 21, 87–91. [DOI] [PubMed] [Google Scholar]
- Saldanha, A.J. , 2004. Java Treeview—extensible visualization of microarray data. Bioinformatics 20, 3246–3248. [DOI] [PubMed] [Google Scholar]
- Schepeler, T. , Reinert, J.T. , Ostenfeld, M.S. , Christensen, L.L. , Silahtaroglu, A.N. , Dyrskjøt, L. , Wiuf, C. , Sørensen, F.J. , Kruhøffer, M. , Laurberg, S. , Kauppinen, S. , Ørntoft, T.F. , Andersen, C.L. , 2008. Diagnostic and prognostic MicroRNAs in Stage II Colon Cancer. Cancer Res. 68, 6416–6424. [DOI] [PubMed] [Google Scholar]
- Song, B. , Wang, Y. , Xi, Y. , Kudo, K. , Bruheim, S. , Botchkina, G.I. , Gavin, E. , Wan, Y. , Formentini, A. , Kornmann, M. , Fodstad, O. , Ju, J. , 2009. Mechanism of chemoresistance mediated by miR-140 in human osteosarcoma and colon cancer cells. Oncogene 28, 4065–4074. [DOI] [PMC free article] [PubMed] [Google Scholar]
- Suraweera, N. , Duval, A. , Reperant, M. , Vaury, C. , Furlan, D. , Leroy, K. , Seruca, R. , Iacopetta, B. , Hamelin, R. , 2002. Evaluation of tumor microsatellite instability using five quasimonomorphic mononucleotide repeats and pentaplex PCR. Gastroenterology 123, 1804–1811. [DOI] [PubMed] [Google Scholar]
- Takahashi, M. , Cuatrecasas, M. , Balaguer, F. , Hur, K. , Toiyama, Y. , Castells, A. , Boland, C.R. , Goel, A. , 2012. The clinical significance of MiR-148a as a predictive Biomarker in patients with advanced colorectal cancer. PLoS One 7, e46684 [DOI] [PMC free article] [PubMed] [Google Scholar]
- Therasse, P. , Arbuck, S.G. , Eisenhauer, E.A. , Wanders, J. , Kaplan, R.S. , Rubinstein, L. , Verweij, J. , Van Glabbeke, M. , van Oosterom, A.T. , Christian, M.C. , Gwyther, S.G. , 2000. New guidelines to evaluate the response to treatment in Solid tumors. J. Natl. Cancer Inst. 92, 205–216. [DOI] [PubMed] [Google Scholar]
- Thorsen, K. , Schepeler, T. , Oster, B. , Rasmussen, M. , Vang, S. , Wang, K. , Hansen, K. , Lamy, P. , Pedersen, J. , Eller, A. , Mansilla, F. , Laurila, K. , Wiuf, C. , Laurberg, S. , Dyrskjot, L. , Orntoft, T. , Andersen, C. , 2011. Tumor-specific usage of alternative transcription start sites in colorectal cancer identified by genome-wide exon array analysis. BMC Genomics 12, 505 [DOI] [PMC free article] [PubMed] [Google Scholar]
- Tournigand, C. , Andre, T. , Achille, E. , Lledo, G. , Flesh, M. , Mery-Mignard, D. , Quinaux, E. , Couteau, C. , Buyse, M. , Ganem, G. , Landi, B. , Colin, P. , Louvet, C. , de Gramont, A. , 2004. FOLFIRI followed by FOLFOX6 or the reverse sequence in advanced colorectal cancer: a randomized GERCOR study. J. Clin. Oncol. 22, 229–237. [DOI] [PubMed] [Google Scholar]
- Urbich, C. , Kaluza, D. , Fromel, T. , Knau, A. , Bennewitz, K. , Boon, R.A. , Bonauer, A. , Doebele, C. , Boeckel, J.N. , Hergenreider, E. , Zeiher, A.M. , Kroll, J. , Fleming, I. , Dimmeler, S. , 2012. MicroRNA-27a/b controls endothelial cell repulsion and angiogenesis by targeting semaphorin 6A. Blood 119, 1607–1616. [DOI] [PubMed] [Google Scholar]
- Valeri, N. , Gasparini, P. , Braconi, C. , Paone, A. , Lovat, F. , Fabbri, M. , Sumani, K.M. , Alder, H. , Amadori, D. , Patel, T. , Nuovo, G.J. , Fishel, R. , Croce, C.M. , 2010. MicroRNA-21 induces resistance to 5-fluorouracil by down-regulating human DNA MutS homolog 2 (hMSH2). Proc. Natl. Acad. Sci. U S A 107, 21098–21103. [DOI] [PMC free article] [PubMed] [Google Scholar]
- Van Cutsem, E. , Nordlinger, B. , Cervantes, A. , 2010. Advanced colorectal cancer: ESMO Clinical Practice Guidelines for treatment. Annals of oncology. Off. J. Eur. Soc. Med. Oncol./ESMO 21, (Suppl 5) v93–v97. [DOI] [PubMed] [Google Scholar]
- Voinnet, O. , 2009. Origin, biogenesis, and activity of plant microRNAs. Cell 136, 669–687. [DOI] [PubMed] [Google Scholar]
- Wang, B.D. , Kline, C.L. , Pastor, D.M. , Olson, T.L. , Frank, B. , Luu, T. , Sharma, A.K. , Robertson, G. , Weirauch, M.T. , Patierno, S.R. , Stuart, J.M. , Irby, R.B. , Lee, N.H. , 2010. Prostate apoptosis response protein 4 sensitizes human colon cancer cells to chemotherapeutic 5-FU through mediation of an NF kappaB and microRNA network. Mol. Cancer 9, 98 [DOI] [PMC free article] [PubMed] [Google Scholar]
- Wang, S. , Wang, L. , Zhu, T. , Gao, X. , Li, J. , Wu, Y. , Zhu, H. , 2010. Improvement of tissue preparation for laser capture microdissection: application for cell type-specific miRNA expression profiling in colorectal tumors. BMC Genomics 11, 163 [DOI] [PMC free article] [PubMed] [Google Scholar]
- Wilkerson, J. , Fojo, T. , 2009. Progression-free survival is simply a measure of a drug's effect while administered and is not a surrogate for overall survival. Cancer J. 15, 379–385. [DOI] [PubMed] [Google Scholar]
- Xi, Y. , Nakajima, G. , Gavin, E. , Morris, C.G. , Kudo, K. , Hayashi, K. , Ju, J. , 2007. Systematic analysis of microRNA expression of RNA extracted from fresh frozen and formalin-fixed paraffin-embedded samples. RNA 13, 1668–1674. [DOI] [PMC free article] [PubMed] [Google Scholar]
- Xu, K. , Liang, X. , Cui, D. , Wu, Y. , Shi, W. , Liu, J. , 2011. miR-1915 inhibits Bcl-2 to modulate multidrug resistance by increasing drug-sensitivity in human colorectal carcinoma cells. Mol. Carcinog. [DOI] [PubMed] [Google Scholar]
- Yang, J.S. , Phillips, M.D. , Betel, D. , Mu, P. , Ventura, A. , Siepel, A.C. , Chen, K.C. , Lai, E.C. , 2011. Widespread regulatory activity of vertebrate microRNA* species. RNA 17, 312–326. [DOI] [PMC free article] [PubMed] [Google Scholar]
- Zhou, Q. , Gallagher, R. , Ufret-Vincenty, R. , Li, X. , Olson, E.N. , Wang, S. , 2011. Regulation of angiogenesis and choroidal neovascularization by members of microRNA-23∼27∼24 clusters. Proc. Natl. Acad. Sci. U S A 108, 8287–8292. [DOI] [PMC free article] [PubMed] [Google Scholar]
Associated Data
This section collects any data citations, data availability statements, or supplementary materials included in this article.
Supplementary Materials
The following are the supplementary data related to this article:
Supplementary data
Supplementary data
Supplementary data
Supplementary data
Supplementary data