

Abstract
Kallikrein‐related peptidases, in particular KLK4, 5, 6 and 7 (4–7), often have elevated expression levels in ovarian cancer. In OV‐MZ‐6 ovarian cancer cells, combined expression of KLK4–7 reduces cell adhesion and increases cell invasion and resistance to paclitaxel. The present work investigates how KLK4–7 shape the secreted proteome (“secretome”) and proteolytic profile (“degradome”) of ovarian cancer cells. The secretome comparison consistently identified >900 proteins in three replicate analyses. Expression of KLK4–7 predominantly affected the abundance of proteins involved in cell–cell communication. Among others, this includes increased levels of transforming growth factor β‐1 (TGFβ‐1). KLK4–7 co‐transfected OV‐MZ‐6 cells share prominent features of elevated TGFβ‐1 signaling, including increased abundance of neural cell adhesion molecule L1 (L1CAM). Augmented levels of TGFβ‐1 and L1CAM upon expression of KLK4–7 were corroborated in vivo by an ovarian cancer xenograft model. The degradomic analysis showed that KLK4–7 expression mostly affected cleavage sites C‐terminal to arginine, corresponding to the preference of kallikreins 4, 5 and 6. Putative kallikrein substrates include chemokines, such as growth differentiation factor 15 (GDF 15) and macrophage migration inhibitory factor (MIF). Proteolytic maturation of TGFβ‐1 was also elevated. KLK4–7 have a pronounced, yet non‐degrading impact on the secreted proteome, with a strong association between these proteases and TGFβ‐1 signaling in tumor biology.
Keywords: Proteolysis, Kallikrein-related proteases, Ovarian cancer, Degradomics, Transforming growth factor beta
Highlights
Expression of KLK4, 5, 6, and 7 yields subtle secretome and degradome alterations.
Pro‐ and anti‐tumorigenic proteins are affected.
TGFβ‐1 signaling is elevated.
Degradomic analysis supports cell‐contextual KLK activity.
Potential substrates of KLK4–7 have been identified.
1. Introduction
Ovarian cancer accounts for 6% of all cancer‐related deaths despite its comparably low incidence rate (3% of solid tumors) (Siegel et al., 2012). 90% of ovarian cancers are of epithelial origin. Most women present with advanced stage disease since they often remain asymptomatic in the early stage disease. Hence, the prognosis is poor with five‐year survival rates <20% (Roett and Evans, 2009). Kallikrein‐related peptidases (KLKs) are frequently over‐expressed in ovarian cancer (Borgoño et al., 2004) and are suggested to be prognostic markers (Obiezu and Diamandis, 2005). They solely comprise a catalytic domain of approximately 25 kDa and have trypsin‐like or chymotrypsin‐like specificity (Yousef and Diamandis, 2003).
During the last decade, a series of publications showed strong linkage between poor prognosis in ovarian cancer and elevated expression of KLK proteases, including human KLK 4 (Dong et al., 2001; Obiezu et al., 2001; Xi et al., 2004), KLK5 (Diamandis et al., 2003, 2001, 2005, 2003, 2003), KLK6 (Diamandis et al., 2003, 2000, 2004, 2002, 2008, 2004, 2004, 2004, 2007, 2001, 2009), and KLK7 (Kyriakopoulou et al., 2003; Psyrri et al., 2008; Shan et al., 2006; Shigemasa et al., 2001; Shih Ie et al., 2007; Tanimoto et al., 1999).
There exists comparably few data on the causative relation between KLK expression and aggressiveness of this disease. One of the first studies to investigate the impact of KLK proteases on tumor cell behavior used the ovarian cancer cell line OV‐MZ‐6, which lacks endogenous KLK expression. OV‐MZ‐6 were co‐transfected to express KLK4–7 simultaneously (Prezas et al., 2006). Combined expression of KLK4–7 led to increased invasiveness in in vitro matrigel invasion assays and elevated tumor burden in a xenograft model (Prezas et al., 2006). Noteworthy, expression levels of KLK4–7 were moderate, with antigen levels in the low ng/ml range in cell culture supernatant, xenograft tumor tissue and tumor fluid. A recent follow‐up study showed that combined KLK4–7 expression decreases cell adhesion to vitronectin and fibronectin while the resistance to paclitaxel, a cytotoxic agent which is used as a chemotherapeutic for ovarian cancer, was increased (Loessner et al., 2012). In good agreement, several studies revealed that expression of KLK4–7 correlated with the lack of response to paclitaxel in ovarian cancer patients (Dong et al., 2010; Oikonomopoulou et al., 2008; Xi et al., 2004; Yousef and Diamandis, 2009).
As a post‐translational modification, proteolysis acts in both destructive and constructive manner. “Destructive” describes degradative function of proteolysis. In this context, proteolysis is important for adjusting proteome composition and protein turnover. “Constructive” refers to limited proteolysis, which generates stable cleavage products that often possess new functionality; examples include activation of enzyme and cytokine precursors as in the case of transforming growth factor β‐1 (TGFβ‐1).
Despite numerous studies that correlate KLK expression with cancer progression, it has remained largely unknown how they shape the extracellular proteome and which proteolytic cleavage events are mediated by their expression. Mass spectrometry‐based proteomics is a very powerful approach to quantitatively survey proteome composition in different biological samples (Aebersold and Mann, 2003). However, such global approaches are not well suited for the analysis of native or proteolytically generated protein termini as these are typically overshadowed by more abundant native peptides. Hence, specific enrichment techniques are employed to accumulate terminal peptides. Proteomic strategies targeting proteolytic processing are referred as ‘degradomics’ (López‐Otín and Matrisian, 2007). One of the most powerful degradomic approaches, targeting protein N‐termini, has been brought forward by Kleifeld et al. (2010) with widespread applications in cell cultures (Jefferson et al., 2013; Prudova et al., 2010; Tholen et al., 2011) and tissue samples (auf dem Keller et al., 2013; Tholen et al., 2013). Typically, secretome or proteome composition is studied in parallel by a global, quantitative proteomics approach employing stable isotope labeling. The combination of both strategies is crucial since protease (over‐) expression often leads to downstream effects and altered protein abundance. Cleavage sites in quantitatively affected proteins may appear as up‐ or down‐regulated; however, they rather represent altered protein abundance than affected proteolysis.
It has been shown that KLK proteases, including KLK4, 5, 6 and 7, degrade components of the extracellular matrix (ECM) in vitro (Ghosh et al., 2004; Michael et al., 2005; Obiezu et al., 2006; Ramani and Haun, 2008). However, in vitro studies using purified proteases and individual substrate candidates are intrinsically biased and fail to depict cell‐contextual proteolysis. The in vivo context differs considerably from the in vitro situation through the presence of co‐factors, inhibitors, and the occurrence of downstream effects, such as perturbed activation cascades. Using the KLK4–7 co‐transfected OV‐MZ‐6 cells, this study investigates how KLK4–7 contribute to the extracellular proteome composition and which proteolytic cleavage events are affected. Motivated by their important roles in ovarian cancer, this is the first cell‐contextual proteomic and degradomic study of kallikrein proteases. Our results highlight extracellular kallikrein activity, albeit without massively elevated degradative proteolysis. Importantly, expression of KLK4–7 leads to elevated TGFβ‐1 signaling with concurrent effects, such as increased L1CAM expression, and a previously described more motile cellular phenotype (Loessner et al., 2012; Prezas et al., 2006).
2. Materials and methods
2.1. Cell culture
The human ovarian cancer cell line OV‐MZ‐6 was established from the tumor fluid (ascites) of a patient with serous adenocarcinoma of the ovary (Mobus et al., 1992) and used to stably co‐transfect expression vectors harboring human full‐length cDNA of kallikreins 4–7 (Prezas et al., 2006). OV‐MZ‐6 cells transfected with an empty vector served as controls. Cells were cultured in Dulbecco's modified eagle medium (DMEM; PAN) supplemented with 10% fetal calf serum (FCS; PAN), 1% non‐essential amino acids, 1% MEM vitamins, 1% penicillin/streptomycin, and 10 mM HEPES (pH 7.5) at 37 °C in humidified air containing 5% CO2.
2.2. Collection of cell conditioned medium for proteomic and degradomic analyses
Cell conditioned medium (CCM) was generated by incubation of cells in serum‐free medium to avoid overshadowing of serum proteins. Cells were grown to 90% confluency as described above. The medium was removed, and cells were washed thrice with DMEM (without phenol red and FCS). Cells were then incubated in DMEM (1% non‐essential amino acids, 1% MEM vitamins, 1% penicillin/streptomycin, 10 mM HEPES (pH 7.5); without phenol red) for 1 h at 37 °C. Then, this medium was removed, and the cells were gently washed twice with DMEM (without phenol red and FCS) and 20 ml of fresh serum‐free medium (as above) added. After 24 h, the CCM was harvested, and protease‐inhibitors were added [1 μM trans‐epoxysuccinyl‐l‐leucylamido (4‐guanidino)butane (E‐64), 5 mM ethylene‐diaminetetraacetic acid (EDTA), 1 mM phenlymethansulfonylflouride (PMSF)]. Cell debris was removed by centrifugation at 4500 rpm for 5 min at 4 °C and filtration through a 0.2 μm syringe filter. Protein concentration was determined using a Bradford (Bio‐Rad) or bicinchonic acid (BCA) assay.
2.3. Quantitative proteome comparison
Quantitative proteome comparison by differential dimethylation was performed as described previously (Tholen et al., 2013, 2011). Briefly, CCM was concentrated by ultra‐filtration (5 kDa molecular weight cut‐off (MWCO; Vivascience) followed by precipitation with acetone–methanol or trichloracetic acid. The protein pellet was re‐solubilized in ice‐cold 100 mM NaOH using ultrasonication. After adjusting the pH to 8.0 using HEPES, the samples were trypsinized (1:100; sequencing grade trypsin, Worthington; for 16 h at 37 °C), reduced (2 mM tris(2‐carboxyethyl)phosphine (TCEP; Sigma), 1 h at 37 °C), and alkylated (10 mM iodoacetamide (Sigma) at 37 °C for 1 h followed by 5 mM dithiothreitol (DTT; Sigma), 20 min at 22 °C for quenching). Isotopic labels were introduced by reductive dimethylation of primary amines using either light (12COH2; Sigma) or heavy (13COD2; Cambridge Isotopes) formaldehyde (FA). Samples were incubated with 20 mM of the given formaldehyde isotope and 20 mM of sodium cyanoborohydride (ALD coupling solution, Sterogene) for 16 h at 37 °C. Excess reagents were quenched with 20 mM glycine (20 min, 22 °C). Equal amounts of heavy and light labeled samples were mixed, desalted using C18 solid phase extraction (Waters) according to manufacturer's instruction, and fractionated by strong cation exchange (SCX) chromatography as described previously (Tholen et al., 2011) prior to liquid chromatography‐tandem mass spectrometry (LC‐MS/MS) analysis (see corresponding section).
2.4. Terminal Amine Isotopic Labeling of Substrates
Terminal Amine Isotopic Labeling of Substrates (TAILS) (Kleifeld et al., 2010) was performed as described previously (Tholen et al., 2013, 2011). Briefly, the CCM was concentrated by ultrafiltration (5 kDa MWCO) followed by precipitation with acetone–methanol or trichloracetic acid. The protein pellet was re‐solubilized in ice‐cold 100 mM NaOH and 3 M guanidine hydrochloride using ultrasonication. After adjusting the pH to 8.0 using HEPES, the samples were reduced (5 mM DTT for 1 h at 37 °C), alkylated (15 mM iodoacetamide in the dark for 30 min at 22 °C) with quenching of excess iodoacetamide (5 mM DTT for 30 min at 22 °C). Samples were labeled by dimethylation using 20 mM light (12COH2; Sigma) or heavy (13COD2; Cambridge Isotopes) formaldehyde in the presence of 20 mM NaCNBH3 (for 18 h at 37 °C). After quenching of excess reagents with 50 mM Tris–Cl, pH 7.5 (for 1 h at 37 °C), samples were mixed at equal amounts, acetone precipitated and re‐solubilized with 100 mM ice‐cold NaOH as described for quantitative proteome comparison. The pH was adjusted to 8.0 with HEPES‐free acid, trypsinized (1:100; for 18 h at 37 °C), and purified using Sep‐Pak C18 solid‐phase extraction columns (Waters) according to manufacturer's instructions. Samples were eluted in 80% acetonitrile, pH was adjusted to 7.0 and acetonitrile removed by vacuum evaporation, followed by volume adjustment with water. Internal peptides bearing free N‐termini were coupled to an aldehyde‐functionalized polymer (Kleifeld et al., 2010) in the presence of 50 mM sodium cyanoborohydride (Sterogene). Excess reagents were quenched with 100 mM glycine for 1 h at room temperature. The sample was applied to a 10 kDa MWCO filter. The flow‐through was desalted, fractionated by strong cation exchange (SCX) chromatography, and analyzed by LC‐MS/MS.
2.5. LC‐MS/MS analysis
For nanoflow‐LC‐MS/MS analysis, samples for quantitative proteomic comparison were analyzed on a Qstar Elite (AB Sciex) and TAILS samples for quantitative proteomic comparison on an Orbitrap XL (Thermo Scientific GmbH) mass spectrometer. Both instruments were coupled to an Ultimate3000 micro pump (Thermo Scientific) with a flow rate of 300 nl/min each. Buffer A was 0.5% acetic acid, and buffer B was 0.5% acetic acid in 80% acetonitrile (water and acetonitrile were at least HPLC gradient grade quality). A gradient of increasing organic proportion was used for peptide separation. Column‐tips with 75 μm inner diameter and a length of 11 cm were self‐packed (Olsen et al., 2004) with Reprosil‐Pur 120 ODS‐3 (Dr. Maisch, Ammerbuch, Germany). The MS operated in data dependent mode, with the SMART being used for the QSTAR Elite. For the Orbitrap XL, each MS scan was followed by a maximum of five MS/MS scans; in case of the Qstar Elite of three MS/MS scans.
2.6. LC‐MS/MS data analysis: quantitative proteome comparison
Raw QSTAR LC‐MS/MS data in wiff format was converted to the mzXML (Pedrioli et al., 2004) format, using mzWiff (version 4.3.1, http://sourceforge.net/projects/sashimi/files/mzWiff%20(Analyst%20converter), with centroiding of MS1 and MS2 data, precursor charge determination, and deisotoping of MS2 data. For spectrum to sequence assignment X! Tandem (version 2010.12.01) (Craig and Beavis, 2004) was used. The proteome database consisted of human reviewed canonical uniprot sequences (without isoforms) downloaded from UniProt on February 28, 2012. It consists of 20,240 real protein entries. It was appended with an equal number of shuffled decoy entries derived from the original human protein sequences. The decoy sequences were generated with the software DB toolkit (Martens et al., 2005). Two different searches were conducted for light and heavy labeled peptides. X! Tandem parameters included: asymmetric pre‐cursor mass error of 0–200 ppm, fragment ion mass tolerance of 0.2 Da, tryptic cleavage specificity with no missed cleavage sites, residue modifications: cysteine carboxyamidomethylation (+57.02 Da), lysine and N‐terminal dimethylation (light formaldehyde 28.03 Da; heavy formaldehyde 34.06 Da); no variable modifications. X! Tandem results were further validated by PeptideProphet (Keller et al., 2002) at a confidence level of >95%. Peptides were assembled to proteins using ProteinProphet (Nesvizhskii et al., 2003). For relative peptide and protein quantification ASAPRatio (Li et al., 2003) was used. ASAPRatio results were validated by XPRESS (Han et al., 2001) as described previously (Tholen et al., 2013). Proteins were only considered if ASAPratio and XPRESS yielded convergent results. Mass tolerance for quantification was 0.1 Da. Ratios of each dataset were calculated as KLK expression over controls. ASAPratio data was log2‐transformed. ASAPRatio p‐values were merged using Fisher's exact test. A combined p‐value was calculated according to the distribution. Protein abundance was considered to be significantly altered if the following conditions were met: (A) the protein was identified in all three replicate experiments, (B) merged ASAPRatio p‐value < 0.1, (C) protein abundance was either increased or decreased in all three replicate experiments. Since this work focuses on secreted proteins, only the secreted proteins were further considered. A protein was considered to be secreted or cell surface localized if its GO (Gene Ontology) cellular compartment information or its SwissProt localization information featured one of the following terms: secreted, extracellular, surface, integral to membrane.
2.7. LC‐MS/MS data analysis: Terminal Amine Isotopic Labeling of Substrates
Orbitrap LC‐MS/MS data in raw format was converted to the mzXML (Pedrioli et al., 2004) format, using msconvert (Kessner et al., 2008) with centroiding of MS1 and MS2 data, and deisotoping of MS2 data. For spectrum to sequence assignment X! Tandem (Version 2010.12.01) (Craig and Beavis, 2004) was used with the same database described for “LC‐MS/MS data analysis: quantitative proteome comparison”. Two different searches were conducted for light and heavy labeled peptides. X! Tandem parameters included: pre‐cursor mass error of ±10 ppm, fragment ion mass tolerance of 0.3 Da, semi‐specific cleavage C‐terminal to arginine residues (“Semi Arg‐C specificity”) with up to three missed cleavages, residue modifications: cysteine carboxyamidomethylation (+57.02 Da), lysine and N‐terminal dimethylation (light formaldehyde 28.03 Da; heavy formaldehyde 34.06 Da); no variable modifications. X! Tandem results were further validated by PeptideProphet (Keller et al., 2002) at a confidence level of >95%. For relative peptide and protein quantification ASAPRatio (Li et al., 2003) was used. ASAPRatio results were validated by XPRESS (Zhang et al., 2003) as described previously (Tholen et al., 2013). Peptides were only considered if ASAPratio and XPRESS yielded convergent results. Two TAILS experiments were performed. Ratios of each dataset were calculated as KLK expression over controls. Ratios were divided into the following quantiles 0–20, 20–80, and 80–100. N‐termini were considered as decreased if found in the quantile 0–20 in both replicates or as increased if found in the quantile 80–100 in both replicates. Further analysis focused particularly on secreted proteins as described in “LC‐MS/MS data analysis: quantitative proteome comparison”.
2.8. Western blotting
The CCM was prepared as described above. Total cell extracts were prepared by on plate lysis with 50 mM Tris–Cl, pH 8.0, 150 mM NaCl, 0.5% sodium deoxycholate, 0.1% SDS. Samples were separated by SDS‐polyacrylamide gels (see Figures for details) and transferred on polyvinylidene fluoride (PVDF) membrane using a semidry blotting system (BioRad). Primary antibodies [PEDF (1:1000, R&D Systems, AF1177), L1CAM (1:1000, R&D Systems, AF277); LAP (TGFβ‐1 prodomain) (1:1000, R&D Systems, AF246NA); tubulin (1:1000, Sigma, T6199), TGFβ‐1 (1:200, R&D Systems, AF7555)] were incubated for 18 h at 4 °C. After washing, the membranes were incubated for 18 h at 4 °C with horseradish peroxidase‐coupled secondary antibodies (goat, Dianova or sheep, Sigma). After further washing, the membranes were developed with the West Pico chemiluminescent substrate (Pierce), and peroxidase activity detected with a LumiImager device (Roche).
2.9. Immunohistochemical analysis of tumor xenografts
To evaluate the relevance of LAP/TGFβ‐1 and L1CAM expression in vivo, serial sections (5 μm) of tumor xenografts derived from a recently developed ovarian cancer animal model (Loessner et al., 2013) were obtained and immunohistochemically processed. Briefly, antigen retrieval was performed by 95 °C treatment in 0.01 M Tris–EDTA buffer (pH 8.0) followed by incubation of anti‐LAP (R&D Systems, AF246NA) and anti‐L1CAM (R&D Systems, AF277) antibodies (5 μg/ml) for 1 h at room temperature. The horseradish peroxidise (anti‐goat) polymer detection system with 3,3′‐diaminobenzidine as the chromogen (R&D Systems) was used. Sections were counterstained with Mayer's hematoxylin. Goat IgG (Sigma–Aldrich) replacing the primary antibodies served as negative control. Human‐derived liver metastasis served as positive control staining imaged using a widefield microscope (LaborLux, Leitz; DXM1200C digital camera, Nikon; ACT‐1C software v.1.01) with a 20× air objective.
3. Results and discussion
3.1. Global proteome comparison
3.1.1. Overview and overlap of individual replicates
Since KLKs are secreted proteases, we initially aimed to investigate how their expression modifies the extracellular proteome composition of ovarian cancer cells. Three replicates were performed for the global secretome comparison. In each case, CCM from KLK4–7 co‐transfected OV‐MZ‐6 cells was compared to CCM of controls. Differential labeling with isotopic formaldehyde variants was performed for quantitative comparison. These experiments identified and quantified 1390, 1474, and 1477 proteins respectively (Sup. Tables S1–S3). Based on gene ontology (GO) and SwissProt annotation the fraction of secreted and/or cell surface‐associated proteins was 26–27%. These values correspond well to the fraction of extracellular and/or transmembrane proteins that were identified from the CCM of lung cancer cells (Planque et al., 2009), breast cancer cells (Kulasingam and Diamandis, 2007) and mouse embryonic fibroblasts (Tholen et al., 2011). In each replicate, the fold‐change (Fc) values (log2 of light to heavy ratios) followed a near normal distribution with most proteins displaying none or very little quantitative alteration (Figure 1a–c). These findings suggest that expression of KLK4–7 results in subtle proteome alterations rather than gross degradation.
Figure 1.
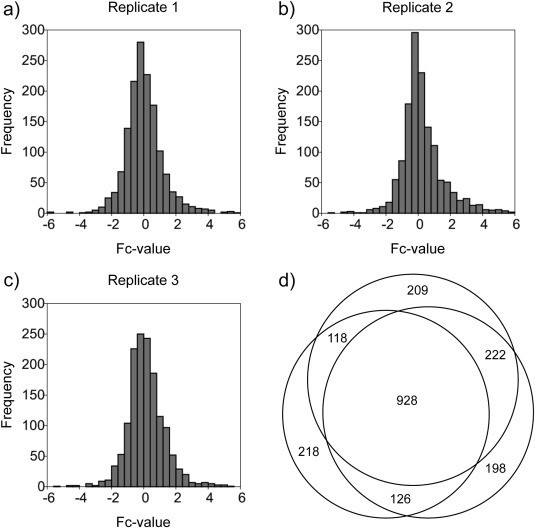
(a–c) Distribution of fold‐change values (log2 of light:heavy ratios) for the three replicate global proteome comparison experiments. (d) Overlap of the three replicate global proteome comparison experiments. 928 proteins were consistently identified and quantified in all three experiments.
In order to delineate consistent proteome changes as a result of KLK expression, this work focuses on proteins that were identified across all three replicates. In total, this was the case for 928 proteins (Figure 1d, Sup. Table S4), of which 273 are annotated as being secreted or cell surface‐associated. The three replicates displayed a high reproducibility of protein quantitation with correlation coefficients between 0.67 and 0.80 (not shown).
3.1.2. Quantitatively affected proteins
Chemical stable isotope labeling was used to allow for relative quantitation of peptides and proteins. The software ASAPRatio was used to calculate peptide ratios together with a p‐value to denote the statistical significance of a protein being quantitatively affected (Li et al., 2003). ASAPRatio p‐values of the three replicates were combined as previously described (Tholen et al., 2013) to yield a merged p‐value. Proteins were considered as being quantitatively affected if the merged p‐value was less than 0.1 in agreement with the original ASAPRatio publication (Keller et al., 2002). Secondly, an increase or decrease by more than 50% in all three replicates must be observed. Lastly, peptide and protein ratios were manually inspected. Of the 273 potentially secreted or shed proteins that were identified in all three replicates, 45 proteins fulfilled these criteria (Table 1).
Table 1.
Significantly affected proteins by KLK4–7 expression. Uniprot ID and recommended name according to Uniprot database (Uniprot Consortium, 2013). p‐value denotes the significance of a protein being quantitatively affected. p‐values of individual experiments were calculated by ASAPratio (Li et al., 2003) and combined using Fisher's method, resulting in a merged p‐value. The cutoff of 0.1 was chosen in agreement with the ASAPratio original publication (Li et al., 2003). Fc‐value (log2 of light:heavy ratio) denotes the average Fc‐value of the three replicates with the corresponding standard deviation value in the following column.
| Uniprot | p‐value | Fc‐value | Std. dev. | Name |
|---|---|---|---|---|
| P41222 | 0.000 | 4.1 | 0.8 | Prostaglandin‐H2 d‐isomerase |
| Q7Z7G0 | 0.000 | 4.4 | 1.1 | Target of Nesh‐SH3 |
| P33908 | 0.000 | −2.4 | 0.4 | Mannosyl‐oligosaccharide 1,2‐alpha‐mannosidase IA |
| P26022 | 0.000 | 3.4 | 0.2 | Pentraxin‐related protein PTX3 |
| O43405 | 0.000 | 3.7 | 1.1 | Cochlin |
| P36955 | 0.000 | 3.6 | 0.3 | Pigment epithelium‐derived factor (PEDF) |
| P24592 | 0.001 | 3.1 | 1.1 | Insulin‐like growth factor‐binding protein (IGFBP) 6 |
| P05997 | 0.001 | 4.9 | 0.5 | Collagen alpha‐2(V) chain |
| P09341 | 0.001 | 2.5 | 1.6 | Growth‐regulated α protein (Gro‐α, C‐X‐C motif chemokine 1, CXCL1) |
| P17936 | 0.001 | 2.7 | 1.3 | Insulin‐like growth factor‐binding protein (IGFBP) 3 |
| P07711 | 0.002 | 2.2 | 0.2 | Cathepsin L1 |
| P53634 | 0.002 | 2.2 | 0.3 | Dipeptidyl peptidase 1 |
| P01034 | 0.003 | 1.9 | 0.2 | Cystatin‐C |
| P10646 | 0.003 | 2.1 | 0.1 | Tissue factor pathway inhibitor |
| Q9UBG0 | 0.004 | −2.6 | 0.9 | C‐type mannose receptor 2 |
| Q08629 | 0.004 | 2.1 | 0.5 | Testican‐1 |
| P49746 | 0.004 | 2.4 | 0.9 | Thrombospondin‐3 |
| P55268 | 0.004 | 2.7 | 0.8 | Laminin subunit β‐2 |
| P49755 | 0.005 | 1.6 | 1.1 | Transmembrane emp24 domain‐containing protein 10 |
| P13987 | 0.005 | 1.7 | 0.5 | CD59 glycoprotein |
| O00300 | 0.009 | −3.6 | 1.7 | Osteoprotegerin |
| O94907 | 0.009 | 2.1 | 0.5 | Dickkopf‐related protein (DKK)‐1 |
| P01024 | 0.010 | 2.2 | 0.6 | Complement C3 |
| P32004 | 0.010 | 2.0 | 0.3 | Neural cell adhesion molecule L1 |
| Q9H3T2 | 0.013 | −1.4 | 1.3 | Semaphorin‐6C |
| P12109 | 0.015 | 1.9 | 0.6 | Collagen α‐1(VI) chain |
| Q96EU7 | 0.015 | 2.1 | 2.4 | C1GALT1‐specific chaperone 1 |
| Q99542 | 0.025 | 1.6 | 0.5 | Matrix metalloproteinase‐19 |
| P09603 | 0.027 | 1.6 | 1.4 | Macrophage colony‐stimulating factor (MCSF)‐1 |
| O95407 | 0.033 | 1.5 | 0.4 | Tumor necrosis factor receptor superfamily member 6B |
| Q9BTY2 | 0.038 | 1.5 | 0.5 | Plasma alpha‐L‐fucosidase |
| P01137 | 0.041 | 1.6 | 0.5 | Transforming growth factor (TGF)β‐1 |
| Q14563 | 0.042 | 1.7 | 0.2 | Semaphorin‐3A |
| P02786 | 0.043 | 1.9 | 0.1 | Transferrin receptor protein 1 |
Out of the 45 significantly affected proteins, 39 were increased in abundance and only 6 were decreased in abundance. These findings suggest that kallikreins 4–7 expression does not result in major degradation, although biochemically various kallikreins are able to degrade proteins, such as insulin growth factor binding proteins (IGFBPs) (Matsumura et al., 2005). Rather, KLK4–7 expression appears to regulate cell–cell communication. This notion was supported upon closer inspection of the affected proteins. Examples of affected proteins with roles in cell–cell communication include IGFBP‐3 and ‐6, semaphorins 3A and 6C, osteoprotegerin, dickkopf‐related protein 1 (DKK‐1), C‐X‐C motif chemokine 1 (CXCL1), macrophage colony stimulating factor 1 (MCSF‐1), pigment epithelium‐derived factor (PEDF), latent TGFβ binding protein 3 (LTGFBP‐3), and TGFβ‐1.
On the other hand, only few ECM components or matricellular proteins were affected, such as cochlin, laminin β2, collagens XVIII and V. For collagen XVIII, almost all identified peptides mapped to its non‐collagenous C‐terminal domain, which includes the anti‐angiogenic cleavage product endostatin (Figure 2). Similarly, for collagen V, almost all identified peptides mapped to its non‐collagenous C‐terminal prodomain (data not shown). These observations highlight the importance of peptide mapping for the functional interpretation of proteomic data.
Figure 2.
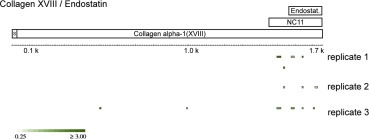
Peptide mapping for collagen XVIII. Tryptic collagen XVIII peptides that were identified in the global secretome comparison are mapped on the collagen XVIII sequence. In all three replicates, peptides cluster in the C‐terminal non‐collagenous region, which encompasses the anti‐angiogenic cleavage product endostatin. S, signal peptide; NC, non‐collagenous domain. The color scale indicates the Fc‐values of the individual peptides.
To support our quantitative proteomic results, we validated the differential ratios for PEDF, thrombospondin‐1, L1CAM, and TGFβ‐1 by immunoblotting. For all four proteins, immunoblotting results are in line with quantitative proteomic results (Figure 3). PEDF massively increases in abundance upon combined expression of KLK4–7 (Figure 3a) whereas thrombospondin‐1 levels decrease (Figure 3b). L1CAM, and TGFβ‐1 are discussed in detail below.
Figure 3.
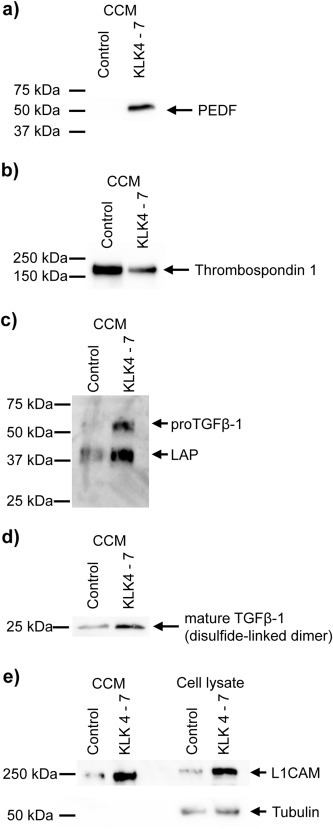
(a,b) Western blot detection of PEDF and thrombospondin‐1 in cell conditioned medium. 30 μg proteome were used with a 12.5% reducing SDS‐PAGE. (c) Western blot detection of LAP/TGFβ‐1 in cell conditioned medium. 8 μg proteome were used with a 12.5% reducing SDS‐PAGE. The primary antibody was directed against the LAP domain (prodomain). In line with previous reports (Dubois et al., 1995), the ∼55 kDa band is thought to represent proTGFβ‐1 whereas the predominant ∼40 kDa band is thought to represent LAP. The elevated size in comparison to the primary sequence is thought to stem from glycosylation (Brunner et al., 1992; Dubois et al., 1995). (d) Western blot detection of mature TGFβ‐1 (disulfide linked dimer) in cell conditioned medium. 30 μg proteome were used with a 12.5% non‐reducing SDS‐PAGE. The primary antibody was directed against the actual TGFβ‐1 domain. In addition, N‐terminal degradomics showed TGFβ‐1 activation (see corresponding section). (e) Western blot detection of L1CAM in cell conditioned medium (CCM) and total cell lysate, including cell surface proteins. 8 μg (CCM) and 12 μg proteome (total cell lysate), respectively, were separated with a 7.5% reducing SDS‐PAGE. The molecular weight of 220 kDa for L1CAM is higher than expected but in line with previous reports (Li and Galileo, 2010).
A vast body of literature links kallikrein expression to unfavorable prognosis in different tumor entities (see also Introduction). Based on this general picture, we investigated, whether affected proteins rather bear a pro‐ or anti‐tumorigenic signature. However, a predominant pro‐ or anti‐tumorigenic effect of KLK expression was not detected. For example, the group of proteins with increased abundance features tumor suppressors such as PEDF (Becerra and Notario, 2013) as well as tumor‐promoting proteins, such as DKK‐1 (Pinzone et al., 2009; Yang et al., 2013). The present data shows a prominent effect of KLK 4–7 expression on proteins with relevant roles in tumor biology but without a clear pro‐ or anti‐tumorigenic signature. Accordingly, the proteomic data does not necessarily imply that expression of KLK4–7 has a predominant pro‐tumorigenic effect.
3.1.3. Transforming growth factor β‐1 signaling
TGFβ‐1 plays a central role in cancer biology. The biological and cellular context determines the role of TGFβ‐1 in tumorigenesis, which can be either tumor‐promoting or tumor‐suppressing (Joshi and Cao, 2010). In early stages of tumorigenesis, TGFβ‐1 is thought to be tumor suppressive through pro‐apoptotic activity. In later stages of tumorigenesis, TGFβ‐1 is thought to facilitate metastasis by promoting cell migration and invasion in a process resembling an epithelial‐mesenchymal transition (EMT) (Heldin et al., 2012).
TGFβ‐1 is synthesized as an inactive precursor with an N‐terminal prodomain (also called latency‐associated protein, LAP), which is proteolytically removed for activation of the C‐terminal TGFβ‐1 domain. Cleavage is typically performed by furin‐like proteases (Dubois et al., 1995), although activating cleavage by KLK proteases has been suggested (Emami and Diamandis, 2007; Matsumura et al., 2005). LAP covalently binds to LTGFBPs through disulfide bonds (Hyytiäinen et al., 2004). LTGFBPs further bind to ECM proteins, thereby spatially fixing latent TGFβ. In the present study, elevated levels of LAP/proTGFβ‐1 were supported by immunoblotting using an antibody that targets LAP (Figure 3c). Secondly, elevated levels of mature TGFβ‐1 were corroborated by immunoblotting using an antibody that targets the actual TGFβ‐1 domain (Figure 3d). Finally, N‐terminal degradomics showed TGFβ‐1 activation (see corresponding section). Collectively, these findings suggest increased TGFβ‐1 signaling.
TGFβ‐1 signaling is known to cause increased L1CAM expression (Kiefel et al., 2012). We corroborated L1CAM levels elevated by immunoblotting (Figure 3e). There are two possible reasons for the raised levels of the shed L1CAM ectodomain: increased cell‐surface proteolysis (with subsequent depletion of membrane bound L1CAM) or elevated levels of cell‐associated L1CAM possibly representing higher L1CAM expression. Western blotting showed higher cell‐associated levels of L1CAM (Figure 3e) suggesting its increased expression.
Importantly, elevated levels of LAP/proTGFβ‐1 and L1CAM upon expression of KLK4–7 were corroborated in vivo by immunohistochemical analysis of tumor xenografts derived from an ovarian cancer animal model (Loessner et al., 2013) (Figure 4).
Figure 4.
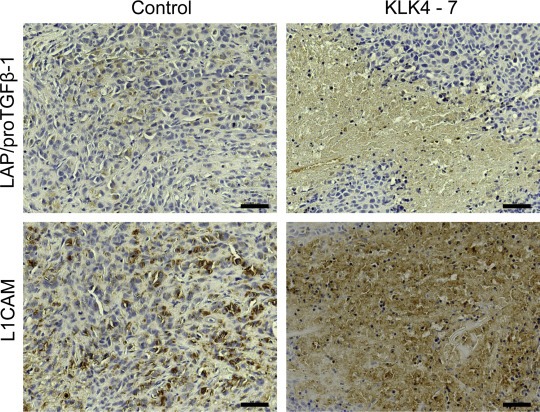
Immunohistochemical detection of TGFβ‐1 and L1CAM expression in xenografts derived from mice bearing KLK4–7 co‐transfected OV‐MZ‐6 cell and control tumors. A positive staining for both proteins was detected in the cytoplasm, with a more intense staining upon KLK4–7 expression. Scale bars, 50 μm.
The cellular phenotype of the KLK4–7 co‐expressing ovarian cancer cells also supports increased levels of TGFβ‐1 signaling. These cells are less adhesive and more invasive than their wild type counterparts (Loessner et al., 2012; Prezas et al., 2006). In good agreement, expression of KLK4 in PC3 prostate cancer cells leads to a more migratory phenotype (Veveris‐Lowe et al., 2005). Similarly, expression of KLK6 in murine keratinocytes results in a more migratory and invasive behavior (Klucky et al., 2007). In epithelial cells, TGFβ‐1 is known to induce a more motile cellular phenotype (Kalluri and Weinberg, 2009), which is considered a hallmark of TGFβ‐1 signaling. A prototypical feature of TGFβ‐1 signaling is loss of epithelial cadherin (E‐cadherin) expression. However, previous studies have determined that the OV‐MZ‐6 cell line does not express E‐cadherin ab initio and represents the advanced disease stage (Loessner et al., 2012, 2013).
In summary, our quantitative secretome analysis shows elevated LAP/proTGFβ‐1 expression in OV‐MZ‐6 cells co‐expressing KLK4–7. This is validated in vivo using tumor xenografts. Several lines of evidence further support elevated TGFβ‐1 signaling, including identification of mature, bioactive TGFβ‐1, increased L1CAM expression, and a previously identified more motile cellular phenotype (Loessner et al., 2012; Prezas et al., 2006). proTGFβ‐1 activation by KLK proteases has been proposed (Emami and Diamandis, 2007; Matsumura et al., 2005). Our study shows a strong association between KLK expression and TGFβ‐1 signaling in a cellular context.
3.2. Quantitative profiling of proteolytic cleavage sites
To identify cleavage events that are overrepresented upon expression of KLK4–7, Terminal Amine Isotopic Labeling of Substrates (TAILS) was used (Kleifeld et al., 2010). TAILS is a proteomic method that specifically analyzes protein N‐termini, including proteolytically generated N‐termini. Through stable isotopic labeling, the N‐terminome of kallikreins 4–7 co‐expressing OV‐MZ‐6 cells was quantitatively compared to the N‐terminome of the corresponding control cells. More specifically, this analysis focuses on the cellular secretome.
3.2.1. Overview and overlap of individual TAILS replicates
Two replicates were performed for the N‐terminal analysis based on CCM from OV‐MZ‐6 cells that express KLK4–7 in comparison to OV‐MZ‐6 vector control cells. These experiments identified and quantified 2435 and 1402 protein N‐termini respectively (Sup. Tables S5, S6). Based on GO and SwissProt annotation, 41% and 34% map to secreted and/or cell surface‐associated proteins. These fractions are slightly elevated compared to the quantitative proteome profiling, possibly indicating the importance of proteolysis as a posttranslational modification in the extracellular milieu.
Most N‐termini display Fc‐values (log2 of light:heavy ratio) close to 0 indicating that they were not quantitatively affected by expression of KLK4–7 (Figure 5). This observation is in line with the global proteome comparison, which also highlights that kallikreins 4–7 expression does not lead to an excessive increase in bulk proteolysis. Both replicates showed few cleavage sites with Fc‐values <−2. At the same time, there was a substantial amount of cleavage sites with Fc‐values >+2. This bias indicates an elevated proteolytic processing in the cellular microenvironment upon expression of KLK4–7, despite the aforementioned absence of excessively increased bulk proteolysis.
Figure 5.
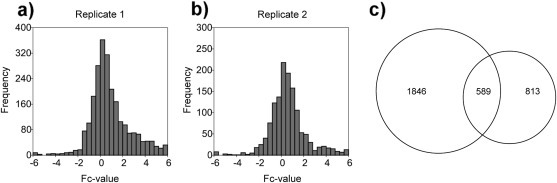
(a–b) Distribution of fold‐change values (log2 of light:heavy ratios) for the two replicate N‐terminomic experiments. (c) Overlap of the two replicate N‐terminomic experiments. 589 cleavage sites were consistently identified and quantified in both experiments.
The two TAILS experiments display an overlap of 589 N‐termini (Figure 5c). The quantitation (as displayed by the corresponding Fc‐values) of these 589 shared identification shows good reproducibility with a correlation coefficient of 0.71 (data not shown). This number is in line with the correlation coefficients that were determined for the replicates of the global proteome analysis.
3.2.2. Kallikreins 4–7 expression yields a “post‐arginine” specificity fingerprint
Proteolytic enzymes have characteristic specificities. As outlined by Debela et al. (2008), KLK4, KLK5 and KLK6 preferentially cleave C‐terminal to arginine whereas KLK7 displays chymotryptic specificity (preferred cleavage C‐terminal to aliphatic and aromatic residues). Borgono et al. corroborate KLK4–7 specificity (Borgoño et al., 2007). At the same time, Debela et al. as well as Yoon et al. have shown that KLK7 cleaves post arginine despite its chymotryptic preference (Debela et al., 2006; Yoon et al., 2007). In the present study, the majority of enriched cleavage sites (Fc‐value > 1) in both replicates occurred C‐terminal to an arginine residue (Figure 6) and only few chymotryptic cleavage sites were observed. This specificity fingerprint corresponds well to the annotated preference of KLK4, KLK5 and KLK6, and possibly also KLK7. These findings strongly indicate a prominent KLK activity in the secretome of KLK4–7 co‐transfected OV‐MZ‐6 cells. The high representation of trypsin‐like as opposed to chymotrypsin‐like activity is not surprising since 3 of the 4 enzymes (KLK4/5/6) have predominant tryptic activity.
Figure 6.
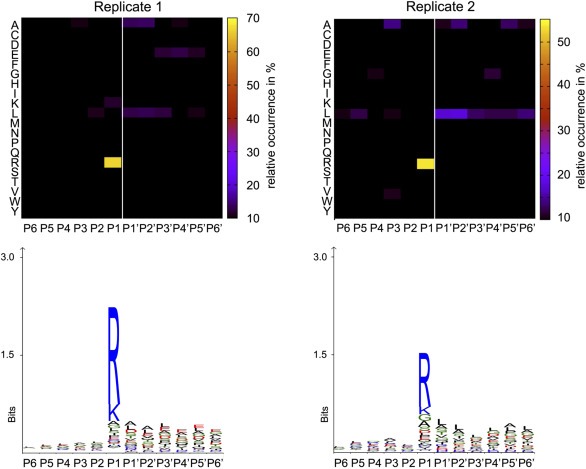
Specificity fingerprint of cleavage sites that are induced by expression of KLK4–7 (quantile 80–100). The white line depicts the scissile peptide bond. The X‐axis shows amino acid positions in relation to the cleavage site. Schechter and Berger nomenclature was used (Schechter and Berger, 1966). Heat map generated as described previously (Schilling et al., 2011). Sequence logos were generated with the iceLogo software (Colaert et al., 2009).
3.2.3. Identification of putative KLK cleavage sites
Proteolysis in OV‐MZ cell conditioned medium was profiled to identify putative KLK substrates. Strict criteria were chosen to select neo‐N‐termini as possible KLK cleavage sites:
-
•
neo‐N‐terminus identified in both replicates (589 cleavage sites)
-
•
maps to a protein that is annotated as being secreted or cell surface‐associated according to GO or SwissProt annotation (236 of the 589 cleavage sites)
-
•
quantitatively enriched upon KLK expression (Fc‐value > 1.0, 91 of the 236 cleavage sites)
-
•
cleavage occurs C‐terminal to an arginine (KLK4, KLK5, KLK6, and possibly also KLK7 specificity) or aromatic residues (KLK7 specificity); our analysis was restricted to canonical KLK specificity (Debela et al., 2008) (61 of the 91 cleavage sites).
-
•
corresponding protein levels are not found to be elevated in global secretome comparison
-
•
neo‐N‐terminus does not represent removal of signal peptide or initiator methionine
14 cleavage sites in a total of 12 different proteins entirely fulfill these strict criteria and represent putative KLK substrates (Figure 7). Kallikrein dependent proteolytic processing of several cell signaling proteins was observed, including growth differentiation factor 15 (GDF‐15), macrophage inhibitory factor (MIF), semaphorin 3C and stanniocalcin‐1. With the exception of agrin, kallikrein dependent proteolysis was not observed for matricelullar proteins or ECM components. The focus on cell–cell communication was in line with the results obtained by global proteomic comparison. Together, both findings strengthen the notion of proteolysis being a regulatory event in cancer cell biology.
Figure 7.
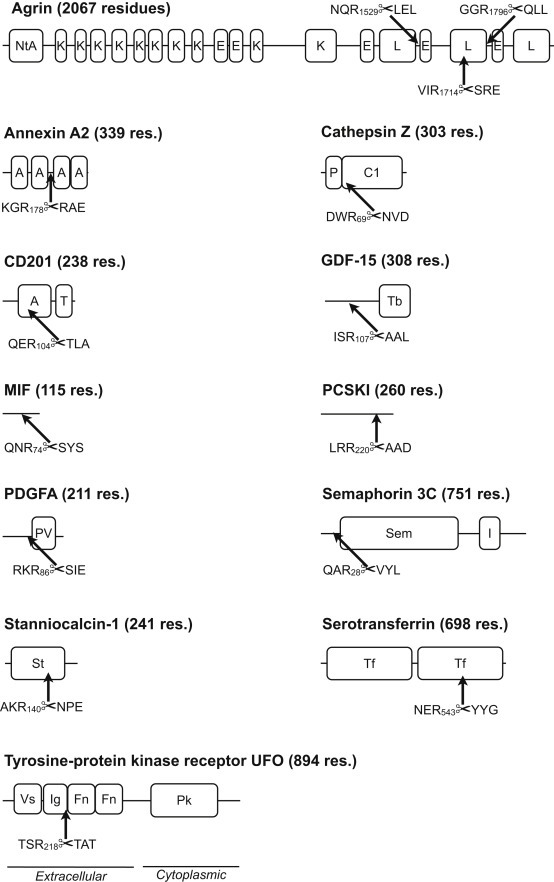
Putative substrates of KLK4–7. Cleavage sites are annotated by arrows. Criteria for selection of cleavage sites are described in the text. Abbreviations used: A, annexin‐like; C1, peptidase C1 domain; GDF, growth differentiation factor; E, epidermal growth factor‐like; Fn, fibronectin type III‐like; I: immunoglobulin I‐set‐like; K, kazal‐like; L, laminin‐like; MIF, macrophage migration inhibitory factor; MHC, major histocompatibility complex‐like; Nta, N‐terminal agrin; P, prodomain; PCSKI, proprotein convertase 1 inhibitor; PDGFA, platelet‐derived growth factor subunit A; Pk, protein tyrosine kinase‐like; PV; platelet‐derived growth factor‐like/vascular endothelial growth factor‐like; Sem, semaphorin‐like; St: stanniocalcin‐like; T, transmembrane; Tb, transforming growth factor‐β‐like; Tf: transferrin‐like.
To a large extent, KLK dependent proteolytic events appear to occur in structurally accessible sites, including domain linker regions present in agrin, annexin A2 and tyrosine‐protein kinase receptor UFO. Similarly, N‐ and C‐terminal regions of proteins are often structurally accessible. In this context, N‐terminal processing of cathepsin Z and semaphorin 3C likely occurs at a structurally accessible site. Proteolysis at structurally accessible sites does not necessitate prior unfolding, and thus, suggests a regulatory rather than a degradative function.
Cleavage sites in proprotein convertase 1 inhibitor (PCSKI), platelet‐derived growth factor subunit A (PDGFA) and stanniocalcin‐1 occur after several basic residues (arginine or lysine). Such sites are typically considered to be targeted by furin‐like proteases, a group which includes proprotein convertases. Specificity profiling of KLK4–6 showed that only KLK6 has a pronounced preference for pairs of basic residues (Borgoño et al., 2007; Debela et al., 2008). The present analysis cannot distinguish increased furin‐like activity as a downstream effect of initial KLK activity. However, the specificity fingerprints (Figure 6) do not show an increased occurrence of cleavage sites at dibasic motives but rather support increased activity of trypsin‐like KLK proteases.
Using a cell model of ovarian cancer, our data shows proteolytic remodeling of the cellular microenvironment by KLK proteases, with a prominent focus on proteins mediating cellular communication. It is beyond the scope of the present work to determine the functional consequences stemming from KLK dependent proteolytic processing. However, it has been shown that proteases can inactivate or functionally convert chemokines through proteolytic processing and generation of stable cleavage products (Broxmeyer et al., 2012; McQuibban et al., 2000).
3.2.4. TGFβ‐1 maturation
Global quantitative proteomic comparison strongly indicates a pronounced effect of KLK expression on TGFβ‐1 levels and subsequent TGFβ signaling (see corresponding section). In good agreement, the N‐terminomic analysis revealed substantially elevated amounts of the mature N‐terminus of the TGFβ‐1 cytokine domain (Figure 8). As stated above, increased occurrence of mature TGFβ‐1 most likely reflects an elevated abundance of the precursor form rather than increased proteolytic processing. The corresponding identification of mature TGFβ‐1 cytokine domain by N‐TAILS complements this finding and points to increased levels of bioactive TGFβ‐1 rather than a sheer accumulation of its inactive precursor.
Figure 8.
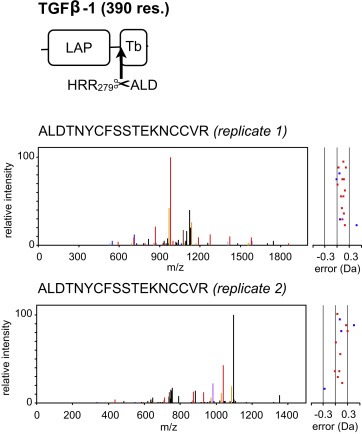
The N‐terminus of mature TGFβ‐1 was identified in both TAILS replicates with elevated abundance upon combined expression of KLK4–7. The tandem mass spectra of the identified sequence ALDTNYCFSSTEKNCCVR (N‐terminus of mature TGFβ‐1) is shown. This finding corroborates elevated levels of mature, bioactive TGFβ‐1.
4. Conclusion
This study focused on the impact of KLK4–7 expression in the OV‐MZ‐6 ovarian cancer cells as numerous studies suggest that KLKs are associated with ovarian cancer. This study addresses the contribution of kallikreins in shaping the cellular microenvironment. The proteomic and degradomic analyses highlight the absence of excessively increased bulk proteolysis but rather support the notion of proteolysis being a regulatory event in cell–cell communication. For example, KLK4–7 expression leads to elevated levels of the pro‐inflammatory proteins CXCL1 and MCSF‐1. Putative KLK substrates include cytokines, such as GDF‐α and MIF. Both experimental setups corroborate induced TGFβ‐1 signaling. While global secretome comparison showed elevated levels of LAP/proTGFβ‐1, TAILS revealed substantially elevated amounts of the mature N‐terminus of the TGFβ‐1 cytokine domain, underlining the increased levels of bioactive TGFβ‐1, which possibly result in the previously described more motile phenotype of kallikrein 4–7 co‐expressing OV‐MZ‐6 cells (Loessner et al., 2012; Prezas et al., 2006). This study emphasizes the major impact of KLK proteases on the extracellular proteome in the tumor microenvironment of ovarian cancer.
Conflict of interest
The authors declare no conflict of interest.
Supporting information
The following are the supplementary data related to this article:
Table S1 Identified and quantified proteins in the first replicate of global secretome comparison. All proteins have a ProteinProphet probability score >0.90, equivalent to an FDR < 0.01. Ratios are normalized to KLK expression/control.
Table S2 Identified and quantified proteins in the second replicate of global secretome comparison. All proteins have a ProteinProphet probability score >0.90, equivalent to an FDR < 0.01. Ratios are normalized to KLK expression/control.
Table S3 Identified and quantified proteins in the third replicate of global secretome comparison. All proteins have a ProteinProphet probability score >0.90, equivalent to an FDR < 0.01. Ratios are normalized to KLK expression/control.
Table S4 Proteins that are identified and quantified in all three replicates of global proteome comparison. Averaged ratios are normalized to KLK expression/control.
Table S5 Analysis of N‐termini that were unmodified upon secretome harvest and chemically dimethylated in the TAILS procedure (replicate 1). This is a non‐redundant, peptide‐centric list, showing up to three proteins for each peptide identification. The X! Tandem hyperscore and the mass deviation in ppm are shown. The overall FDR is <0.05 as calculated by PeptideProphet. The prime sequence was experimentally identified, the corresponding non‐prime sequence was bioinformatically derived. The fold‐change (Fc) value is based on ASAPratio.
Table S6 Analysis of N‐termini that were unmodified upon secretome harvest and chemically dimethylated in the TAILS procedure (replicate 2). This is a non‐redundant, peptide‐centric list, showing up to three proteins for each peptide identification. The X! Tandem hyperscore and the mass deviation in ppm are shown. The overall FDR is <0.05 as calculated by PeptideProphet. The prime sequence was experimentally identified, the corresponding non‐prime sequence was bioinformatically derived. The fold‐change (Fc) value is based on ASAPratio.
Acknowledgment
O.S. is supported by an Emmy‐Noether grant of the Deutsche Forschungsgemeinschaft (DFG, SCHI 871/2), a starting grant of the European Research Council (Programme “Ideas” – Call identifier: ERC‐2011‐StG 282111‐ProteaSys), and the Excellence Initiative of the German Federal and State Governments (EXC 294, BIOSS). J.N.K. acknowledges the Michael Smith Foundation for Health Research (MSFHR) career investigator scholar award. D.L. and J.A.C. are supported by the National Health and Medical Research Council (NHMRC) of Australia (#553045), the Australian Research Council (#DP110103890) and the Cancer Council Queensland (#1034134). J.A.C. is an NHMRC Principal Research Fellow. Part of the research was funded by a mobility grant (Personalized Medicine) from the German Academic Exchange Service (DAAD) to D.L., J.A.C. and V.M. Furthermore, V.M. is supported by the German Federal Ministry of Education and Research, Leading Edge Cluster m4. The authors thank Franz Jehle for excellent technical assistance with mass spectrometry analysis and Bettina Mayer and Manuel Schlimpert for support with Western‐blot experiments.
Supplementary data 1.
Supplementary data related to this article can be found at http://dx.doi.org/10.1016/j.molonc.2013.09.003.
Shahinian Hasmik, Loessner Daniela, Biniossek Martin L., Kizhakkedathu Jayachandran N., Clements Judith A., Magdolen Viktor and Schilling Oliver, (2014), Secretome and degradome profiling shows that Kallikrein‐related peptidases 4, 5, 6, and 7 induce TGFβ‐1 signaling in ovarian cancer cells, Molecular Oncology, 8, doi: 10.1016/j.molonc.2013.09.003.
References
- Aebersold, R. , Mann, M. , 2003. Mass spectrometry-based proteomics. Nature. 422, 198–207. [DOI] [PubMed] [Google Scholar]
- auf dem Keller, U. , Prudova, A. , Eckhard, U. , Fingleton, B. , Overall, C.M. , 2013. Systems-level analysis of proteolytic events in increased vascular permeability and complement activation in skin inflammation. Sci. Signal. 6, rs2 [DOI] [PMC free article] [PubMed] [Google Scholar]
- Becerra, S.P. , Notario, V. , 2013. The effects of PEDF on cancer biology: mechanisms of action and therapeutic potential. Nat. Rev. Cancer. 13, 258–271. [DOI] [PMC free article] [PubMed] [Google Scholar]
- Borgoño, C.A. , Gavigan, J.-A. , Alves, J. , Bowles, B. , Harris, J.L. , Sotiropoulou, G. , Diamandis, E.P. , 2007. Defining the extended substrate specificity of kallikrein 1-related peptidases. Biol. Chem.. 388, 1215–1225. [DOI] [PubMed] [Google Scholar]
- Borgoño, C.A. , Michael, I.P. , Diamandis, E.P. , 2004. Human tissue kallikreins: physiologic roles and applications in cancer. Mol. Cancer Res.. 2, 257–280. [PubMed] [Google Scholar]
- Broxmeyer, H.E. , Hoggatt, J. , O'Leary, H.A. , Mantel, C. , Chitteti, B.R. , Cooper, S. , Messina-Graham, S. , Hangoc, G. , Farag, S. , Rohrabaugh, S.L. , Ou, X. , Speth, J. , Pelus, L.M. , Srour, E.F. , Campbell, T.B. , 2012. Dipeptidylpeptidase 4 negatively regulates colony-stimulating factor activity and stress hematopoiesis. Nat. Med.. 18, 1786–1796. [DOI] [PMC free article] [PubMed] [Google Scholar]
- Brunner, A.M. , Lioubin, M.N. , Marquardt, H. , Malacko, A.R. , Wang, W.C. , Shapiro, R.A. , Neubauer, M. , Cook, J. , Madisen, L. , Purchio, A.F. , 1992. Site-directed mutagenesis of glycosylation sites in the transforming growth factor-beta 1 (TGF beta 1) and TGF beta 2(414) precursors and of cysteine residues within mature TGF beta 1: effects on secretion and bioactivity. Mol. Endocrinol.. 6, 1691–1700. [DOI] [PubMed] [Google Scholar]
- Colaert, N. , Helsens, K. , Martens, L. , Vandekerckhove, J. , Gevaert, K. , 2009. Improved visualization of protein consensus sequences by iceLogo. Nat. Methods. 6, 786–787. [DOI] [PubMed] [Google Scholar]
- Craig, R. , Beavis, R.C. , 2004. TANDEM: matching proteins with tandem mass spectra. Bioinformatics. 20, 1466–1467. [DOI] [PubMed] [Google Scholar]
- Debela, M. , Beaufort, N. , Magdolen, V. , Schechter, N.M. , Craik, C.S. , Schmitt, M. , Bode, W. , Goettig, P. , 2008. Structures and specificity of the human kallikrein-related peptidases KLK 4, 5, 6, and 7. Biol. Chem.. 389, 623–632. [DOI] [PubMed] [Google Scholar]
- Debela, M. , Magdolen, V. , Schechter, N. , Valachova, M. , Lottspeich, F. , Craik, C.S. , Choe, Y. , Bode, W. , Goettig, P. , 2006. Specificity profiling of seven human tissue kallikreins reveals individual subsite preferences. J. Biol. Chem.. 281, 25678–25688. [DOI] [PubMed] [Google Scholar]
- Diamandis, E.P. , Borgono, C.A. , Scorilas, A. , Yousef, G.M. , Harbeck, N. , Dorn, J. , Schmalfeldt, B. , Schmitt, M. , 2003. Immunofluorometric quantification of human kallikrein 5 expression in ovarian cancer cytosols and its association with unfavorable patient prognosis. Tumour Biol.. 24, 299–309. [DOI] [PubMed] [Google Scholar]
- Diamandis, E.P. , Yousef, G.M. , Clements, J. , Ashworth, L.K. , Yoshida, S. , Egelrud, T. , Nelson, P.S. , Shiosaka, S. , Little, S. , Lilja, H. , Stenman, U.H. , Rittenhouse, H.G. , Wain, H. , 2000. New nomenclature for the human tissue kallikrein gene family. Clin. Chem.. 46, 1855–1858. [PubMed] [Google Scholar]
- Dong, Y. , Kaushal, A. , Bui, L. , Chu, S. , Fuller, P.J. , Nicklin, J. , Samaratunga, H. , Clements, J.A. , 2001. Human kallikrein 4 (KLK4) is highly expressed in serous ovarian carcinomas. Clin. Cancer Res.. 7, 2363–2371. [PubMed] [Google Scholar]
- Dong, Y. , Tan, O.L. , Loessner, D. , Stephens, C. , Walpole, C. , Boyle, G.M. , Parsons, P.G. , Clements, J.A. , 2010. Kallikrein-related peptidase 7 promotes multicellular aggregation via the alpha(5)beta(1) integrin pathway and paclitaxel chemoresistance in serous epithelial ovarian carcinoma. Cancer Res.. 70, 2624–2633. [DOI] [PubMed] [Google Scholar]
- Dubois, C.M. , Laprise, M.H. , Blanchette, F. , Gentry, L.E. , Leduc, R. , 1995. Processing of transforming growth factor beta 1 precursor by human furin convertase. J. Biol. Chem.. 270, 10618–10624. [DOI] [PubMed] [Google Scholar]
- Emami, N. , Diamandis, E.P. , 2007. Human tissue kallikreins: a road under construction. Clin. Chim. Acta. 381, 78–84. [DOI] [PubMed] [Google Scholar]
- Ghosh, M.C. , Grass, L. , Soosaipillai, A. , Sotiropoulou, G. , Diamandis, E.P. , 2004. Human kallikrein 6 degrades extracellular matrix proteins and may enhance the metastatic potential of tumour cells. Tumour Biol.. 25, 193–199. [DOI] [PubMed] [Google Scholar]
- Han, D.K. , Eng, J. , Zhou, H. , Aebersold, R. , 2001. Quantitative profiling of differentiation-induced microsomal proteins using isotope-coded affinity tags and mass spectrometry. Nat. Biotechnol.. 19, 946–951. [DOI] [PMC free article] [PubMed] [Google Scholar]
- Heldin, C.-H. , Vanlandewijck, M. , Moustakas, A. , 2012. Regulation of EMT by TGFβ in cancer. FEBS Lett.. 586, 1959–1970. [DOI] [PubMed] [Google Scholar]
- Hoffman, B.R. , Katsaros, D. , Scorilas, A. , Diamandis, P. , Fracchioli, S. , Rigault de la Longrais, I.A. , Colgan, T. , Puopolo, M. , Giardina, G. , Massobrio, M. , Diamandis, E.P. , 2002. Immunofluorometric quantitation and histochemical localisation of kallikrein 6 protein in ovarian cancer tissue: a new independent unfavourable prognostic biomarker. Br. J. Cancer. 87, 763–771. [DOI] [PMC free article] [PubMed] [Google Scholar]
- Hyytiäinen, M. , Penttinen, C. , Keski-Oja, J. , 2004. Latent TGF-beta binding proteins: extracellular matrix association and roles in TGF-beta activation. Crit. Rev. Clin. Lab Sci.. 41, 233–264. [DOI] [PubMed] [Google Scholar]
- Jefferson, T. , Auf dem Keller, U. , Bellac, C. , Metz, V.V. , Broder, C. , Hedrich, J. , Ohler, A. , Maier, W. , Magdolen, V. , Sterchi, E. , Bond, J.S. , Jayakumar, A. , Traupe, H. , Chalaris, A. , Rose-John, S. , Pietrzik, C.U. , Postina, R. , Overall, C.M. , Becker-Pauly, C. , 2013. The substrate degradome of meprin metalloproteases reveals an unexpected proteolytic link between meprin beta and ADAM10. Cell Mol. Life Sci.. 70, 309–333. [DOI] [PMC free article] [PubMed] [Google Scholar]
- Joshi, A. , Cao, D. , 2010. TGF-beta signaling, tumor microenvironment and tumor progression: the butterfly effect. Front Biosci.. 15, 180–194. [DOI] [PubMed] [Google Scholar]
- Kalluri, R. , Weinberg, R.A. , 2009. The basics of epithelial-mesenchymal transition. J. Clin. Invest. 119, 1420–1428. [DOI] [PMC free article] [PubMed] [Google Scholar]
- Keller, A. , Nesvizhskii, A.I. , Kolker, E. , Aebersold, R. , 2002. Empirical statistical model to estimate the accuracy of peptide identifications made by MS/MS and database search. Anal Chem.. 74, 5383–5392. [DOI] [PubMed] [Google Scholar]
- Kessner, D. , Chambers, M. , Burke, R. , Agus, D. , Mallick, P. , 2008. ProteoWizard: open source software for rapid proteomics tools development. Bioinformatics. 24, 2534–2536. [DOI] [PMC free article] [PubMed] [Google Scholar]
- Kiefel, H. , Bondong, S. , Pfeifer, M. , Schirmer, U. , Erbe-Hoffmann, N. , Schafer, H. , Sebens, S. , Altevogt, P. , 2012. EMT-associated up-regulation of L1CAM provides insights into L1CAM-mediated integrin signalling and NF-kappaB activation. Carcinogenesis. 33, 1919–1929. [DOI] [PubMed] [Google Scholar]
- Kim, H. , Scorilas, A. , Katsaros, D. , Yousef, G.M. , Massobrio, M. , Fracchioli, S. , Piccinno, R. , Gordini, G. , Diamandis, E.P. , 2001. Human kallikrein gene 5 (KLK5) expression is an indicator of poor prognosis in ovarian cancer. Br. J. Cancer. 84, 643–650. [DOI] [PMC free article] [PubMed] [Google Scholar]
- Kleifeld, O. , Doucet, A. , auf dem Keller, U. , Prudova, A. , Schilling, O. , Kainthan, R.K. , Starr, A.E. , Foster, L.J. , Kizhakkedathu, J.N. , Overall, C.M. , 2010. Isotopic labeling of terminal amines in complex samples identifies protein N-termini and protease cleavage products. Nat. Biotechnol.. 28, 281–288. [DOI] [PubMed] [Google Scholar]
- Klucky, B. , Mueller, R. , Vogt, I. , Teurich, S. , Hartenstein, B. , Breuhahn, K. , Flechtenmacher, C. , Angel, P. , Hess, J. , 2007. Cancer Res.. 67, 8198–8206. [DOI] [PubMed] [Google Scholar]
- Kountourakis, P. , Psyrri, A. , Scorilas, A. , Camp, R. , Markakis, S. , Kowalski, D. , Diamandis, E.P. , Dimopoulos, M.A. , 2008. Prognostic value of kallikrein-related peptidase 6 protein expression levels in advanced ovarian cancer evaluated by automated quantitative analysis (AQUA). Cancer Sci.. 99, 2224–2229. [DOI] [PMC free article] [PubMed] [Google Scholar]
- Kulasingam, V. , Diamandis, E.P. , 2007. Proteomics analysis of conditioned media from three breast cancer cell lines: a mine for biomarkers and therapeutic targets. Mol. Cell Proteomics. 6, 1997–2011. [DOI] [PubMed] [Google Scholar]
- Kyriakopoulou, L.G. , Yousef, G.M. , Scorilas, A. , Katsaros, D. , Massobrio, M. , Fracchioli, S. , Diamandis, E.P. , 2003. Prognostic value of quantitatively assessed KLK7 expression in ovarian cancer. Clin. Biochem.. 36, 135–143. [DOI] [PubMed] [Google Scholar]
- Li, X.J. , Zhang, H. , Ranish, J.A. , Aebersold, R. , 2003. Automated statistical analysis of protein abundance ratios from data generated by stable-isotope dilution and tandem mass spectrometry. Anal Chem.. 75, 6648–6657. [DOI] [PubMed] [Google Scholar]
- Li, Y. , Galileo, D.S. , 2010. Soluble L1CAM promotes breast cancer cell adhesion and migration in vitro, but not invasion. Cancer Cell Int.. 10, 34 [DOI] [PMC free article] [PubMed] [Google Scholar]
- Loessner, D. , Quent, V.M.C. , Kraemer, J. , Weber, E.C. , Hutmacher, D.W. , Magdolen, V. , Clements, J.A. , 2012. Combined expression of KLK4, KLK5, KLK6, and KLK7 by ovarian cancer cells leads to decreased adhesion and paclitaxel-induced chemoresistance. Gynecol. Oncol.. 127, 569–578. [DOI] [PubMed] [Google Scholar]
- Loessner, D. , Little, J.P. , Pettet, G.J. , Hutmacher, D.W. , 2013. A multiscale road map of cancer spheroids - incorporating experimental and mathematical modelling to understand cancer progression. J. Cell Sci.. 126, 2761–2771. [DOI] [PubMed] [Google Scholar]
- Loessner, D. , Stok, K.S. , Lutolf, M.P. , Hutmacher, D.W. , Clements, J.A. , Rizzi, S.C. , 2013. Bioengineered 3D platform to explore cell-ECM interactions and drug resistance of epithelial ovarian cancer cells. Biomaterials. 31, 8494–8506. [DOI] [PubMed] [Google Scholar]
- López-Otín, C. , Matrisian, L.M. , 2007. Emerging roles of proteases in tumour suppression. Nat. Rev. Cancer. 7, 800–808. [DOI] [PubMed] [Google Scholar]
- Lu, K.H. , Patterson, A.P. , Wang, L. , Marquez, R.T. , Atkinson, E.N. , Baggerly, K.A. , Ramoth, L.R. , Rosen, D.G. , Liu, J. , Hellstrom, I. , Smith, D. , Hartmann, L. , Fishman, D. , Berchuck, A. , Schmandt, R. , Whitaker, R. , Gershenson, D.M. , Mills, G.B. , Bast, R.C. , 2004. Selection of potential markers for epithelial ovarian cancer with gene expression arrays and recursive descent partition analysis. Clin. Cancer Res.. 10, 3291–3300. [DOI] [PubMed] [Google Scholar]
- Martens, L. , Vandekerckhove, J. , Gevaert, K. , 2005. DBToolkit: processing protein databases for peptide-centric proteomics. Bioinformatics. 21, 3584–3585. [DOI] [PubMed] [Google Scholar]
- Matsumura, M. , Bhatt, A.S. , Andress, D. , Clegg, N. , Takayama, T.K. , Craik, C.S. , Nelson, P.S. , 2005. Substrates of the prostate-specific serine protease prostase/KLK4 defined by positional-scanning peptide libraries. Prostate. 62, 1–13. [DOI] [PubMed] [Google Scholar]
- McQuibban, G.A. , Gong, J.H. , Tam, E.M. , McCulloch, C.A. , Clark-Lewis, I. , Overall, C.M. , 2000. Inflammation dampened by gelatinase a cleavage of monocyte chemoattractant protein-3. Science. 289, 1202–1206. [DOI] [PubMed] [Google Scholar]
- Michael, I.P. , Sotiropoulou, G. , Pampalakis, G. , Magklara, A. , Ghosh, M. , Wasney, G. , Diamandis, E.P. , 2005. Biochemical and enzymatic characterization of human kallikrein 5 (hK5), a novel serine protease potentially involved in cancer progression. J. Biol. Chem.. 280, 14628–14635. [DOI] [PubMed] [Google Scholar]
- Mobus, V. , Gerharz, C.D. , Press, U. , Moll, R. , Beck, T. , Mellin, W. , Pollow, K. , Knapstein, P.G. , Kreienberg, R. , 1992. Morphological, immunohistochemical and biochemical characterization of 6 newly established human ovarian carcinoma cell lines. Int. J. Cancer. 52, 76–84. [DOI] [PubMed] [Google Scholar]
- Nesvizhskii, A.I. , Keller, A. , Kolker, E. , Aebersold, R. , 2003. A statistical model for identifying proteins by tandem mass spectrometry. Anal Chem.. 75, 4646–4658. [DOI] [PubMed] [Google Scholar]
- Ni, X. , Zhang, W. , Huang, K.C. , Wang, Y. , Ng, S.K. , Mok, S.C. , Berkowitz, R.S. , Ng, S.W. , 2004. Characterisation of human kallikrein 6/protease M expression in ovarian cancer. Br. J. Cancer. 91, 725–731. [DOI] [PMC free article] [PubMed] [Google Scholar]
- Obiezu, C.V. , Diamandis, E.P. , 2005. Human tissue kallikrein gene family: applications in cancer. Cancer Lett.. 224, 1–22. [DOI] [PubMed] [Google Scholar]
- Obiezu, C.V. , Michael, I.P. , Levesque, M.A. , Diamandis, E.P. , 2006. Human kallikrein 4: enzymatic activity, inhibition, and degradation of extracellular matrix proteins. Biol. Chem.. 387, 749–759. [DOI] [PubMed] [Google Scholar]
- Obiezu, C.V. , Scorilas, A. , Katsaros, D. , Massobrio, M. , Yousef, G.M. , Fracchioli, S. , Rigault de la Longrais, I.A. , Arisio, R. , Diamandis, E.P. , 2001. Higher human kallikrein gene 4 (KLK4) expression indicates poor prognosis of ovarian cancer patients. Clin. Cancer Res.. 7, 2380–2386. [PubMed] [Google Scholar]
- Oikonomopoulou, K. , Li, L. , Zheng, Y. , Simon, I. , Wolfert, R.L. , Valik, D. , Nekulova, M. , Simickova, M. , Frgala, T. , Diamandis, E.P. , 2008. Prediction of ovarian cancer prognosis and response to chemotherapy by a serum-based multiparametric biomarker panel. Br. J. Cancer. 99, 1103–1113. [DOI] [PMC free article] [PubMed] [Google Scholar]
- Olsen, J.V. , Ong, S.E. , Mann, M. , 2004. Trypsin cleaves exclusively C-terminal to arginine and lysine residues. Mol. Cell Proteomics. 3, 608–614. [DOI] [PubMed] [Google Scholar]
- Pedrioli, P.G. , Eng, J.K. , Hubley, R. , Vogelzang, M. , Deutsch, E.W. , Raught, B. , Pratt, B. , Nilsson, E. , Angeletti, R.H. , Apweiler, R. , Cheung, K. , Costello, C.E. , Hermjakob, H. , Huang, S. , Julian, R.K. , Kapp, E. , McComb, M.E. , Oliver, S.G. , Omenn, G. , Paton, N.W. , Simpson, R. , Smith, R. , Taylor, C.F. , Zhu, W. , Aebersold, R. , 2004. A common open representation of mass spectrometry data and its application to proteomics research. Nat. Biotechnol.. 22, 1459–1466. [DOI] [PubMed] [Google Scholar]
- Pinzone, J.J. , Hall, B.M. , Thudi, N.K. , Vonau, M. , Qiang, Y.W. , Rosol, T.J. , Shaughnessy, J.D. , 2009. The role of Dickkopf-1 in bone development, homeostasis, and disease. Blood. 113, 517–525. [DOI] [PMC free article] [PubMed] [Google Scholar]
- Planque, C. , Kulasingam, V. , Smith, C.R. , Reckamp, K. , Goodglick, L. , Diamandis, E.P. , 2009. Identification of five candidate lung cancer biomarkers by proteomics analysis of conditioned media of four lung cancer cell lines. Mol. Cell Proteomics. 8, 2746–2758. [DOI] [PMC free article] [PubMed] [Google Scholar]
- Prezas, P. , Arlt, M.J.E. , Viktorov, P. , Soosaipillai, A. , Holzscheiter, L. , Schmitt, M. , Talieri, M. , Diamandis, E.P. , Krüger, A. , Magdolen, V. , 2006. Overexpression of the human tissue kallikrein genes KLK4, 5, 6, and 7 increases the malignant phenotype of ovarian cancer cells. Biol. Chem.. 387, 807–811. [DOI] [PubMed] [Google Scholar]
- Prudova, A. , Auf dem Keller, U. , Butler, G.S. , Overall, C.M. , 2010. Multiplex N-terminome analysis of MMP-2 and MMP-9 substrate degradomes by iTRAQ-TAILS quantitative proteomics. Mol. Cell Proteomics. 9, 894–911. [DOI] [PMC free article] [PubMed] [Google Scholar]
- Psyrri, A. , Kountourakis, P. , Scorilas, A. , Markakis, S. , Camp, R. , Kowalski, D. , Diamandis, E.P. , Dimopoulos, M.A. , 2008. Human tissue kallikrein 7, a novel biomarker for advanced ovarian carcinoma using a novel in situ quantitative method of protein expression. Ann. Oncol.. 19, 1271–1277. [DOI] [PubMed] [Google Scholar]
- Ramani, V.C. , Haun, R.S. , 2008. The extracellular matrix protein fibronectin is a substrate for kallikrein 7. Biochem. Biophys. Res. Commun.. 369, 1169–1173. [DOI] [PubMed] [Google Scholar]
- Roett, M.A. , Evans, P. , 2009. Ovarian cancer: an overview. Am. Fam. Physician. 80, 609–616. [PubMed] [Google Scholar]
- Santin, A.D. , Zhan, F. , Bellone, S. , Palmieri, M. , Cane, S. , Bignotti, E. , Anfossi, S. , Gokden, M. , Dunn, D. , Roman, J.J. , O'Brien, T.J. , Tian, E. , Cannon, M.J. , Shaughnessy, J. , Pecorelli, S. , 2004. Gene expression profiles in primary ovarian serous papillary tumors and normal ovarian epithelium: identification of candidate molecular markers for ovarian cancer diagnosis and therapy. Int. J. Cancer. 112, 14–25. [DOI] [PubMed] [Google Scholar]
- Schechter, I. , Berger, A. , 1966. Peptides of l-and d-alanine. Synthesis and optical rotations. Biochemistry. 5, 3362–3370. [DOI] [PubMed] [Google Scholar]
- Schilling, O. , auf dem Keller, U. , Overall, C.M. , 2011. Factor Xa subsite mapping by proteome-derived peptide libraries improved using WebPICS, a resource for proteomic identification of cleavage sites. Biol. Chem.. 392, 1031–1037. [DOI] [PubMed] [Google Scholar]
- Shan, S.J. , Scorilas, A. , Katsaros, D. , Rigault de la Longrais, I. , Massobrio, M. , Diamandis, E.P. , 2006. Unfavorable prognostic value of human kallikrein 7 quantified by ELISA in ovarian cancer cytosols. Clin. Chem.. 52, 1879–1886. [DOI] [PubMed] [Google Scholar]
- Shigemasa, K. , Tanimoto, H. , Underwood, L.J. , Parmley, T.H. , Arihiro, K. , Ohama, K. , O'Brien, T.J. , 2001. Expression of the protease inhibitor antileukoprotease and the serine protease stratum corneum chymotryptic enzyme (SCCE) is coordinated in ovarian tumors. Int. J. Gynecol. Cancer. 11, 454–461. [DOI] [PubMed] [Google Scholar]
- Shih Ie, M. , Salani, R. , Fiegl, M. , Wang, T.L. , Soosaipillai, A. , Marth, C. , Muller-Holzner, E. , Gastl, G. , Zhang, Z. , Diamandis, E.P. , 2007. Ovarian cancer specific kallikrein profile in effusions. Gynecol. Oncol.. 105, 501–507. [DOI] [PubMed] [Google Scholar]
- Siegel, R. , Naishadham, D. , Jemal, A. , 2012. Cancer statistics, 2012. CA Cancer J. Clin.. 62, 10–29. [DOI] [PubMed] [Google Scholar]
- Tanimoto, H. , Underwood, L.J. , Shigemasa, K. , Parmley, T.H. , O'Brien, T.J. , 2001. Increased expression of protease M in ovarian tumors. Tumour Biol.. 22, 11–18. [DOI] [PubMed] [Google Scholar]
- Tanimoto, H. , Underwood, L.J. , Shigemasa, K. , Yan Yan, M.S. , Clarke, J. , Parmley, T.H. , O'Brien, T.J. , 1999. The stratum corneum chymotryptic enzyme that mediates shedding and desquamation of skin cells is highly overexpressed in ovarian tumor cells. Cancer. 86, 2074–2082. [PubMed] [Google Scholar]
- Tholen, S. , Biniossek, M.L. , Gansz, M. , Gomez-Auli, A. , Bengsch, F. , Noel, A. , Kizhakkedathu, J.N. , Boerries, M. , Busch, H. , Reinheckel, T. , Schilling, O. , 2013. Deletion of cysteine cathepsins B or L yields differential impacts on murine skin proteome and degradome. Mol. Cell Proteomics. 12, 611–625. [DOI] [PMC free article] [PubMed] [Google Scholar]
- Tholen, S. , Biniossek, M.L. , Gessler, A.L. , Muller, S. , Weisser, J. , Kizhakkedathu, J.N. , Reinheckel, T. , Schilling, O. , 2011. Contribution of cathepsin L to secretome composition and cleavage pattern of mouse embryonic fibroblasts. Biol. Chem.. 392, 961–971. [DOI] [PubMed] [Google Scholar]
- Uniprot Consortium, 2013. Update on activities at the Universal Protein Resource (UniProt) in 2013. Nucleic Acids Res.. 41, D43–D47. [DOI] [PMC free article] [PubMed] [Google Scholar]
- Veveris-Lowe, T.L. , Lawrence, M.G. , Collard, R.L. , Bui, L. , Herington, A.C. , Nicol, D.L. , Clements, J.A. , 2005. Kallikrein 4 (hK4) and prostate-specific antigen (PSA) are associated with the loss of E-cadherin and an epithelial-mesenchymal transition (EMT)-like effect in prostate cancer cells. Endocr. Relat. Cancer. 12, 631–643. [DOI] [PubMed] [Google Scholar]
- White, N.M. , Mathews, M. , Yousef, G.M. , Prizada, A. , Popadiuk, C. , Dore, J.J. , 2009. KLK6 and KLK13 predict tumor recurrence in epithelial ovarian carcinoma. Br. J. Cancer. 101, 1107–1113. [DOI] [PMC free article] [PubMed] [Google Scholar]
- Xi, Z. , Kaern, J. , Davidson, B. , Klokk, T.I. , Risberg, B. , Trope, C. , Saatcioglu, F. , 2004. Kallikrein 4 is associated with paclitaxel resistance in ovarian cancer. Gynecol. Oncol.. 94, 80–85. [DOI] [PubMed] [Google Scholar]
- Yang, H. , Chen, G.D. , Fang, F. , Liu, Z. , Lau, S.H. , Zhang, J.F. , Lau, W.Y. , Yang, L.Y. , 2004. Dickkopf-1: as a diagnostic and prognostic serum marker for early hepatocellular carcinoma. Int. J. Biol. Markers. 28, 286–297. [DOI] [PubMed] [Google Scholar]
- Yoon, H. , Laxmikanthan, G. , Lee, J. , Blaber, S.I. , Rodriguez, A. , Kogot, J.M. , Scarisbrick, I.A. , Blaber, M. , 2007. Activation profiles and regulatory cascades of the human kallikrein-related peptidases. J. Biol. Chem.. 282, 31852–31864. [DOI] [PubMed] [Google Scholar]
- Yousef, G.M. , Diamandis, E.P. , 2003. Tissue kallikreins: new players in normal and abnormal cell growth?. Thromb. Haemost.. 90, 7–16. [PubMed] [Google Scholar]
- Yousef, G.M. , Diamandis, E.P. , 2009. The human kallikrein gene family: new biomarkers for ovarian cancer. Cancer Treat Res.. 149, 165–187. [DOI] [PubMed] [Google Scholar]
- Yousef, G.M. , Polymeris, M.E. , Grass, L. , Soosaipillai, A. , Chan, P.C. , Scorilas, A. , Borgono, C. , Harbeck, N. , Schmalfeldt, B. , Dorn, J. , Schmitt, M. , Diamandis, E.P. , 2003. Human kallikrein 5: a potential novel serum biomarker for breast and ovarian cancer. Cancer Res.. 63, 3958–3965. [PubMed] [Google Scholar]
- Yousef, G.M. , Polymeris, M.E. , Yacoub, G.M. , Scorilas, A. , Soosaipillai, A. , Popalis, C. , Fracchioli, S. , Katsaros, D. , Diamandis, E.P. , 2003. Parallel overexpression of seven kallikrein genes in ovarian cancer. Cancer Res.. 63, 2223–2227. [PubMed] [Google Scholar]
- Zhang, H. , Li, X.J. , Martin, D.B. , Aebersold, R. , 2003. Identification and quantification of N-linked glycoproteins using hydrazide chemistry, stable isotope labeling and mass spectrometry. Nat. Biotechnol.. 21, 660–666. [DOI] [PubMed] [Google Scholar]
Associated Data
This section collects any data citations, data availability statements, or supplementary materials included in this article.
Supplementary Materials
The following are the supplementary data related to this article:
Table S1 Identified and quantified proteins in the first replicate of global secretome comparison. All proteins have a ProteinProphet probability score >0.90, equivalent to an FDR < 0.01. Ratios are normalized to KLK expression/control.
Table S2 Identified and quantified proteins in the second replicate of global secretome comparison. All proteins have a ProteinProphet probability score >0.90, equivalent to an FDR < 0.01. Ratios are normalized to KLK expression/control.
Table S3 Identified and quantified proteins in the third replicate of global secretome comparison. All proteins have a ProteinProphet probability score >0.90, equivalent to an FDR < 0.01. Ratios are normalized to KLK expression/control.
Table S4 Proteins that are identified and quantified in all three replicates of global proteome comparison. Averaged ratios are normalized to KLK expression/control.
Table S5 Analysis of N‐termini that were unmodified upon secretome harvest and chemically dimethylated in the TAILS procedure (replicate 1). This is a non‐redundant, peptide‐centric list, showing up to three proteins for each peptide identification. The X! Tandem hyperscore and the mass deviation in ppm are shown. The overall FDR is <0.05 as calculated by PeptideProphet. The prime sequence was experimentally identified, the corresponding non‐prime sequence was bioinformatically derived. The fold‐change (Fc) value is based on ASAPratio.
Table S6 Analysis of N‐termini that were unmodified upon secretome harvest and chemically dimethylated in the TAILS procedure (replicate 2). This is a non‐redundant, peptide‐centric list, showing up to three proteins for each peptide identification. The X! Tandem hyperscore and the mass deviation in ppm are shown. The overall FDR is <0.05 as calculated by PeptideProphet. The prime sequence was experimentally identified, the corresponding non‐prime sequence was bioinformatically derived. The fold‐change (Fc) value is based on ASAPratio.