

Abstract
The conventional first‐line chemotherapy for metastatic colorectal cancer (mCRC) consists of fluorouracil (5‐FU) in combination with either oxaliplatin or irinotecan. We have explored microRNAs (miRNAs) in plasma as potential predictive markers to oxaliplatin‐based chemotherapy. The expression of 742 miRNAs was examined in plasma samples from 24 mCRC patients (12 responders and 12 non‐responders) before onset and after four cycles of 5‐FU/oxaliplatin. The top differentially expressed miRNAs between responders and non‐responders were selected for further analysis in a validation cohort of 150 patients. In the validation cohort, there was a significant overrepresentation of miRNAs with higher mean expression in the non‐responder group than in the responder group before treatment (p < 0.002). Moreover, we found three miRNAs (miR‐106a, miR‐484, and miR‐130b) to be significantly differentially expressed before treatment (p = 0.008, 0.008, and 0.008, respectively). All three miRNAs were upregulated in non‐responders. High expression of miR‐27b, miR‐148a, and miR‐326 were associated with decreased progression‐free survival (Hazard ratios (HR) of 1.4 (95% CI 1.1–1.8, p = 0.004), 1.3 (95% CI 1.1–1.6, p = 0.007), and 1.4 (95% CI 1.1–1.8, p = 0.008), respectively). miR‐326 was also associated with decreased overall survival (HR 1.5 (95% CI 1.1–2.0, p = 0.003)). There were no significantly differentially expressed miRNAs in association with clinical outcome after four cycles of chemotherapy. The present study demonstrates that plasma miRNAs analyzed before treatment may serve as non‐invasive markers predicting outcome in mCRC patients treated with 5‐FU and oxaliplatin‐based chemotherapy.
Keywords: Metastatic colorectal cancer, 5-Fluorouracil, Oxaliplatin, Circulating microrna, Predictive markers
Highlights
We explored if plasma miRNAs can predict clinical outcome to 5‐FU/oxaliplatin.
MiRNAs with a high expression were associated with a lack of response.
High levels of miR‐106a, miR‐148a, and miR‐130b were associated with non‐response.
High levels of miR‐27b, miR‐148a, and miR‐326 were associated with shortened PFS.
High levels of miR‐326 were also associated with shortened OS.
1. Introduction
Predictive markers are required to increase the efficacy of chemotherapy and may also be helpful in monitoring therapy response in metastatic colorectal cancer (mCRC). The main chemotherapeutic drugs in mCRC are 5‐fluorouracil (5‐FU) (or its pro‐drug capecitabine) given in combination with either oxaliplatin or irinotecan. There are currently no available molecular predictive markers for these combination regimens. With a response rate of approximately 50% to each regimen in first‐line (Tournigand et al., 2004), and considering that only 50–60% are well enough to receive second‐line therapy (Saunders and Iveson, 2006), the choice of an optimal first‐line regimen is important.
Predictive biomarkers are ideally blood‐based as blood is easily available and provides the opportunity to monitor therapy response. In addition, a blood sample collected before onset of first‐line metastatic therapy is likely to be more representative of the metastatic situation than tissue from the primary tumor, collected several months or years earlier.
There is emerging evidence that microRNAs, small nucleotide sequences of noncoding RNA, play an important role in chemotherapy resistance (Zheng et al., 2010). MiRNAs have a crucial role in the control of biological processes, such as cellular development, differentiation, proliferation, apoptosis, and metabolism (Bartel, 2004). They act as transacting factors, suppressing translation or inducing messenger RNA (mRNA) degradation of target genes (Bartel, 2004). MiRNAs suppress important cancer‐related genes and are differentially regulated in different human cancer types, suggesting a role as tumor suppressors or oncogenes (Esquela‐Kerscher and Slack, 2006). The mechanism underlying their stability in the RNase‐rich milieu of blood is not well understood. It has been demonstrated that miRNAs are stabilized when packaged with RNA‐binding proteins or enclosed in small membranous vesicles (Chen et al., 2012; Mitchell et al., 2008). There are studies reporting a high correlation between tumor miRNA expression and miRNA expression in the circulation (Ng et al., 2009; Wang et al., 2010). Other studies, however, lack a strong correlation (Boeri et al., 2011; Cookson et al., 2012). This controversy might be explained by specific release mechanisms favoring some miRNAs over others (Pigati et al., 2010).
MiRNAs in CRC tissue have been reported to be of prognostic or predictive value. For example high miR‐21 expression has been associated with inferior recurrence‐free cancer‐specific survival in stage II CRC (Kjaer‐Frifeldt et al., 2012), low miR‐150 expression has been associated with poor survival and poor response to adjuvant 5‐FU‐based chemotherapy (Ma et al., 2012), whereas increased expression of miR‐126 has been reported to be associated with response to first‐line capecitabine and oxaliplatin in mCRC (Hansen et al., 2012). There are an increasing number of studies on circulating miRNAs as potential biomarkers in CRC. Giraldez et al. identified six miRNAs to be significantly upregulated in plasma samples of patients with CRC compared to controls (Giraldez et al., 2012). Ng et al. discovered miR‐92 to be significantly elevated in plasma and CRC tissues, but reduced in postoperative plasma samples, suggesting miR‐92 to be a marker for CRC (Ng et al., 2009). Cheng et al. found plasma miR‐141 to be a sensitive marker and to complement CEA for detecting stage IV colon cancer (Cheng et al., 2011). Also, plasma miR‐141 was associated with decreased survival, representing an independent prognostic factor in mCRC (Cheng et al., 2011).
To our knowledge, no study so far has explored circulating miRNAs and their association with chemotherapy response in mCRC. To address this issue we assessed the expression of 742 plasma miRNAs in 24 mCRC patients before and after four cycles of first‐line 5‐FU/oxaliplatin (Nordic FLOX). From this pilot study we selected the most differentially expressed miRNAs to be further analyzed in another 150 mCRC patients treated with Nordic FLOX, with the aim of identifying potential predictive markers to aid in therapy decisions and to monitor therapy response.
2. Materials and methods
2.1. NORDIC VII
In the NORDIC VII trial (NCT 00145314), a total of 571 patients with mCRC were randomized to receive first‐line standard Nordic FLOX (bolus 5‐fluorouracil/folinic acid and oxaliplatin) (arm A), cetuximab and Nordic FLOX (arm B), or cetuximab combined with intermittent Nordic FLOX (arm C) (Tveit et al., 2012). The patients included in the pilot study and the validation study were treated with Nordic FLOX (arm A). Response status was evaluated according to the RECIST version 1.0 criteria and was assigned to patients with complete or partial remission with changes in tumor measurements confirmed by repeat studies performed no less than four weeks after the criteria for response were first met (minimum interval of eight weeks – four cycles) (Therasse et al., 2000). For a response criteria to be met in the validation study a complete or partial remission was required without confirmation by repeat studies. The study was approved by the national ethics committees and governmental authorities in each country and was conducted in accordance with the Declaration of Helsinki. All patients provided written informed consent.
2.2. Patient characteristics
There were 12 responders and 12 non‐responders included in the pilot study (Table 1). There were significant differences in progression‐free survival (PFS) and overall survival (OS) between the two groups (p < 0.001 and p = 0.045, respectively). The non‐responders and responders were well matched on age (p = 0.39). There were no significant differences in gender, WHO status, location of primary tumor, metastatic sites, KRAS, or BRAF mutational status between the groups. Of the 150 patients in the validation study, there were significantly longer PFS and OS in the responder group (p < 0.001 and p = 0.001, respectively) (Table 2). The two groups were well matched on age (p = 0.39). There were no significant differences in gender, location of primary tumor, metastatic sites or KRAS mutational status. There were more patients with BRAF wild‐type than BRAF mutation in the responder group (p = 0.02), and more patients with WHO status 0 in the responder group (p < 0.001). There were fewer patient samples available for plasma analyses after four chemotherapy cycles (n = 130).
Table 1.
Clinico‐pathological data of the patients in the pilot study.
| Responders (N = 12) | Non‐responders (N = 12) | p | |
|---|---|---|---|
| Age | 0.39 | ||
| Mean | 61 | 58 | |
| Median (range) | 62 (46–75) | 58 (45–72) | |
| Gender | 0.68 | ||
| Male | 6 | 8 | |
| Female | 6 | 4 | |
| WHO | 1.00 | ||
| 0 | 10 | 9 | |
| 1 | 2 | 2 | |
| 2 | – | 1 | |
| Location | 1.00 | ||
| Colon | 5 | 6 | |
| Rectum | 7 | 6 | |
| Metastatic sites | 0.67 | ||
| 1 | 5 | 3 | |
| >1 | 7 | 9 | |
| KRAS (N = 20) | 0.06 | ||
| Mutation | 2 | 5 | |
| Wild‐type | 10 | 3 | |
| BRAF (N = 20) | 0.25 | ||
| Mutation | 1 | 3 | |
| Wild‐type | 11 | 5 | |
| Survival | |||
| Median PFS | 9.7 (8.1–11.4) | 2.1 (1.6–2.6) | <0.001 |
| Median OS | 24.3 (4.3–44.3) | 6.9 (2.7–11.1) | 0.045 |
Table 2.
Clinico‐pathological data of the patients in the validation study.
| Responders (N = 90) | Non‐responders (N = 60) | p | |
|---|---|---|---|
| Age | 0.39 | ||
| Mean | 59 | 61 | |
| Median (range) | 60 (30–75) | 63 (34–75) | |
| Gender | 0.62 | ||
| Male | 51 | 31 | |
| Female | 39 | 29 | |
| WHO | <0.001 | ||
| 0 | 68 | 27 | |
| 1 | 20 | 27 | |
| 2 | 2 | 6 | |
| Location | 1.00 | ||
| Colon | 54 | 36 | |
| Rectum | 36 | 24 | |
| Metastatic sites | 0.85 | ||
| 1 | 26 | 16 | |
| >1 | 64 | 44 | |
| KRAS (N = 125) | 0.70 | ||
| Mutation | 29 | 18 | |
| Wild‐type | 52 | 26 | |
| BRAF (N = 116) | 0.02 | ||
| Mutation | 5 | 10 | |
| Wild‐type | 68 | 33 | |
| Survival | |||
| Median PFS | 9.2 (8.2–10.2) | 5.9 (4.9–6.9) | <0.001 |
| Median OS | 25.7 (22.3–29.1) | 14.2 (8.6–20.0) | 0.001 |
2.3. Sample preparation
Blood samples from the study participants were collected in EDTA tubes. The tubes were incubated in room temperature for 30 min before centrifuged for 10 min at 1400 × g. Plasma was pipetted into a polypropylene cryo‐tube and stored at −70 °C. Isolation of RNA and real‐time quantitative PCR experiments were performed by Exiqon Company, Vedbaek, Denmark (www.exiqon.com). Total RNA was extracted from plasma using the Qiagen miRNeasy® Mini Kit. Plasma was thawed on ice and centrifuged at 3000 × g for 5 min in a 4 °C microcentrifuge. An aliquot of 200 μL of plasma per sample was transferred to a new microcentrifuge tube and 750 μL of a Qiazol mixture containing 1.25 μg/mL of MS2 bacteriophage RNA was added to the plasma. The tube was mixed and incubated for 5 min followed by the addition of 200 μL chloroform. The tube was mixed, incubated for 2 min and centrifuged at 12,000 × g for 15 min in a 4 °C microcentrifuge. The upper aqueous phase was transferred to a new microcentrifuge tube and 1.5 volume of 100% ethanol was added. The contents were mixed thoroughly and 750 μL of the sample was transferred to a Qiagen RNeasy® Mini spin column in a collection tube followed by centrifugation at 15,000 × g for 30 s at room temperature. The process was repeated until all remaining sample had been loaded. The Qiagen RNeasy® Mini spin column was rinsed with 700 μL Qiagen RWT buffer and centrifuged at 15,000 × g for 1 min at room temperature followed by another rinse with 500 μL Qiagen RPE buffer and centrifuged at 15,000 × g for 1 min at room temperature. A rinse step (500 μL Qiagen RPE buffer) was repeated twice. The Qiagen RNeasy® Mini spin column was transferred to a new collection tube and centrifuged at 15,000 × g for 2 min at room temperature. The Qiagen RNeasy® Mini spin column was transferred to a new microcentrifuge tube and the lid was left uncapped for 1 min to allow the column to dry. Total RNA was eluted by adding 50 μL of RNase‐free water to the membrane of the Qiagen RNeasy® mini spin column and incubating for 1 min before centrifugation at 15,000 × g for 1 min at room temperature. The RNA was stored in a −80 °C freezer.
2.4. MicroRNA analyses
A qPCR quality control was performed on all the samples in the pilot study before starting the panel profiling of the 742 miRNAs. This was done to see if samples had failed RNA purification and to make sure no inhibition was present. Each RNA sample was reverse transcribed (RT) into cDNA and tested for the expression of four miRNAs and a synthetic spike in RNA. All four miRNAs were detected in all the samples. The expression levels were within the range of expression normally seen for this type of sample. There was no RT‐qPCR inhibition as judged by the expression of the included RNA spike‐in.
15 μL RNA was reverse transcribed in 75 μL reactions in the pilot study, whereas 2 μL RNA was reverse transcribed in 10 μL reactions in the validation study. The miRCURY LNA™ Universal RT microRNA PCR, Polyadenylation and cDNA synthesis kit (Exiqon) was used in both studies. cDNA was diluted 50× and assayed in 10 μL PCR reactions. Q‐PCR was performed by using the miRCURY LNA Universal RT microRNA PCR system containing 742 miRNA assays (Human panels I and II) in the pilot study and 32 miRNA assays in the validation study. Negative controls excluding template from the reverse transcription reaction was performed and profiled like the samples. The amplification was performed in a LightCycler® 480 Real‐Time PCR System (Roche, Basel, Switzerland). The amplification curves were analyzed using the Roche LC software, both for determination of Cp (by the 2nd derivative method) and for melting curve analysis. Assays had to be detected with 5 Cp's less than the negative control. If the negative control was not detectable the Cp should be below 37 to be included in the data analysis. A higher Cp value before normalization indicates that the miRNA is less abundant in a sample. Normalization was performed based on the average of the assays detected in all samples as this is shown to be the best normalization for qPCR studies involving numerous assays (Mestdagh et al., 2009). The formula used to calculate the normalized Cp values: Normalized Cp = average Cp – assay Cp. A higher “Normalized Cp” value thus indicates that the microRNA is more abundant in that particular sample.
2.5. Statistical analysis
A t‐test was applied to study the extent of change in miRNA expression after treatment in both the pilot study and the validation study. For each miRNA in the pilot study, differences in expression of responders and non‐responders were also compared using a t‐test. This was done separately for the before treatment samples, the after treatment samples, and all samples. Logistic regression and t‐test were applied to study the effect of miRNA expression and response outcome in the validation study. Cox proportional‐hazard regression was performed to calculate PFS and OS hazard ratios (HR), 95% confidence intervals (CI), and wald test p‐values for each miRNA separately in the validation study. Statistical analyses were performed using R (http://www.r‐project.org/).
3. Results
3.1. Pilot study: identification of candidate miRNAs
The outlines of the pilot and the validation studies are illustrated in Figure 1. To study differential miRNA expression, 742 miRNAs were assessed in 48 plasma samples, obtained before and after treatment in 24 patients (12 responders and 12 non‐responders). The stability of the average of 81 miRNAs detected in 44 of the 48 samples was higher than any single miRNA in the dataset as measured by the NormFinder software (Andersen et al., 2004) and was used for normalization. Thirty‐one miRNAs were significantly differentially expressed in the before versus after treatment samples (p < 0.01, Supplementary Table 1). Three different analyses were performed to study differential expression in responders and non‐responders, considering only samples before treatment (BE), after treatment (AF), or all samples (AF + BE), respectively. For the first two analyses, miRNAs above the detection limit in at least 9 samples were analyzed. For the last analysis (AF + BE), miRNAs above the detection in at least 18 samples were analyzed. All miRNAs with p < 0.05 in at least one of the three tests were identified (Supplementary Table 2). A total of 22 miRNAs were associated with response to treatment. The patients included in the pilot study were representative of the patients in the validation study since they belong to the same cohort. We therefore chose stably expressed miRNAs from the pilot study to be used as endogenous controls in the validation study instead of choosing reported control miRNAs from the literature. We expected more variation in the larger validation study, and therefore selected 10 miRNAs altogether (miR‐24, miR‐126, miR‐15b, miR‐106a, miR‐22, miR‐30b, miR‐484, miR‐7i, miR‐23b, miR‐126*) that demonstrated great stability for further analysis as potential controls. They were identified with the aid of the NormFinder software. This resulted in a total of 32 miRNAs for further analyses in the validation study.
Figure 1.
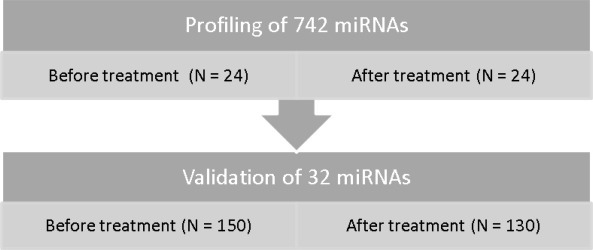
Schematic overview of the pilot study and the validation study.
3.2. MiRNAs associated with clinical outcome
In the validation study, the average of three miRNAs (miR‐126, miR‐15b, and miR‐24) detected in all samples demonstrated higher stability than any single miRNA in the dataset and was used for normalization. The extent of change in miRNA expression in samples available for paired analysis in the validation study was studied using paired t‐tests. There were eight miRNAs that were differentially expressed after treatment (miR‐326, miR‐377, miR‐328, miR‐205, miR‐27b, miR‐23b, miR‐24, and miR‐126). Seven miRNAs (miR‐377, miR‐328, miR‐27b, miR‐23b, let‐7i, miR‐24, and miR‐126) were differentially expressed in responders, whereas three miRNAs (miR‐103‐2*, miR‐326, miR‐409‐3p) were differentially expressed in non‐responders (p < 0.01, Supplementary Table 3). The relation between miRNA expression and response to treatment was studied separately before and after treatment (n = 150 and 130, respectively) using t‐tests and logistic regression (Supplementary Tables 4 and 5, Supplementary Figures 1 and 4). Before treatment there was a significant overrepresentation of miRNAs with higher mean expression in the non‐responder than in the responder group (binomial test; p < 0.002), indicating a tendency of therapy resistance to be associated with increased miRNA expression before treatment. Test results with p‐value < 0.01 were regarded significant. Note that only 0.01*32 = 0.32 tests were expected to be significant by chance. Before treatment, three miRNAs (miR‐106a, miR‐484, and miR‐130b) were significantly upregulated in non‐responders with both the t‐test and logistic regression (Figure 2 and Table 3). An additional miRNA (miR‐32) was significantly upregulated in non‐responders with the t‐test only (p = 0.009). After treatment, no miRNAs were significantly differentially expressed in both the t‐test and logistic regression. One miRNA (miR‐328) was significantly upregulated in non‐responders with the t‐test only (p = 0.009).
Figure 2.
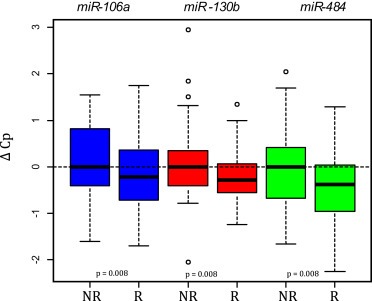
Expression levels of miR‐106a, miR‐130b, and miR‐484 in the validation study were significantly higher in non‐responders as compared to responders (both t‐test and logistic regression).
Table 3.
MiRNAs associated with clinical outcome before onset of treatment. miR‐106a, miR‐130b, and miR‐484 were significantly higher in non‐responder patients (t‐test and logistic regression). High expression of miR‐148a and miR‐27b were significantly associated with shortened PFS, while high expression of miR‐326 was associated with both shortened PFS and OS.
| MicroRNA | T‐test | Logistic regression | PFS | OS | |||||||
|---|---|---|---|---|---|---|---|---|---|---|---|
| T‐value | p | Coefficient | SE | p | HR | 95% CI | p | HR | 95% CI | p | |
| miR‐106a | 2.722 | 0.007 | −0.618 | 0.232 | 0.008 | 1.129 | (0.90–1.41) | 0.287 | 1.171 | (0.90–1.52) | 0.231 |
| miR‐130b | 2.741 | 0.008 | −0.716 | 0.270 | 0.008 | 1.398 | (1.05–1.86) | 0.022 | 1.312 | (0.96–1.79) | 0.088 |
| miR‐484 | 2.670 | 0.009 | −0.821 | 0.309 | 0.008 | 1.181 | (0.90–1.56) | 0.239 | 1.074 | (0.79–1.46) | 0.648 |
| miR‐148a | 2.508 | 0.014 | −0.448 | 0.183 | 0.014 | 1.290 | (1.07–1.55) | 0.007 | 1.179 | (0.96–1.45) | 0.118 |
| miR‐27b | 1.071 | 0.287 | −0.226 | 0.208 | 0.276 | 1.400 | (1.11–1.76) | 0.004 | 1.256 | (0.97–1.64) | 0.090 |
| miR‐326 | 0.732 | 0.467 | −0.153 | 0.200 | 0.444 | 1.390 | (1.09–1.77) | 0.008 | 1.491 | (1.14–1.95) | 0.003 |
The relation between miRNA expression and survival was studied using Cox regression analysis (Supplementary Tables 4 and 5, Supplementary Figures 2, 3, 5, and 6). Before treatment, three miRNAs (miR‐27b, miR‐148a, and miR‐326) were significantly associated with decreased PFS; with HRs of 1.4 (95% CI 1.1–1.8, p = 0.004), 1.3 (95% CI 1.1–1.6, p = 0.007), and 1.4 (95% CI 1.1–1.8, p = 0.008), respectively. Furthermore, miR‐326 was also associated with decreased OS (HR 1.5 (95% CI 1.1–2.0, p = 0.003) (Table 3). After treatment, no miRNAs were significantly associated with PFS or OS. The miRNAs associated with clinical outcome in the present study and their reported relevance to CRC is summarized in Table 4.
Table 4.
MiRNAs associated with clinical outcome in the present study and reported relevance to CRC.
| MicroRNA | Present study | Differential expression (literature) | Prognosis/clinical outcome (literature) |
|---|---|---|---|
| miR‐106a | High levels in plasma associated with lack of response in mCRC patients treated with 5‐Fu/oxaliplatin | Upregulated in tumor (Arndt et al., 2009; Catela et al., 2013; Monzo et al., 2008; Ng et al., 2009; Schetter et al., 2008; Volinia et al., 2006) | High expression levels in tumor associated with poor survival in a test cohort (Schetter et al., 2008) |
| Upregulated in tumor of mCRC patients compared to CRC patients without metastases (Feng et al., 2012) | Downregulation in tumor associated with shorter DFS and OS (Diaz et al., 2008) | ||
| Upregulated in stool samples from patients with CRC or adenomas (Link et al., 2010) | Upregulation in tumor of patients without metastases associated with shorter metastasis‐free survival (Feng et al., 2012) | ||
| miR‐130b | High levels in plasma associated with lack of response in mCRC patients treated with 5‐Fu/oxaliplatin | Upregulated in tumor (Arndt et al., 2009; Monzo et al., 2008) | Not reported in CRC |
| miR‐484 | High levels in plasma associated with lack of response in mCRC patients treated with 5‐Fu/oxaliplatin | Highly expressed in sera from patients with mCRC compared to controls, but lower expressed than controls in early stage (I–II) patients (Hofsli et al., 2013) | Not reported in CRC |
| miR‐148a | High levels in plasma associated with shorter PFS in mCRC patients treated with 5‐Fu/oxaliplatin | Upregulated in stage II tumors (Monzo et al., 2008) | Low expression in tumor associated with poor prognosis in stage III patients treated with 5‐Fu‐based adjvant chemotherapy. |
| Downregulated in stage III and IV tumors compared with stage II tumors (Takahashi et al., 2012) | Low expression was also associated with lack of response and poor survival in mCRC patients treated with 5‐Fu/oxaliplatin (Takahashi et al., 2012) | ||
| miR‐27b | High levels in plasma associated with shorter PFS in mCRC patients treated with 5‐Fu/oxaliplatin | Not reported in CRC | High levels in tumor associated with lack of response to 5‐Fu/oxaliplatin in a mCRC test cohort (Rasmussen et al., 2013) |
| miR‐326 | High levels in plasma associated with shorter PFS and OS in mCRC patients treated with 5‐Fu/oxaliplatin | Not reported in CRC | Not reported in CRC |
Abbreviations: CRC = colorectal cancer, mCRC = metastatic colorectal cancer, DFS = disease‐free survival, PFS = progression‐free survival, OS = overall survival.
4. Discussion
Resistance to chemotherapy is a considerable clinical obstacle when treating mCRC. With only half the patients responding to either type of first‐line treatment, there is a need to identify predictive markers to improve response rate and spare patients of the toxicity of ineffective treatment. MiRNAs have been demonstrated to be promising molecular markers in many cancer types, including CRC. We report the only study so far that has explored the potential of circulating miRNAs as predictive markers to conventional chemotherapy in mCRC.
The chemotherapy seemed to profoundly alter the patients' plasma miRNA expression profiles in the pilot study. A complex up‐ and downregulation of oncogenic and tumor suppressor miRNAs after treatment was observed. Zhou et al. also demonstrated changes in miRNA expression following exposure to 5‐FU/oxaliplatin in colon cancer cells (Zhou et al., 2010). They observed downregulation of oncogenic miRNAs that tend to be overexpressed in cancer and are correlated with poor prognosis and treatment resistance. These authors suggested that the tumor suppressive action of 5‐FU/oxaliplatin could rely in part on their action on oncogenic miRNAs and their target genes. In line with this we observed miR‐23a, which is reported to promote migration and invasion in CRC cells (Jahid et al., 2012), to be downregulated in the after treatment samples. Moreover, miR‐335, which was also downregulated in the after treatment samples, has been associated with increased metastatic capacity in CRC (Vickers et al., 2012). On the contrary, miR‐99a, miR‐122, and miR‐34a, all reported to have tumor suppressive functions, were upregulated after treatment. miR‐99a has been reported to suppress hepatocellular carcinoma (HCC) growth by inducing cell cycle arrest (Li et al., 2011), and overexpression of miR‐122 has been found to inhibit HCC cell growth and promote apoptosis (Xu et al., 2012). miR‐34a responsive genes are highly enriched for those that regulate cell‐cycle progression, cellular proliferation, apoptosis, DNA repair, and angiogenesis (Chang et al., 2007). By experimentally overexpressing miR‐34a, p53 effects like cell‐cycle arrest and apoptosis could be achieved (Chang et al., 2007). Another study found transient introduction of miR‐34a into human colon cancer cell lines to result in complete suppression of cell proliferation (Tazawa et al., 2007). As hypothesized by Tazawa et al., upregulation of certain tumor suppressor miRNAs may represent a cellular stress response induced by chemotherapeutic agents.
Seven miRNAs were differentially expressed in responders and three in non‐responders when comparing miRNA expression levels before and after treatment in the validation study. There was no overlap of these miRNAs in the two groups even though they received the same treatment. This may indicate that the miRNA expression is altered differently after treatment in these two groups.
There was an overrepresentation of miRNAs with higher mean expression in the non‐responders before treatment, indicating that therapy resistance was associated with increased miRNA expression. This trend has also been reported by Rasmussen et al. (Rasmussen et al., 2013). Upregulation of three circulating miRNAs (miR‐106a, miR‐130b, and miR‐484) were significantly associated with lack of response in our study. miR‐106a (Arndt et al., 2009; Catela et al., 2013; Monzo et al., 2008; Ng et al., 2009; Schetter et al., 2008; Volinia et al., 2006) and miR‐130b (Arndt et al., 2009; Monzo et al., 2008) have previously been reported to be overexpressed in CRC tissue. miR‐106a has also been shown to be highly expressed in CRC metastatic cells and to inhibit the expression of transforming growth factor β receptor 2 (TGFβR2), leading to increased cell migration and invasion (Feng et al., 2012). Furthermore, downregulation of tumor miR‐106a expression has been reported to predict shortened survival in CRC (Diaz et al., 2008), whereas Schetter et al. found high expression to be associated with poor survival in the test cohort (Schetter et al., 2008). miR‐130b has been associated with metastasis in gastric cancer patients (Kim et al., 2013). Another study on endometrial cancer found overexpression of miR‐130b together with DICER1 dysfunction to be associated with tumor invasiveness (Li et al., 2013). Both miR‐106a and miR‐130b are considered to be oncogenic and their pro‐oncogenic behavior may contribute to the reduced response observed in patients with high expression of these miRNAs in our study. Recently, miR‐484 was reported to be higher in sera from metastatic colon cancer patients than in healthy controls, but lower than controls in sera from stage I/II patients (Hofsli et al., 2013). In addition to be associated with therapy resistance to oxaliplatin‐based chemotherapy as reported in our study, miR‐484 may represent a novel diagnostic marker for mCRC.
High expression of miR‐27b, miR‐148a, and miR‐326 before onset of treatment were associated with reduced PFS, while miR‐326 was also associated with reduced OS. miR‐27b targets the DPD gene (DPYD), which is important for the antitumor effect of 5‐FU (Hirota et al., 2012), and also regulates the drug‐metabolizing enzyme CYP1B1 (Tsuchiya et al., 2006). Even though not confirmed in their validation cohort, a recent study found increased miR‐27b expression in tumor tissue to be associated with resistance to oxaliplatin‐based chemotherapy in the mCRC screening cohort (Rasmussen et al., 2013). This is in accordance with our results. Rasmussen and co‐workers also demonstrated that miR‐27b was upregulated in oxaliplatin‐resistant colon cancer cells (Rasmussen et al., 2013). Altogether, these findings support a role for miR‐27b in oxaliplatin‐based chemotherapy resistance in mCRC. miR‐148a, which is reported to be a tumor suppressor in CRC (Zhang et al., 2011), also showed a trend of being associated with lack of response when highly expressed before treatment (p = 0.014), in addition to be significantly associated with reduced PFS. Contrary to our results, a recent study found low tumor miR‐148a expression to be associated with decreased survival in mCRC patients treated with oxaliplatin‐based chemotherapy (Takahashi et al., 2012). On the other hand, high levels of plasma miR‐148a have been associated with shorter relapse‐free survival in multiple myeloma (Huang et al., 2012). miR‐326 is a suppressor of Hedgehog signaling. Downregulation allows high levels of Hedgehog‐dependent gene expression, leading to neoplastic transformation into medulloblastoma (Ferretti et al., 2008) and chronic myeloid leukemia (Babashah et al., 2013). Downregulation of miR‐326 is also associated with gliomblastoma multiforme progression (Karsy et al., 2012). Interestingly, miR‐326 regulates the multidrug resistance‐associated protein (MRP‐1) (Liang et al., 2010), which is an adenosine triphosphate‐binding cassette (ABC) transporter that decreases intracellular drug accumulation due to active efflux. Increased expression of this transporter is associated with multidrug resistance. The interaction between miR‐326 and MRP‐1 may be a contributing underlying mechanism explaining the different clinical outcomes in patients with altered levels of miR‐326 in our study.
Upregulation of three miRNAs (miR‐106a, miR‐130b, and miR‐484) were associated with lack of response, but these were not associated with reduced PFS or OS. We cannot fully understand this controversy. Response means a reduction of the total tumor burden of more than 30% from baseline, by radiological measurement, which is normally interpreted as a therapeutic effect, and often correlates with PFS (and OS). In contrast, the group of patients where a lack of response is reported as outcome is heterogeneous. The non‐responder group represents a continuum of outcomes; up to 30% size reduction in tumor burden, stable disease, progression of disease and non‐evaluable disease. Thus, several patients in this group may have obtained grades of disease stabilization during treatment, however, neither sufficient to meet the criteria of response, nor reflecting a short PFS. This may explain the discrepant results. Unfortunately, due to a relatively small sample size, further sub‐group analysis to elucidate this question was not feasible in this material.
Furthermore, there were significantly more patients with an improved performance status in the responder group in the validation study. Hence, the candidate miRNAs found to be associated with response may be confounded by performance status.
There is considerable discrepancy between the results reported in different miRNA studies. The lack of validated methods for sample collection, RNA extraction, normalization and miRNA analysis make it difficult to compare results from different studies. Inconsistent results may also indicate that miRNAs can act as either oncogenes or tumor suppressors, depending on the context. miR‐106a and miR‐484 were selected from the pilot study as candidate endogenous controls, due to the fact that they were not differentially expressed. Both turned out to be differentially expressed between responders and non‐responders in the validation study. These findings illustrate the challenge of selecting suitable and stably expressed endogenous controls from a small pilot study. Moreover, it is important to emphasize that circulating miRNA expression may reflect host‐derived factors acting on the tumor and metastases. Erythroblastosis virus E26 oncogene homologue 1 (ETS‐1), an experimentally validated target of miR‐326, is highly involved in immune regulation. It is therefore plausible that aberrant immune regulation may play a role in chemotherapy resistance. High miR‐326 expression is reported to be associated with high levels of immunity and disease severity in both multiple sclerosis (Du et al., 2009) and diabetes (Sebastiani et al., 2011).
We did not identify any circulating miRNAs to complement therapy response evaluation performed according to the RECIST criteria, as there were no significantly differentially expressed miRNAs in the after treatment samples. The miRNA expression was however profoundly altered in the after treatment samples. It is plausible that plasma samples from mCRC patients exhibit more homogeneous miRNA expression profiles following exposure to the same chemotherapeutic regimen.
In conclusion, we have identified six plasma miRNAs before onset of treatment to be associated with clinical outcome to 5‐FU and oxaliplatin‐based first‐line chemotherapy in mCRC. miR‐106a, miR‐130b, and miR‐484 were associated with lack of response, whereas miR‐27b, miR‐148a, and miR‐326 were associated with reduced PFS. Tumor expression levels of the former two miRNAs have previously been associated with clinical outcome to oxaliplatin‐based chemotherapy, strengthening their potential role as predictive markers in mCRC. The most promising predictive marker in our study was miR‐326, associated with both shortened PFS and OS. The clinical relevance of the six circulating miRNAs reported should be further studied in larger mCRC cohorts.
Supporting information
The following are the supplementary material related to this article:
Supplementary data
Supplementary data
Supplementary data
Supplementary data
Supplementary data
Supplementary data
Supplementary data
Supplementary data
Supplementary data
Supplementary data
Supplementary data
Acknowledgments
Supported by grants from the South‐Eastern Regional Health Authority, Holes foundation, Johs. I. Svanholms foundation, Gunnar Kristian Olsen and Randi Andresens foundation for scientific medical research, and the foundation in the memory of H.G and Andrine Berg and their son Hans Gylser Berg. We thank all the patients who participated in the NORDIC VII study. Assistance from Daniel Nebdal is acknowledged for help with the supplementary figures.
Supplementary material 1.
Supplementary material related to this article can be found at http://dx.doi.org/10.1016/j.molonc.2013.09.001.
Kjersem J.B., Ikdahl T., Lingjaerde O.C., Guren T., Tveit K.M. and Kure E.H., (2014), Plasma microRNAs predicting clinical outcome in metastatic colorectal cancer patients receiving first‐line oxaliplatin‐based treatment, Molecular Oncology, 8, doi: 10.1016/j.molonc.2013.09.001.
References
- Andersen, C.L. , Jensen, J.L. , Orntoft, T.F. , 2004. Normalization of real-time quantitative reverse transcription-PCR data: a model-based variance estimation approach to identify genes suited for normalization, applied to bladder and colon cancer data sets. Cancer Res.. 64, 5245–5250. [DOI] [PubMed] [Google Scholar]
- Arndt, G.M. , Dossey, L. , Cullen, L.M. , Lai, A. , Druker, R. , Eisbacher, M. , Zhang, C. , Tran, N. , Fan, H. , Retzlaff, K. , Bittner, A. , Raponi, M. , 2009. Characterization of global microRNA expression reveals oncogenic potential of MiR-145 in metastatic colorectal cancer. BMC Cancer. 9, 374 [DOI] [PMC free article] [PubMed] [Google Scholar]
- Babashah, S. , Sadeghizadeh, M. , Hajifathali, A. , Tavirani, M.R. , Zomorod, M.S. , Ghadiani, M. , Soleimani, M. , 2013. Targeting of the signal transducer Smo links MicroRNA-326 to the oncogenic Hedgehog Pathway in CD34 CML Stem/Progenitor cells. Int. J. Cancer. 133, 579–589. [DOI] [PubMed] [Google Scholar]
- Bartel, D.P. , 2004. MicroRNAs: genomics, biogenesis, mechanism, and function. Cell. 116, 281–297. [DOI] [PubMed] [Google Scholar]
- Boeri, M. , Verri, C. , Conte, D. , Roz, L. , Modena, P. , Facchinetti, F. , Calabro, E. , Croce, C.M. , Pastorino, U. , Sozzi, G. , 2011. MicroRNA signatures in tissues and plasma predict development and prognosis of computed tomography detected lung cancer. Proc. Natl. Acad. Sci. U.S.A.. 108, 3713–3718. [DOI] [PMC free article] [PubMed] [Google Scholar]
- Catela, I.T. , Aralica, G. , Cacev, T. , Loncar, B. , Kapitanovic, S. , 2013. MiR-106a overexpression and PRB downregulation in sporadic colorectal cancer. Exp. Mol. Pathol.. 94, 148–154. [DOI] [PubMed] [Google Scholar]
- Chang, T.C. , Wentzel, E.A. , Kent, O.A. , Ramachandran, K. , Mullendore, M. , Lee, K.H. , Feldmann, G. , Yamakuchi, M. , Ferlito, M. , Lowenstein, C.J. , Arking, D.E. , Beer, M.A. , Maitra, A. , Mendell, J.T. , 2007. Transactivation of MiR-34a by P53 broadly influences gene expression and promotes apoptosis. Mol. Cell. 26, 745–752. [DOI] [PMC free article] [PubMed] [Google Scholar]
- Chen, X. , Liang, H. , Zhang, J. , Zen, K. , Zhang, C.Y. , 2012. Horizontal transfer of MicroRNAs: molecular mechanisms and clinical applications. Protein Cell. 3, 28–37. [DOI] [PMC free article] [PubMed] [Google Scholar]
- Cheng, H. , Zhang, L. , Cogdell, D.E. , Zheng, H. , Schetter, A.J. , Nykter, M. , Harris, C.C. , Chen, K. , Hamilton, S.R. , Zhang, W. , 2011. Circulating plasma MiR-141 is a novel biomarker for metastatic colon cancer and predicts poor prognosis. PLoS One. 6, e17745 [DOI] [PMC free article] [PubMed] [Google Scholar]
- Cookson, V.J. , Bentley, M.A. , Hogan, B.V. , Horgan, K. , Hayward, B.E. , Hazelwood, L.D. , Hughes, T.A. , 2012. Circulating MicroRNA profiles reflect the presence of breast tumours but not the profiles of MicroRNAs within the tumours. Cell Oncol. (Dordr.). 35, 301–308. [DOI] [PMC free article] [PubMed] [Google Scholar]
- Diaz, R. , Silva, J. , Garcia, J.M. , Lorenzo, Y. , Garcia, V. , Pena, C. , Rodriguez, R. , Munoz, C. , Garcia, F. , Bonilla, F. , Dominguez, G. , 2008. Deregulated expression of MiR-106a predicts survival in human colon cancer patients. Genes Chromosomes Cancer. 47, 794–802. [DOI] [PubMed] [Google Scholar]
- Du, C. , Liu, C. , Kang, J. , Zhao, G. , Ye, Z. , Huang, S. , Li, Z. , Wu, Z. , Pei, G. , 2009. MicroRNA MiR-326 regulates TH-17 differentiation and is associated with the pathogenesis of multiple sclerosis. Nat. Immunol.. 10, 1252–1259. [DOI] [PubMed] [Google Scholar]
- Esquela-Kerscher, A. , Slack, F.J. , 2006. Oncomirs – MicroRNAs with a role in cancer. Nat. Rev. Cancer. 6, 259–269. [DOI] [PubMed] [Google Scholar]
- Feng, B. , Dong, T.T. , Wang, L.L. , Zhou, H.M. , Zhao, H.C. , Dong, F. , Zheng, M.H. , 2012. Colorectal cancer migration and invasion initiated by MicroRNA-106a. PLoS One. 7, e43452 [DOI] [PMC free article] [PubMed] [Google Scholar]
- Ferretti, E. , De, S.E. , Miele, E. , Laneve, P. , Po, A. , Pelloni, M. , Paganelli, A. , Di, M.L. , Caffarelli, E. , Screpanti, I. , Bozzoni, I. , Gulino, A. , 2008. Concerted MicroRNA control of Hedgehog signalling in cerebellar neuronal progenitor and tumour cells. EMBO J.. 27, 2616–2627. [DOI] [PMC free article] [PubMed] [Google Scholar]
- Giraldez, M.D. , Lozano, J.J. , Ramirez, G. , Hijona, E. , Bujanda, L. , Castells, A. , Gironella, M. , 2012. Circulating MicroRNAs As biomarkers of colorectal cancer: results from a genome-wide profiling and validation study. Clin. Gastroenterol. Hepatol.. 11, 681–688. [DOI] [PubMed] [Google Scholar]
- Hansen, T.F. , Sorensen, F.B. , Lindebjerg, J. , Jakobsen, A. , 2012. The predictive value of MicroRNA-126 in relation to first line treatment with capecitabine and oxaliplatin in patients with metastatic colorectal cancer. BMC Cancer. 12, 83 [DOI] [PMC free article] [PubMed] [Google Scholar]
- Hirota, T. , Date, Y. , Nishibatake, Y. , Takane, H. , Fukuoka, Y. , Taniguchi, Y. , Burioka, N. , Shimizu, E. , Nakamura, H. , Otsubo, K. , Ieiri, I. , 2012. Dihydropyrimidine Dehydrogenase (DPD) expression is negatively regulated by certain MicroRNAs in human lung tissues. Lung Cancer. 77, 16–23. [DOI] [PubMed] [Google Scholar]
- Hofsli, E. , Sjursen, W. , Prestvik, W.S. , Johansen, J. , Rye, M. , Trano, G. , Wasmuth, H.H. , Hatlevoll, I. , Thommesen, L. , 2013. Identification of Serum MicroRNA profiles in colon cancer. Br. J. Cancer. 108, 1712–1719. [DOI] [PMC free article] [PubMed] [Google Scholar]
- Huang, J.J. , Yu, J. , Li, J.Y. , Liu, Y.T. , Zhong, R.Q. , 2012. Circulating MicroRNA expression is associated with genetic subtype and survival of multiple myeloma. Med. Oncol.. 29, 2402–2408. [DOI] [PubMed] [Google Scholar]
- Jahid, S. , Sun, J. , Edwards, R.A. , Dizon, D. , Panarelli, N.C. , Milsom, J.W. , Sikandar, S.S. , Gumus, Z.H. , Lipkin, S.M. , 2012. MiR-23a promotes the transition from indolent to invasive colorectal cancer. Cancer Discov.. 2, 540–553. [DOI] [PMC free article] [PubMed] [Google Scholar]
- Karsy, M. , Arslan, E. , Moy, F. , 2012. Current progress on understanding MicroRNAs in Glioblastoma multiforme. Genes Cancer. 3, 3–15. [DOI] [PMC free article] [PubMed] [Google Scholar]
- Kim, B.H. , Hong, S.W. , Kim, A. , Choi, S.H. , Yoon, S.O. , 2013. Prognostic implications for high expression of oncogenic MicroRNAs in advanced gastric carcinoma. J. Surg. Oncol.. 107, 505–510. [DOI] [PubMed] [Google Scholar]
- Kjaer-Frifeldt, S. , Hansen, T.F. , Nielsen, B.S. , Joergensen, S. , Lindebjerg, J. , Soerensen, F.B. , Depont, C.R. , Jakobsen, A. , 2012. The prognostic importance of MiR-21 in stage II colon cancer: a population-based study. Br. J. Cancer. 107, 1169–1174. [DOI] [PMC free article] [PubMed] [Google Scholar]
- Li, B.L. , Lu, C. , Lu, W. , Yang, T.T. , Qu, J. , Hong, X. , Wan, X.P. , 2013. MiR-130b is an EMT-related MicroRNA that targets DICER1 for aggression in endometrial cancer. Med. Oncol.. 30, 484 [DOI] [PubMed] [Google Scholar]
- Li, D. , Liu, X. , Lin, L. , Hou, J. , Li, N. , Wang, C. , Wang, P. , Zhang, Q. , Zhang, P. , Zhou, W. , Wang, Z. , Ding, G. , Zhuang, S.M. , Zheng, L. , Tao, W. , Cao, X. , 2011. MicroRNA-99a inhibits hepatocellular carcinoma growth and correlates with prognosis of patients with hepatocellular carcinoma. J. Biol. Chem.. 286, 36677–36685. [DOI] [PMC free article] [PubMed] [Google Scholar]
- Liang, Z. , Wu, H. , Xia, J. , Li, Y. , Zhang, Y. , Huang, K. , Wagar, N. , Yoon, Y. , Cho, H.T. , Scala, S. , Shim, H. , 2010. Involvement of MiR-326 in chemotherapy resistance of breast cancer through modulating expression of multidrug resistance-associated protein 1. Biochem. Pharmacol.. 79, 817–824. [DOI] [PubMed] [Google Scholar]
- Link, A. , Balaguer, F. , Shen, Y. , Nagasaka, T. , Lozano, J.J. , Boland, C.R. , Goel, A. , 2010. Fecal MicroRNAs as novel biomarkers for colon cancer screening. Cancer Epidemiol. Biomarkers Prev.. 19, 1766–1774. [DOI] [PMC free article] [PubMed] [Google Scholar]
- Ma, Y. , Zhang, P. , Wang, F. , Zhang, H. , Yang, J. , Peng, J. , Liu, W. , Qin, H. , 2012. MiR-150 As a potential biomarker associated with prognosis and therapeutic outcome in colorectal cancer. Gut. 61, 1447–1453. [DOI] [PubMed] [Google Scholar]
- Mestdagh, P. , Van, V.P. , De, W.A. , Muth, D. , Westermann, F. , Speleman, F. , Vandesompele, J. , 2009. A novel and universal method for MicroRNA RT-QPCR data normalization. Genome Biol.. 10, R64 [DOI] [PMC free article] [PubMed] [Google Scholar]
- Mitchell, P.S. , Parkin, R.K. , Kroh, E.M. , Fritz, B.R. , Wyman, S.K. , Pogosova-Agadjanyan, E.L. , Peterson, A. , Noteboom, J. , O'Briant, K.C. , Allen, A. , Lin, D.W. , Urban, N. , Drescher, C.W. , Knudsen, B.S. , Stirewalt, D.L. , Gentleman, R. , Vessella, R.L. , Nelson, P.S. , Martin, D.B. , Tewari, M. , 2008. Circulating MicroRNAs As stable blood-based markers for cancer detection. Proc. Natl. Acad. Sci. U.S.A.. 105, 10513–10518. [DOI] [PMC free article] [PubMed] [Google Scholar]
- Monzo, M. , Navarro, A. , Bandres, E. , Artells, R. , Moreno, I. , Gel, B. , Ibeas, R. , Moreno, J. , Martinez, F. , Diaz, T. , Martinez, A. , Balague, O. , Garcia-Foncillas, J. , 2008. Overlapping expression of MicroRNAs in human embryonic colon and colorectal cancer. Cell Res.. 18, 823–833. [DOI] [PubMed] [Google Scholar]
- Ng, E.K. , Chong, W.W. , Jin, H. , Lam, E.K. , Shin, V.Y. , Yu, J. , Poon, T.C. , Ng, S.S. , Sung, J.J. , 2009. Differential expression of MicroRNAs in plasma of patients with colorectal cancer: a potential marker for colorectal cancer screening. Gut. 58, 1375–1381. [DOI] [PubMed] [Google Scholar]
- Pigati, L. , Yaddanapudi, S.C. , Iyengar, R. , Kim, D.J. , Hearn, S.A. , Danforth, D. , Hastings, M.L. , Duelli, D.M. , 2010. Selective release of MicroRNA species from normal and malignant mammary epithelial cells. PLoS One. 5, e13515 [DOI] [PMC free article] [PubMed] [Google Scholar]
- Rasmussen, M.H. , Jensen, N.F. , Tarpgaard, L.S. , Qvortrup, C. , Romer, M.U. , Stenvang, J. , Hansen, T.P. , Christensen, L.L. , Lindebjerg, J. , Hansen, F. , Jensen, B.V. , Hansen, T.F. , Pfeiffer, P. , Brunner, N. , Orntoft, T.F. , Andersen, C.L. , 2013. High expression of MicroRNA-625-3p is associated with poor response to first-line oxaliplatin based treatment of metastatic colorectal cancer. Mol. Oncol.. 7, 637–646. [DOI] [PMC free article] [PubMed] [Google Scholar]
- Saunders, M. , Iveson, T. , 2006. Management of advanced colorectal cancer: state of the art. Br. J. Cancer. 95, 131–138. [DOI] [PMC free article] [PubMed] [Google Scholar]
- Schetter, A.J. , Leung, S.Y. , Sohn, J.J. , Zanetti, K.A. , Bowman, E.D. , Yanaihara, N. , Yuen, S.T. , Chan, T.L. , Kwong, D.L. , Au, G.K. , Liu, C.G. , Calin, G.A. , Croce, C.M. , Harris, C.C. , 2008. MicroRNA expression profiles associated with prognosis and therapeutic outcome in colon adenocarcinoma. JAMA. 299, 425–436. [DOI] [PMC free article] [PubMed] [Google Scholar]
- Sebastiani, G. , Grieco, F.A. , Spagnuolo, I. , Galleri, L. , Cataldo, D. , Dotta, F. , 2011. Increased expression of MicroRNA MiR-326 in type 1 diabetic patients with ongoing islet autoimmunity. Diabetes Metab. Res. Rev.. 27, 862–866. [DOI] [PubMed] [Google Scholar]
- Takahashi, M. , Cuatrecasas, M. , Balaguer, F. , Hur, K. , Toiyama, Y. , Castells, A. , Boland, C.R. , Goel, A. , 2012. The clinical significance of MiR-148a As a predictive biomarker in patients with advanced colorectal cancer. PLoS One. 7, e46684 [DOI] [PMC free article] [PubMed] [Google Scholar]
- Tazawa, H. , Tsuchiya, N. , Izumiya, M. , Nakagama, H. , 2007. Tumor-suppressive MiR-34a induces senescence-like growth arrest through modulation of the E2F pathway in human colon cancer cells. Proc. Natl. Acad. Sci. U.S.A.. 104, 15472–15477. [DOI] [PMC free article] [PubMed] [Google Scholar]
- Therasse, P. , Arbuck, S.G. , Eisenhauer, E.A. , Wanders, J. , Kaplan, R.S. , Rubinstein, L. , Verweij, J. , Van, G.M. , van Oosterom, A.T. , Christian, M.C. , Gwyther, S.G. , 2000. New guidelines to evaluate the response to treatment in Solid tumors. European Organization for Research and Treatment of Cancer, National Cancer Institute of the United States, National Cancer Institute of Canada. J. Natl. Cancer Inst.. 92, 205–216. [DOI] [PubMed] [Google Scholar]
- Tournigand, C. , Andre, T. , Achille, E. , Lledo, G. , Flesh, M. , Mery-Mignard, D. , Quinaux, E. , Couteau, C. , Buyse, M. , Ganem, G. , Landi, B. , Colin, P. , Louvet, C. , de, G.A. , 2004. FOLFIRI followed by FOLFOX6 or the reverse sequence in advanced colorectal cancer: a randomized GERCOR study. J. Clin. Oncol.. 22, 229–237. [DOI] [PubMed] [Google Scholar]
- Tsuchiya, Y. , Nakajima, M. , Takagi, S. , Taniya, T. , Yokoi, T. , 2006. MicroRNA regulates the expression of human cytochrome P450 1B1. Cancer Res.. 66, 9090–9098. [DOI] [PubMed] [Google Scholar]
- Tveit, K.M. , Guren, T. , Glimelius, B. , Pfeiffer, P. , Sorbye, H. , Pyrhonen, S. , Sigurdsson, F. , Kure, E. , Ikdahl, T. , Skovlund, E. , Fokstuen, T. , Hansen, F. , Hofsli, E. , Birkemeyer, E. , Johnsson, A. , Starkhammar, H. , Yilmaz, M.K. , Keldsen, N. , Erdal, A.B. , Dajani, O. , Dahl, O. , Christoffersen, T. , 2012. Phase III trial of cetuximab with continuous or intermittent fluorouracil, Leucovorin, and oxaliplatin (Nordic FLOX) versus FLOX alone in first-line treatment of metastatic colorectal cancer: the NORDIC-VII study. J. Clin. Oncol.. 30, 1755–1762. [DOI] [PubMed] [Google Scholar]
- Vickers, M.M. , Bar, J. , Gorn-Hondermann, I. , Yarom, N. , Daneshmand, M. , Hanson, J.E. , Addison, C.L. , Asmis, T.R. , Jonker, D.J. , Maroun, J. , Lorimer, I.A. , Goss, G.D. , Dimitroulakos, J. , 2012. Stage-dependent differential expression of MicroRNAs in colorectal cancer: potential role As markers of metastatic disease. Clin. Exp. Metastasis. 29, 123–132. [DOI] [PubMed] [Google Scholar]
- Volinia, S. , Calin, G.A. , Liu, C.G. , Ambs, S. , Cimmino, A. , Petrocca, F. , Visone, R. , Iorio, M. , Roldo, C. , Ferracin, M. , Prueitt, R.L. , Yanaihara, N. , Lanza, G. , Scarpa, A. , Vecchione, A. , Negrini, M. , Harris, C.C. , Croce, C.M. , 2006. A MicroRNA expression signature of human solid tumors defines cancer gene targets. Proc. Natl. Acad. Sci. U.S.A.. 103, 2257–2261. [DOI] [PMC free article] [PubMed] [Google Scholar]
- Wang, F. , Zheng, Z. , Guo, J. , Ding, X. , 2010. Correlation and quantitation of MicroRNA aberrant expression in tissues and sera from patients with breast tumor. Gynecol. Oncol.. 119, 586–593. [DOI] [PubMed] [Google Scholar]
- Xu, J. , Zhu, X. , Wu, L. , Yang, R. , Yang, Z. , Wang, Q. , Wu, F. , 2012. MicroRNA-122 suppresses cell proliferation and induces cell apoptosis in hepatocellular carcinoma by directly targeting Wnt/Beta-Catenin Pathway. Liver Int.. 32, 752–760. [DOI] [PubMed] [Google Scholar]
- Zhang, H. , Li, Y. , Huang, Q. , Ren, X. , Hu, H. , Sheng, H. , Lai, M. , 2011. MiR-148a promotes apoptosis by targeting Bcl-2 in colorectal cancer. Cell Death Differ.. 18, 1702–1710. [DOI] [PMC free article] [PubMed] [Google Scholar]
- Zheng, T. , Wang, J. , Chen, X. , Liu, L. , 2010. Role of MicroRNA in anticancer drug resistance. Int. J. Cancer. 126, 2–10. [DOI] [PubMed] [Google Scholar]
- Zhou, J. , Zhou, Y. , Yin, B. , Hao, W. , Zhao, L. , Ju, W. , Bai, C. , 2010. 5-Fluorouracil and oxaliplatin modify the expression profiles of MicroRNAs in human colon cancer cells in Vitro. Oncol. Rep.. 23, 121–128. [PubMed] [Google Scholar]
Associated Data
This section collects any data citations, data availability statements, or supplementary materials included in this article.
Supplementary Materials
The following are the supplementary material related to this article:
Supplementary data
Supplementary data
Supplementary data
Supplementary data
Supplementary data
Supplementary data
Supplementary data
Supplementary data
Supplementary data
Supplementary data
Supplementary data