

Abstract
Purpose
To compare the distribution and prognostic effect of the breast cancer molecular subtypes in young and elderly breast cancer patients.
Patients and methods
Our study population (n = 822) consisted of all early breast cancer patients primarily treated with surgery in our center between 1985 and 1996. A total of 142/822 fresh frozen tissues were available with good quality RNA and analyzed by gene expression microarray. Gene expression molecular subtypes were determined by correlation to the expression centroids of 534 “intrinsic” genes. Sections of a tissue micro array containing formalin‐fixed paraffin‐embedded tumor tissue of 714/822 patients were immunohistochemically (IHC) stained for Ki67, EGFR, CK5/6. Tumor expression of ER, PR, HER2 was previously determined. IHC molecular subtypes were defined based on expression of these markers: Luminal A: ER+ and/or PR+, HER2– and Ki67–; Luminal B: ER+ and/or PR+ and ki67+; ERBB2: ER–, PR– and HER2+; Basal‐like: ER–, PR–, HER2– and EGFR+ and/or CK5/6+; Unclassified: ER–, PR–, HER2–, EGFR– and CK5/6–. IHC molecular subtypes were validated against gene expression defined molecular subtypes. Assessment of distribution and prognostic effect of molecular subtypes was stratified to age (<65 versus ≥65 years).
Results
Validation of molecular subtypes determined by IHC against gene expression revealed a substantial agreement in classification (Cohen's kappa coefficient 0.75). A statistically significant association (p = 0.02) was found between molecular subtypes and age, where Luminal tumors were more often found in elderly patients, while ERBB2, basal‐like and unclassified subtypes were more often found in young patients. Molecular subtypes showed a prognostic association with outcome in young patients concerning relapse‐free period (RFP) (p = 0.01) and relative survival (RS) (p < 0.001). No statistically significant prognostic effect was found for molecular subtypes in elderly patients (RFP p = 0.5; RS p = 0.1). Additional analyses showed that no molecular subtypes showed a statistically significant difference in outcome for elderly compare to young patients.
Conclusion
We have shown that molecular subtypes have a different distribution and prognostic effect in elderly compared to young breast cancer patients, emphasizing the fact that biomarkers may have different distributions and prognostic effects and therefore different implications in elderly compared to their younger counterparts. Our results support the premise that breast cancer clinical behavior is significantly affected by patient age. We suggest that competing risks of death in elderly patients, ER‐driven differences and micro‐environmental changes in biology are underlying these age‐dependent variations in patient prognosis.
Keywords: Breast cancer, Prognostication, Molecular subtypes, Elderly
Highlights
Molecular subtypes show different distributions and prognostic effect in elderly breast cancer patients.
This indicates that biomarkers have different implications in elderly breast cancer patients.
Our results support the premise that breast cancer clinical behavior is significantly affected by patient age.
Our results suggest competing risks of death in elderly patients, ER‐driven and microenvironmental differences in biology are underlying these age‐dependent variations in patient prognosis, rather than the general belief that elderly breast cancers are of a more indolent biological tumor type.
Abbreviations
- 95%CI
95 percent confidence interval
- BCS
breast conservative surgery
- CT
chemotherapy
- EGFR
epidermal growth factor receptor
- ER
estrogen receptor
- ET
endocrine therapy
- HER2
human epidermal growth factor receptor 2
- HR
hazard ratio
- IHC
immunohistochemistry
- MAST
mastectomy
- N
number of patients
- PR
progesterone receptor
- RER
relative excess risk
- RFP
relapse-free period
- RS
relative survival
- RSN
robust spline normalization
- RT
radiotherapy
- VST
variance stabilizing transformation
1. Introduction
Breast cancer is increasingly becoming a disease affecting older women. However, evidence based treatment guidelines specific for this aged breast cancer population are lacking (Petrakis and Paraskakis, 2010). Decisions regarding breast cancer treatment are based on prognostic and predictive patient and tumor characteristics discovered and analyzed in relatively young patient populations (Anderson et al., 2009; Beadle et al., 2011; Early breast cancer Trialists' Collaborative Group, 2005; Goldhirsch et al., 2007). These characteristics have been found to differ considerably between elderly and young breast cancer, i.e. elderly breast cancer patients present more often with tumors positive for hormone receptor expression, no overexpression of human epidermal growth factor receptor 2 (HER2), lower proliferation rates, diploidy, normal p53 expression and bcl‐2 overexpression (Daidone et al., 2003; Diab et al., 2000; Remvikos et al., 1995). This may be indicative for differences in underlying tumor biology and it has indeed often been suggested that elderly breast cancer is a biologically different tumor type of a more indolent character compared to young breast cancer (Diab et al., 2000; Remvikos et al., 1995; Thomas and Leonard, 2009). Moreover, it suggests that biomarkers may show different prognostic and predictive effects in the elderly compared to young breast cancer patients. In addition, due to competing causes of death, life expectancy is significantly shorter in elderly breast cancer patient (Bastiaannet et al., 2010, 2011; Wildiers et al., 2007). Therefore, since breast cancer relapses can occur after long periods of time, this further suggests that the impact and significance of prognostic and predictive biomarkers may vary significantly in this patient population. Nevertheless, as this patient population is often underrepresented in translational studies and randomized trials, little is known about the implications on outcome of prognostic and predictive biomarkers in elderly (Anderson et al., 2009; Beadle et al., 2011).
Gene expression studies have identified several distinct breast cancer subtypes based on gene expression patterns, that showed marked differences in patient prognosis (Perou et al., 2000; Sorlie et al., 2001, 2003). This “intrinsic” classification proposes four different classes of breast tumors: Luminal A and B, which are mostly hormone receptor positive and show high expression of genes characteristic of the luminal epithelial cell layer, including expression of estrogen receptor (ER), GATA3 and genes regulated by these (Sorlie et al., 2001, 2003). Compared with Luminal A tumors, Luminal B tumor often express genes associated with high tumor proliferation (Sorlie et al., 2001, 2003). The “intrinsic” subtypes further include 2 main subtypes of hormone receptor negative tumors: Basal‐like tumors, which typically are triple negative tumor (ER, progesterone receptor (PR), and HER2 negative) and exhibit high expression of genes characteristic of the basal epithelial cell layer such as cytokeratin (CK) 5, 6 and 17 (Perou et al., 2000) and the ERBB2 tumor subtype, which clusters near the basal‐like tumor, are mostly hormone receptor negative and show high overexpression of HER2 and high HER2 gene amplification (Sorlie et al., 2001, 2003). Concerning outcome, hormone receptor positive tumors result in the best patient outcome where, compared to Luminal B tumors, Luminal A tumors seem to be the most indolent tumors (Sorlie et al., 2001). Hormone receptor negative “intrinsic” subtypes, ERBB2 and Basal‐like tumors have an aggressive natural history, resulting in an unfavorable patient outcome (Sorlie et al., 2001). In a large study on almost 500 breast cancer patients Perou et al. (2000) found the molecular subtypes, determined with immunohistochemistry (IHC), to be significantly associated with tumor histological grade, lymph node status and patient age, where ERBB2 and Basal‐like subtypes showed to correlate with unfavorable tumor characteristics and younger patient age (Carey et al., 2006). The distribution and prognostic effect of molecular breast cancer subtypes specific in the elderly breast cancer population compared to younger breast cancer patients is still unknown.
We used immunohistochemical (IHC) surrogates, which we validated against gene expression determined molecular subtypes, to identify breast tumor molecular subtypes in a large cohort of breast cancer patients. The aim was to investigate the distribution and prognostic effect of molecular subtypes of breast cancer in elderly patients compared to their younger counterparts.
2. Patients and methods
2.1. Patients and tumors
The patient population comprised all non‐metastasized breast cancer patients primarily treated with surgery in the Leiden University Medical Center between 1985 and 1996 (n = 822). Patients with bilateral tumors or a prior history of cancer (other than basal cell carcinoma or cervical carcinoma in situ) were excluded. The following data were known: age, tumor grade, histological type, TNM stage, local and systemic therapy, locoregional/distant tumor recurrence and survival. Expression of ER, PR and HER2 were previously determined using standard immunohistochemistry protocols and semi‐automated quantifications (van Nes et al., 2011). All tumors were graded according to current pathological standards, by an experienced breast cancer pathologist (VS). Approval was obtained from the Leiden University Medical Center Medical Ethics Committee. All samples were handled in a coded fashion, according to National ethical guidelines (“Code for Proper Secondary Use of Human Tissue”, Dutch Federation of Medical Scientific Societies).
2.2. Microarray analysis
Fresh frozen tumor material was available of 33% (268/822). Total RNA was isolated by phenol‐chloroform extraction (Trizol reagent). The Quality control, RNA labeling, hybridization and data extraction were performed at ServiceXS (Leiden, The Netherlands). RNA concentration was measured using a Nanodrop ND‐1000 spectrophotometer (Nanodrop Technologies, Wilmington, DE, U.S.A). The RNA quality and integrity was determined using Lab‐on‐Chip analysis on an Agilent 2100 Bioanalyzer (Agilent Technologies, Inc., Santa Clara, CA, U.S.A.). Biotinylated cRNA was prepared using the Illumina TotalPrep RNA Amplification Kit (Ambion, Inc., Austin, TX, U.S.A.) according to the manufacturer's specifications starting with 200 ng total RNA. Per sample 750 ng of cRNA was used to hybridize to the HumanHT‐12 v4 Expression BeadChips (Illumina, Inc., San Diego, CA, U.S.A.). Each BeadChip contains twelve arrays. Hybridization and washing were performed according to the Illumina standard assay procedure. Scanning was performed on the Illumina iScan (Illumina, Inc., San Diego, CA, U.S.A.). Image analysis and extraction of raw expression data was performed with Illumina GenomeStudio; Gene Expression software with default settings (no background substraction) and no normalization. A total of 142 (53%) breast tumor fresh frozen tissues had good quality mRNA and could be analyzed for gene expression. The Illumina HumanHT‐12 Oligo Microarray contains 47,231 50‐mer oligonucleotide probes representing 39,809 unique genes and transcripts. Labeling of total RNA was performed according to manufacturer's protocol. Hybridization was performed for 16–20 h at 58 °C and arrays were scanned on a iScan scanner. Images were analyzed and data were extracted using GenomeStudio Software. Robust spline normalization (RSN) and variance stabilizing transformation (VST) were performed using R/Bioconductor Lumi Package (Du et al., 2008).
2.3. Immunohistochemistry
Mouse antibodies against ki67 (clone MIB‐1, Dako, NL), epidermal growth factor receptor (EGFR) (NCL‐EGFR, Novocastra, UK) and CK5/6 (clone D5/16 B4, Dako, NL) were used for immunohistochemistry. Tissue sections of 4 μm were cut from a previously constructed tissue microarray (TMA) of formalin‐fixed paraffin‐embedded tumors of 714 patients from whom tumor material was available (van Nes et al., 2011). Immunohistochemical staining was performed according to previously described standard protocols (de Kruijf et al., 2010). Human tonsil tissue slides served as positive control. Negative controls were human tonsil tissue slides that did undergo the whole immunohistochemical staining without primary antibodies. Microscopic analysis of Ki67, EGFR and CK5/6 was assessed independently by two observers in a blinded manner. Cut‐offs for low versus high expression of Ki67, EGFR and CK5/6 were based on the median expression level and were respectively 0%, 10% and 0% positive stained cells. Immunohistochemical staining and quantification of ER, PR and HER2 are described elsewhere (Representative examples of all stainings are shown in Figure 1A) (van Nes et al., 2011).
Figure 1.

Molecular subtypes immunohistochemical stainings and distribution over age groups. A. Representative photographs of tissue microarray punches of human breast cancer specimens immunohistochemically stained for ER, PR, HER2, ki67, EGFR and CK5/6 and corresponding molecular subtypes. Bar represents 100 μm. B. Molecular subtypes according to age (<65 versus >65 years).
2.4. Determination molecular subtypes
2.4.1. Gene expression subtyping
The gene expression subtypes were determined as follows: An “intrinsic” gene list consisting of 534 genes represented by 552 clones, was previously selected based on their low variation in expression in successive samples from the same patient's tumor and at the same time, high degree of variation among tumors from different patients (Sorlie et al., 2003). Hierarchical clustering of data from 122 breast tissue samples using these intrinsic genes were used to define five subtypes of breast tumors and five corresponding core expression centroids (i.e., average expression profile of the 534 intrinsic genes). Intrinsic molecular subtypes were assigned to each sample by computing the correlation to each of the five centroids.
2.4.2. IHC subtyping
The IHC profiles have been previously developed by combinations of the following markers: ER, PR, HER2, Ki67, EGFR and CK5/6 (Carey et al., 2006; Nielsen et al., 2004). We defined the immunohistochemistry molecular subtypes as follows (Figure 1A): Luminal A: ER+ and/or PR+, HER2– and Ki67–; Luminal B: ER+ and/or PR +, HER2– and/or ki67+; ERBB2: HER2+; Basal‐like: ER–, PR–, HER2– and EGFR+ and/or CK5/6+; Unclassified: ER–, PR–, HER2–, EGFR– and CK5/6–.
2.5. Statistical analysis
Statistical analysis of gene expression data were performed with the software packages MATLAB (Mathworks, Natick, Ma), R/Bioconductor and Spotfire Functional Genomic (Spotfire, Göteborg, Sweden). Intrinsic genes were mapped to the corresponding genes represented on the Illumina HumanHT‐12 Microarray platform. Using these mapped genes, we computed the Pearson's correlation coefficient of each sample from this study to each of the five centroids and assigned each sample to the subtype with which it showed the highest correlation.
Statistical analyses of IHC data were performed using the statistical packages SPSS (version 16.0 for Windows, Spps Inc, Chicago, IL, USA) and Stata (version 10.0 for Windows, StataCorp, College Station, TX, USA). Cohen's kappa coefficient was used to assess the inter‐observer agreement in quantification of Ki67, EGFR and CK5/6 tumor expression. In addition, to assess a measurement of inter‐assay agreement in determination of molecular subtype between gene expression and IHC (in order to validate the IHC subtypes with the gene expression subtypes), Cohen's kappa coefficient was used. The χ 2 test was used to evaluate associations between various clinicopathological parameters and molecular subtypes. Relapse‐free period (RFP) was defined as the time from date of surgery until an event (locoregional recurrence and/or a distant recurrence, whichever came first). RFP is reported as cumulative incidence function, after accounting for death as competing risk (Putter et al., 2007). The Kaplan–Meier method was used for survival plotting and log‐rank test for comparison of relapse‐free period curves. Cox proportional hazard analysis was used for univariate and multivariable analysis for relapse‐free period. Relative survival (RS) was calculated by the Hakulinen method as the ratio of the survival observed among the cancer patients and the survival that would have been expected based on the corresponding (age, sex, and year) general population. National life tables were used to estimate expected survival. Relative excess risks (RER) of death were estimated using a multivariable generalized linear model with a Poisson distribution, based on collapsed relative survival data, using exact survival times.
Analyses were performed for all patients and stratified for age and systemic treatment. Age of 65 years at time of diagnosis was chosen as the cut‐off point for age stratification. Variables with a P‐value of <0.10 in univariate analysis were entered in multivariable analysis.
3. Results
3.1. Patient and tumor characteristics
Figure 1 shows a diagram illustrating the various phases of exclusion or loss of patients in this study. Tumor material was available of 86% (714/822) of the patients. Of these patients, 469 (66%) were <65 years at diagnosis and 245 (34%) were >65 years at diagnosis. Median age of patients was 58 years (range 23–96 years). Median follow‐up of patients alive was 15 years (range 12–23 years). Clinicopathological and treatment characteristics are shown in Table 1.
Table 1.
Correlations between molecular subtypes and well‐established prognostic factors using chi‐square test (missing data not shown).
| Total | Molecular subtypes | p‐Value | |||||||||||
|---|---|---|---|---|---|---|---|---|---|---|---|---|---|
| Unclassified | Luminal A | Luminal B | ERBB2 | Basal | |||||||||
| N | % | N | % | N | % | N | % | N | % | N | % | ||
| Age | |||||||||||||
| <65 | 361 | 66 | 25 | 76 | 154 | 60 | 74 | 63 | 46 | 78 | 63 | 73 | 0.02 |
| ≥65 | 189 | 34 | 8 | 24 | 101 | 40 | 44 | 37 | 13 | 22 | 23 | 27 | |
| Grade | |||||||||||||
| I | 116 | 17 | 7 | 23 | 59 | 24 | 9 | 8 | 4 | 7 | 7 | 8 | <0.001 |
| II | 342 | 49 | 17 | 55 | 151 | 61 | 51 | 44 | 20 | 34 | 25 | 29 | |
| III | 224 | 35 | 7 | 23 | 40 | 16 | 57 | 49 | 35 | 59 | 53 | 62 | |
| Histological type | |||||||||||||
| Ductal | 638 | 91 | 27 | 87 | 218 | 87 | 109 | 93 | 57 | 97 | 82 | 97 | 0.03 |
| Lobular | 66 | 9 | 4 | 13 | 32 | 13 | 8 | 7 | 2 | 4 | 3 | 4 | |
| T‐status | |||||||||||||
| T1 | 289 | 42 | 16 | 50 | 122 | 49 | 38 | 33 | 16 | 28 | 26 | 31 | 0.02 |
| T2 | 328 | 47 | 13 | 41 | 104 | 42 | 62 | 54 | 33 | 57 | 49 | 58 | |
| T3/4 | 77 | 11 | 3 | 9 | 23 | 9 | 14 | 12 | 9 | 16 | 10 | 12 | |
| N‐status | |||||||||||||
| N0 | 381 | 55 | 22 | 67 | 146 | 59 | 56 | 50 | 22 | 37 | 40 | 48 | 0.008 |
| N1‐3 | 313 | 45 | 11 | 33 | 101 | 41 | 57 | 50 | 37 | 63 | 44 | 52 | |
| ER‐status | |||||||||||||
| Negative | 281 | 42 | 33 | 100 | 45 | 18 | 12 | 10 | 49 | 83 | 86 | 100 | <0.001 |
| Positive | 388 | 58 | 0 | 0 | 210 | 82 | 106 | 90 | 10 | 17 | 0 | 0 | |
| PgR‐status | |||||||||||||
| Negative | 299 | 46 | 33 | 100 | 58 | 23 | 31 | 26 | 48 | 81 | 86 | 100 | <0.001 |
| Positive | 358 | 55 | 0 | 0 | 197 | 77 | 87 | 74 | 11 | 19 | 0 | 0 | |
| Her2‐status | |||||||||||||
| Overexpression − | 489 | 90 | 33 | 100 | 255 | 100 | 117 | 100 | 0 | 0 | 86 | 100 | <0.001 |
| Overexpression + | 56 | 10 | 0 | 0 | 0 | 0 | 0 | 0 | 59 | 100 | 0 | 0 | |
| Ki67 | |||||||||||||
| Negative | 299 | 54 | 23 | 74 | 188 | 100 | 0 | 0 | 19 | 39 | 27 | 33 | <0.001 |
| Positive | 257 | 46 | 8 | 26 | 0 | 0 | 118 | 100 | 30 | 61 | 54 | 67 | |
| CK56 | |||||||||||||
| Negative | 427 | 76 | 33 | 100 | 156 | 78 | 91 | 82 | 41 | 84 | 38 | 46 | <0.001 |
| Positive | 134 | 24 | 0 | 0 | 42 | 21 | 20 | 18 | 8 | 16 | 45 | 54 | |
| EGFR | |||||||||||||
| Negative | 215 | 42 | 33 | 100 | 93 | 49 | 28 | 28 | 14 | 33 | 13 | 16 | <0.001 |
| Positive | 301 | 58 | 0 | 0 | 97 | 51 | 74 | 72 | 29 | 67 | 67 | 84 | |
| Local Therapy | |||||||||||||
| MAST‐RT | 285 | 40 | 17 | 52 | 103 | 40 | 49 | 42 | 23 | 39 | 34 | 40 | 0.3 |
| MAST + RT | 132 | 19 | 5 | 15 | 37 | 15 | 21 | 18 | 18 | 31 | 20 | 23 | |
| BCS‐RT | 4 | 1 | 0 | 0 | 1 | 0 | 1 | 1 | 0 | 0 | 0 | 0 | |
| BCS + RT | 293 | 41 | 11 | 33 | 114 | 45 | 47 | 40 | 18 | 31 | 32 | 37 | |
| Systemic therapy | |||||||||||||
| CT alone | 127 | 18 | 7 | 21 | 36 | 14 | 23 | 20 | 14 | 24 | 19 | 22 | 0.1 |
| HT alone | 113 | 16 | 4 | 12 | 41 | 16 | 20 | 17 | 9 | 15 | 14 | 16 | |
| CT&HT | 27 | 4 | 1 | 3 | 6 | 2 | 3 | 3 | 7 | 12 | 7 | 8 | |
| None | 447 | 63 | 21 | 64 | 172 | 68 | 72 | 61 | 29 | 49 | 46 | 54 | |
| Total | 714 | 100 | 33 | 100 | 255 | 100 | 118 | 100 | 59 | 100 | 86 | 100 | |
Abbreviations: N, number of patients; %, percentage; ER, estrogen receptor; PR, progesterone receptor; HER2, human epidermal growth factor receptor 2; MAST, mastectomy; RT, radiotherapy; BCS, breast conservative surgery; ET, endocrine therapy; CT, chemotherapy.
3.2. IHC expression of ER, PR, HER2, ki67, EGFR and CK5/6 in patient cohort
The Cohen's kappa coefficient for inter‐observer agreement of Ki67, EGFR and CK5/6 quantification were 0.71, 0.91 and 0.78 respectively. Immunohistochemical data of ER, PR, HER2, Ki67, EGFR and CK5/6 expression was available for respectively 94% (669/714) and 92% (657/714), 76% (545/714), 78% (556/714), 72% (516/714) and 79% (561/714) of all patients (Figure 2). Missing immunohistochemical data was due to lost TMA cores, insufficient tumor tissue present in the core or tissue damage of tumors. High expression of ER, PR, HER2, Ki67, EGFR and CK5/6, were found in 58% (388/669), 55% (358/657), 10% (56/545), 46% (257/556), 58% (301/516), 24% (134/561).
Figure 2.
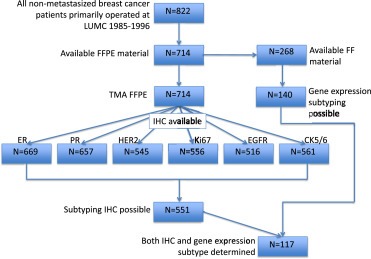
Diagram illustrating patient cohort and various stages of loss of cases due to unavailable tumor material, tumor core or tissue damage of TMA or inadequate mRNA quality as described in the Patients and methods and Results section.
3.3. Validation IHC molecular subtypes with gene expression subtypes
Subtyping with IHC was possible in 99% (140/142) of these tumors (Figure 2). We were not able to subtype the Normal‐like breast cancers using IHC, therefore this molecular subtype was excluded in analyses, leaving 117 tumors for which both IHC and gene subtyping was successful. With gene expression subtyping, 44% (51/117), 15% (18/117), 15% (17/117), 15% (17/117) and 12% (14/117), were respectively classified as Luminal A, Luminal B, HER2, Basal‐like and Unclassified. A total of 17% (20/117) cases were misclassified and 83% (97/117) of cases were classified correctly (Table 2) with IHC subtyping compared to gene expression subtyping. Cohen's kappa coefficient for inter‐assay agreement in molecular subtype classification was 0.75, which can be interpreted as a substantial agreement.
Table 2.
Correlation between immunohistochemistry and gene expression molecular subtype classification.
| Gene expression subtypes | Immunohistochemistry subtypes | Total | ||||
|---|---|---|---|---|---|---|
| Unclassified | Luminal A | Luminal B | ERBB2 | Basal | ||
| N (%) | N (%) | N (%) | N (%) | N (%) | N (%) | |
| Unclassified | 7 (43.8) | 5 (7.1) | 0 (0) | 1 (5.0) | 1 (5.3) | 14 (12.0) |
| Luminal A | 1 (6.3) | 48 (68.6) | 2 (15.4) | 0 (0) | 0 (0) | 51 (43.5) |
| Luminal B | 1 (6.3) | 0 (0) | 11 (84.6) | 3 (15.0) | 3 (15.8) | 18 (15.4) |
| ERBB2 | 0 (0) | 0 (0) | 0 (0) | 16 (80) | 1 (5.3) | 17 (14.5) |
| Basal | 0 (0) | 3 (4.3) | 0 (0) | 0 (0) | 14 (73.7) | 17 (14.5) |
| Total | 9 (100) | 56 (100) | 13 (100) | 20 (100) | 19 (100) | 117 (100) |
Abbreviations: N, number of patients; %, percentage.
3.4. Molecular subtypes distribution in patient cohort
Molecular subtypes could be determined with IHC for 77% (551/714) of all patients. Luminal A, Luminal B, ERBB2, Basal‐like an Unclassified molecular subtypes were seen in 46% (255/551), 21% (118/551), 11% (59/551), 16% (86/551), 6% (33/551) of patients respectively. Associations with known clinicopathological parameters are shown in Table 1. Statistically significant correlations were found between unfavorable tumor characteristics and more Luminal B, ERBBR2 and Basal‐like subtypes: more ductal histological tumor types, higher tumor histological grade, higher tumor stage and more lymph node positivity showed a positive association with more Luminal B, ERBBR2 and Basal‐like subtypes. A statistical significant association was found between molecular subtypes and age, where Luminal tumor types were more often found in patients aged >65 years, while ERBBR2, Basal‐like an Unclassified molecular subtypes were more often found in patients aged <65 years (p = 0.02) (Figure 1B).
3.5. Molecular subtypes and age‐related prognostic associations with outcome
The association of molecular subtypes with relapse‐free period and relative survival are shown in Figures 3 and 4. Analysis of relapse‐free period and relative survival showed a significant association molecular subtypes and clinical outcome for the whole population (RFP p = 0.003, Figure 3A; RS p < 0.001, Figure 4A), where Unclassified tumor subtypes resulted in the most favorable patient outcome, followed by Luminal A subtypes, Luminal B subtypes, Basal‐like subtypes and with the worst outcome for patients with ERBBR2 breast cancer subtypes. In patients who did not receive any systemic treatment molecular subtypes showed a similar but weaker prognostic effect (RFP p = 0.208, Figure 3D; RS p = 0.017, Figure 4D). Explanations to the loss of statistical significance may be due to loss in power due to less patients analyzed and to the fact that patients with Luminal B subtypes showed a worse outcome in patients who did not receive systemic treatment, explainable by the fact that these tumors may benefit more from chemotherapy treatment than other tumor subtypes due to the high proliferative tumor character.
Figure 3.
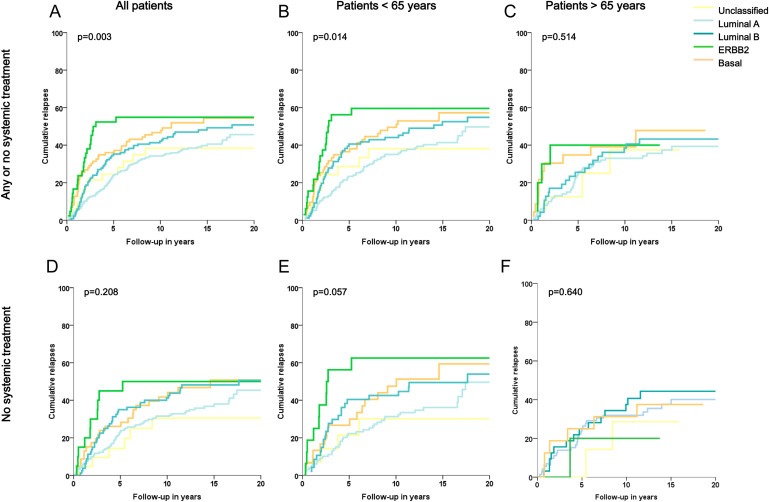
Relapse‐free period according to molecular subtypes for all patients (A, D), for patients aged < 65 years (B, E) and for patients aged > 65 years (C, F), with no stratification for systemic treatment (A, B, C) and on selected patient population that did not receive any systemic treatment (D, E, F). Log‐rank P‐values are shown in each graph.
Figure 4.

Relative survival according to molecular subtypes for all patients (A, D), for patients aged < 65 years (B, E) and for patients aged > 65 years (C, F), with no stratification for systemic treatment (A, B, C) and on selected patient population that did not receive any systemic treatment (D, E, F). Log‐rank P‐values are shown in each graph.
Similarly, in the group of patients aged <65 years, a strong association was found between molecular subtypes and clinical outcome in all patients aged <65 (RFP p = 0.014, Figure 3B; RS p < 0.001 Figure 4B) and patients aged <65 who did not receive any systemic treatment (RFP p = 0.057, Figure 3E; RS p = 0.003, Figure 4E). In patients aged >65 years, no significant association was found between molecular subtypes and clinical outcome in all patients aged >65 (RFP p = 0.514, Figure 3C; RS p = 0.126, Figure 4C) and neither in patients aged >65 who did not receive any systemic treatment (RFP p = 0.640, Figure 3F; RS p = 0.637, Figure 4F).
Univariate analyses were performed for molecular subtypes and known clinicopathological parameters: histological tumor grade, histological tumor type, tumor stage, lymph node status (due to their inclusion in molecular subtypes ER, PR, HER2, Ki67, EGFR and CK5/6 expression were not separately analyzed in univariate analysis). Multivariable analyses were performed including variables which had shown to be of influence on patient outcome (univariate p < 0.1) on patients who did not receive any systemic treatment and were stratified for age (<65 versus >65 years). In patients aged <65 years, histological grade, tumor stage, lymph node status and molecular subtypes were included in multivariate analysis for RFP and RS. The prognostic effect of molecular subtypes got weaker in both analyses; it remained statistically significant for RS analysis (p = 0.02 Table 3B), but did not reach statistical significance in RFP analysis (p = 0.5 Table 3A), probably due to their strong associations with tumor histological grade, tumor stage and lymph node status (Table 1). In patients aged >65 years, molecular subtypes did not reach the criteria to be included in multivariable analysis for RFP (Univariate p = 0.9, Table 3A) and lost statistical significance when included in multivariable RS analysis (Univariate p = 0.7, Table 3B).
Table 3.
Cox univariate and multivariate analysis for recurrence free period (A) and relative survival (B) for molecular subtypes.
| A RFP | ||||||||||||||
|---|---|---|---|---|---|---|---|---|---|---|---|---|---|---|
| Characteristic | Patients < 65 years | Patients > 65 years | ||||||||||||
| N | Univariate analysis | Multivariable analysis | N | Univariate analysis | Multivariable analysis | |||||||||
| HR | 95% CI | P | HR | 95% CI | P | HR | 95% CI | P | HR | 95% CI | P | |||
| Grade | ||||||||||||||
| I | 74 | 1.00 | 0.03 | 1.00 | 0.7 | 42 | 1.00 | <0.001 | 1.00 | 0.01 | ||||
| II | 225 | 1.32 | 0.87–2.02 | 1.13 | 0.67–1.71 | 117 | 1.84 | 0.89–3.80 | 1.48 | 0.67–3.26 | ||||
| III | 164 | 1.72 | 1.12–2.66 | 1.27 | 0.73–2.22 | 80 | 3.72 | 1.81–7.64 | 2.72 | 1.21–6.12 | ||||
| Histological type | ||||||||||||||
| Ductal | 429 | 1.00 | 0.3 | 209 | 1.00 | 0.5 | ||||||||
| Other | 36 | 1.31 | 0.82–2.10 | 30 | 1.23 | 0.69–2.22 | ||||||||
| Tumor stage | ||||||||||||||
| pT1 | 203 | 1.00 | <0.001 | 1.00 | 0.1 | 86 | 1.00 | 0.001 | 1.00 | 0.3 | ||||
| pT2 | 210 | 1.53 | 1.14–2.05 | 1.22 | 0.84–1.77 | 118 | 2.34 | 1.43–3.83 | 1.28 | 0.73–2.23 | ||||
| pT3/4 | 44 | 2.65 | 1.74–4.04 | 1.74 | 1.03–2.96 | 33 | 2.68 | 1.35–5.32 | 1.83 | 0.86–3.86 | ||||
| Nodal stage | ||||||||||||||
| Negative | 249 | 1.00 | <0.001 | 1.00 | <0.001 | 132 | 1.00 | <0.001 | 1.00 | <0.001 | ||||
| Positive | 213 | 2.85 | 2.16–3.76 | 2.41 | 1.70–3.40 | 100 | 3.18 | 2.06–4.89 | 2.60 | 1.64–4.12 | ||||
| Mol subtypes | ||||||||||||||
| Unclassified | 25 | 1.00 | 1.00 | 8 | 1.00 | |||||||||
| Luminal A | 154 | 1.02 | 0.51–2.06 | 0.01 | 1.14 | 0.52–2.50 | 101 | 1.01 | 0.31–3.28 | 0.5 | ||||
| Luminal B | 74 | 1.31 | 0.63–2.72 | 1.18 | 0.51–2.72 | 0.5 | 44 | 1.14 | 0.34–3.87 | |||||
| ERBB2 | 46 | 2.10 | 0.99–4.46 | 1.70 | 0.72–4.03 | 13 | 1.82 | 0.45–7.27 | ||||||
| Basal | 63 | 1.61 | 0.77–3.37 | 1.32 | 0.57–3.05 | 23 | 1.62 | 0.45–5.81 | ||||||
| B RS | ||||||||||||||
| N | RER | 95% CI | P | RER | 95% CI | P | N | RER | 95% CI | P | RER | 95% CI | P | |
| Grade | ||||||||||||||
| I | 74 | 1.00 | 0.008 | 1.00 | 42 | 1.00 | 0.02 | 1.00 | 0.1 | |||||
| II | 225 | 1.65 | 0.94–2.90 | 1.15 | 0.60–2.21 | 0.8 | 117 | 4.73 | 0.22–100.74 | 8.15 | 0.05–1309 | |||
| III | 164 | 2.28 | 1.30–4.02 | 1.22 | 0.62–2.40 | 80 | 10.93 | 0.55–218.77 | 16.88 | 0.10–2787 | ||||
| Histological type | ||||||||||||||
| Ductal | 429 | 1.00 | 0.2 | 209 | 1.00 | 0.8 | ||||||||
| Other | 36 | 1.44 | 0.86–2.42 | 30 | 1.12 | 0.46–2.72 | ||||||||
| Tumor stage | ||||||||||||||
| pT1 | 203 | 1.00 | <0.001 | 1.00 | 0.3 | 86 | 1.00 | 0.02 | 1.00 | 0.06 | ||||
| pT2 | 210 | 2.05 | 1.47–2.88 | 1.23 | 0.78–1.93 | 118 | 5.38 | 1.38–20.99 | 1.72 | 0.62–4.78 | ||||
| pT3/4 | 44 | 3.20 | 2.01–5.08 | 1.67 | 0.90–3.12 | 33 | 13.17 | 3.25–53.41 | 3.45 | 1.18–10.07 | ||||
| Nodal stage | ||||||||||||||
| Negative | 249 | 1.00 | <0.001 | 1.00 | <0.001 | 132 | 1.00 | 0.005 | 1.00 | 0.1 | ||||
| Positive | 213 | 3.47 | 2.51–4.80 | 2.38 | 1.57–3.60 | 100 | 3.75 | 1.50–9.42 | 1.69 | 0.85–3.34 | ||||
| Mol subtypes | ||||||||||||||
| Unclassified | 25 | 1.00 | 1.00 | 8 | 1.00 | 1.00 | ||||||||
| Luminal A | 154 | 0.92 | 0.39–2.16 | <0.001 | 1.19 | 0.44–3.26 | 0.02 | 101 | 0.63 | 0.12–3.17 | 0.07 | 1.98 | 0.18–21.25 | 0.1 |
| Luminal B | 74 | 1.49 | 0.62–3.59 | 1.60 | 0.56–4.51 | 44 | 0.39 | 0.05–3.05 | 1.00 | 0.10–10.43 | ||||
| ERBB2 | 46 | 3.00 | 1.24–7.23 | 2.82 | 0.99–8.03 | 13 | 2.16 | 0.39–12.12 | 2.85 | 0.25–32.41 | ||||
| Basal | 63 | 1.97 | 0.82–4.75 | 2.02 | 0.71–5.69 | 23 | 1.40 | 0.26–7.66 | 1.69 | 0.16–17.79 | ||||
Abbreviations: N, number of patients; HR, hazard ratio; RER, relative excess risk; 95%CI, 95% Confidence Interval. * NA not applicable; too few patients in life table.
4. Discussion
In this study, we used IHC surrogates, which we validated against gene expression determined molecular subtypes, to identify breast tumor molecular subtypes in a large cohort of breast cancer patients. We demonstrated that the distribution of molecular subtypes between elderly and young patients was statistically significantly different, where elderly patients more frequently had less aggressive Luminal A and Luminal B tumor subtypes. Moreover, both RFP and RS outcome analyses showed molecular subtypes to be a statistically significant prognostic factor in young, but not in elderly breast cancer patients.
We have shown that the distribution of molecular subtypes differed between elderly and young breast cancer patients, where we defined elderly breast cancer patients as patients aged 65 years or older according to World Health Organization definition (www.who.int). With this cut‐off point, elderly breast cancer patients showed more often Luminal A and Luminal B molecular subtypes less often ERBB2, basal and unclassified molecular subtypes. This is in line with a previous study by Perou et al., who investigated the associations of molecular subtypes with patient clinical data, demographic data and survival (Carey et al., 2006). Though they did not specifically look at elderly breast cancer patients, in this study on almost 500 breast cancer patients, molecular subtypes as assessed by immunohistochemistry, were statistically significantly associated with age, where Luminal A and Luminal B tumor were more often found in older aged patients (Carey et al., 2006). In addition our data are also concordant to previous studies that showed more ER and/or PR positivity and less overexpression of EGFR, HER2 and ki67 in tumors of elderly breast cancer patients (Eppenberger‐Castori et al., 2002; Nixon et al., 1994).
In addition to differing distributions in molecular subtypes, we found a different prognostic effect for molecular subtypes in elderly breast cancer patients compared to their younger counterparts. In the period analyzed adjuvant systemic treatment changed, where not all hormone receptor positive patients received adjuvant endocrine therapy and trastuzumab was not yet introduced. In addition, breast cancer patients received different adjuvant therapy according to their age, where elderly received less aggressive treatment regimens. Considering these differences in adjuvant therapy regimens between analyzed patients and in order to analyze a true prognostic effect, we stratified our analyses and selected patients who did not receive any adjuvant treatment, hereby filtering out any predictive adjuvant therapy effect. In the whole breast cancer cohort and in young breast cancer patients molecular subtypes showed to be statistically significant prognostic factors for RFP and RS. These prognostic effects weakened in multivariable analyses, however this could well be explained by correction for tumor histological grade, tumor stage and lymph node status and the strong associations of molecular subtypes with these unfavorable tumor characteristics. Importantly, molecular subtypes did not show any statistically significant effect on patient outcome in elderly breast cancer patients in this study. Further underlying differences in tumor biology might explain this fading prognostic effect. These underlying biological differences may result in the molecular subtypes to behave differently and have a different effect on tumor progression in elderly breast cancer patients, which may be reflected in a differing prognostic effect of the same molecular subtype in elderly compared to young patients. Indeed, as shown priory by others, elderly breast cancer tumors are of a more indolent and less aggressive and proliferative character (Eppenberger‐Castori et al., 2002; Nixon et al., 1994; Thomas and Leonard, 2009). However, this contradicts the fact that increased breast cancer specific mortality is seen with ageing, where elderly breast cancer patients were found to decease more often due to breast cancer regardless of a higher risk of mortality from other causes (van de Water et al., 2012). Joining these paradoxal findings together, an explanation might be sought in differences in the tumor microenvironment in elderly breast cancer patients compared to young breast cancer patients. With increasing age, there appears to be a progressive accumulation of cellular and molecular alterations leading to tissue dysfunction (Naumova et al., 2011; Teschendorff et al., 2010). This may apply to the tumor micro‐environment, thereby facilitating tumor progression. Evidence has shown that an age‐related decline of functional innate and adaptive immunity leads to a reduced ability to respond to infection and vaccinations (Aw et al., 2007). This phenomenon, known as immunosenescence, is characterized by a decreased output of naïve T cells, altered cytokine production and inoptimale functioning of T cells, B cells and NK cells (Aw et al., 2007; Campos et al., 2014; Gayoso et al., 2011; Pawelec et al., 2005). There has been increasing evidence that immunosenescence might promote cancer progression in elderly breast cancer patients, which would explain the worse breast cancer specific outcome of these patients (Fulop et al., 2010). If tumors become less aggressive with increasing age, but this is simultaneously accompanied by an even faster deteriorating host defence, i.e. tumor micro‐environment, this altogether can result in more tumor progression and finally lead to worse patient outcome.
Another explanation for the finding that molecular subtypes are not statistically significant prognostic indicators in elderly breast cancer may be the competing risks of death in elderly patients. Elderly breast cancer patients compared to their younger counterparts have shown in absolute sense to develop more relapses (van de et al., 2012), however proportionally due to higher risk of dying earlier and from other causes they show less breast cancer relapses and breast cancer specific deaths (Bastiaannet et al., 2010, 2011; Wildiers et al., 2007). In fact, as shown by Figure 5 the approximated breast cancer specific decease declines as the patients age increases. Only about 60% of elderly breast cancer patients die as a consequence of breast cancer, compared to almost 100% of young patients. This has major implications on the impact and value of prognostic biomarkers in elderly breast cancer patients. Prognostic biomarkers, identifying patients with low versus high risk of breast cancer progression and breast cancer related death will show limited to no prognostic effect in the 40% of elderly patients which have a short‐term prognosis due to breast cancer un‐related causes, especially in those who are considered frail. These elderly patients are also unlikely to benefit from systemic treatment, since their cause of death will be other than due to breast cancer. Therefore, the clinical value of prognostic biomarkers, which aid at distinguishing between patients who might and might not benefit from systemic treatment, is also limited in this patient population. Breast cancer prognostic biomarkers can only have a prognostic value in elderly patients whose life expectation will be long enough for the cancer to progress and cause patient death, which are the patients reflected by the 60% of elderly breast cancer patients dying as a consequence of breast cancer. It is only in these fit enough patients that prognostic biomarkers may show differences in outcome between elderly breast cancer patients and may aid clinical decision making on systemic treatment. In order to improve tailored treatment in elderly with the aid of prognostic biomarkers, the first step would therefore be to identify these fit elderly patients.
Figure 5.
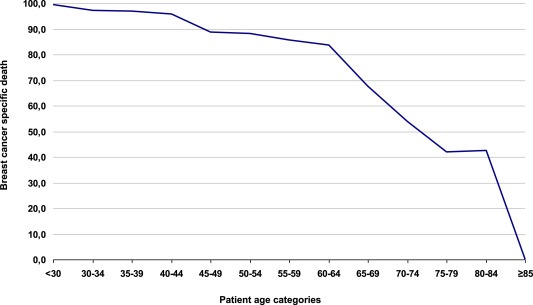
Breast cancer specific death per age category calculated by the percentage of observed death (O%) minus the expected death based on the general population according to age and time period (E%) divided by the total observed death (O%) per age category for the cohort breast cancer patients used in this study. Death cancer specific death calculation: (O%–E%/E%).
The identification of breast cancer molecular subtypes has proven breast cancer to be a heterogeneous group of diseases, needing different approaches to systemic treatment administration. This molecular taxonomy and its impact on patient clinical outcome have been extensively investigated in breast cancer. However, as is the case for most translational studies and randomized clinical trials, these studies included relatively young patients. To the best of our knowledge, we are the first to have shown that molecular subtypes have a different distribution and prognostic effect in elderly compared to young breast cancer patients, highlighting the fact that the prognostic effect and clinical value as found for biomarkers in translational studies and randomized trials, cannot simply be extrapolated to elderly breast cancer patients. Our results support the premise that breast cancer clinical behavior is significantly affected by patient age. We suggest that competing risks of death in elderly patients, ER‐driven differences and micro‐environmental changes in biology are underlying these age‐dependent variations in patient prognosis.
Disclaimer
None of the authors who contributed to this article have any financial or personal relationships with people or organizations that could inappropriately influence the data published.
Acknowledgments
We would like to thank Dr. J.G.H. van Nes for her help with the database and colleagues at the research laboratory of the surgery department at the LUMC for their help and advice. In addition we would like to thank Therese Sorlie and the Department of Genetics from The Norwegian Radium Institute, Olso, Norway, for determination of the genetic molecular subtype determination.
Acknowledgments of research support: Dutch Cancer Society (KWF 2007‐3968).
de Kruijf Esther M., Bastiaannet Esther, Rubertá Francesca, de Craen Anton J.M., Kuppen Peter J.K., Smit Vincent T.H.B.M., van de Velde Cornelis J.H. and Liefers Gerrit Jan, (2014), Comparison of frequencies and prognostic effect of molecular subtypes between young and elderly breast cancer patients, Molecular Oncology, 8, doi: 10.1016/j.molonc.2014.03.022.
References
- Anderson, W.F. , Jatoi, I. , Sherman, M.E. , 2009. Qualitative age interactions in breast cancer studies: mind the gap. J. Clin. Oncol.. 27, 5308–5311. [DOI] [PMC free article] [PubMed] [Google Scholar]
- Aw, D. , Silva, A.B. , Palmer, D.B. , 2007. Immunosenescence: emerging challenges for an ageing population. Immunology. 120, 435–446. [DOI] [PMC free article] [PubMed] [Google Scholar]
- Bastiaannet, E. , Liefers, G.J. , de Craen, A.J. , Kuppen, P.J. , van de Water, W. , Portielje, J.E. , van der Geest, L.G. , Janssen-Heijnen, M.L. , Dekkers, O.M. , van de Velde, C.J. , Westendorp, R.G. , 2010. Breast cancer in elderly compared to younger patients in The Netherlands: stage at diagnosis, treatment and survival in 127,805 unselected patients. Breast Cancer Res. Treat.. 124, 801–807. [DOI] [PubMed] [Google Scholar]
- Bastiaannet, E. , Portielje, J.E. , van de, V. , de Craen, A.J. , van de, V. , Kuppen, P.J. , van der Geest, L.G. , Janssen-Heijnen, M.L. , Dekkers, O.M. , Westendorp, R.G. , Liefers, G.J. , 2011. Lack of survival gain for elderly women with breast cancer. Oncologist. 16, 415–423. [DOI] [PMC free article] [PubMed] [Google Scholar]
- Beadle, B.M. , Woodward, W.A. , Buchholz, T.A. , 2011. The impact of age on outcome in early-stage breast cancer. Semin. Radiat. Oncol.. 21, 26–34. [DOI] [PMC free article] [PubMed] [Google Scholar]
- Campos, C. , Pera, A. , Sanchez-Correa, B. , Alonso, C. , Lopez-Fernandez, I. , Morgado, S. , Tarazona, R. , Solana, R. , 2014 Jan 17. Effect of age and CMV on NK cell subpopulations. Exp. Gerontol.. pii:S0531-5565(14)00011-4. http://dx.doi.org/10.1016/j.exger.2014.01.008. [Epub ahead of print] [DOI] [PubMed] [Google Scholar]
- Carey, L.A. , Perou, C.M. , Livasy, C.A. , Dressler, L.G. , Cowan, D. , Conway, K. , Karaca, G. , Troester, M.A. , Tse, C.K. , Edmiston, S. , Deming, S.L. , Geradts, J. , Cheang, M.C. , Nielsen, T.O. , Moorman, P.G. , Earp, H.S. , Millikan, R.C. , 2006. Race, breast cancer subtypes, and survival in the Carolina Breast Cancer Study. JAMA. 295, 2492–2502. [DOI] [PubMed] [Google Scholar]
- Daidone, M.G. , Coradini, D. , Martelli, G. , Veneroni, S. , 2003. Primary breast cancer in elderly women: biological profile and relation with clinical outcome. Crit. Rev. Oncol. Hematol.. 45, 313–325. [DOI] [PubMed] [Google Scholar]
- de Kruijf, E.M. , van Nes, J.G. , Sajet, A. , Tummers, Q.R. , Putter, H. , Osanto, S. , Speetjens, F.M. , Smit, V.T. , Liefers, G.J. , van de Velde, C.J. , Kuppen, P.J. , 2010. The predictive value of HLA class I tumor cell expression and presence of intratumoral Tregs for chemotherapy in patients with early breast cancer. Clin. Cancer Res.. 16, 1272–1280. [DOI] [PubMed] [Google Scholar]
- Diab, S.G. , Elledge, R.M. , Clark, G.M. , 2000. Tumor characteristics and clinical outcome of elderly women with breast cancer. J. Natl. Cancer Inst.. 92, 550–556. [DOI] [PubMed] [Google Scholar]
- Du, P. , Kibbe, W.A. , Lin, S.M. , 2008. Lumi: a pipeline for processing Illumina microarray. Bioinformatics. 24, 1547–1548. [DOI] [PubMed] [Google Scholar]
- Early Breast Cancer Trialists' Collaborative Group 2005. Effects of chemotherapy and hormonal therapy for early breast cancer on recurrence and 15-year survival: an overview of the randomised trials. Lancet. 365, 1687–1717. [DOI] [PubMed] [Google Scholar]
- Eppenberger-Castori, S. , Moore, D.H. , Thor, A.D. , Edgerton, S.M. , Kueng, W. , Eppenberger, U. , Benz, C.C. , 2002. Age-associated biomarker profiles of human breast cancer. Int. J. Biochem. Cell Biol.. 34, 1318–1330. [DOI] [PubMed] [Google Scholar]
- Fulop, T. , Kotb, R. , Fortin, C.F. , Pawelec, G. , de, A.F. , Larbi, A. , 2010. Potential role of immunosenescence in cancer development. Ann. N. Y. Acad. Sci.. 1197, 158–165. [DOI] [PubMed] [Google Scholar]
- Gayoso, I. , Sanchez-Correa, B. , Campos, C. , Alonso, C. , Pera, A. , Casado, J.G. , Morgado, S. , Tarazona, R. , Solana, R. , 2011. Immunosenescence of human natural killer cells. J. Innate. Immun.. 3, 337–343. [DOI] [PubMed] [Google Scholar]
- Goldhirsch, A. , Wood, W.C. , Gelber, R.D. , Coates, A.S. , Thurlimann, B. , Senn, H.J. , 2007. Progress and promise: highlights of the international expert consensus on the primary therapy of early breast cancer 2007. Ann. Oncol.. 18, 1133–1144. [DOI] [PubMed] [Google Scholar]
- Naumova, E. , Ivanova, M. , Pawelec, G. , 2011. Immunogenetics of ageing. Int. J. Immunogenet.. 38, 373–381. [DOI] [PubMed] [Google Scholar]
- Nielsen, T.O. , Hsu, F.D. , Jensen, K. , Cheang, M. , Karaca, G. , Hu, Z. , Hernandez-Boussard, T. , Livasy, C. , Cowan, D. , Dressler, L. , Akslen, L.A. , Ragaz, J. , Gown, A.M. , Gilks, C.B. , van de, R.M. , Perou, C.M. , 2004. Immunohistochemical and clinical characterization of the basal-like subtype of invasive breast carcinoma. Clin. Cancer Res.. 10, 5367–5374. [DOI] [PubMed] [Google Scholar]
- Nixon, A.J. , Neuberg, D. , Hayes, D.F. , Gelman, R. , Connolly, J.L. , Schnitt, S. , Abner, A. , Recht, A. , Vicini, F. , Harris, J.R. , 1994. Relationship of patient age to pathologic features of the tumor and prognosis for patients with stage I or II breast cancer. J. Clin. Oncol.. 12, 888–894. [DOI] [PubMed] [Google Scholar]
- Pawelec, G. , Akbar, A. , Caruso, C. , Solana, R. , Grubeck-Loebenstein, B. , Wikby, A. , 2005. Human immunosenescence: is it infectious?. Immunol. Rev.. 205, 257–268. [DOI] [PubMed] [Google Scholar]
- Perou, C.M. , Sorlie, T. , Eisen, M.B. , van de, R.M. , Jeffrey, S.S. , Rees, C.A. , Pollack, J.R. , Ross, D.T. , Johnsen, H. , Akslen, L.A. , Fluge, O. , Pergamenschikov, A. , Williams, C. , Zhu, S.X. , Lonning, P.E. , Borresen-Dale, A.L. , Brown, P.O. , Botstein, D. , 2000. Molecular portraits of human breast tumours. Nature. 406, 747–752. [DOI] [PubMed] [Google Scholar]
- Petrakis, I.E. , Paraskakis, S. , 2010. Breast cancer in the elderly. Arch. Gerontol. Geriatr.. 50, 179–184. [DOI] [PubMed] [Google Scholar]
- Putter, H. , Fiocco, M. , Geskus, R.B. , 2007. Tutorial in biostatistics: competing risks and multi-state models. Stat. Med.. 26, 2389–2430. [DOI] [PubMed] [Google Scholar]
- Remvikos, Y. , Magdelenat, H. , Dutrillaux, B. , 1995. Genetic evolution of breast cancers. III: Age-dependent variations in the correlations between biological indicators of prognosis. Breast Cancer Res. Treat.. 34, 25–33. [DOI] [PubMed] [Google Scholar]
- Sorlie, T. , Perou, C.M. , Tibshirani, R. , Aas, T. , Geisler, S. , Johnsen, H. , Hastie, T. , Eisen, M.B. , van de, R.M. , Jeffrey, S.S. , Thorsen, T. , Quist, H. , Matese, J.C. , Brown, P.O. , Botstein, D. , Eystein, L.P. , Borresen-Dale, A.L. , 2001. Gene expression patterns of breast carcinomas distinguish tumor subclasses with clinical implications. Proc. Natl. Acad. Sci. U.S.A.. 98, 10869–10874. [DOI] [PMC free article] [PubMed] [Google Scholar]
- Sorlie, T. , Tibshirani, R. , Parker, J. , Hastie, T. , Marron, J.S. , Nobel, A. , Deng, S. , Johnsen, H. , Pesich, R. , Geisler, S. , Demeter, J. , Perou, C.M. , Lonning, P.E. , Brown, P.O. , Borresen-Dale, A.L. , Botstein, D. , 2003. Repeated observation of breast tumor subtypes in independent gene expression data sets. Proc. Natl. Acad. Sci. U.S.A.. 100, 8418–8423. [DOI] [PMC free article] [PubMed] [Google Scholar]
- Teschendorff, A.E. , Menon, U. , Gentry-Maharaj, A. , Ramus, S.J. , Weisenberger, D.J. , Shen, H. , Campan, M. , Noushmehr, H. , Bell, C.G. , Maxwell, A.P. , Savage, D.A. , Mueller-Holzner, E. , Marth, C. , Kocjan, G. , Gayther, S.A. , Jones, A. , Beck, S. , Wagner, W. , Laird, P.W. , Jacobs, I.J. , Widschwendter, M. , 2010. Age-dependent DNA methylation of genes that are suppressed in stem cells is a hallmark of cancer. Genome Res.. 20, 440–446. [DOI] [PMC free article] [PubMed] [Google Scholar]
- Thomas, G.A. , Leonard, R.C. , 2009. How age affects the biology of breast cancer. Clin. Oncol. (R. Coll. Radiol.). 21, 81–85. [DOI] [PubMed] [Google Scholar]
- van de, W.W. , Markopoulos, C. , van de, V. , Seynaeve, C. , Hasenburg, A. , Rea, D. , Putter, H. , Nortier, J.W. , de Craen, A.J. , Hille, E.T. , Bastiaannet, E. , Hadji, P. , Westendorp, R.G. , Liefers, G.J. , Jones, S.E. , 2012. Association between age at diagnosis and disease-specific mortality among postmenopausal women with hormone receptor-positive breast cancer. JAMA. 307, 590–597. [DOI] [PubMed] [Google Scholar]
- van Nes, J.G. , de Kruijf, E.M. , Faratian, D. , van de Velde, C.J. , Putter, H. , Falconer, C. , Smit, V.T. , Kay, C. , van de Vijver, M.J. , Kuppen, P.J. , Bartlett, J.M. , 2011 Feb. COX2 expression in prognosis and in prediction to endocrine therapy in early breast cancer patients. Breast Cancer Res. Treat.. 125, (3) 671–685. 10.1007/s10549-010-0854-7 [Epub 2010 Apr 1] [DOI] [PubMed] [Google Scholar]
- Wildiers, H. , Kunkler, I. , Biganzoli, L. , Fracheboud, J. , Vlastos, G. , Bernard-Marty, C. , Hurria, A. , Extermann, M. , Girre, V. , Brain, E. , Audisio, R.A. , Bartelink, H. , Barton, M. , Giordano, S.H. , Muss, H. , Aapro, M. , 2007. Management of breast cancer in elderly individuals: recommendations of the International Society of Geriatric Oncology. Lancet Oncol.. 8, 1101–1115. [DOI] [PubMed] [Google Scholar]