Abstract
Regulatory T cell (T‐reg) enrichment in the tumor microenvironment is regarded as an important mechanism of tumor immune escape. Hence, the presence of T‐regs in highly malignant pancreatic ductal adenocarcinoma (PDAC) is correlated with short survival. Likewise, the adhesion molecule L1CAM is upregulated during PDAC progression in the pancreatic ductal epithelium also being associated with poor prognosis. To investigate whether L1CAM contributes to enrichment of T‐regs in PDAC, human CD4+CD25+CD127−CD49d− T‐regs and CD4+CD25− T‐effector cells (T‐effs) were isolated by magnetic bead separation from blood of healthy donors. Their phenotype and functional behavior were analyzed in dependence on human premalignant (H6c7) or malignant (Panc1) pancreatic ductal epithelial cells, either exhibiting or lacking L1CAM expression. T cells derived from blood and tumors of PDAC patients were analyzed by flow cytometry and findings were correlated with clinical parameters. Predominantly T‐regs but not T‐effs showed an increased migration on L1CAM expressing H6c7 and Panc1 cells. Whereas proliferation of T‐regs did not change in the presence of L1CAM, T‐effs proliferated less, exhibited a decreased CD25 expression and an increased expression of CD69. Moreover, these T‐effs exhibited a regulatory phenotype as they inhibited proliferation of autologous T cells. Accordingly, CD4+CD25−CD69+ T cells were highly abundant in PDAC tissues compared to blood being associated with nodal invasion and higher grading in PDAC patients. Overall, these data point to an important role of L1CAM in the enrichment of immunosuppressive T cells in particular of a CD4+CD25−CD69+‐phenotype in PDAC providing a novel mechanism of tumor immune escape which contributes to tumor progression.
Keywords: Immune evasion, CD171, Pancreatic adenocarcinoma, Tumor stroma, Regulatory T cells, Malignant progression
Highlights
L1CAM is expressed in chronic pancreatitis (CP) and pancreatic ductal adenocarcinoma (PDAC).
L1CAM promotes the generation of immunosuppressive CD4+CD25−CD69+ T‐cells.
CD4+CD25−CD69+ T cells are enriched in pancreatic tissues of CP and PDAC patients.
High numbers of CD4+CD25−CD69+ T‐cells in PDAC tissues associates with malignant progression.
L1CAM contributes to the generation of an immunosuppressive tumor stroma in PDAC.
Abbreviations
- CP
chronic pancreatitis
- PBMC
Peripheral blood mononuclear cells
- PDAC
pancreatic ductal adenocarcinoma
- T-effs
CD4+ effector T cells
- T-effsa
autologous T-effs
- TGF-β1
Transforming-growth factor-beta 1
- T-regs
regulatory T cells
1. Introduction
Pancreatic ductal adenocarcinoma (PDAC) belongs to the most malignant tumors with an overall 5‐year‐survival rate of ∼2% (Siegel et al., 2013). Since the tumor is mostly diagnosed in an advanced stage, curative therapeutic options are limited to less than 20% of the patients. Moreover, PDAC exerts a profound radio‐ and chemotherapy resistance worsening therapeutic responses and prognosis of these patients (Schneider et al., 2005). Expression of the adhesion molecule L1CAM (CD171) increases during PDAC progression in the ductal epithelium (Sebens Müerköster et al., 2007; Geismann et al., 2009; Bergmann et al., 2010; Ben et al., 2010) being associated with poor prognosis of PDAC patients (Ben et al., 2010). Accordingly, L1CAM induces tumorigenicity of premalignant pancreatic ductal epithelial (H6c7) cells as well as migration, apoptosis resistance and metastasis of H6c7 and PDAC cells in vitro and in vivo (Sebens Müerköster et al., 2007; Geismann et al., 2009; Schäfer et al., 2012). L1CAM expression is induced by myofibroblasts (Geismann et al., 2009) being part of the pronounced desmoplastic reaction in chronic pancreatitis (CP) and PDAC (Kleeff et al., 2007). Besides myofibroblasts, the PDAC stroma is largely comprised of extracellular matrix proteins and immune cells, e.g. T cells (Kleeff et al., 2007). Given an immunosuppressive phenotype of the majority of tumor associated immune cells, their presence is regarded as an immune escape mechanism of the tumor. Additionally, immune cells might foster tumorigenesis by other mechanisms, e.g. by promoting angiogenesis, tumor cell migration and metastasis (Kleeff et al., 2007; Zou, 2005).
Accordingly, elevated levels of regulatory T cells (T‐regs) have been identified in blood and tumors of PDAC patients being associated with poor prognosis (Liyanage et al., 2002; Hiroaka et al., 2006; Ikemoto et al., 2006). Similar to L1CAM, T‐regs have been already detected in tissues of CP which represents a high‐risk factor for PDAC (Hiroaka et al., 2006; Schmitz‐Winnenthal et al., 2010). Accumulation of T‐regs in tumors can be mediated e.g. by CCL5 or CXCL12 released by tumor or stromal cells (Zou et al., 2004; Tan et al., 2009), an altered addressin‐expression on tumoral endothelial cells (Nummer et al., 2007) or the conversion of conventional T cells into T‐regs through transforming growth factor‐beta 1 (TGF‐β1) (Moo‐Young et al., 2009) overexpressed in CP and PDAC tissues, too (Farrow et al., 2002; Yen et al., 2002).
The T‐reg's ability to suppress CD4+ T effector cells (T‐effs) is essential for the maintenance of peripheral tolerance, but also represents one major strategy of tumor immune evasion (Zou, 2005; Liyanage et al., 2002). T‐regs are characterized by the constitutive expression of CD25 and the transcription factor forkhead FoxP3 (FoxP3) which are both widely used for the detection of T‐regs (Liyanage et al., 2002; Hiroaka et al., 2006; Ikemoto et al., 2006). However, both markers are transiently expressed by activated T‐effs, too, so that it is very likely that detection of CD4+CD25+ or CD4+Foxp3+ T cells does not exclusively mark T‐regs. Consequently, functional analysis of T‐regs might be impaired by contaminating T‐effs and targeting of T‐regs (e.g. by CD25‐antibodies). Recently, other markers have been introduced more suitable for a better discrimination of T‐effs and T‐regs on the one hand and the isolation of untouched cells for functional analyses on the other hand. In detail, Kleinwietfeld et al. demonstrated that highly immunosuppressive T‐regs completely lack expression of CD49d, the α‐chain of the integrin VLA‐4, and CD127 which is the α‐chain of the IL‐7 receptor (Kleinewietfeld et al., 2009). Thus, by removing CD49d+CD127+ cells from the pool of CD4+ T cells Foxp3+ T‐regs are obtained free of contaminating, possibly activated CD25+ T‐effs and bound antibodies which might affect T cell function (Kleinewietfeld et al., 2009). Moreover, some studies in mice have described a novel subpopulation of T‐regs with a CD4+CD25−CD69+ phenotype lacking FoxP3 expression but exhibiting elevated secretion of IL‐10 and TGF‐β1 and clearly inhibiting proliferation of T‐effs (Han et al., 2009; Sancho et al., 2005).
This study therefore aimed at improving the characterization of human T‐regs and T‐effs i) ex vivo in blood and pancreatic tissues of CP or PDAC patients, and ii) in vitro regarding the role of L1CAM based on an untouched isolation procedure for both T‐cell populations and a direct coculture system using benign and malignant pancreatic ductal epithelial cells. Thereby, this study essentially contributes to a better understanding of how immunosuppressive T cells accumulate during initiation and progression of PDAC.
2. Material & methods
2.1. Cell lines and cell culture
H6c7 human pancreatic ductal epithelial cells (obtained from Prof. M.S. Tsao, Ontario Cancer Center, Toronto, Canada) lacking L1CAM expression and thereby resembling the conditions in normal ductal epithelium were retrovirally transduced with an empty (mock) or a human L1CAM expression vector and cultured as described (Riedle et al., 2009; Müerköster et al., 2008; Stoeck et al., 2006). Panc1 PDAC cells (obtained from ATCC) being characterized by high L1CAM expression and correlating with the conditions in PDAC were cultured as described (Geismann et al., 2009) and stably transfected with the pLVX vector (Clontech/Takara Bio Europe, Saint‐Germain‐en‐Laye, France) containing shRNA against firefly luciferase (Panc1L1high) or L1CAM (Panc1L1low). Transfected clones were selected by culturing with 0.67 μg/mL puromycin (PAA‐Laboratories, Cölbe, Germany). The genotype of both parental cell lines was recently confirmed by Short Tandem Repeats Analysis. The phenotype regarding L1CAM expression was confirmed prior to each coculture experiment (see 2.12).
2.2. Patients
Blood and fresh pancreatic tissues from 22 PDAC (median age: 63,5) and 5 CP (median age: 61) were obtained from the Surgery Department of the Community Hospital Kiel and Department of General and Thoracic Surgery, UKSH Campus Kiel. As control, blood from 22 age‐matched healthy controls (median age: 61) was analyzed with informed consent obtained. The research was approved by the ethics committee of the UKSH (reference number: D430/09).
2.3. Isolation of PBMC from blood and pancreatic tissues
Human peripheral blood mononuclear cells (PBMCs) were obtained from healthy volunteers.
CP and PDAC patients by Pancoll (Pan‐Biotech GmbH, Aidenbach, Germany) density‐gradient centrifugation of heparinized venous blood. Tissue‐derived immune cells were obtained from pancreatic tissues which was cut in small pieces and cultured in 1 ml RPMI‐1640 medium supplemented with 10% FCS and 1% Penicillin/Streptomycin (all from PAA‐Laboratories) in 24‐well culture plates (Greiner) for 24 h. Supernatants containing cells migrated out of the tissues were harvested and cells were washed and resuspended in MACS‐buffer before immunofluorescence staining and subsequent flow cytometry.
2.4. Isolation of peripheral blood T‐regs and T‐effs
Isolation of T‐regs and T‐effs from blood of healthy donors was performed by negative selection using magnetic cell separation as described (Kleinewietfeld et al., 2009) with minimal modifications. Briefly, CD4+ T cells were negatively enriched from PBMCs using the CD4+ T‐cell enrichment Kit II (Miltenyi Biotec, Bergisch‐Gladbach, Germany) according to the manufacturer's instructions. Untouched T‐regs were isolated from CD4+ enriched T cells by double staining with biotin‐conjugated anti‐CD49d (mIgG2b, MZ18/24A9) and anti‐CD127 (mIgG2a, MB15/18C9) mAbs (both from Miltenyi Biotec) for 10 min at 4 °C followed by addition of Streptavidin‐conjugated magnetic beads and a further incubation period for 15 min at 4 °C. Afterward, cells were washed with MACS‐buffer and eluted after passing a LD MACS‐separation column. In parallel, 1‐5x10⁷ pre‐enriched CD4+ T cells were stained with magnetic beads‐conjugated anti‐CD25 mAb (mIgG1) and eluted as CD25− T‐effs through another LD column. The purity and characteristics of both freshly isolated T cell subsets were determined by immunofluorescence staining and subsequent flow cytometry (see 2.5).
2.5. Immunofluorescence staining and flow cytometry
Extra‐ and intracellular immunofluorescence stainings of T cells were conducted using the following specific primary mouse anti‐human mAbs: FITC‐conjugated anti‐CD4 (mIgG2b, OKT4); Alexa Fluor488‐conjugated anti‐CD127 (mIgG1, HCD127); PE‐conjugated anti‐CD49d (mIgG1, 9F10); PerCP/Cy5.5‐conjugated anti‐CD127 (mIgG1, HCD127), ‐CD49d (mIgG1, 9F10), ‐CD4 (mIgG2b, OKT4); ‐LAP (TGF‐ß1, mIgG1, TW4‐2F8); APC‐conjugated anti‐CD25 (mIgG2b, 4E3), ‐CD69 (mIgG1, FN50), all obtained from BioLegend (Fell, Germany); PE‐conjugated anti‐CD25 (IgG2b, 4E3), biotin‐conjugated anti‐CD49d and ‐CD127, all from Miltenyi Biotec GmbH; FITC‐conjugated anti‐Ki‐67 (mIgG1, 35/Ki‐67, BD Bioscience, Heidelberg, Germany) and human/non‐human primate regulatory T cell staining kit 1 (eBioscience, Frankfurt, Germany), containing PE‐conjugated anti‐FoxP3 (ratIgG2a, PCH101), ‐ratIgG2a, FITC‐conjugated anti‐CD4 (OKT4) and APC‐conjugated anti‐CD25 (BC96). Control staining was performed with corresponding FITC‐, PE‐, Streptavidin‐PerCP/Cy5.5‐ or biotin‐conjugated mIgG1 (MOCP‐21), PE‐ or biotin‐conjugated mIgG2a (MOCP‐173); FITC‐, or APC‐conjugated mIgG2b (MPC/11), all obtained from BioLegend and PE‐conjugated mIgG1 (P3.6.2.8.1, eBioscience) isotype control antibodies. In addition, Streptavidin‐PerCP/Cy5.5 (Biolegend) was used as secondary staining reagent. Staining of surface molecules was always performed by incubating cells with specific mAbs or the respective isotype control for 15 min at 4 °C in the dark and at a concentration as recommended by the manufacturer. Then, cells were washed with MACS‐buffer (see above) and fixed with 1% formaldehyde (BÜFA Chemicals GmbH&Co.KG, Hude, Germany). In case of biotin‐conjugated mAbs, cells were incubated with Streptavidin‐PerCp/Cy5.5 at a final concentration of 1:100 for 15 min at 4 °C followed by a second washing step before fixation. When combining extra‐cellular and intra‐cellular stainings, first the surface staining was performed. After the last washing step, cells were treated with freshly prepared fixation/permeabilization solution for 10 min at room temperature in the dark, washed with permeabilization buffer (both from eBioscience) and followed by incubation with fluorochrom‐conjugated specific mAbs diluted in permeabilization buffer for 10 min at room temperature in the dark. After washing with permeabilization buffer, cells were finally fixed with 1% formaldehyde. Flow cytometric analysis was always performed with a FACS Calibur (BD Biosciences, Heidelberg, Germany) equipped with an argon laser.
2.6. Direct coculture of T cells and pancreatic cells
Five × 103 cells/well of either H6c7‐mock, H6c7‐L1CAM, Panc1L1low or Panc1L1high cells were seeded in the respective medium (without puromycin) into 96‐well‐round bottom plates (Greiner, Frickenhausen, Germany). After 24 h, medium was removed and 1 × 10⁴ freshly isolated T‐regs or T‐effs, diluted in X‐Vivo medium/well (Lonza, Köln, Germany) were added, either in the absence or presence of 5 × 10³ T cell activation/expansion beads (Miltenyi Biotec) prepared according to the manufacturer's instructions. T cells were separated from adherent pancreatic cells 72 h later by washing with MACS‐buffer and then underwent immunofluorescence staining.
2.7. Culture of T‐effs on L1CAM‐Fc and control‐Fc coated plates
Ninety‐six well‐round bottom plates (Greiner) were coated with 100 μl/well of recombinant human L1CAM‐Fc Chimera (IgG1, CAA42508) or control IgG1 Fc (P01857), both from R&D Systems (Wiesbaden, Germany), each diluted at 1 μg/ml in PBS. After overnight coating at 4 °C, supernatants were removed followed by a 15 min blocking period with 100 μl/well FCS at 4 °C. After two‐times washing with PBS, 1 × 10⁴/well freshly isolated T‐effs were seeded in 100 μl X‐Vivo medium and cultured in the presence of 5 × 10³/well T cell activation/expansion beads (Miltenyi Biotec). After 72 h, T‐effs were harvested, washed with MACS‐buffer and underwent immunofluorescence staining for CD25, CD69 and Ki67, as described above.
2.8. Culture of T‐effs in supernatants of H6c7‐mock and H6c7‐L1CAM cells
To generate conditioned medium from H6c7‐mock and H6c7‐L1CAM cells for T‐cell cultivation, both cell lines were seeded at 2 × 10⁵/well in 2 ml of the respective medium (without puromycin) into a 6‐well culture plate (Greiner). After overnight culture, medium was removed and substituted by 2 ml X‐Vivo medium/well followed by another 72 h of culture. Then, supernatants were harvested, centrifuged and used for T cell cultivation. Therefore, freshly isolated 1 × 10⁴/well T‐effs were seeded either in H6c7‐mock or H6c7‐L1CAM conditioned medium into 96‐well‐round bottom plates (Greiner) and cultured in the absence or presence of 5 × 10³/well T cell activation/expansion beads (Miltenyi Biotec). After 72 h, T‐effs were harvested and characterized by immunofluorescence staining as described above.
2.9. Inhibition of autologous T‐eff proliferation by cocultured T‐effs
One x105/well freshly isolated autologous T‐effs (T‐effsa) were seeded in X‐Vivo medium into 96‐well‐round‐bottom plates and cultured for 72 h in parallel to T‐effs/pancreatic cell cocultures. After removing supernatants, T cells were harvested from the cocultures, washed and added to the T‐effsa at a ratio of 1:75. Finally, 0.5 × 10⁵ T cell activation/expansion beads/well (Miltenyi Biotec) were added to all settings and T cells were cultured for another 72 h. After removing the supernatants, T cells were resuspended in MACS‐buffer and subject of Ki67 immunofluorescence staining.
As indicated in the text, cocultured T‐effs were separated into CD25+ and CD25− T cell subsets prior addition to T‐effsa. For this purpose, T‐effs that had been cocultured with H6c7‐L1CAM cells, were harvested and the CD25− T cell fraction was isolated by negative magnetic cell separation, as described for the isolation of T‐effs from PBMC in Section 2.4. CD25+ T cells, which were enriched in the separation column during depletion of CD25− T cells, were eluted by washing the column with MACS‐buffer out of the magnetic field. Then, these CD25+ and CD25− T cells were added to T‐effsa as described above.
2.10. Inhibition of T‐eff proliferation by freshly isolated T‐regs
Freshly isolated T‐effs and T‐regs were cocultured in 96‐well round‐bottom cell culture plates at a ratio of 50:1 in X‐Vivo medium (Lonza), in the absence or presence of T cell activation/expansion beads (Miltenyi Biotec) at a 1:2 ratio for 3–5 days. Proliferation was determined either by Ki67 staining on day three or by incorporation of [3H]‐thymidine added on day five for overnight incubation (1 μCi/well [3H]‐methyl‐thymidine; Amersham Buchler GmbH, Braunschweig, Germany). Cells were harvested onto glass fiber filter paper using a Filter Mate Harvester (Perkin–Elmer, Rodgau, Germany) and analyzed on a beta‐scintillation counter 1450 Mikrobeta (Inotech, Nabburg, Germany). The responses were recorded as mean cpm of triplicates.
2.11. Transmigration assay
To obtain an epithelial cell monolayer, 1 × 10⁵ cells of either H6c7‐mock, H6c7‐L1CAM, Panc1L1low or Panc1L1high were seeded in the respective medium (without puromycin) into a transwell insert (24‐well‐plate, 3 μm pore size from Greiner). In addition, 500 μl medium were placed in each lower compartment. Medium was replaced in the lower compartment 24 h later by 500 μl X‐Vivo medium containing 5% FCS. In the transwell insert, medium was also replaced by 500 μl X‐Vivo medium containing 5% FCS in the absence or presence of 2 × 10⁴ T‐effs or T‐regs. Before seeding, both T cell populations were labeled with CFSE (5 μM, Sigma Aldrich, München, Germany) according to the manufacturer's instructions. To determine the transmigration rate of fluorochrome‐labeled T cells through the epithelial monolayer, fluorescence in the lower compartment was measured after 24 h using a fluorometer (Infinite 200, Tecan, Mainz‐Kastel, Germany). All assays were done in duplicates.
2.12. Determination of L1CAM expression in pancreatic cells and pancreatic tissues
To ensure the L1CAM phenotype of H6c7‐mock, H6c7‐L1CAM, Panc1L1high and Panc1L1low cells, 1 × 10⁵ cells of each cell line were seeded onto a coverslip and grown for 24 h. Then, L1CAM staining was performed using the L1‐9.3 antibody as previously described (Schäfer et al., 2012). Staining of L1CAM in paraffin‐embedded and formalin‐fixed tissue sections of normal/peritumoral pancreatic tissue, CP and PDAC tissue was performed as described (Bergmann et al., 2010).
2.13. Bioplex analysis
Detection of cytokines in cell culture supernatants was performed by multiplex cytokine analysis with Bio‐Plex Pro Assays (Bio‐RAD Laboratories, München, Germany) and as recommended by the manufacturer. Fluorometric measurement was done on a Bio‐Plex 200 reader using the corresponding Bio‐Plex manager software (kindly provided by the Department of Immunobiology, Research Center Borstel, Borstel, Germany).
2.14. Statistical analysis
Depending upon the test for normal distribution (Shapiro‐Wilk‐test) coculture data were analyzed by student's t‐test or Wilcoxon‐rank‐sum‐test. Relationships between data from healthy controls, CP and PDAC patients and clinical characteristics were analyzed nonparametrically by Spearman's rank correlation coefficient or Wilcoxon‐rank‐sum‐test. All statistical tests were two‐sided, not adjusted for multiple testing. Statistical analysis was performed with SPSS‐Version 17.0.
3. Results
3.1. The number of CD4+CD25+CD127−CD49d− Tregs is slightly increased in blood of CP and PDAC patients
Previous investigations on the incidence of T‐regs in PDAC patients are based on the detection of CD4+CD25+ or CD4+Foxp3+ cells (Liyanage et al., 2002; Hiroaka et al., 2006; Ikemoto et al., 2006; Yamamoto et al., 2012). Given the CD25‐positivity of other CD4+ T cells, T‐reg numbers in these studies may be overestimated. Therefore, we evaluated the prevalence of highly immunosuppressive CD4+CD25+CD127−CD49d− T‐regs (Kleinewietfeld et al., 2009) compared to CD4+CD25+ T cells in blood and pancreatic tissues of CP and PDAC patients as well as in blood of healthy volunteers (Figure 1). PBMCs from 22 healthy donors, 22 PDAC and 5 CP patients were analyzed by flow cytometry. Within the lymphocyte population the percentage of CD4+ T cells was slightly, but not significantly diminished in PDAC (43.5%) and CP (39.5%) patients compared to healthy donors (46.6%) (Figure 1A, red marks). The percentage of CD4+CD25+ cells was highest in PDAC (8.2%) compared to CP (7.2%) patients and healthy donors (6.5%) being in line with previous publications (Liyanage et al., 2002; Hiroaka et al., 2006; Ikemoto et al., 2006; Yamamoto et al., 2012) (Figure 1B, red marks). The percentages of CD4+CD25− T cells were complementary to the percentages of CD4+CD25+ cells and accordingly high in all three analyzed groups (Figure 1C, red marks). Analysis of the more specified T‐reg subset revealed only a slightly elevated percentage of CD4+CD25+CD127−CD49d− T cells in PDAC (4.8%) and CP (4.8%) patients compared to healthy controls (3.8%) (Figure 1D, red marks). Thus, in blood of CP and PDAC patients the amount of these highly immunosuppressive T‐regs only slightly differs from that in blood of healthy donors.
Figure 1.
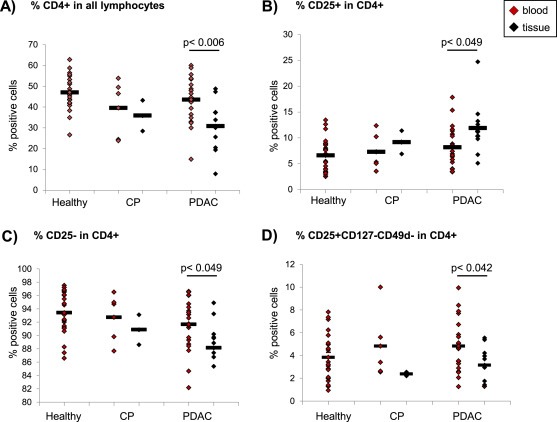
The prevalence of CD4+CD25+CD127−CD49d− T‐regs in blood and pancreatic tissues of CP and PDAC patients compared to healthy donors. PBMCs from blood of healthy donors, CP and PDAC patients as well as cells migrated out of pancreatic tissues of CP and PDAC patients were stained and analyzed by flow cytometry for expression of CD4, CD25, CD49d and CD127. Data are presented as (A) % CD4+ cells in all lymphocytes, (B) % CD25+, (C) % CD25− and (D) % CD25+ CD127− CD49d− cells in CD4+ T cells. Bars indicate the means. Statistical significance is indicated by the respective p‐values. Red marks indicate data from blood‐derived cells, black marks from tissue‐derived cells.
3.2. CD4+CD25+CD127−CD49d− T‐regs are present in pancreatic tissues of PDAC and CP patients
To elucidate whether CD4+CD25+CD127−CD49d− T‐regs are present in pancreatic tissues of CP and PDAC patients, immune cells having migrated out of CP and PDAC tissue explants after 24 h were analyzed (Figure 1, black marks). A significantly different distribution of all analyzed cell populations could be detected in pancreatic tissues compared to blood of PDAC patients. In detail, the percentage of CD4+ T cells within the lymphocyte population was slightly higher in CP (35.8%) than in PDAC tissues (30.8%) (Figure 1A, black marks) while the percentage of CD25+CD4+ T cells was more elevated in PDAC (11.8%) than in CP tissues (9.1%) (Figure 1B, black marks). In contrast to CD4+CD25+ T cells, CD4+CD25− T cells were present at high numbers in CP and PDAC tissues being less abundant in PDAC than in CP tissues (Figure 1C). CD4+CD25+CD127−CD49d− T cells were found in CP (2.3%) and slightly higher in PDAC tissues (3.1%) albeit at low frequencies (Figure 1D, black marks). Supporting these findings, similar results were obtained by an extended immunohistochemistry‐based stroma analysis of a larger collective of CP and PDAC patients (Helm et al., 2014). Overall these findings indicate that highly immunosuppressive CD4+CD25+CD127−CD49d− T‐regs are present at low numbers in pancreatic tissues of CP and PDAC patients, albeit the predominant CD4+ T cell population in tissues of both diseases lacks CD25 expression.
3.3. L1CAM predominantly promotes migration of T‐regs
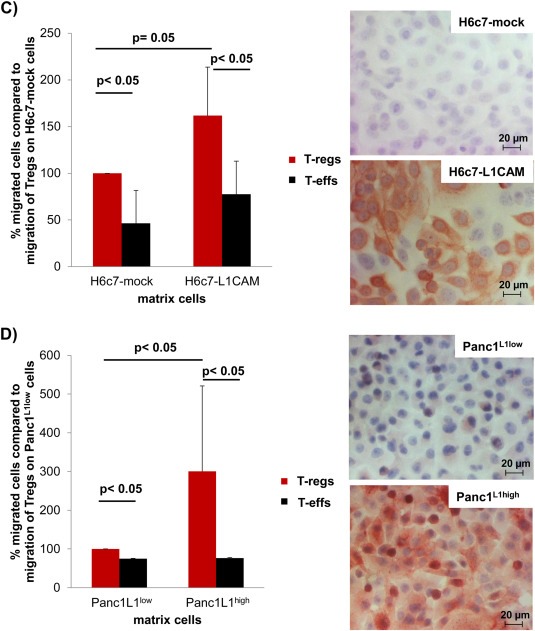
As previously reported (Geismann et al., 2009; Bergmann et al., 2010), L1CAM expression in normal pancreatic tissues is restricted to neuronal structures (Supplementary Figure 1A) while being elevated in pancreatic ductal epithelial cells already in CP (Supplementary Figure 1B) and even more pronounced in almost all of the pancreatic tumor tissues of PDAC patients (Supplementary Figure 1C). Thus, we next analyzed whether L1CAM impact on the accumulation of T cells in pancreatic tissues. For this purpose, untouched CD4+CD25+CD127−CD49d− T‐regs and CD4+CD25− T‐effs were isolated from healthy donors and cocultured either with the non‐malignant human pancreatic ductal epithelial cell line H6c7 (lacking endogenous L1CAM expression) stably transfected with an L1CAM expression vector (H6c7‐L1CAM) or the empty vector (H6c7‐mock) to simulate CP‐related conditions, or with the PDAC cell line Panc1 endogenously exhibiting L1CAM expression at high level (Panc1L1high) or being subject of shRNA mediated knock‐down of L1CAM expression (Panc1L1low). T‐regs exhibiting a clearly regulatory phenotype (Figure 2A+B) showed already greater migratory ability than T‐effs on H6c7‐mock (Figure 2C) and Panc1L1low (Figure 2D) cells. Intriguingly, transmigration of T‐regs significantly increased when seeded on H6c7‐L1CAM or Panc1L1high cells (Figure 2C+D). In contrast, transmigration of T‐effs was not altered (Panc1‐L1high) or increased to lesser extent (H6c7‐L1CAM) under these conditions. Overall, these data indicate that L1CAM strongly promotes migration of CD4+CD25+CD127−CD49d− T‐regs.
Figure 2.
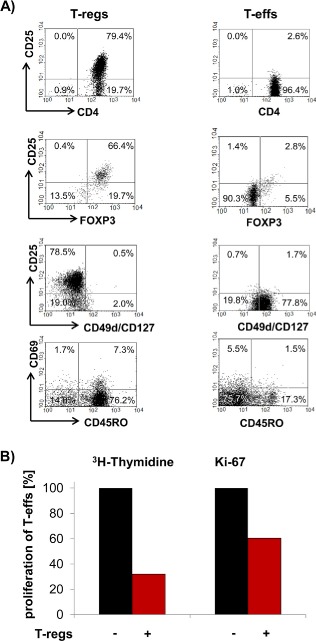
L1CAM predominantly increases cell migration of T‐regs. T‐regs and T‐effs were isolated by negative selection. A) T‐regs and T‐effs were stained and analyzed by flow cytometry for expression of CD4, CD25, CD69, CD49d, CD127, CD45RO and FoxP3. Data are presented as dot plots from one representative isolation. B) T‐effs and T‐regs were cultured at a ratio of 50:1. Proliferation of T cells was determined either by 3H‐thymidine assay after 5 days or Ki‐67 staining and subsequent flow cytometry after 3 days. Data from one representative experiment are presented as % proliferating T‐effs. C + D) T‐regs‐ and T‐effs were labeled with CFSE and seeded on transwells inserts covered with C) H6c7‐mock and H6c7‐L1CAM cells or D) Panc1L1low and Panc1L1high cells, respectively. After 24 h, migrated T cells were determined by measuring the fluorescence in the lower compartments. Data are presented as % migrated cells with migration of T‐regs on HPDE‐mock and Panc1L1low cells set as 100%. Means ± SD from 3 to 5 experiments are shown. Statistical significance is indicated by the respective p‐values. Photographs show representative L1CAM stainings of C) H6c7‐mock and H6c7‐L1CAM cells as well as D) Panc1L1low and Panc1L1high cells demonstrating the different L1CAM expression level.
Figure 2.
(Continued)
3.4. L1CAM alters the phenotype of T‐effs
To elucidate whether L1CAM modulates the phenotype of T‐regs and T‐effs, both T‐cell populations were cocultured with H6c7‐mock or H6c7‐L1CAM and Panc1L1low or Panc1L1high, either in the absence or presence of T cell activation/expansion beads to simulate antigen stimulation by antigen presenting cells for 72 h. Regarding CD127 and CD49d, expression the phenotype of T‐regs and T‐effs was not altered by either coculture condition (Figure 3A). Moreover, CD25 expression in T‐regs was induced ∼2‐fold by T cell activation/expansion beads but no L1CAM‐depending effect by the coculture was noted (Figure 3B). In contrast, the strong (up to 23‐fold) upregulation of CD25 expression in T‐effs by activation beads was clearly suppressed during coculture with H6c7‐L1CAM and Panc1L1high cells (Figure 3B, red labeled numbers). Overall these data suggest that L1CAM diminishes CD25 expression in T‐effs.
Figure 3.
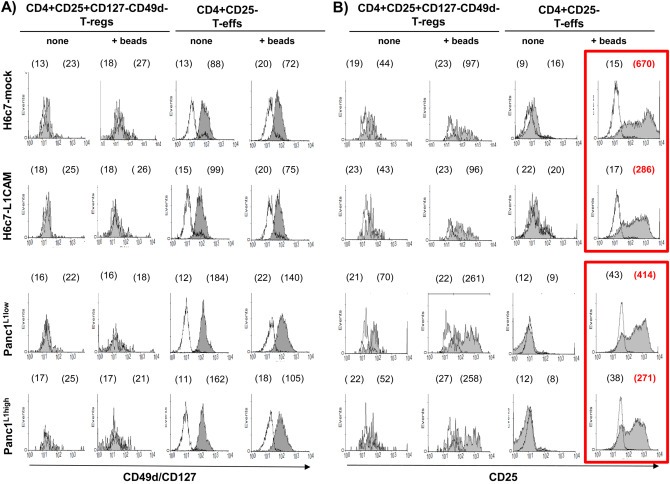
L1CAM alters the phenotype of T‐effs. T‐regs and T‐effs were cocultured for 72 h with H6c7‐mock and H6c7‐L1CAM cells or Panc1L1low and Panc1L1high cells, respectively, in the absence (none) or presence of T cell activation/expansion beads (+beads). Then, both T cell populations were stained and analyzed by flow cytometry for expression of (A) CD49d/CD127 and (B) CD25. Data are presented as histograms from one representative experiment out of 11. Empty curves indicate staining with the isotype control, filled curves with the specific antibody. Values in brackets indicate median fluorescence intensity (left value: isotype control, right value: specific antibody). Main changes are depicted in the red frame and highlighted with red, bold letters.
3.5. L1CAM reduces proliferation of T‐effs
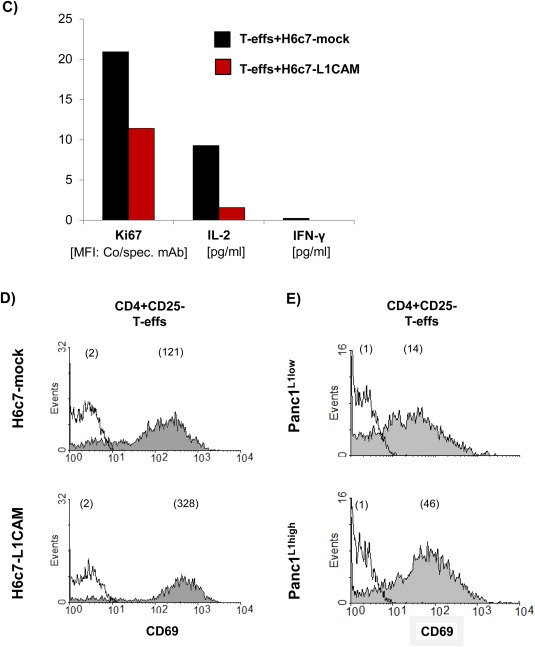
In line with the findings on CD25 expression, proliferation of T‐regs was very low and not affected by either coculture condition (Figure 4A+B, left panels). In contrast, proliferation of T‐effs was reduced after coculture with H6c7‐L1CAM and Panc1L1high cells as demonstrated by the diminished median fluorescence intensity of Ki‐67 compared to H6c7‐mock and Panc1L1low cells, respectively (Figure 4A+B, right panels). Besides diminished proliferation, levels of IL‐2 and IFN‐γ were reduced in cocultures of T‐effs when cocultured with H6c7‐L1CAM cells compared to those of cocultures with H6c7‐mock cells (Figure 4C). These data indicate that along with the lowered CD25 expression, L1CAM negatively impacts on the proliferation of T‐effs.
Figure 4.
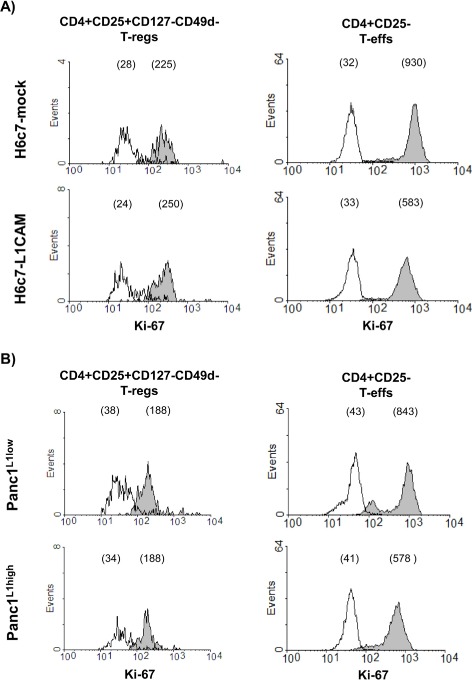
L1CAM reduces proliferation but increases CD69 expression in T‐effs. T‐regs (A + B) and T‐effs (A–E) were cocultured for 72 h with T cell activation/expansion beads and in the presence of (A,C,D) H6c7‐mock and H6c7‐L1CAM cells or (B + E) Panc1L1low and Panc1L1high cells, respectively. A + B) T‐regs and T‐effs were stained and analyzed by flow cytometry for expression of Ki‐67. C) T‐effs were analyzed for the expression of Ki‐67 and supernatants of the respective cocultures for the presence of IL‐2 and IFN‐γ. One representative experiment is shown. D + E) T‐effs were stained and analyzed by flow cytometry for expression of CD69. Data are presented as histograms from one representative experiment out of 11 (A,B,D,E). Values in brackets indicate median fluorescence intensity of isotype control (empty curves) and of specific antibody (filled curves).
Figure 4.
(Continued)
3.6. L1CAM promotes the upregulation of CD69 expression in T‐effs
Besides its role as an early activation marker on leukocytes, CD69 might exert immunoregulatory functions as defined for a recently identified CD4+CD25−CD69+ T‐reg subset in mice (Sancho et al., 2005; Han et al., 2009). Accordingly, we analyzed whether the L1CAM‐mediated reduction of CD25 expression in T‐effs (see 3.4) is accompanied by an increase in CD69 expression. Analysis of T‐effs under the different coculture conditions revealed greater CD69 expression in T‐effs after coculture with H6c7‐L1CAM (median fluorescence intensity (MFI): 328) compared to H6c7‐mock cells (MFI: 121) or with Panc1L1high (MFI: 46) compared to Panc1L1low cells (MFI: 14) (Figure 4D+E). In contrast to the direct coculture, culture on L1CAM‐Fc coated plates did not result in a different phenotype of T‐effs with respect to expression of CD25 and CD69 and only slightly affected proliferation (Supplementary Figure 2A). However, cultivation of T‐effs with supernatants from H6c7‐L1CAM but not from H6c7‐mock cells reduced the proliferation and CD25 expression and increased CD69 expression in T‐effs (Supplementary Figure 2B). In line with these findings, supernatants from H6c7‐L1CAM cells contained higher levels of the immunosuppressive factors VEGF and predominantly TGF‐β1 than those from H6c7‐mock cells (Supplementary Figure 2C). Overall, these data support the view that not the direct binding of T cells to L1CAM but rather the L1CAM‐mediated release of soluble factors promotes the generation of CD4+ T cells with a CD25−CD69+‐phenotype.
3.7. In the presence of L1CAM T‐effs acquire an immunosuppressive phenotype
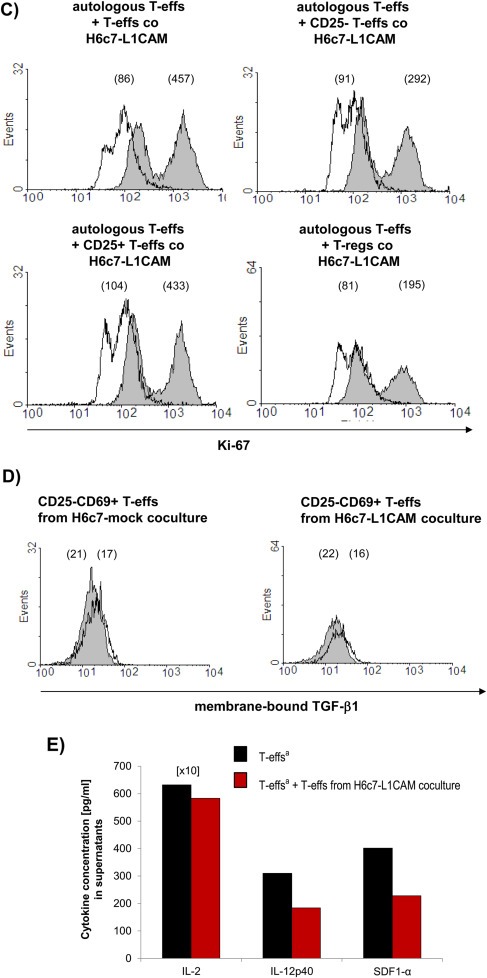
To verify the immunosuppressive activities of CD4+CD25−CD69+ T cells after coculture with L1CAM‐expressing cells, autologous T‐effs (T‐effsa) that had been cultured in parallel to the cocultures, were then cultured in the presence of T cell activation/expansion beads and at a 75:1 ratio with T‐effs obtained from 72 h‐cocultures with H6c7‐mock or H6c7‐L1CAM and Panc1L1low or Panc1L1high, respectively. Indeed, proliferation of T‐effsa was markedly reduced in the presence of T‐effs from cocultures with L1CAM‐expressing pancreatic epithelial cells (by 31% with T‐effs from H6c7‐L1CAM (Figure 5A) and 45% with T‐effs from Panc1L1high cocultures (Figure 5B) as compared to the respective controls. Moreover, this immunosuppressive function of cocultured T‐effs persisted and was even more pronounced after magnetic bead‐mediated depletion of remaining CD25+ T‐effs, the latter of which did almost not affect proliferation (Figure 5C). As further control, cocultured T‐regs were used exhibiting the strongest inhibitory effect on T‐effsa. These findings suggest that L1CAM‐expressing pancreatic ductal epithelial cells promote the generation of immunosuppressive T cells with a CD4+CD25−CD69+ phenotype. In contrast to the murine system (Han et al., 2009), these human CD4+CD25−CD69+ T cells being generated in the presence of L1CAM did not express membrane‐bound TGF‐β1 (Figure 5D), thus other mechanisms seemed to determine their immunosuppressive ability. Accordingly, supporting the regulatory function of CD4+CD25−CD69+ T cells, levels of the immunostimulatory factors IL‐2, IL‐12p40 and SDF‐1α were reduced in supernatants of cocultures from T‐effsa and T‐effs that had been prior cultured with H6c7‐L1CAM cells compared to T‐effsa alone (Figure 5E).
Figure 5.
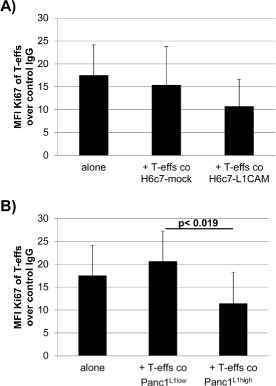
In the presence of L1CAM T‐effs acquire an immunosuppressive phenotype. T‐effs were cocultured for 72 h with T cell activation/expansion beads and in the presence of (A) H6c7‐mock and H6c7‐L1CAM cells or (B) Panc1L1low and Panc1L1high cells, respectively. Then, autologous T‐effs (T‐effsa) that had been cultured in parallel, were cultured together with one of the cocultured T‐eff populations at a ratio of 75:1 and in the presence of T cell activation/expansion beads for further 72 h. T cells were stained and analyzed by flow cytometry for expression of Ki‐67. Data are presented as mean fluorescence intensity (MFI) over control. Means ± SD from 5 to 6 experiments are shown. Statistical significance is indicated by the respective p‐values. C) Representative histograms from Ki‐67 stainings of T‐effsa cocultured with T‐effs from cocultures with H6c7‐L1CAM cells without depletion of CD25+ T cells (T‐effs), with depletion of CD25+ cells (CD25− Teffs). As control, T‐effsa were cocultured under similar conditions with enriched CD25+ T cells (CD25+ T‐effs) or T‐regs that had been cocultured with H6c7‐L1CAM cells before. D) After coculture with H6c7‐mock or H6c7‐L1CAM cells, T‐effs were stained for CD25, CD69 and membrane‐bound TGF‐β1. Representative histograms from TGF‐β1 stainings in CD25−CD69+ T‐effs are shown. E) Levels of IL‐2, IL‐12p40 and SDF‐1α were determined in supernatants from T‐effsa cultured either alone or together with T‐effs that had been cocultured with H6c7‐L1CAM cells before. Data from one representative experiment are shown.
Figure 5.
(Continued)
3.8. An elevated incidence of CD4+CD25−CD69+ T cells in pancreatic tissues correlates with malignant progression in PDAC patients
Based on the in vitro data, the prevalence of CD4+CD25−CD69+ T cells was analyzed in blood and pancreatic tissues of CP and PDAC patients and compared with blood of healthy donors. Staining data from of all donors are shown in Figure 6A–C, and one representative dot plot for CD69 versus CD25 is presented in Figure 6D. First, we analyzed the distribution of CD69+ cells within blood CD4+ T cells (Figure 6A, red marks and 6D top, upper panel) that were markedly diminished in blood of CP (mean value: 8.5%) and PDAC (7.7%) patients compared to healthy donors (12.5%). Percentages of CD25+CD69+ T cells, representing the minor part of blood CD4+CD69+ T cells were below 2% in all three groups (Figure 6B, red marks and 6D, upper panel).
Figure 6.
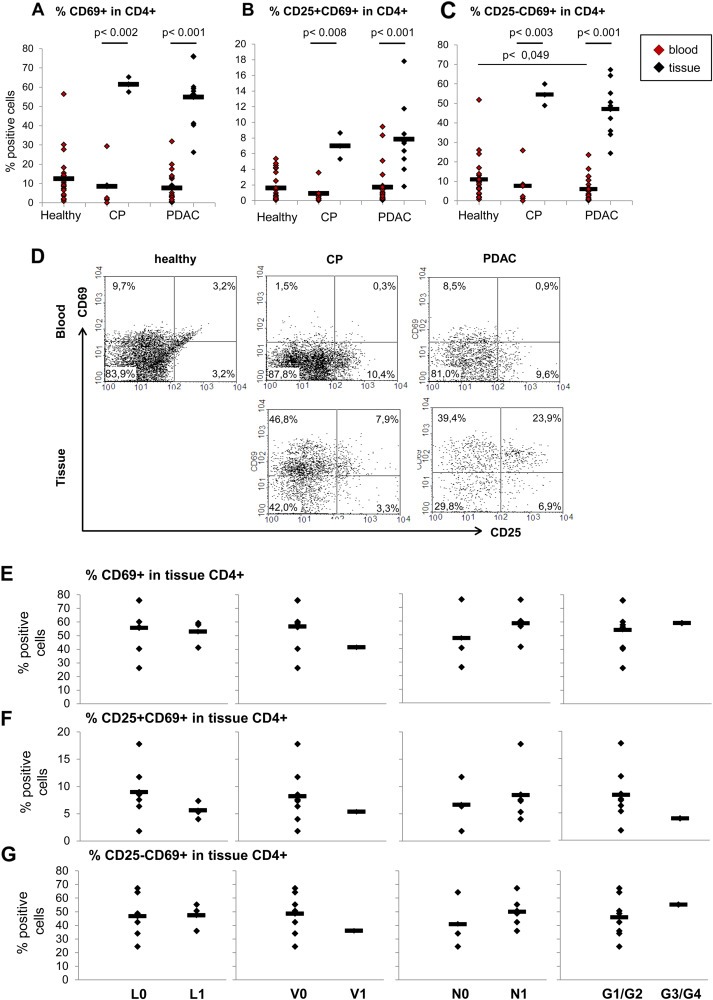
A high prevalence of CD4+CD25−CD69+ T cells in tissues of PDAC patients correlates with malignant progression. PBMCs from blood of healthy donors, CP and PDAC patients as well as cells migrated out of pancreatic tissues of CP and PDAC patients were stained and analyzed as described. Data are presented as (A) % CD69+, (B) % CD25+CD69+ and (C) % CD25−CD69+ cells in CD4+ T cells. D) Representative dot plots from CD69 and CD25 staining of PBMCs from blood of healthy donors, CP and PDAC patients as well as of cells migrated out of pancreatic tissues of CP and PDAC patients. Correlation of (E) % CD69+, (F) % CD25+CD69+ and (G) % CD25−CD69+ cells in CD4+ T cells in PDAC tissues with the indicated clinical parameters that are status of lymphangioinvasion (L), haemangioinvasion (V), nodal invasion (N) and grading (G1/G2 = well/moderately differentiated; G3/G4 = poorly/undifferentiated). Bars indicate the means. Statistical significance is indicated by the respective p‐values.
Similar to CD4+CD69+ T cells, the percentage of CD25−CD69+ T cells in blood CD4+ T cells was lower in CP and PDAC patients compared to healthy controls (Figure 6C, red marks and 6D, upper panel) and even significantly reduced (p = 0.049) comparing numbers in blood from healthy and PDAC patients.
Compared to blood, the number of all CD69+ cells within tissue CD4+ T cells was significantly enhanced (p < 0.004) in pancreatic tissues of CP (61.4%) and PDAC (54.8%) patients (Figure 6A, black marks and 6D, bottom panel). Most importantly, the percentages of CD25+CD69+ and CD25−CD69+ T cells were increased to a similar extent in both tissues compared to blood (Figure 6B and 6C, black marks and 6D, bottom panel). However, the percentage of CD25+CD69+ was still very low with 6.9% in CP and 7.8% in PDAC tissues (Figure 6B), while CD25−CD69+ T cells accounted for 54.4% of CD4+ T cells in pancreatic tissues of CP and 46.9% of PDAC patients (Figure 6C). Moreover, correlating these findings with clinicopathological data of PDAC patients, higher percentages of CD4+CD69+ T cells in PDAC tissues were predominantly associated with haemangioinvasion (V0: 41.2% versus V1: 56.5%) and nodal invasion (N0: 47.6% versus N1: 58.5%) (Figure 6E). Furthermore, higher percentages of CD4+CD25+CD69+ T cells in PDAC tissues tended to correlate with nodal infiltration (N0: 6.6 versus N1: 8.4%), but a status free of lymphangioinvasion (L0: 9.0% versus L1: 5.6%) and of haemangioinvasion (V0: 8.3% versus V1: 5.1%) as well as lower grading (G1/G2: 8.3% versus G3/G4: 4.0%) (Figure 6F). Analyses of the most prominent subpopulation namely the CD4+CD25−CD69+ T cells provide evidence that a higher abundance of these T cells in PDAC tissues was associated with a status free of haemangioinvasion (V0: 48,4% versus V1: 35,9%) but most importantly with an N1‐status (N0: 40.9% versus N1: 50.0%) and higher grading (G1/G2: 46.0% versus G3/G4: 55.3%) (Figure 6G) pointing to their impact on malignant progression.
4. Discussion
The presence of regulatory T cells (T‐regs) in blood and tumor tissues has been associated with metastasis and poor prognosis of PDAC patients (Liyanage et al., 2002; Hiroaka et al., 2006; Ikemoto et al., 2006; Yamamoto et al., 2012), but their determination relied on staining protocols not exclusively detecting T‐regs. Based on a more precise characterization of T‐regs (Kleinewietfeld et al., 2009) allowing better discrimination from other T cells, this study demonstrates that CD4+CD25+ cells were more abundant in the blood of PDAC patients compared to healthy controls being in line with previous findings (Liyanage et al., 2002; Ikemoto et al., 2006). However, the more specified CD4+CD25+CD127−CD49d− T‐regs were only marginally elevated in blood of PDAC patients underscoring contamination with other cells in the former population. Interestingly, the number of CD4+CD25+CD127−CD49d− T‐regs in blood did not differ between CP and PDAC patients indicating that chronic inflammations might already lead to a similar elevation of these cells. Moreover, in pancreatic tissues of both CP and PDAC patients CD4+CD25+ and CD4+CD25+CD127−CD49d− T‐regs could be detected, albeit at slightly higher levels in pancreatic tissues of PDAC patients. Important to note, most of the CD4+ T cells lacked CD25 expression.
To investigate how CD4+CD25+CD127−CD49d− T‐regs and the more abundant CD4+CD25− T cells are enriched in pancreatic tissues of CP and PDAC patients, the impact of benign (H6c7) and malignant (Panc1) pancreatic ductal epithelial cells either lacking or exhibiting L1CAM expression on the phenotype and behavior of T cells was investigated. We showed that L1CAM particularly increases migration of CD4+CD25+CD49−CD127− T‐regs. Thus, besides an altered expression profile of adhesion molecules on tumor endothelia (Nummer et al., 2007) L1CAM expression in pancreatic tissues provides another mechanism by which T‐regs accumulate not only in PDAC but already in CP tissues. Moreover, L1CAM markedly reduced proliferation, diminished CD25 expression and elevated CD69 expression in T‐effs but not in T‐regs compared to cocultures with L1CAM‐lacking cells. A recent report demonstrated that PDAC‐derived supernatants can inhibit proliferation and migration of CD4+ T cells and increase CD69 expression (Fogar et al., 2011), favoring a role of soluble factors in this scenario. Indeed, culturing T‐effs in the presence of H6c7‐L1CAM supernatants led to similar effects as the direct coculture while culture on L1CAM‐Fc coated plates did not confer these regulatory functions. Thus, the alteration in the CD25−CD69+‐phenotype and proliferation of T‐effs in the presence of L1CAM‐expressing cells most likely did not result from direct interactions with L1CAM but rather indirectly from the L1CAM‐dependent release of soluble factors. Supporting this idea, predominantly higher levels of the immunosuppressive factor TGF‐β1 could be determined in supernatants from L1CAM‐expressing cells. As shown previously, elevated L1CAM expression results in constitutive activation of NF‐κB which in turn leads to elevated release of inflammatory factors such as IL‐1β and NO (Kiefel et al., 2010; Sebens Müerköster et al., 2007) that might be involved in the modulation of the phenotype and function T cells, too, as it has been also described for tumor‐derived exosomes (Szajnik et al., 2010; Clayton et al., 2011). In line with their suggested role as a novel T‐reg subset (Sancho et al., 2005; Han et al., 2009), CD4+CD25−CD69+ T cells derived from coculture with L1CAM‐expressing cells markedly suppressed proliferation of autologous T cells (T‐effsa). Unlike in murine cells (Han et al., 2009), membrane‐bound TGF‐β1 was not detected in these human CD4+CD25−CD69+ T cells, but predominantly the levels of the immunostimulatory factors IL‐2 and IL12‐p40 were reduced in cocultures of T‐effsa and T‐effs that had been cultured in the presence of H6c7‐L1CAM cells before underscoring the regulatory function of CD4+CD25−CD69+ T cells generated in the presence of L1CAM.
Since our data suggest that L1CAM promotes the enrichment of immunosuppressive T cells in pancreatic tissues not only by facilitating migration of CD4+CD25+CD127−CD49d− T‐regs but also by the generation of regulatory CD4+CD25−CD69+ T cells, the incidence of the latter cells was analyzed in pancreatic tissues of CP and PDAC patients. Indeed, the majority of CD4+ T cells in pancreatic tissues of CP and PDAC patients were of a CD4+CD25−CD69+ phenotype. In accordance with these findings, immunohistochemical detection of L1CAM and CD4 in tumor tissues of another collective of PDAC patients revealed a correlation of L1CAM expression and the abundance of CD4+ T cells (Helm et al., 2014). Similarly as reported for breast cancer patients (Poschke et al., 2012), the prevalence of CD4+CD69+ T cells was higher in tumor tissues compared to blood which also applied to both subpopulations, the CD25+CD69+ and CD25−CD69+ T cells. However, given the clear preponderance of the latter population, its impact on malignant progression has to be regarded as superior. Interestingly, a higher percentage of CD4+CD25+CD69+ T cells in PDAC tissues – albeit at low levels – tended to correlate with an L0‐, V0‐ and G1/G2‐stage, whereas a higher abundance of CD4+CD25−CD69+ T cells was associated with a V0‐stage but most importantly with an N1‐ and G3/G4‐status. This supports the view that CD4+CD25−CD69+ T cells contribute via their regulatory properties to immune evasion and thereby progression of PDAC. Moreover, preliminary results indicate that CD4+CD25− T cells are potent inducers of epithelial–mesenchymal transition in H6c7 cells which might represent another mechanism by which these cells contribute to malignant progression in PDAC (unpublished observations). Likewise, an increased number of CD4+CD25−CD69+ T cells has been reported to be associated with tumor progression in hepatocellular carcinoma patients (Zhu et al., 2011).
5. Conclusions
Overall, this study demonstrates that L1CAM, being overexpressed in CP and PDAC tissues, contributes to the enrichment of immunosuppressive T cells in different ways: i) it promotes migration/infiltration of CD4+CD25+CD127−CD49d− T‐regs into the pancreas, ii) it impairs the proliferation of T‐effs and iii) it fosters the generation of immunosuppressive CD4+CD25−CD69+ T cells. In particular, this T‐reg population may contribute to immune evasion quite early during PDAC development because these cells are highly abundant already in CP tissues and represent the most prominent subpopulation of CD4+ T cells in CP and PDAC tissues. This novel function of L1CAM in the generation of an immunosuppressive microenvironment together with its established role in chemoresistance and metastasis of PDAC (Sebens Müerköster et al., 2007; Geismann et al., 2009; Schäfer et al., 2012) underscores its great potential as target in PDAC therapy.
Conflict of interest disclosure
The authors disclose no conflict of interest.
Funding
This work was supported by the Deutsche Forschungsgemeinschaft (DFG)‐funded Cluster of Excellence “Inflammation at Interfaces” and the DFG‐funded Pancreas Consortium Kiel (Grant number WE3559/2‐1 (DW) and SE1831/4‐1 (HS, SS)).
Supporting information
The following are the supplementary data related to this article:
Supplementary data
Supplementary data
Acknowledgments
The authors thank Maike Witt‐Ramdohr for excellent technical assistance and Rajia Bahri for supervision of the Bio‐Plex analysis.
Supplementary data 1.
Supplementary data related to this article can be found at http://dx.doi.org/10.1016/j.molonc.2014.03.001.
Grage-Griebenow Evelin, Jerg Elfi, Gorys Artur, Wicklein Daniel, Wesch Daniela, Freitag-Wolf Sandra, Goebel Lisa, Vogel Ilka, Becker Thomas, Ebsen Michael, Röcken Christoph, Altevogt Peter, Schumacher Udo, Schäfer Heiner and Sebens Susanne, (2014), L1CAM promotes enrichment of immunosuppressive T cells in human pancreatic cancer correlating with malignant progression, Molecular Oncology, 8, doi: 10.1016/j.molonc.2014.03.001.
References
- Ben, Q.-W. , Wang, J.-C. , Liu, J. , Zhu, Y. , Yuan, F. , Yao, W.-Y. , Yuan, Y.-Z. , 2010. Positive expression of L1-CAM is associated with perineural invasion and poor outcome in pancreatic ductal adenocarcinoma. Ann. Surg. Oncol.. 17, 2213–2221. [DOI] [PubMed] [Google Scholar]
- Bergmann, F. , Wandschneider, F. , Sipos, B. , Moldenhauer, G. , Schniewind, B. , Welsch, T. , Schirrmacher, P. , Klöppel, G. , Altevogt, P. , Schäfer, H. , Sebens Müerköster, S. , 2010. Elevated L1CAM expression in precursor lesions and primary and metastatic tissues of pancreatic ductal adenocarinoma. Oncol. Rep.. 24, 909–915. [DOI] [PubMed] [Google Scholar]
- Clayton, A. , Al-Taei, S. , Webber, J. , Mason, M.D. , Tabi, Z. , 2011. Cancer exosomes express CD39 and CD73, which suppress T cells through adenosine production. J. Immunol.. 187, 676–683. [DOI] [PubMed] [Google Scholar]
- Farrow, B. , Evers, B.M. , 2002. Inflammation and the development of pancreatic cancer. Surg. Oncol.. 10, 153–169. [DOI] [PubMed] [Google Scholar]
- Fogar, P. , Basso, D. , Fadi, E. , Greco, E. , Pantano, G. , Padoan, A. , Bozzato, D. , Facco, M. , Sanzari, M.C. , Teolato, S. , Zambon, C.F. , Navaglia, F. , Semenzato, G. , Pedrazzoli, S. , Plebani, M. , 2011. Pancreatic cancer alters human CD4+ T lymphocyte function: a piece in the immune evasion puzzle. Pancreas. 40, 1131–1137. [DOI] [PubMed] [Google Scholar]
- Geismann, C. , Morscheck, M. , Koch, D. , Ungefroren, H. , Arlt, A. , Tsao, M.-S. , Bachem, M.G. , Altevogt, P. , Fölsch, U.R. , Schäfer, H. , Sebens Müerköster, S. , 2009. Up-regulation of L1CAM in pancreatic duct cells is transforming growth factor b1- and slug-dependent: role in malignant transformation of pancreatic cancer. Cancer Res.. 69, 4517–4526. [DOI] [PubMed] [Google Scholar]
- Han, Y. , Guo, Q. , Zhang, M. , Chen, Z. , Cao, X. , 2009. CD69+ CD4+ CD25− T cells, a new subset of regulatory T cells, suppress T cell proliferation through membrane-bound TGF-beta 1. J. Immunol.. 182, 111–120. [DOI] [PubMed] [Google Scholar]
- Helm, O. , Mennrich, R. , Petrick, D. , Goebel, L. , Freitag-Wolf, S. , Röder, C. , Kalthoff, H. , Röcken, C. , Sipos, B. , Kabelitz, D. , Schäfer, H. , Oberg, H.-H. , Wesch, D. , Sebens, S. , 2014. Comparative characterization of stroma cells and ductal epithelium in chronic pancreatitis and pancreatic ductal adenocarcinoma. in press PlosOne. [DOI] [PMC free article] [PubMed] [Google Scholar]
- Hiraoka, N. , Onozato, K. , Kosuge, T. , Hirohashi, S. , 2006. Prevalence of FOXP3+ regulatory T cells increases during the progression of pancreatic ductal adenocarcinoma and its premalignant lesions. Clin. Cancer Res.. 12, 5423–5434. [DOI] [PubMed] [Google Scholar]
- Ikemoto, T. , Yamaguchi, T. , Morine, Y. , Imura, S. , Soejima, Y. , Fujii, M. , Maekawa, Y. , Yasutomo, K. , Shimada, M. , 2006. Clinical roles of increased populations of Foxp3+CD4+ T cells in peripheral blood from advanced pancreatic cancer patients. Pancreas. 33, 386–390. [DOI] [PubMed] [Google Scholar]
- Kiefel, H. , Bondong, S. , Erbe-Hoffmann, N. , Hazin, J. , Riedle, S. , Wolf, J. , Pfeifer, M. , Arlt, A. , Schäfer, H. , Müerköster, S.S. , Altevogt, P. , 2010. L1CAM-integrin interaction induces constitutive NF-kappaB activation in pancreatic adenocarcinoma cells by enhancing IL-1beta expression. Oncogene. 29, 4766–4778. [DOI] [PubMed] [Google Scholar]
- Kleeff, J. , Beckhove, P. , Esposito, I. , Herzig, S. , Huber, P.E. , Löhr, J.M. , Friess, H. , 2007. Pancreatic cancer microenvironment. Int. J. Cancer. 121, 699–705. [DOI] [PubMed] [Google Scholar]
- Kleinewietfeld, M. , Starke, M. , Di Mitri, D. , Borsellino, G. , Battistini, L. , Rötzschke, O. , Falk, K. , 2009. CD49d provides access to “untouched” human Foxp3+ Treg free of contaminating effector cells. Blood. 113, 827–836. [DOI] [PubMed] [Google Scholar]
- Liyanage, U.K. , Moore, T.T. , Joo, H.G. , Tanaka, Y. , Herrmann, V. , Doherty, G. , Drebin, J.A. , Strasberg, S.M. , Eberlein, T.J. , Goedegebuure, P.S. , Linehan, D.C. , 2002. Prevalence of regulatory T cells is increased in peripheral blood and tumor microenvironment of patients with pancreas or breast adenocarcinoma. J. Immunol.. 169, 2756–2761. [DOI] [PubMed] [Google Scholar]
- Moo-Young, T.A. , Larson, J.W. , Belt, B.A. , Tan, M.C. , Hawkins, W.G. , Eberlein, T.J. , Goedegebuure, P.S. , Linehan, D.C. , 2009. Tumor-derived TGF-beta mediates conversion of CD4+Foxp3+ regulatory T cells in a murine model of pancreas cancer. J. Immunother.. 32, 12–21. [DOI] [PMC free article] [PubMed] [Google Scholar]
- Muerkoster, S.S. , Werbing, V. , Koch, D. , Sipos, B. , Ammerpohl, O. , Kalthoff, H. , Tsao, M.S. , Folsch, U.R. , Schafer, H. , 2008. Role of myofibroblasts in innate chemoresistance of pancreatic carcinoma – epigenetic downregulation of caspases. Int. J. Cancer. 123, 1751–1760. [DOI] [PubMed] [Google Scholar]
- Nummer, D. , Suri-Payer, E. , Schmitz-Winnenthal, H. , Bonertz, A. , Galindo, L. , Antolovich, D. , Koch, M. , Büchler, M. , Weitz, J. , Schirrmacher, V. , Beckhove, P. , 2007. Role of tumor endothelium in CD4+ CD25+ regulatory T cell infiltration of human pancreatic carcinoma. J. Natl. Cancer Inst.. 99, 1188–1199. [DOI] [PubMed] [Google Scholar]
- Poschke, I. , De Boniface, J. , Mao, Y. , Kiessling, R. , 2012. Tumor-induced changes in the phenotype of blood-derived and tumor-associated T cells of early stage breast cancer patients. Int. J. Cancer. 131, 1611–1620. [DOI] [PubMed] [Google Scholar]
- Riedle, S. , Kiefel, H. , Gast, D. , Bondong, S. , Wolterink, S. , Gutwein, P. , Altevogt, P. , 2009. Nuclear translocation and signalling of L1-CAM in human carcinoma cells requires ADAM10 and presenilin/gamma-secretase activity. Biochem. J.. 420, 391–402. [DOI] [PMC free article] [PubMed] [Google Scholar]
- Sancho, D. , Gómez, M. , Sánchez-Madrid, F. , 2005. CD69 is an immunoregulatory molecule induced following activation. Trends Immunol.. 26, 136–140. [DOI] [PubMed] [Google Scholar]
- Schäfer, H. , Dieckmann, C. , Korniienko, O. , Moldenhauer, G. , Kiefel, H. , Salnikov, A. , Krüger, A. , Altevogt, P. , Sebens, S. , 2012. Combined treatment of L1CAM antibodies and cytostatic drugs improve the therapeutic response of pancreatic and ovarian carcinoma. Cancer Lett.. 319, 66–82. [DOI] [PubMed] [Google Scholar]
- Schäfer, H. , Geismann, C. , Heneweer, C. , Egberts, J.-H. , Korniienko, O. , Kiefel, H. , Moldenhauer, G. , Bachem, M.G. , Kalthoff, H. , Altevogt, P. , Sebens, S. , 2012. Myofibroblast-induced tumorigenicity of pancreatic ductal epithelial cells is L1CAM-dependent. Carcinogenesis. 33, 84–93. [DOI] [PubMed] [Google Scholar]
- Schmitz-Winnenthal, H. , Pietsch, D.H. , Schimmack, S. , Bonertz, A. , Udonta, F. , Ge, Y. , Galindo, L. , Specht, S. , Volk, C. , Zgraggen, K. , Koch, M. , Büchler, M.W. , Weitz, J. , Beckhove, P. , 2010. Chronic pancreatitis is associated with disease-specific regulatory T-cell responses. Gastroenterology. 138, 1178–1188. [DOI] [PubMed] [Google Scholar]
- Schneider, G. , Siveke, J.T. , Eckel, F. , Schmid, R.M. , 2005. Pancreatic cancer: basic and clinical aspects. Gastroenterology. 128, 1606–1625. [DOI] [PubMed] [Google Scholar]
- Sebens Müerköster, S. , Werbing, V. , Sipos, B. , Debus, M.A. , Witt, M. , Grossmann, M. , Leisner, D. , Kötteritzsch, J. , Kappes, H. , Klöppel, G. , Altevogt, P. , Fölsch, U.R. , Schäfer, H. , 2007. Drug-induced expression of the cellular adhesion molecule L1CAM confers anti-apoptotic protection and chemoresistance in pancreatic ductal adenocarcinoma cells. Oncogene. 26, 2759–2768. [DOI] [PubMed] [Google Scholar]
- Siegel, R. , Naishadham, D. , Jemal, A. , 2013. Cancer statistics. CA Cancer J. Clin.. 63, 11–30. [DOI] [PubMed] [Google Scholar]
- Stoeck, A. , Schlich, S. , Issa, Y. , Gschwend, V. , Wenger, T. , Herr, I. , Marmé, A. , Bourbie, S. , Altevogt, P. , Gutwein, P. , 2006. L1 on ovarian carcinoma cells is a binding partner for Neuropilin-1 on mesothelial cells. Cancer Lett.. 239, 212–226. [DOI] [PubMed] [Google Scholar]
- Szajnik, M. , Czystowska, M. , Szczepanski, M.J. , Mandapathil, M. , Whiteside, T.L. , 2010. Tumor-derived microvesicles induce, expand and up-regulate biological activities of human regulatory T cells (Treg). PLoS One. 5, e11469 [DOI] [PMC free article] [PubMed] [Google Scholar]
- Tan, M.C. , Goedegebuure, P.S. , Belt, B.A. , Flaherty, B. , Sankpal, N. , Gillanders, W.E. , Eberlein, T.J. , Hsieh, C.S. , Linehan, D.C. , 2009. Disruption of CCR5-dependent homing of regulatory T cells inhibits tumor growth in a murine model of pancreatic cancer. J. Immunol.. 182, 1746–1755. [DOI] [PMC free article] [PubMed] [Google Scholar]
- Yamamoto, T. , Yanagimoto, H. , Satoi, S. , Toyokawa, H. , Hirooka, S. , Yamaki, S. , Yui, R. , Yamao, J. , Kim, S. , Kwon, A.H. , 2012. Circulating CD4+CD25+ regulatory T cells in patients with pancreatic cancer. Pancreas. 41, 409–415. [DOI] [PubMed] [Google Scholar]
- Yen, T.W. , Aardal, N.P. , Bronner, M.P. , Thorning, D.R. , Savard, C.E. , Lee, S.P. , Bell, R.H. , 2002. Myofibroblasts are responsible for the desmoplastic reaction surrounding human pancreatic carcinomas. Surgery. 131, 129–134. [DOI] [PubMed] [Google Scholar]
- Zhu, J. , Feng, A. , Sun, J. , Jiang, Z. , Zhang, G. , Wang, K. , Hu, S. , Qu, X. , 2011. Increased CD4(+) CD69(+) CD25(−) T cells in patients with hepatocellular carcinoma are associated with tumor progression. J. Gastroenterol. Hepatol.. 26, 1519–1526. [DOI] [PubMed] [Google Scholar]
- Zou, L. , Barnett, B. , Safah, H. , Larussa, V.F. , Evdemon-Hogan, M. , Mottram, P. , Wei, S. , David, O. , Curiel, T.J. , Zou, W. , 2004. Bone marrow is a reservoir for CD4+CD25+ regulatory T cells that traffic through CXCL12/CXCR4 signals. Cancer Res.. 64, 8451–8455. [DOI] [PubMed] [Google Scholar]
- Zou, W. , 2005. Immunosuppressive networks in the tumour environment and their therapeutic relevance. Nat. Rev. Cancer. 5, 263–274. [DOI] [PubMed] [Google Scholar]
Associated Data
This section collects any data citations, data availability statements, or supplementary materials included in this article.
Supplementary Materials
The following are the supplementary data related to this article:
Supplementary data
Supplementary data


