

Abstract
For the development of new treatment strategies against cancer, understanding signaling networks and their changes upon drug response is a promising approach to identify new drug targets and biomarker profiles. Pre‐requisites are tumor models with multiple read‐out options that accurately reflect the clinical situation. Tissue engineering technologies offer the integration of components of the tumor microenvironment which are known to impair drug response of cancer cells. We established three‐dimensional (3D) lung carcinoma models on a decellularized tissue matrix, providing a complex microenvironment for cell growth. For model generation, we used two cell lines with (HCC827) or without (A549) an activating mutation of the epidermal growth factor receptor (EGFR), exhibiting different sensitivities to the EGFR inhibitor gefitinib. EGFR activation in HCC827 was inhibited by gefitinib, resulting in a significant reduction of proliferation (Ki‐67 proliferation index) and in the induction of apoptosis (TUNEL staining, M30‐ELISA). No significant effect was observed in conventional cell culture. Results from the 3D model correlated with the results of an in silico model that integrates the EGFR signaling network according to clinical data. The application of TGFβ1 induced tumor cell invasion, accompanied by epithelial–mesenchymal transition (EMT) both in vitro and in silico. This was confirmed in the 3D model by acquisition of mesenchymal cell morphology and modified expression of fibronectin, E‐cadherin, β‐catenin and mucin‐1. Quantitative read‐outs for proliferation, apoptosis and invasion were established in the complex 3D tumor model. The combined in vitro and in silico model represents a powerful tool for systems analysis.
Keywords: 3D tumor model, Boolean model, EMT, Invasion, Personalized medicine, Targeted therapy
Highlights
Combination of a human 3D lung tumor tissue model with a Boolean in silico Model.
Establishment of in silico signaling network topology for personalized medicine.
Significant decrease of tumor proliferation and induction of apoptosis upon in vitro treatment with tyrosine kinase inhibitors.
Decreased proliferation of tumor cells in the 3D model compared to 2D conditions.
Induction of invasion with EMT by TGFβ stimulation.
Abbreviations
- BioVaSc
Biological Vascularized Scaffold
- EGFR
epidermal growth factor receptor
- EMT
epithelial–mesenchymal transition
- MUC1
mucin-1
- PI
proliferation index
- TGFβ1
transforming growth factor-β1
- TKI
tyrosine kinase inhibitor
- SISmuc
small intestinal submucosa with preserved mucosa
- SEM
scanning electron microscopy
- TEM
transmission electron microscopy
- 3D
three-dimensional
- 2D
two-dimensional
1. Introduction
Lung cancer is the leading cause of cancer‐related deaths world‐wide (Ferlay et al., 2010). One of the most recent clinical successes in treating lung cancer is the application of tyrosine kinase inhibitors (TKI) targeting the epidermal growth factor receptor (EGFR) such as gefitinib (Iressa; AstraZeneca) and erlotinib (OSI‐774; Tarceva) in patients with tumors harboring EGFR‐activating mutations (Pao and Chmielecki, 2010). Nevertheless, the survival rate of metastatic disease remains low due to the development of drug resistances (Tsvetkova and Goss, 2012). With respect to personalized medicine, there is an urgent need to establish innovative tumor models which show a satisfactory correlation to clinical performance and represent molecular entities (Tursz et al., 2011). These models should integrate available data from the patient and the latest research, especially regarding signaling information (Ventura et al., 2009).
Tissue engineering offers new options for optimized in vitro models including growth conditions that resemble the in vivo situation of tumor cells (Hutmacher et al., 2009). However, identifying the proper conditions for such in vitro models remains a challenge. Tumors comprise cells within a highly structured and defined organization. Juxtaposition of the cells, the exposition to gradients of soluble factors, specific extracellular matrix components, and tissue‐specific physical forces are important aspects that are likely to be required to recapitulate the signals that drive tumor cells to proliferate, migrate or undergo apoptosis. For preclinical prediction of drug‐response, these characteristics should be mirrored in 3D tumor models (Lutolf and Hubbell, 2005). Furthermore, a specific characteristic of invasive carcinomas is the penetration of the basal membrane. This initiates the malignant invasive phase of cancerous disease and thus should be included in in vitro models that tend to predict drug response in advanced disease. Promising scaffolds that consider these aspects – at least to a certain degree – are biological decellularized tissue matrices, especially because several components, structures and properties of the original tissue are retained such as components of the ECM, parts of the basement membrane and rigidity of the scaffold. Our decellularized SISmuc (Small Intestinal Submucosa with preserved mucosa) derives from a more complex structure called the BioVaSc® (Biological Vascularized Scaffold). This porcine jejunum derived scaffold was established several years ago along with special decellularization protocols. These were optimized for a complete tissue decellularization accompanied by optimal preservation of the ECM and the tissue architecture. Scaffold proteins such as different collagens and elastin were retained after the decellularization process (Linke et al., 2007; Schanz et al., 2010; Schultheiss et al., 2005).
Cancer is a heterogeneous disease, but several common hallmarks can be defined that rely on multiple cell functions (Hanahan and Weinberg, 2011). For the identification of promising drug targets, a systems perspective that considers these functions is critical. Therefore, we made combined efforts with an optimized 3D in vitro model and an in silico model which can identify dependencies in signaling networks that underlie drug responses. In the field of cancer systems biology, several methods and approaches have evolved to investigate and analyze cancer mechanisms and signaling. In this study, we applied a network‐ and logic‐based approach, which is highly suitable to capture and model the interplay of cellular signaling events (Morris et al., 2010). The chosen Boolean in silico model focuses on the same level of intracellular resolution of signaling pathways and tumor cell drug responses as are accessible by the in vitro experiments. We introduce for the first time a combined in vitro and in silico lung tumor model that bases on a biological tissue scaffold and on the simulation of corresponding signaling networks involved in proliferation, apoptosis and invasion/EMT. This model was tested, refined and established according to clinical data and literature. Results will be presented as follows: (i) generation of a human 3D lung tumor model with the lung carcinoma cell lines HCC827 (activating EGFR mutation) and A549 (EGFR wild‐type) cultured on a SISmuc, (ii) investigation of differentiation/tumor status by morphology and mucin‐1 (MUC1) as a tumor marker, (iii) predictions of drug responses to gefitinib depending on different clinically relevant genetic backgrounds by the in silico model centered around the EGFR signaling network, (iv) reproduction of these results in the in vitro 3D model, but not in the conventional (2D) cell culture as shown by the quantification of proliferation and apoptosis, (v) TGFβ1‐induction and quantification of invasion accompanied by EMT.
The established in vitro and in silico tumor model combine to generate predictions and to allow subsequent testing of substances to break resistance and to identify biomarker profiles for targeted therapies in patients with different driver mutations.
2. Materials and methods
2.1. Cell culture
Both cell lines were purchased from DSMZ. A549 cells were cultured in RPMI + 10% FCS, HCC827 cells in RPMI + 20% FCS. Cultures were monitored for pathogen infections at regular intervals. For 3D culture, cells were seeded on the SISmuc (See porcine material), which was fixed between two metal rings. Both 2D and 3D cultures were performed under standard conditions (37 °C, 5% CO2). Stimulation with gefitinib (Iressa; AstraZeneca, Germany, 1 μM) was done in 2D for 72 h and in 3D for the last 72 h of 14d culture with a medium change after the first 48 h of stimulation. TGFβ1‐stimulation was done using 5 ng/ml human TGFβ1 (Cell Signaling, USA, #8915) solved in the cell culture medium.
2.2. Porcine material
Our SISmuc consists of porcine small intestine submucosa (SIS) and mucosa (muc). Animals were sacrificed at the Center for Experimental Molecular Medicine (ZEMM, Würzburg) and the BioVaSc® was prepared as previously described (Linke et al., 2007; Schanz et al., 2010). SISmuc was generated by removing the mesentery with the vascular tree from the BioVaSc®. All animals received proper attention and human care in compliance with the Guide for Care and Use of Laboratory Animals published by the National Institute of Health (NIH publication no. 85–23, revised 1996) and as approved of by the institutional animal protection board.
2.3. Human material
Human lung and lung tumor tissue was provided by the Department of Thoracic Surgery of the University Hospital of Wuerzburg (local ethics committee approval: 182/10, April 4th 2011) and was used for histological and immunohistochemical staining.
2.4. MTT‐assay
Cells were seeded in a 96 well plate (at least in quintuplet for each condition) and cultured for 3 days. MTT (3 mg/ml) reagent (SERVA, Germany) was mixed 1:10 with cell specific medium. Cells were incubated in this solution for 4 h before removal of the reagent and addition of 200 μL DMSO and 25 μL glycine buffer per well. The plate was measured in a Microplate Reader (Tecan Sunrise, Tecan, Germany) at 570 nm. The MTT‐assay was independently repeated 4 times to get 4 mean values from the repetitions of each condition.
2.5. Immunohistochemistry
Chamber slides were fixated in 4% PFA for 10 min, SISmuc samples for 4 h. After fixation, chamber slides were either directly stained or stored in PBS‐ buffer at 4 °C for up to 1 week prior to staining. SISmuc samples were stained as paraffinized sections (3 or 5 μm) and primary antibodies were incubated for 60 min at room temperature (RT). Samples were stained using DCS Super Vision 2 Kit (DAKO, Germany). For fluorescent staining, primary antibodies were diluted 1:100 and incubated overnight at 4 °C, secondary antibodies were diluted 1:400 and incubated for 60 min at RT. Double staining was performed by using primary antibodies of two different species. The isotype of each respective primary antibody was used as a negative control. Nuclei were counterstained by DAPI solved in Mowiol embedding solution. Pictures were taken by using an Axiovert 200M microscope (ZEISS, Germany).
2.6. Western blot
Cells were lysed in lysis buffer (20 mM Tris–HCl pH 8.0, 137 mM NaCl, 2 mM EDTA, 50 mM NaF, 1 mM NaVO3, 10% Glycerol, 1% NP‐40, 0.5% DCA, 0.1% SDS, 1× Proteinase Inhibitor Cocktail (Sigma–Aldrich, Germany). Protein samples (20 μg/lane) were separated electrophoretically in a 10% SDS gel and blotted on a 0.2 μm nitrocellulose membrane (Whatman). Primary antibodies were incubated in 10% milk for 2 h at RT (PCK) or overnight at 4 °C (EGFR, pEGFR). Secondary antibodies were incubated for 1 h at RT. Blots were developed using the Pierce ECL Western Blotting kit (Thermo Fisher Scientific Inc., USA) and visualized using the Imaging Station FluorChem Q (Biozym Scientific, Germany).
2.7. Antibodies
The antibodies used for immunohistochemical staining or western blotting are β‐catenin (E247, AbCam, GB, ab32572), E‐cadherin (24E10, Cell Signaling Technology, USA, 3199), EGFR (D38B1, Cell Signaling, 4267, IHC 1:50, WB 1:1000), fibronectin (IST‐9, 1:200, AbCam, ab23750), Ki67 (SP6, 1:100, AbCam, ab16667), MUC1 (GP1.4, 1:1000, Imgenex, USA, IMG‐80045), PCK (C‐11 + PCK‐26 + CY‐90 + KS‐1A3 + M20 + A53‐B/A2, 1:10,000, Sigma–Aldrich, Germany, C 2562), pEGFR (D7A5, Cell Signaling, USA, 3777, IHC 1:400, WB 1:1000). Used isotypes are mouse IgG1 (X0931, DAKO, Germany), rabbit IgG monoclonal (Novus Biologicals, USA, NB810‐56910), rabbit IgG polyclonal (AbCam, GB, ab27472). Secondary antibodies used for IF were donkey‐anti‐mouse, Alexa555 conjugated (Invitrogen, USA, A‐31570), donkey‐anti‐rabbit, Alexa488 conjugated (Invitrogen, USA, A‐21206), and for WB HRP‐conjugated goat‐anti‐rabbit (AbCam, GB, ab6721) and goat‐anti‐mouse (AbCam, GB, ab47827).
2.8. M30‐ELISA
The ELISA‐assay was performed according to the protocol of the M30 CytoDeath ELISA Kit (Peviva, Sweden). All samples were analyzed in duplicates. The M30‐ELISA was independently repeated 4 times to get 4 mean values from the duplicates of each condition.
2.9. TUNEL‐assay
The TUNEL‐assay was performed according to the protocol of the In Situ Cell Death Detection Kit, POD (Roche) on paraffin sections (5 μm). Nuclei were counterstained by DAPI solved in the Mowiol embedding solution. Pictures were taken using an Axiovert 200M microscope (ZEISS, Germany).
2.10. Quantification/statistics
Ki67‐staining and invasion were quantified by counting cells (using ImageJ) for 4 independent experiments on 10 images per experiment by the same experimenter blind to condition. Arithmetic means of the single experiments were then used for statistical evaluation.
Invasion was evaluated with DAPI stained slides. The number of non‐invaded cells was ascertained by counting the cells on top of the matrix. The value for invaded cells resulted from single cells and groups of up to three cells but not from larger groups inside the matrix.
For Ki67 staining, DAPI invasion measurements, M30‐ELISA and MTT‐assay, Wilcoxon rank sum test was performed with the arithmetic means of duplicates/triplicates of single experiments. For p < 0.05, differences were defined as being significant. All statistical analysis was done with the open‐source program R (The Comprehensive R Archive Network, http://cran.r‐project.org/).
2.11. In silico modeling
For an integrative, systemic approach we chose a Boolean model as this is able to predict signaling effects in tumor cells upon treatment as a basis for optimized new targeted therapies, exploiting the experimental in vitro data. After establishing the network topology, the switching behavior of the different signaling components was analyzed according to their logical connectivity in a Boolean model (nodes and interactions explained and referenced in Supplementary material Table S1 and S2, respectively). We subsequently transferred the Boolean model into a semi‐quantitative model (Mischnik et al., 2013; Naseem et al., 2012; Philippi et al., 2010) to understand the succession of events and to identify master nodes and therapeutic targets. This allows assessing output parameters comparatively for different treatment regimes, cell types or growth conditions. Interpolation applied exponential‐functions between full on and off node states as introduced by Di Cara et al. (Di Cara et al., 2007). Model topology was setup using CellDesigner (Version 3.5.1). The resulting xml‐file was imported into SQUAD for further semi‐quantitative simulation experiments (simulation details in Supplementary material Figure S1, Figure S2). The modeling method used is compared in detail to other approaches in Schlatter et al. (2012). The required software for setup and dynamic calculations are all publicly available. The unique feature of our model is the integration and adaptation of an optimized 3D cell culture tumor model coupled with a matching in silico model of the involved signaling. The machine‐readable XML model file capturing the cancer model developed here is available as Supplementary material.
3. Results
3.1. SISmuc as scaffold for tumor cell growth reflecting the in vivo situation
In order to establish a tumor model, different parts of the intestinal decellularized scaffold were tested for cell seeding. In contrast to SIS (small intestinal submucosa) alone or with serosa, SIS with preserved mucosa (SISmuc) showed best growth conditions for carcinoma cell lines with the formation of complex epithelial structures growing at least in part as a monolayer. SISmuc includes the histological part of the intestinal epithelium. The histology of the generated 3D cultures was investigated with seeding densities from 50,000 to 1 million cells and optimal growth of the cells on the matrix was reached at 105 cells per sample even though higher cell numbers showed similar results. With 105 cells, different culture periods from 7 to 28 days were compared by histological and immunohistochemical E‐cadherin staining (data not shown, for 14 days period see Figure 6). A stable histological differentiation was reached after 14 days of culture which continued up to the longest tested period of 28 days. For test system efficacy, the shortest possible time‐frame of 14 days was chosen.
Figure 6.
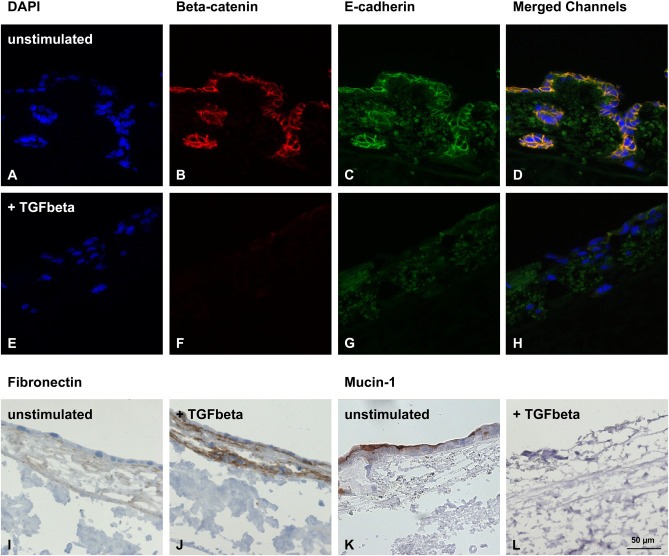
Induction of EMT in HCC827 cells by TGFβ1‐stimulation. Immunohistochemical fluorescence staining demonstrates the down‐regulation of β‐catenin and E‐cadherin upon stimulation with TGFβ1 accompanied by the loss of epithelial monolayer integrity (nuclei stained with DAPI) (A–H). Immunohistochemical staining shows that the mesenchymal marker fibronectin is up‐regulated (I, J). The epithelial marker MUC1 (K, L) is down‐regulated by TGFβ1‐stimulation. Scale bar in L: 50 μm (A–L).
To demonstrate that the SISmuc is a suitable 3D scaffold for our tumor model, we characterized histology of the cells on the scaffold by HE‐staining (data not shown). The investigated cell lines formed a mostly homogenous monolayer on top of the matrix and grew into former crypt structures (Figure 1C, F).
Figure 1.
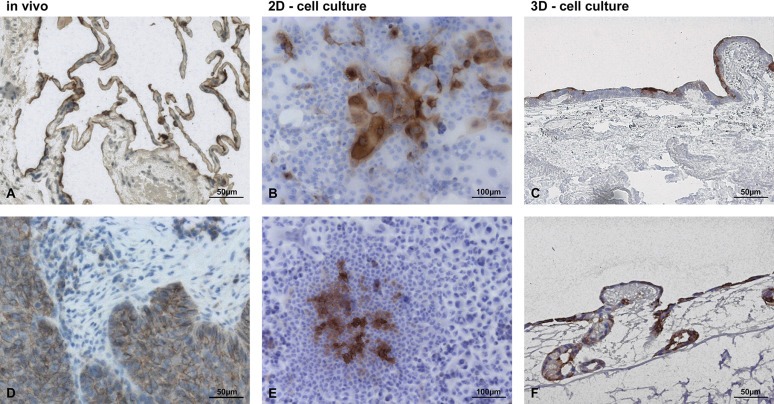
SISmuc as scaffold for tumor cell growth reflecting the in vivo situation. Immunohistochemical stainings of MUC1 revealed similarities of lung tissue and lung tumors only in the 3D model but not in the 2D model. While MUC1 is expressed only on the apical side of most cells in healthy lung tissue (A), MUC1 is localized basolateral/cytoplasmic in lung tumors (D). Under 2D cell culture conditions, MUC1 expression is restricted to a few cells in HCC827 (B) or A549 (E), in which an apical or basolateral/cytoplasmic position cannot be distinguished. In the 3D environment, MUC1 is expressed in most cells and can be predominantly observed apically in HCC827 (C) or basolaterally/cytoplasmatically in A549 cells (F).
Furthermore, to analyze the tumor status in this 3D environment, we stained for MUC1, an important protein of the mucous layer of the lung, which is used as a tumor marker dependent on its localization. Whereas MUC1 is localized apically in cells of healthy lung tissue (Figure 1A), it is up‐regulated in lung carcinomas and changes to a basolateral/cytoplasmic position in these tumor cells (Figure 1D). In contrast to 2D culture, most of the cells in our 3D model expressed MUC1 and an apical as well as a basolateral/cytoplasmic localization could be determined. In HCC827, a predominantly apical and in A549 a predominantly basolateral/cytoplasmic localization of MUC1 was observed (Figure 1C, F). In conventional 2D culture, MUC1 expression was restricted to a few cells and its localization could not be distinguished (Figure 1B, E).
3.2. HCC827 and A549 cell lines as representatives of lung carcinoma subgroups
Two lung carcinoma cell lines representing different patient subgroups concerning gefitinib treatment were chosen for all experiments (Bronte et al., 2010). HCC827 cells are reportedly hypersensitive to gefitinib due to their activating mutation in the EGFR gene (Engelman et al., 2007; Mukohara et al., 2005), while A549 cells are known to be intermediate sensitive due to their wild‐type EGFR gene (Kokubo et al., 2005; Noro et al., 2006).
The described drug‐sensitivities were reproduced in conventional 2D cell culture by MTT‐assay with clinically applied concentrations of around 1 μM. No significant effect on A549 cells was observed, while a tenth of that concentration caused HCC827 cells to show significantly (p = 0.029) reduced vitality (Figure 2I). Proliferation was quantified by the counting of Ki67‐positive cells in immunohistochemical staining (Figure 2A–D), and its percentage was depicted as proliferation index (PI) (Figure 2J). In HCC827 cells, proliferation decreased by about 20% upon gefitinib treatment (Figure 2J), while A549 cells remained unchanged. TUNEL‐assay showed an increase of positive cells upon treatment in HCC827 cells only (Figure 2E–H). Since TUNEL assay is not specific to apoptotic cells, an M30‐ELISA was introduced which measures caspase‐cleaved cytokeratin 18 (CK18) in supernatants that were collected at different time points during treatment. After 48 h, only HCC827 showed a 2–3 fold increase of apoptosis (Figure 2K), which turned out to be non‐significant (p = 0.063).
Figure 2.
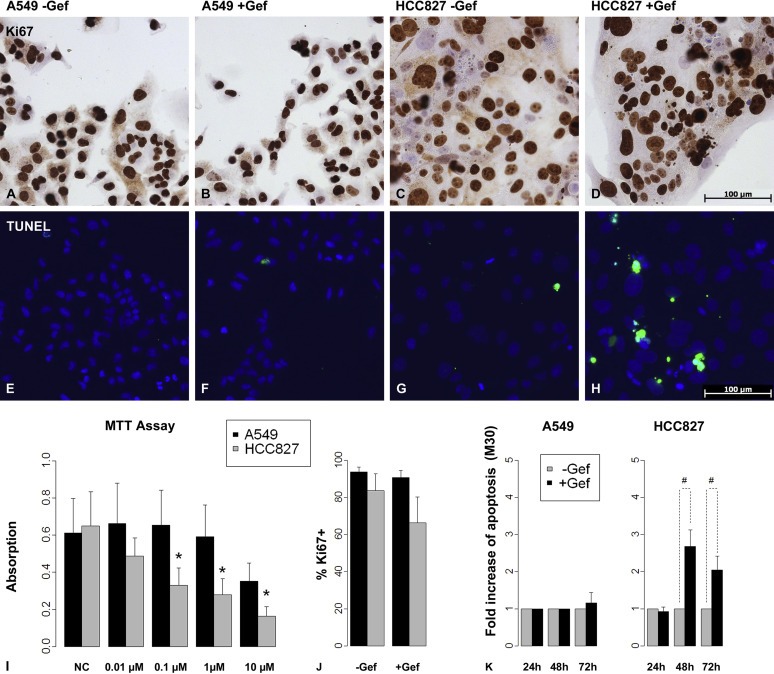
HCC827 and A549 cell lines as representatives of lung carcinoma subgroups. EGFR wild‐type A549 cells showed no significant response to the TK‐inhibitor gefitinib regarding vitality, proliferation or apoptosis as shown by MTT‐Assay (I), by Ki67‐stainings (A, B, J) and by TUNEL‐assay/M30‐ELISA (E, F, K), respectively. In contrast, HCC827 cells harbor an EGFR mutation which leads to a constitutively activated EGFR. The MTT‐assay showed a significant decrease of vitality in HCC827 cells upon 3 days of gefitinib treatment already at a concentration of 0.1 μM (I, *: p < 0.05, n = 4). Upon gefitinib treatment in 2D culture proliferation was not significantly changed as measured by Ki67‐stainings (C, D, J (n = 4)), and also the induction of apoptosis after 2 as well as 3 days of treatment as measured by TUNEL‐assay and M30‐ELISA did not reach significance (G, H, K, # = 0.1 > p > 0.05, n = 4). Bars: arithmetic means. Error bars: standard deviation.
As gefitinib targets the EGFR, these results were matched to both cell lines' overall EGFR expression as well as to their EGFR activation as measured by phosphorylation. While both cell lines express EGFR to a high extent, only HCC827 cells showed a high activation of EGFR that was decreased upon gefitinib treatment as shown by immunohistochemical stainings and confirmed by western blot analysis (Figure 3).
Figure 3.
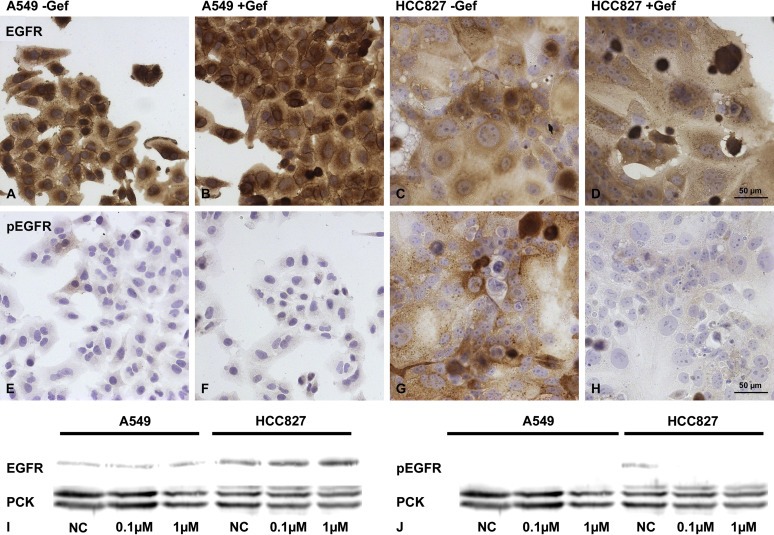
Gefitinib treatment decreases EGFR activation in HCC827 cells. Under 2D cell culture conditions, both cell lines strongly expressed EGFR ‐ with and without treatment – as shown by immunohistochemical staining (A–D). While the phosphorylation status of the EGFR was not influenced by gefitinib in the A549 cells (E, F), the treatment resulted in a distinct decrease of EGFR phosphorylation in HCC827 cells (G, H). These results could be confirmed by western blot analysis (I, J).
Since we were interested in understanding drug actions and their impact on our read‐out parameters, we generated an in silico model parallel to the in vitro model that integrates the EGFR pathway and other relevant pathways of cancer progression such as the TGFβ pathway.
3.3. In silico modeling of EGFR inhibition: gefitinib action results in a decrease in proliferation and an increase in apoptosis
The EGFR pathway is embedded in a complex network so that the prediction of therapy effects is very challenging. Furthermore, effects of genetic background variance can only be considered if the respective proteins are included in the model. We therefore applied a systems biological approach taking into consideration the counter regulation and cross‐talk of different pathways. After establishing the network topology, the switching behavior of the different signaling components was analyzed according to their logical network connections in Boolean models. We subsequently transferred these into semi‐quantitative models. Such models monitor system changes between fully‐on‐ and fully‐off‐state of signaling molecules, applying interpolation functions. Semi‐quantitative models give only comparative information such as different activation degrees, but they already work in the absence of detailed information on kinetic parameters (Di Cara et al., 2007; Naseem et al., 2012; Schlatter et al., 2012). They allow rapid comparison of different cell types and genetic backgrounds and enable the understanding of the succession of events to identify master nodes as promising therapeutic targets.
To create the backbone of the main components of the EGFR signaling network, we integrated relevant data from a meta‐analysis that reviewed over 140 studies on EGFR signaling (Oda et al., 2005). We included further pathways to connect this network to relevant read‐out parameters, such as proliferation and apoptosis. Supplementary material gives a detailed list of the nodes included (Table S1) and how their connectivity was modeled (Table S2). Quantitative read‐out parameters and systemic responses are established according to current literature and available clinical data (Lara‐Guerra et al., 2012; Philippi et al., 2009). System states and network responses including different cellular read‐outs (signaling pathways mediating proliferation, apoptosis) are given in the supplementary material Figure S1 and S2, respectively. The in silico models of the two different tumor subgroups, with activating EGFR mutation (model A) or with Kras mutation (model B), resulted in two different gefitinib responses. Model A showed a decrease in proliferation and an induction of apoptosis upon gefitinib treatment (i.e. reduction of EGFR activation) (Figure 4), whereas the model B (EGFR wild‐type; Kras mutation) did not show any response (Supplementary material, Figure S1).
Figure 4.
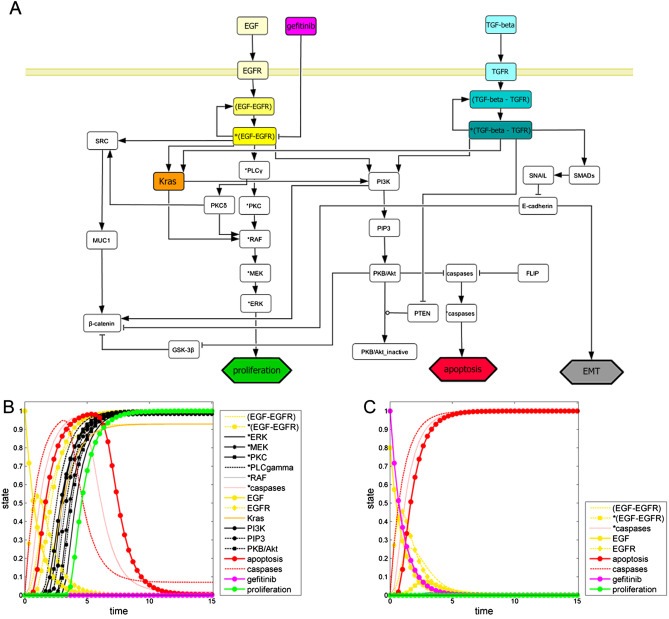
In silico modeling of EGFR inhibition: gefitinib action results in a decrease of proliferation and an increase of apoptosis. (A) Network topology comprising the EGFR cascade (yellow), the TGFR cascade (blue), Kras (orange), effects of gefitinib (pink), and the read‐out parameters: proliferation (green), apoptosis (red), and EMT (gray). Cell signaling in tumors with activating EGFR mutations is simulated without (B) and with gefitinib treatment (C). (B) EGFR gets completely activated (initial value EGF: 1.0), which results in predominating proliferative effects (green curve) and diminishing apoptotic effects (red curve) over time. (C) The simulation of the EGFR inhibition (initial value EGF: 0.8) by gefitinib (value: 1.0) shows a reduction in proliferation compared to untreated conditions and an induction of apoptosis over time.
Furthermore, we induced an additional read‐out parameter for drug testing in different tumor states: Lung cancer is often diagnosed in a late phase of tumor progression in which invasion has already started. TGFβ1 is secreted by the tumor stroma. This is known to induce EMT, which is an important mechanism to enable tumor cell invasion (Tian and Schiemann, 2009). Hence, we integrated the TGFβ1 pathway and EMT responses in our in silico model to monitor model predictions about EMT upon TGFβ1‐stimulation (Supplementary Material, Figure S2). Next, the established model was extensively compared with the results of in vitro experiments (e.g. changes of the read‐out parameters proliferation and apoptosis upon TKI‐treatment and changes in EMT upon TGFβ1‐stimulation).
3.4. Analysis of drug responses in the 3D tumor model yields significant results
In our 3D tumor model with the activated EGFR (HCC827), we observed a significant decrease (p = 0.008) in proliferation upon gefitinib treatment as determined by the PI (Figure 5C, D and G), as well as an increase in TUNEL positive cells (Figure 5E, F). To quantify apoptosis induced by gefitinib, each sample of supernatants was normalized to the base‐line level of M30 and then the influence of gefitinib was tested. In HCC827 cells, 1 μM gefitinib caused a significant induction of apoptosis at all three measured time points. Remarkably, the induction was already observed after 24 h (Figure 5H). In the 3D tumor model with A549 cells (EGFR wild‐type), we did not observe any response regarding proliferation and apoptosis upon gefitinib treatment (Figure 5A, B, H).
Figure 5.
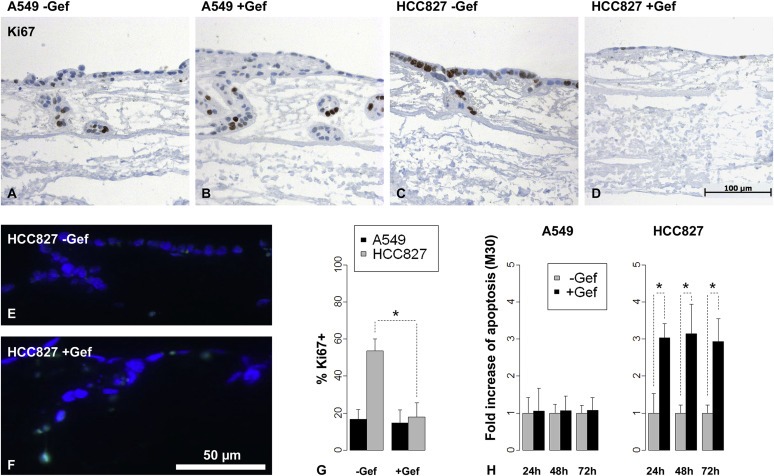
Analysis of drug responses in the 3D tumor model yields significant results. Gefitinib treatment did not reduce the proliferation measured by Ki67 immunohistochemical staining in A549 (A, B) but in HCC827 3D tumor models (C, D). Proliferation was quantified by determining the proliferation index (percentage of Ki67 positive cells) and revealed a significant reduction in HCC827 but not in A549 cells by gefitinib treatment (G, *: p < 0.05, n = 5). Apoptosis was induced by gefitinib in HCC827 models as seen by TUNEL‐assay (E, F), which was quantified by M30‐ELISA measurements from culture supernatants: In contrast to A549 cells, HCC827 cells showed significantly increased apoptosis in response to gefitinib (H, *: p < 0.05, n = 4) already after 24 h. Bars: arithmetic means. Error bars: standard deviation.
Test systems that are based on biological scaffolds commonly suffer from high variation and have to be standardized carefully. For this reason, variation coefficients were calculated from three independent untreated trials in fivefold replicates to estimate reliability of the results from our 3D tumor model. The variation coefficients were always under 50% in each independent trial. The lowest observed values in our system were around 10%. This allows in our system 95% confidence detection limits for two fold changes (worst case) and 20% changes (optimal conditions), respectively.
It is known that there could be changes in signaling in 3D models (Smalley et al., 2006) compared to 2D culture conditions due to the more complex interaction of the cells with each other and their environment. Immunohistochemical staining and western blot analysis confirmed that the inactivation of the EGFR upon gefitinib treatment is maintained in the HCC827 3D tumor model (Supplementary Material, Figure S3).
3.5. Induction of EMT and invasion by TGFβ1‐stimulation
EMT is an important event in tumor cell invasion, which is currently not included in most tumor models. For the induction of EMT, we added TGFβ1 to culture media of both HCC827 and A549 3D samples over the entire culture period. After 14 days of culture, we investigated the cell morphology and several molecular markers that are involved in the EMT process. Even though the effects of TGFβ1 are similar in both cell lines, the results from HCC827 cells were more prominent and are shown in Figure 6. The tumor cells flattened and elongated to a mesenchymal phenotype and the organized epithelial monolayer structures were disintegrated upon TGFβ1‐stimulation. These morphological changes were accompanied by the loss of the epithelial markers E‐cadherin (Figure 6C, G), MUC1 (Figure 6K, L) and associated β‐catenin (Figure 6B, F). Moreover, an induction of the mesenchymal marker fibronectin was observed (Figure 6I, J), indicating the successful induction of EMT within the 3D model. Furthermore, invasion of single cells into deeper areas of the scaffold could be induced (Figure 7). Quantification could be achieved by determining the percentage of cells on top of the matrix and of dispersed cells within the matrix in stimulated compared to unstimulated samples (Figure 7C). Scanning electron microscopy (SEM) and transmission electron microscopy (TEM) analysis of our tissue matrix prior to seeding with cells suggest the presence of preserved structures of the basal membrane after the decellularization process (Figure 7D–F).
Figure 7.
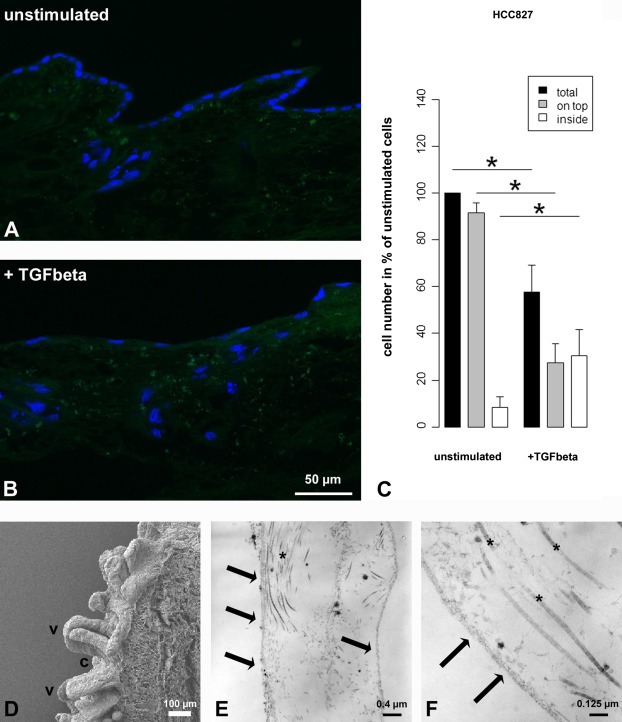
Quantification of single cell invasion into the matrix by TGFβ1‐stimulation. Fluorescence staining (DAPI) shows that cells formed a monolayer on top of the matrix and that cells collectively grew into deeper layers along former crypt structures (A). After TGFβ1‐stimulation, monolayer integrity was lost and single cells migrated from the top of the matrix into deeper layers (B). Quantification demonstrates significant changes upon TGFβ1‐stimulation, i.e. a decrease of total cell number (black bars) and of cells on top of the matrix (gray bars), and an increase of invaded single cells inside the matrix (white bars) (C; ∗: p < 0.05, n = 4). Bars: Arithmetic means. Error bars: standard deviation. SEM analysis shows crypts (c) and villi (v) of the decellularized small intestine (D). TEM analysis of ultra thin sections shows the basal lamina (arrows) as well as collagen fibrils (∗) of one villus after decellularization prior to seeding with cells (E, F).
4. Discussion
4.1. General implications of the results
In the present study, we were able to establish human 3D lung tumor models which show i) specific characteristics of complex tumor tissues as shown by the distinct localization and up‐regulation of the tumor marker MUC1 (Figure 1), ii) a lower proliferation rate compared to 2D cell culture (Figure 2, 5), iii) clear responses upon drug treatment (i.e. significant differences that could not be seen in 2D culture), iv) induction of invasion upon TGFβ1‐stimulation accompanied by EMT (Figure 6, 7), and v) the preservation of basement membrane structures in the 3D model (Figure 7). For all read‐out parameters, i.e. proliferation, apoptosis and invasion, quantitative analysis methods were established and mechanisms were underpinned by the determination of the EGFR activation status and molecular markers of EMT (Figure 2, 3, 6, 7). An in silico tumor model integrates different stimuli and data of signaling networks as well as clinical data and successfully predicts the same read‐out parameters upon treatment as used in the in vitro tumor model. Depending on the genetic background our in silico model predicted different drug effects according to clinical data (2, 3, 6, 7 and Figure S1).
4.2. In silico modeling of cell signaling in cancer
In the field of cancer systems biology, various methods and approaches of different scales have been developed to study cancer growth mechanisms and signaling. Mathematical in silico models range from stochastic to network‐ and logic‐based models (Cheng et al., 2012). In this regard, Monte Carlo simulations are able to calculate drug responses of whole tumor tissues (Wu et al., 2013). In contrast to Monte Carlo approaches applied to model dose responses for a complete tumor, we aimed at obtaining insights into the signaling within tumor cells as a basis for optimized new targeted therapies. Logic‐based (Boolean) models allow a systems biological perspective by analyzing the network dynamics that is determined by interlinked signaling events in tumor cells (Cheng et al., 2012). Integrating the complex interplay of signaling pathways and their interactions with each other (Morris et al., 2010), Boolean models capture the cell behavior upon different stimuli (Boyanova et al., 2012) and set the basis for a quantitative pharmacological‐driven dynamic analysis (Wangorsch et al., 2011). They have proven to be predictive even when hormones and other effectors do act in a complex and counter‐intuitive way on various cellular receptors, as shown for the interaction of cytokines and pathogens in plant defense (Naseem et al., 2012).
A number of Boolean models on cellular signaling are already publicly available (Morris et al., 2010). Own previous studies include models on liver cell signaling (Philippi et al., 2009), on cytokine signaling in plant–pathogen interactions (Naseem et al., 2012) as well as on quorum sensing in bacteria (Audretsch et al., 2013) and on platelet signaling (Mischnik et al., 2013). Boolean models excel to analyze and model cellular signaling within a tumor cell (Saez‐Rodriguez et al., 2011; Zhang et al., 2008). Their historic record in this respect and a direct comparison of a number of semi‐quantitative modeling frameworks to dynamically interpolate between binary Boolean states are given in Schlatter et al. (2012). The interpolation approach between Boolean states applied in these semi‐quantitative models enables them to be dynamically predictive even if no detailed kinetic information on the dynamic parameters is available. A key advantage of our combined model system is that it can be adjusted to further extracellular signals or hallmarks of cancer such as the influence of immune reactions by adding cells of the immune system. Regarding cytokine effects on immunity, different topologies and simulations are already available (Naseem et al., 2012; Schlatter et al., 2012).
4.3. Mirroring tumor and tissue characteristics in a 3D tumor model
Three dimensional culture conditions on biochemically active matrices that release defined biologically active substances offer cells a more complex environment than conventional 2D culture systems. This has an impact on differentiation, drug response, signaling and the malignant phenotype of tumor cells (Paszek et al., 2005; Walles et al., 2007). The here applied SISmuc is a derivative of the BioVaSc®, which is in turn a sophisticated matrix with a preserved structure of the vasculature. BioVaSc® is in use for many other tissue engineering applications, such as the generation of vascularized liver tissues in bioreactor settings with the possibility of long‐term culture of primary cells (Schanz et al., 2010). SISmuc, a decellularized porcine jejunal fragment, provides extracellular components and a complex tissue architecture with numerous cavities and physical properties of living tissues for optimized cell growth in 3D culture (Gonzalez‐Rodriguez et al., 2012). For model establishment, we chose lung cancer cell lines because these are approved in other studies to be relevant representatives of their original tumors and provide means of standardization to the system (Gazdar et al., 2010; Sos et al., 2009). To analyze the suitability of our matrix for tumor cell growth and its influence on the tumor status, we used MUC1 as a marker that can distinguish between a more differentiated and a tumorigenic state of the cells. In normal healthy lung epithelial cells, MUC1 is localized at the apical side of the cells (Ho et al., 1995). Due to the process of dedifferentiation during tumorigenesis, MUC1 changes its localization from the apical to a cytoplasmic or basolateral side of the cell. This is seen in many kinds of cancer cells (Aubert et al., 2009; Lau et al., 2004; Lopez‐Ferrer et al., 2001). In general, MUC1 is assumed to be important for oncogenic signaling as it is necessary for MAPK activity (Cullen, 2007). Both investigated cell lines showed a good adherence to our matrix with the establishment of a monolayer on the surface and an ingrowth into the former crypt structures. Culture of the cells on the matrix led to an increase of MUC1 expression in both cell lines in comparison to 2D culture conditions where its localization could not be assessed. The localization of MUC1 was predominantly basolateral/cytoplasmic in A549, indicating a more malignant tumor status of these cells and predominantly apical in HCC827 indicating a less malignant tumor status.
4.4. Lower proliferation rates in 3D reflect tumor conditions more accurately
Regarding drug testing, it is a well‐known problem in commonly used 2D culture tumor models that cells exhibit a much higher proliferation rate than most of the tumors in patients (Cree et al., 2010; Haga et al., 2003; Lara‐Guerra et al., 2012; Yamada and Cukierman, 2007). In our 3D tumor model, we attained much lower proliferation rates than in 2D conditions (A549: 17% vs. 94%; HCC: 54% vs. 84%). This should lead to more reliable predictions of drug response, especially for cytostatic drugs or drugs that interfere with signaling connected to proliferation (Cree et al., 2010).
4.5. Establishment and quantification of read‐out parameters
In 2D culture, we could confirm a significant reduction (p = 0.029) of HCC827 vitality in MTT‐assays upon gefitinib treatment with concentrations as low as 0.1 μM. To analyze our 3D models in more detail, we wanted to quantify proliferation and apoptosis which both have an effect on tumor cell vitality. Proliferation was measured by changes of the proliferation index (PI) as explained before, and apoptosis was determined by i) TUNEL to estimate DNA damage and its localization in the artificial tissue and quantified by ii) M30‐Apoptosense ELISA testing the cell supernatant. This assay offers several advantages for the 3D system. Since the M30 epitope (CK18) is only expressed in epithelial cells, M30 detection produces a specific read‐out for carcinoma cells undergoing apoptosis. This is attractive for future co‐culture settings in which other cell types from the tumor stroma are co‐cultured with tumor cells. Apoptotic bodies in vitro are not phagocytized by macrophages, but release their contents into the culture media. Thus, CK18 can be detected non‐invasively in culture supernatants. This allows the assessment of multiple time points of one culture period and this also improves in silico kinetic modeling.
Interestingly, results from 2D testing with clinically relevant concentrations of 1 μM gefitinib could not reach significance either in HCC827 or in A549 regarding the change in proliferation and apoptosis. However, a decrease of PI from 84% to 66% in HCC827 and a 2–3 fold induction of apoptosis after 48 h in M30‐ELISA could be observed.
Iterative cycles of in silico model refinement were performed, whereby results were compared and fine‐tuned according to literature and experimental data. The established in silico model mirrored clinical data on TKIs successfully, such as gefitinib treatment on different tumor background mutations such as EGFR and Kras.
In contrast to the 2D model, our 3D tumor model generated significant drug responses as observed in the clinic and as predicted by the in silico model. The reduction of proliferation correlated to clinical data, which has been shown in retrospective studies (Lara‐Guerra et al., 2012). Upon gefitinib treatment, we observed a reduction of proliferation (p = 0.008) from 58% to 20% (2, 3, 6, 7 G) and an about 3‐fold induction of apoptosis (p = 0.029) already after 24 h in the HCC827 model (2, 3, 6, 7H). These findings go in line with a down‐regulation of the EGFR activation upon gefitinib treatment as shown by the decreased phosphorylation of the receptor in immunohistochemistry and western blot analysis in 2D as well as under 3D conditions. Our results show that drug treatment of cells grown in 3D conditions on an extracellular matrix scaffold had stronger and faster effects than in 2D cultured cells, which supports the notion that the 3D model is more appropriate for further drug testing. It is known that 3D systems exhibit a higher chemo‐resistance, making them more attractive for drug testing due to improved specificity (Cree et al., 2010).
4.6. Invasion and metastasis
We further aimed to expand our model by the induction of invasion because most lung tumors are diagnosed in advanced invasive states. The induction of invasion and EMT by TGFβ on synthetic matrices has been investigated previously by others (Gill et al., 2012). We could confirm these findings on our biological matrix with both cell lines by morphological changes and modified expression of several molecular markers. Additionally, our decellularized matrix shows preserved structures of the basal lamina in electron microscopy analyses (Figure 7D–F). The penetration of the basal lamina by cancer cells is one hallmark of tumors to reach malignancy and to become invasive. This observation suggests that our model includes supplemental features of original tissues that are important from the clinical perspective and are difficult to reach with synthetic matrices. The effects of TGFβ on the 3D tumor models were more prominent in HCC827 than in A549 models. This goes in line with the observation that A549 cells display a more malignant phenotype as seen by the high basolateral/cytoplasmic localization of MUC1. It is further supported by a low basal E‐cadherin/β‐catenin expression without accumulation of these markers at the cell junctions as also reported by others (data not shown, (Singh et al., 2009)). Quantification of invasion was achieved by establishing a counting algorithm that could distinguish between cell ingrowth along former crypt structures and invaded single cells. In silico, the effects of tumor promoting signals such as TGFβ1 were also included (Figure S2). This renders the model attractive for analysis of molecular mechanisms and medical intervention during tumor progression. So far, there are only few models which represent processes regarding invasion (Hutmacher et al., 2009).
4.7. Individualized therapy and genetic variation
Our study aimed at the development of accurate and robust read‐out parameters in a 3D tumor model that correlates to clinical data. Thus, our model has been validated according to a well‐established personalized therapy that is based on EGFR as a molecular marker (Bronte et al., 2010). Treatment with the TKI inhibitors gefitinib or erlotinib results in a prolonged progression free survival (PFS) in patients harboring activating mutations of the EGFR in their tumors (Mok et al., 2009; Paez et al., 2004). Therefore our model was designed with two human cell lines representing two different subgroups of lung tumors either responsive or non‐responsive to gefitinib. As known from many cell culture studies, HCC827 cells are hypersensitive to gefitinib and carry an activating EGFR gene mutation (Engelman et al., 2006) – like approximately 13% of NSCLC patients (Sequist et al., 2011). The other cell line, A549, carries the EGFR wild‐type gene, but harbors on the other hand a mutated Kras gene that is known to be mutated in 24% of NSCLC (Sequist et al., 2011). These A549 cells show an intermediate sensitivity to gefitinib in 2D culture studies (da Cunha Santos et al., 2011; Pao and Chmielecki, 2010). This most common Kras mutation in lung cancer is under debate to be associated with resistance to TKI (Pao et al., 2005; Riely et al., 2009).
Knowledge of tumors and their drug sensitivities depending on a patient's genetic background has expanded immensely, particularly by advanced technologies such as next generation sequencing (Sos et al., 2009). Drug responses do not mostly rely on a single specific target, but on multiple effects of this drug on the signaling network (Lamb, 2007). Therefore, the understanding of drug action mechanisms in connected networks and not in single pathways is very important for the development of rational treatment strategies and better biomarker profiles. Computational modeling for predictive simulations of individual patients is recognized to be an important step towards personalized medicine (Tursz et al., 2011). We focused on a systems biological approach which also considers counter regulation and cross‐talk of different pathways.
The interpolation between Boolean states applied in these semi‐quantitative models allows dynamic, model‐based predictions even if no detailed kinetic information on the dynamic parameters is available.
The specific point of our Boolean model is that we combine a 3D cell culture tumor model in vitro with a matching in silico model of the involved signaling. The model is certainly a simplification and focuses only on key nodes, connections and central examples for genetic modification. However, in silico pre‐screening of drug effects can be easily achieved and monitored, for instance the effects of a combination therapy with gefitinib and gemcitabine (Nakajima et al., 2012).
A further advantage of our 3D tumor model is that immunohistochemical staining can be carried out on paraffin slices of the samples as it is done in the clinic. This enables a close translation of marker‐based analyses from the clinic into our model and vice versa.
5. Conclusions and outlook
In our 3D tumor model, detailed quantitative read‐outs were established for proliferation, apoptosis and invasion going along with EMT. In combination with the in silico model, this 3D model is a good basis for drug testing with emphasis on the mechanistic understanding of multiple drug actions that are often crucial for drug response. Our tumor model may help to overcome drug resistance, to identify new therapy targets, and promising drug combinations as well as biomarker profiles for individualized therapy.
As our system bases on the sophisticated BioVaSc®, which is in use for transport studies and many other applications, the tumor model can be translated into dynamic bioreactor culture settings that enable i) vascularization of the tumor ii) simulation of long‐term treatment, and iii) further investigations regarding more complex models integrating different cell types from the tumor stroma such as fibroblasts and immune cells.
Financial support
This research was sponsored by the Center for Interdisciplinary Clinical Research (IZKF, grant BD247) of the University Hospital of Wuerzburg and the Bayern Fit program (granted to H.W.)
Conflict of interest
No conflict of interest.
Supporting information
The following are the supplementary data related to this article:
Supplementary Figure S1In silico modeling of gefitinib response in A549 cells bearing a Kras mutation. Dynamic model simulation of different nodes (assuming constantly hyperactive Kras at 0.4) of the signaling network (Figure 4A) using SQUAD. (A) An activating signal of the EGFR (value: 0.3; EGF approximately 0.4, not strong, wild type) evokes a moderate proliferative (0.2) and apoptotic (0.2) signal over time. (B) Upon gefitinib inhibition, the activation of EGFR diminishes to 0.03. The resulting simulation of selected nodes shows no response to gefitinib regarding apoptosis (0.2) and proliferation (0.2) over time compared to the untreated condition in A.
Supplementary Figure S2TGFβ stimulation. Dynamic model simulation of different nodes of the signaling network (Figure 4A) using SQUAD. TGFβ‐receptor stimulation (initial value of TGFβ: 1.0), results in EMT signaling (0.9, nearly maximal), the activity of several other network nodes is shown in the cell‐type specific context and activation state of HCC827 cells.
Part II: 3D tumor tissue model.
Supplementary Figure S3Gefitinib effects on HCC827 in the 3D tumor tissue model. In 3D conditions the EGFR activation is reduced and apoptosis is induced in HCC827 by gefitinib. Immunohistochemical stainings of 3D tumor tissue models show weak signals for the EGFR in A549 (A, B) with no obvious phosphorylation (E, F). In HCC827 the EGFR could be clearly detected (C, D) and its activation was reduced by gefitinib treatment (G, H). These results could be confirmed by western blot analysis (I, J). Apoptosis was not induced in A549 (K, L) but in HCC827 (M, N) by gefitinib as seen by TUNEL‐assay.
Supplementary data
Acknowledgments
We thank Prof. Dr. Georg Krohne (Division of Electron Microscopy; Biocenter of the University of Wuerzburg) for careful analysis of our SEM and TEM samples and discussion of the results, and Claudia Gehrig and Daniela Bunsen for technical assistance.
Supplementary data 1.
Supplementary data related to this article can be found at http://dx.doi.org/10.1016/j.molonc.2013.11.009
Stratmann Anna T., Fecher David, Wangorsch Gaby, Göttlich Claudia, Walles Thorsten, Walles Heike, Dandekar Thomas, Dandekar Gudrun and Nietzer Sarah L., (2014), Establishment of a human 3D lung cancer model based on a biological tissue matrix combined with a Boolean in silico model, Molecular Oncology, 8, doi: 10.1016/j.molonc.2013.11.009.
Contributor Information
Thomas Dandekar, Email: dandekar@biozentrum.uni-wuerzburg.de.
Gudrun Dandekar, Email: gudrun.dandekar@uni-wuerzburg.de.
References
- Aubert, S. , Fauquette, V. , Hemon, B. , Lepoivre, R. , Briez, N. , Bernard, D. , Van Seuningen, I. , Leroy, X. , Perrais, M. , 2009. MUC1, a new hypoxia inducible factor target gene, is an actor in clear renal cell carcinoma tumor progression. Cancer Res.. 69, 5707–5715. [DOI] [PubMed] [Google Scholar]
- Audretsch, C. , Lopez, D. , Srivastava, M. , Wolz, C. , Dandekar, T. , 2013. A semi-quantitative model of Quorum-Sensing in Staphylococcus aureus, approved by microarray meta-analyses and tested by mutation studies. Mol. Biosyst.. [DOI] [PubMed] [Google Scholar]
- Boyanova, D. , Nilla, S. , Birschmann, I. , Dandekar, T. , Dittrich, M. , 2012. PlateletWeb: a systems biologic analysis of signaling networks in human platelets. Blood. 119, e22–34. [DOI] [PubMed] [Google Scholar]
- Bronte, G. , Rizzo, S. , La Paglia, L. , Adamo, V. , Siragusa, S. , Ficorella, C. , Santini, D. , Bazan, V. , Colucci, G. , Gebbia, N. , Russo, A. , 2010. Driver mutations and differential sensitivity to targeted therapies: a new approach to the treatment of lung adenocarcinoma. Cancer Treat Rev.. 36, (Suppl 3) S21–S29. [DOI] [PubMed] [Google Scholar]
- Cheng, T.M. , Gulati, S. , Agius, R. , Bates, P.A. , 2012. Understanding cancer mechanisms through network dynamics. Brief Funct. Genomics. 11, 543–560. [DOI] [PubMed] [Google Scholar]
- Cree, I.A. , Glaysher, S. , Harvey, A.L. , 2010. Efficacy of anti-cancer agents in cell lines versus human primary tumour tissue. Curr. Opin. Pharmacol.. 10, 375–379. [DOI] [PubMed] [Google Scholar]
- Cullen, P.J. , 2007. Signaling mucins: the new kids on the MAPK block. Crit. Rev. Eukaryot. Gene Expr.. 17, 241–257. [DOI] [PubMed] [Google Scholar]
- da Cunha Santos, G. , Shepherd, F.A. , Tsao, M.S. , 2011. EGFR mutations and lung cancer. Annu. Rev. Pathol.. 6, 49–69. [DOI] [PubMed] [Google Scholar]
- Di Cara, A. , Garg, A. , De Micheli, G. , Xenarios, I. , Mendoza, L. , 2007. Dynamic simulation of regulatory networks using SQUAD. BMC Bioinformatics. 8, 462 [DOI] [PMC free article] [PubMed] [Google Scholar]
- Engelman, J.A. , Mukohara, T. , Zejnullahu, K. , Lifshits, E. , Borras, A.M. , Gale, C.M. , Naumov, G.N. , Yeap, B.Y. , Jarrell, E. , Sun, J. , Tracy, S. , Zhao, X. , Heymach, J.V. , Johnson, B.E. , Cantley, L.C. , Janne, P.A. , 2006. Allelic dilution obscures detection of a biologically significant resistance mutation in EGFR-amplified lung cancer. J. Clin. Invest.. 116, 2695–2706. [DOI] [PMC free article] [PubMed] [Google Scholar]
- Engelman, J.A. , Zejnullahu, K. , Mitsudomi, T. , Song, Y. , Hyland, C. , Park, J.O. , Lindeman, N. , Gale, C.M. , Zhao, X. , Christensen, J. , Kosaka, T. , Holmes, A.J. , Rogers, A.M. , Cappuzzo, F. , Mok, T. , Lee, C. , Johnson, B.E. , Cantley, L.C. , Janne, P.A. , 2007. MET amplification leads to gefitinib resistance in lung cancer by activating ERBB3 signaling. Science. 316, 1039–1043. [DOI] [PubMed] [Google Scholar]
- Ferlay, J. , Shin, H.R. , Bray, F. , Forman, D. , Mathers, C. , Parkin, D.M. , 2010. Estimates of worldwide burden of cancer in 2008: GLOBOCAN 2008. Int. J. Cancer. 127, 2893–2917. [DOI] [PubMed] [Google Scholar]
- Gazdar, A.F. , Girard, L. , Lockwood, W.W. , Lam, W.L. , Minna, J.D. , 2010. Lung cancer cell lines as tools for biomedical discovery and research. J. Natl. Cancer Inst.. 102, 1310–1321. [DOI] [PMC free article] [PubMed] [Google Scholar]
- Gill, B.J. , Gibbons, D.L. , Roudsari, L.C. , Saik, J.E. , Rizvi, Z.H. , Roybal, J.D. , Kurie, J.M. , West, J.L. , 2012. A synthetic matrix with independently tunable biochemistry and mechanical properties to study epithelial morphogenesis and EMT in a lung adenocarcinoma model. Cancer Res.. 72, 6013–6023. [DOI] [PMC free article] [PubMed] [Google Scholar]
- Gonzalez-Rodriguez, D. , Guevorkian, K. , Douezan, S. , Brochard-Wyart, F. , 2012. Soft matter models of developing tissues and tumors. Science. 338, 910–917. [DOI] [PubMed] [Google Scholar]
- Haga, Y. , Hiroshima, K. , Iyoda, A. , Shibuya, K. , Shimamura, F. , Iizasa, T. , Fujisawa, T. , Ohwada, H. , 2003. Ki-67 expression and prognosis for smokers with resected stage I non-small cell lung cancer. Ann. Thorac. Surg.. 75, 1727–1732. discussion 1732–1723 [DOI] [PubMed] [Google Scholar]
- Hanahan, D. , Weinberg, R.A. , 2011. Hallmarks of cancer: the next generation. Cell. 144, 646–674. [DOI] [PubMed] [Google Scholar]
- Ho, S.B. , Shekels, L.L. , Toribara, N.W. , Kim, Y.S. , Lyftogt, C. , Cherwitz, D.L. , Niehans, G.A. , 1995. Mucin gene expression in normal, preneoplastic, and neoplastic human gastric epithelium. Cancer Res.. 55, 2681–2690. [PubMed] [Google Scholar]
- Hutmacher, D.W. , Horch, R.E. , Loessner, D. , Rizzi, S. , Sieh, S. , Reichert, J.C. , Clements, J.A. , Beier, J.P. , Arkudas, A. , Bleiziffer, O. , Kneser, U. , 2009. Translating tissue engineering technology platforms into cancer research. J. Cell Mol. Med.. 13, 1417–1427. [DOI] [PMC free article] [PubMed] [Google Scholar]
- Kokubo, Y. , Gemma, A. , Noro, R. , Seike, M. , Kataoka, K. , Matsuda, K. , Okano, T. , Minegishi, Y. , Yoshimura, A. , Shibuya, M. , Kudoh, S. , 2005. Reduction of PTEN protein and loss of epidermal growth factor receptor gene mutation in lung cancer with natural resistance to gefitinib (IRESSA). Br. J. Cancer. 92, 1711–1719. [DOI] [PMC free article] [PubMed] [Google Scholar]
- Lamb, J. , 2007. The connectivity Map: a new tool for biomedical research. Nat. Rev. Cancer. 7, 54–60. [DOI] [PubMed] [Google Scholar]
- Lara-Guerra, H. , Chung, C.T. , Schwock, J. , Pintilie, M. , Hwang, D.M. , Leighl, N.B. , Waddell, T.K. , Tsao, M.S. , 2012. Histopathological and immunohistochemical features associated with clinical response to neoadjuvant gefitinib therapy in early stage non-small cell lung cancer. Lung Cancer. 76, 235–241. [DOI] [PubMed] [Google Scholar]
- Lau, S.K. , Weiss, L.M. , Chu, P.G. , 2004. Differential expression of MUC1, MUC2, and MUC5AC in carcinomas of various sites: an immunohistochemical study. Am. J. Clin. Pathol.. 122, 61–69. [DOI] [PubMed] [Google Scholar]
- Linke, K. , Schanz, J. , Hansmann, J. , Walles, T. , Brunner, H. , Mertsching, H. , 2007. Engineered liver-like tissue on a capillarized matrix for applied research. Tissue Eng.. 13, 2699–2707. [DOI] [PubMed] [Google Scholar]
- Lopez-Ferrer, A. , Curull, V. , Barranco, C. , Garrido, M. , Lloreta, J. , Real, F.X. , de Bolos, C. , 2001. Mucins as differentiation markers in bronchial epithelium. Squamous cell carcinoma and adenocarcinoma display similar expression patterns. Am. J. Respir. Cell Mol. Biol.. 24, 22–29. [DOI] [PubMed] [Google Scholar]
- Lutolf, M.P. , Hubbell, J.A. , 2005. Synthetic biomaterials as instructive extracellular microenvironments for morphogenesis in tissue engineering. Nat. Biotechnol.. 23, 47–55. [DOI] [PubMed] [Google Scholar]
- Mischnik, M. , Boyanova, D. , Hubertus, K. , Geiger, J. , Philippi, N. , Dittrich, M. , Wangorsch, G. , Timmer, J. , Dandekar, T. , 2013. A Boolean view separates platelet activatory and inhibitory signalling as verified by phosphorylation monitoring including threshold behaviour and integrin modulation. Mol. Biosyst.. 9, 1326–1339. [DOI] [PubMed] [Google Scholar]
- Mok, T.S. , Wu, Y.L. , Thongprasert, S. , Yang, C.H. , Chu, D.T. , Saijo, N. , Sunpaweravong, P. , Han, B. , Margono, B. , Ichinose, Y. , Nishiwaki, Y. , Ohe, Y. , Yang, J.J. , Chewaskulyong, B. , Jiang, H. , Duffield, E.L. , Watkins, C.L. , Armour, A.A. , Fukuoka, M. , 2009. Gefitinib or carboplatin-paclitaxel in pulmonary adenocarcinoma. N. Engl. J. Med.. 361, 947–957. [DOI] [PubMed] [Google Scholar]
- Morris, M.K. , Saez-Rodriguez, J. , Sorger, P.K. , Lauffenburger, D.A. , 2010. Logic-based models for the analysis of cell signaling networks. Biochemistry. 49, 3216–3224. [DOI] [PMC free article] [PubMed] [Google Scholar]
- Mukohara, T. , Engelman, J.A. , Hanna, N.H. , Yeap, B.Y. , Kobayashi, S. , Lindeman, N. , Halmos, B. , Pearlberg, J. , Tsuchihashi, Z. , Cantley, L.C. , Tenen, D.G. , Johnson, B.E. , Janne, P.A. , 2005. Differential effects of gefitinib and cetuximab on non-small-cell lung cancers bearing epidermal growth factor receptor mutations. J. Natl. Cancer Inst.. 97, 1185–1194. [DOI] [PubMed] [Google Scholar]
- Nakajima, Y. , Takagi, H. , Kakizaki, S. , Horiguchi, N. , Sato, K. , Sunaga, N. , Mori, M. , 2012. Gefitinib and gemcitabine coordinately inhibited the proliferation of cholangiocarcinoma cells. Anticancer Res.. 32, 5251–5262. [PubMed] [Google Scholar]
- Naseem, M. , Philippi, N. , Hussain, A. , Wangorsch, G. , Ahmed, N. , Dandekar, T. , 2012. Integrated systems view on networking by hormones in Arabidopsis immunity reveals multiple crosstalk for cytokinin. Plant Cell. 24, 1793–1814. [DOI] [PMC free article] [PubMed] [Google Scholar]
- Noro, R. , Gemma, A. , Kosaihira, S. , Kokubo, Y. , Chen, M. , Seike, M. , Kataoka, K. , Matsuda, K. , Okano, T. , Minegishi, Y. , Yoshimura, A. , Kudoh, S. , 2006. Gefitinib (IRESSA) sensitive lung cancer cell lines show phosphorylation of Akt without ligand stimulation. BMC Cancer. 6, 277 [DOI] [PMC free article] [PubMed] [Google Scholar]
- Oda, K. , Matsuoka, Y. , Funahashi, A. , Kitano, H. , 2005. A comprehensive pathway map of epidermal growth factor receptor signaling. Mol. Syst. Biol.. 1, 2005 0010 [DOI] [PMC free article] [PubMed] [Google Scholar]
- Paez, J.G. , Janne, P.A. , Lee, J.C. , Tracy, S. , Greulich, H. , Gabriel, S. , Herman, P. , Kaye, F.J. , Lindeman, N. , Boggon, T.J. , Naoki, K. , Sasaki, H. , Fujii, Y. , Eck, M.J. , Sellers, W.R. , Johnson, B.E. , Meyerson, M. , 2004. EGFR mutations in lung cancer: correlation with clinical response to gefitinib therapy. Science. 304, 1497–1500. [DOI] [PubMed] [Google Scholar]
- Pao, W. , Chmielecki, J. , 2010. Rational, biologically based treatment of EGFR-mutant non-small-cell lung cancer. Nat. Rev. Cancer. 10, 760–774. [DOI] [PMC free article] [PubMed] [Google Scholar]
- Pao, W. , Wang, T.Y. , Riely, G.J. , Miller, V.A. , Pan, Q. , Ladanyi, M. , Zakowski, M.F. , Heelan, R.T. , Kris, M.G. , Varmus, H.E. , 2005. KRAS mutations and primary resistance of lung adenocarcinomas to gefitinib or erlotinib. PLoS Med.. 2, e17 [DOI] [PMC free article] [PubMed] [Google Scholar]
- Paszek, M.J. , Zahir, N. , Johnson, K.R. , Lakins, J.N. , Rozenberg, G.I. , Gefen, A. , Reinhart-King, C.A. , Margulies, S.S. , Dembo, M. , Boettiger, D. , Hammer, D.A. , Weaver, V.M. , 2005. Tensional homeostasis and the malignant phenotype. Cancer Cell. 8, 241–254. [DOI] [PubMed] [Google Scholar]
- Philippi, N. , Walter, D. , Schlatter, R. , Ferreira, K. , Ederer, M. , Sawodny, O. , Timmer, J. , Borner, C. , Dandekar, T. , 2009. Modeling system states in liver cells: survival, apoptosis and their modifications in response to viral infection. BMC Syst. Biol.. 3, 97 [DOI] [PMC free article] [PubMed] [Google Scholar]
- Philippi, N.R. , Bird, C.E. , Marcus, N.J. , Olson, E.B. , Chesler, N.C. , Morgan, B.J. , 2010. Time course of intermittent hypoxia-induced impairments in resistance artery structure and function. Respir. Physiolo. Neurobiol.. 170, 157–163. [DOI] [PMC free article] [PubMed] [Google Scholar]
- Riely, G.J. , Marks, J. , Pao, W. , 2009. KRAS mutations in non-small cell lung cancer. Proc. Am. Thorac. Soc.. 6, 201–205. [DOI] [PubMed] [Google Scholar]
- Saez-Rodriguez, J. , Alexopoulos, L.G. , Zhang, M. , Morris, M.K. , Lauffenburger, D.A. , Sorger, P.K. , 2011. Comparing signaling networks between normal and transformed hepatocytes using discrete logical models. Cancer Res.. 71, 5400–5411. [DOI] [PMC free article] [PubMed] [Google Scholar]
- Schanz, J. , Pusch, J. , Hansmann, J. , Walles, H. , 2010. Vascularised human tissue models: a new approach for the refinement of biomedical research. J. Biotechnol.. 148, 56–63. [DOI] [PubMed] [Google Scholar]
- Schlatter, R. , Philippi, N. , Wangorsch, G. , Pick, R. , Sawodny, O. , Borner, C. , Timmer, J. , Ederer, M. , Dandekar, T. , 2012. Integration of Boolean models exemplified on hepatocyte signal transduction. Brief Bioinformatics. 13, 365–376. [DOI] [PubMed] [Google Scholar]
- Schultheiss, D. , Gabouev, A.I. , Cebotari, S. , Tudorache, I. , Walles, T. , Schlote, N. , Wefer, J. , Kaufmann, P.M. , Haverich, A. , Jonas, U. , Stief, C.G. , Mertsching, H. , 2005. Biological vascularized matrix for bladder tissue engineering: matrix preparation, reseeding technique and short-term implantation in a porcine model. J. Urol.. 173, 276–280. [DOI] [PubMed] [Google Scholar]
- Sequist, L.V. , Heist, R.S. , Shaw, A.T. , Fidias, P. , Rosovsky, R. , Temel, J.S. , Lennes, I.T. , Digumarthy, S. , Waltman, B.A. , Bast, E. , Tammireddy, S. , Morrissey, L. , Muzikansky, A. , Goldberg, S.B. , Gainor, J. , Channick, C.L. , Wain, J.C. , Gaissert, H. , Donahue, D.M. , Muniappan, A. , Wright, C. , Willers, H. , Mathisen, D.J. , Choi, N.C. , Baselga, J. , Lynch, T.J. , Ellisen, L.W. , Mino-Kenudson, M. , Lanuti, M. , Borger, D.R. , Iafrate, A.J. , Engelman, J.A. , Dias-Santagata, D. , 2011. Implementing multiplexed genotyping of non-small-cell lung cancers into routine clinical practice. Ann. Oncol.. 22, 2616–2624. [DOI] [PMC free article] [PubMed] [Google Scholar]
- Singh, A. , Greninger, P. , Rhodes, D. , Koopman, L. , Violette, S. , Bardeesy, N. , Settleman, J. , 2009. A gene expression signature associated with “K-Ras addiction” reveals regulators of EMT and tumor cell survival. Cancer Cell. 15, 489–500. [DOI] [PMC free article] [PubMed] [Google Scholar]
- Smalley, K.S. , Lioni, M. , Herlyn, M. , 2006. Life isn't flat: taking cancer biology to the next dimension. In Vitro Cell Dev. Biol. Anim.. 42, 242–247. [DOI] [PubMed] [Google Scholar]
- Sos, M.L. , Michel, K. , Zander, T. , Weiss, J. , Frommolt, P. , Peifer, M. , Li, D. , Ullrich, R. , Koker, M. , Fischer, F. , Shimamura, T. , Rauh, D. , Mermel, C. , Fischer, S. , Stuckrath, I. , Heynck, S. , Beroukhim, R. , Lin, W. , Winckler, W. , Shah, K. , LaFramboise, T. , Moriarty, W.F. , Hanna, M. , Tolosi, L. , Rahnenfuhrer, J. , Verhaak, R. , Chiang, D. , Getz, G. , Hellmich, M. , Wolf, J. , Girard, L. , Peyton, M. , Weir, B.A. , Chen, T.H. , Greulich, H. , Barretina, J. , Shapiro, G.I. , Garraway, L.A. , Gazdar, A.F. , Minna, J.D. , Meyerson, M. , Wong, K.K. , Thomas, R.K. , 2009. Predicting drug susceptibility of non-small cell lung cancers based on genetic lesions. J. Clin. Invest.. 119, 1727–1740. [DOI] [PMC free article] [PubMed] [Google Scholar]
- Tian, M. , Schiemann, W.P. , 2009. The TGF-beta paradox in human cancer: an update. Future Oncol.. 5, 259–271. [DOI] [PMC free article] [PubMed] [Google Scholar]
- Tsvetkova, E. , Goss, G.D. , 2012. Drug resistance and its significance for treatment decisions in non-small-cell lung cancer. Curr. Oncol.. 19, S45–S51. [DOI] [PMC free article] [PubMed] [Google Scholar]
- Tursz, T. , Andre, F. , Lazar, V. , Lacroix, L. , Soria, J.C. , 2011. Implications of personalized medicine–perspective from a cancer center. Nat. Rev. Clin. Oncol.. 8, 177–183. [DOI] [PubMed] [Google Scholar]
- Ventura, A.C. , Jackson, T.L. , Merajver, S.D. , 2009. On the role of cell signaling models in cancer research. Cancer Res.. 69, 400–402. [DOI] [PMC free article] [PubMed] [Google Scholar]
- Walles, T. , Weimer, M. , Linke, K. , Michaelis, J. , Mertsching, H. , 2007. The potential of bioartificial tissues in oncology research and treatment. Onkologie. 30, 388–394. [DOI] [PubMed] [Google Scholar]
- Wangorsch, G. , Butt, E. , Mark, R. , Hubertus, K. , Geiger, J. , Dandekar, T. , Dittrich, M. , 2011. Time-resolved in silico modeling of fine-tuned cAMP signaling in platelets: feedback loops, titrated phosphorylations and pharmacological modulation. BMC Syst. Biol.. 5, 178 [DOI] [PMC free article] [PubMed] [Google Scholar]
- Wu, V.W. , Tam, K.W. , Tong, S.M. , 2013. Evaluation of the influence of tumor location and size on the difference of dose calculation between ray tracing algorithm and Fast Monte Carlo algorithm in stereotactic body radiotherapy of non-small cell lung cancer using CyberKnife. J. Appl. Clin. Med. Phys.. 14, 4280 [DOI] [PMC free article] [PubMed] [Google Scholar]
- Yamada, K.M. , Cukierman, E. , 2007. Modeling tissue morphogenesis and cancer in 3D. Cell. 130, 601–610. [DOI] [PubMed] [Google Scholar]
- Zhang, R. , Shah, M.V. , Yang, J. , Nyland, S.B. , Liu, X. , Yun, J.K. , Albert, R. , Loughran, T.P. , 2008. Network model of survival signaling in large granular lymphocyte leukemia. Proc. Natl. Acad. Sci. U S A. 105, 16308–16313. [DOI] [PMC free article] [PubMed] [Google Scholar]
Associated Data
This section collects any data citations, data availability statements, or supplementary materials included in this article.
Supplementary Materials
The following are the supplementary data related to this article:
Supplementary Figure S1In silico modeling of gefitinib response in A549 cells bearing a Kras mutation. Dynamic model simulation of different nodes (assuming constantly hyperactive Kras at 0.4) of the signaling network (Figure 4A) using SQUAD. (A) An activating signal of the EGFR (value: 0.3; EGF approximately 0.4, not strong, wild type) evokes a moderate proliferative (0.2) and apoptotic (0.2) signal over time. (B) Upon gefitinib inhibition, the activation of EGFR diminishes to 0.03. The resulting simulation of selected nodes shows no response to gefitinib regarding apoptosis (0.2) and proliferation (0.2) over time compared to the untreated condition in A.
Supplementary Figure S2TGFβ stimulation. Dynamic model simulation of different nodes of the signaling network (Figure 4A) using SQUAD. TGFβ‐receptor stimulation (initial value of TGFβ: 1.0), results in EMT signaling (0.9, nearly maximal), the activity of several other network nodes is shown in the cell‐type specific context and activation state of HCC827 cells.
Part II: 3D tumor tissue model.
Supplementary Figure S3Gefitinib effects on HCC827 in the 3D tumor tissue model. In 3D conditions the EGFR activation is reduced and apoptosis is induced in HCC827 by gefitinib. Immunohistochemical stainings of 3D tumor tissue models show weak signals for the EGFR in A549 (A, B) with no obvious phosphorylation (E, F). In HCC827 the EGFR could be clearly detected (C, D) and its activation was reduced by gefitinib treatment (G, H). These results could be confirmed by western blot analysis (I, J). Apoptosis was not induced in A549 (K, L) but in HCC827 (M, N) by gefitinib as seen by TUNEL‐assay.
Supplementary data