

Abstract
The NTRK1 gene encodes Tropomyosin‐related kinase A (TRKA), the high‐affinity Nerve Growth Factor Receptor. NTRK1 was originally isolated from a colorectal carcinoma (CRC) sample as component of a somatic rearrangement (TPM3‐NTRK1) resulting in expression of the oncogenic chimeric protein TPM3‐TRKA, but there has been no subsequent report regarding the relevance of this oncogene in CRC. The KM12 human CRC cell line expresses the chimeric TPM3‐TRKA protein and is hypersensitive to TRKA kinase inhibition. We report the detailed characterization of the TPM3‐NTRK1 genomic rearrangement in KM12 cells and through a cellular screening approach, the identification of NMS‐P626, a novel highly potent and selective TRKA inhibitor. NMS‐P626 suppressed TPM3‐TRKA phosphorylation and downstream signaling in KM12 cells and showed remarkable antitumor activity in mice bearing KM12 tumors.
Finally, using quantitative reverse transcriptase PCR and immunohistochemistry (IHC) we identified the TPM3‐NTRK1 rearrangement in a CRC clinical sample, therefore suggesting that this chromosomal translocation is indeed a low frequency recurring event in CRC and that such patients might benefit from therapy with TRKA kinase inhibitors.
Keywords: TPM3‐NTRK1 rearrangement, TRKA, Kinase inhibitor, NMS‐P626, Colorectal cancer
Highlights
We report that the TPM3‐NTRK1 rearrangement is a low‐frequency recurring event in CRC.
A validated IHC method for the identification of TRKA‐positive patients is provided.
Pharmacological inhibition of TRKA is proposed as a novel therapeutic strategy for CRC.
1. Introduction
The Neurotrophic Tyrosine Kinase Receptor 1 gene (NTRK1) encodes the TRKA receptor tyrosine kinase, the high affinity receptor for Nerve Growth Factor (NGF). TRKA is a member of the neurotrophin receptor family of receptor tyrosine kinases that also includes TRKB and TRKC (encoded by the NTRK2 and NTRK3 genes respectively), receptors for Brain‐derived Neurotrophic Factor (BDNF) and neurotrophin 3 (NT3) (Levi‐Montalcini, 1995, 1991, 1991, 1987). During embryogenesis, TRKA expression is critical for development and maturation of the central and peripheral nervous systems. In adults it is expressed in basal forebrain where it plays a role in memory processes, and in sympathetic and sensory neurons, where it is implicated in pain and temperature sensing (Snider, 1994; Greco et al., 1999; Indo, 2012). In normal tissues TRKA undergoes physiological activation through NGF‐mediated dimerization, which induces autophosphorylation of specific tyrosine residues and transphosphorylation of a series of substrates, leading to activation of the PI3K/AKT, Ras/MAPK and PLC‐γ pathways (Kaplan and Miller, 1997, 2000).
Genetic alterations of the NTRK1 gene, including translocations, amplifications, deletions and point mutations, have been observed in different tumor types, suggesting a potential role for TRKA in oncogenesis. In fact, the NTRK1 gene was originally identified as a component of a chimeric fusion oncogene in a functional transformation screen performed with a cDNA library derived from a colorectal cancer biopsy (Martin‐Zanca et al., 1986). The “TPM3‐TRK” oncogene identified in that screen was the result of an intrachromosomal rearrangement at 1q22‐23 leading to the fusion of the tropomyosin 3 gene (TPM3) with a sequence encoding the transmembrane and intracellular domains of a putative novel transmembrane tyrosine kinase, TRK (tropomyosin receptor kinase). The entire NTRK1 gene, encompassing also the extracellular domain, was subsequently cloned and found to encode a high affinity NGF receptor (Kaplan et al., 1991b).
Several chromosomal rearrangements involving the NTRK1 gene were subsequently described in human papillary thyroid carcinoma (PTC). Besides the TPM3‐TRK oncogene described above, the TRK‐T1 and TRK‐T2 oncogenes were reported, in which chimeric proteins containing activated TRK kinase are produced as a result of gene fusion with different portions of the Translocated Promoter Region (TPR) gene on chromosome 1q25, as well as the TRK‐T3 oncogene, activated by fusion with TRK Fused Gene (TFG) on chromosome 3q11‐12 (Greco et al., 1992; Greco et al., 1997). The frequency of NTRK1 rearrangements in PTC is around 12%, with the TPM3‐NTRK1 fusion (as we now better know it) being the most common event (Greco et al., 2010).
Very recently, large scale sequencing of 36 ‘pan‐negative’ (i.e. wild‐type for EGFR, KRAS, ALK, and ROS1) lung adenocarcinoma tumor samples led to the identification by Doebele and colleagues of the novel MPRIP‐NTRK1 and CD74‐NTRK1 gene fusions in NSCLC (Vaishnavi et al., 2013). Expression of either of these predicted chimeric proteins in NIH‐3T3 murine fibroblasts and Ba/F3 cells induced transformed growth and sensitivity to TRKA kinase inhibition, indicating a role for TRKA as a driver oncogene in a small subset of NSCLC.
In a rapidly evolving landscape, recent months have seen the identification from large scale sequencing efforts of further NTRK1 chromosomal rearrangements in additional tumor types, including Spitz tumors, intrahepatic cholangiocarcinoma, glioblastoma and pediatric high grade glioma (Wiesner et al., 2014; Ross et al., 2014; Kim et al., 2014; Wu et al., 2014), suggesting that oncogenic rearrangement of this gene might occur at low frequency across many cancer types.
Despite the fact that NTRK1 was originally identified as a component of the TPM3‐NTRK1 oncogene in a CRC sample, there was no significant follow up in this tumor type.
We originally described (Ardini et al., 2010) the expression of a TPM3‐TRKA chimeric protein, consistent with the presence of the TPM3‐NTRK1 rearrangement in the KM12 cell line, which is derived from a primary colon carcinoma tumor biopsy (Morikawa et al., 1988) and preliminarily described the sensitivity of these cells to TRKA inhibition.
Here we describe detailed and complete characterization of the genomic TPM3‐NTRK1 rearrangement present in the KM12 cell line and disclose for the first time the structure of NMS‐P626, a potent and selective TRKA inhibitor. Oral treatment with NMS‐P626 potently blocks the growth of KM12 tumor xenografts in nude mice, prompting our investigation of NTRK1 gene rearrangements in the clinical setting of CRC, the second leading cause of oncology deaths in western countries.
For this purpose, we set up and validated an immunohistochemistry (IHC) method for identification of TRKA positive clinical specimens, choosing this type of assay because of its immediate and broad applicability for detection of NTRK1 rearrangements in different tumor types. We thus identified the TPM3‐NTRK1 rearrangement in 1 out of 66 examined colorectal carcinoma biopsy specimens.
Our findings suggest that NTRK1 rearrangement, leading to expression of fusion proteins with constitutively activated forms of TRKA, is a low frequency but recurring event in CRC and that TRKA kinase inhibition may represent an innovative therapy for cancer patients whose tumors harbor NTRK1 rearrangements.
2. Material and methods
2.1. Compound
NMS‐P626, N‐[5‐(3,5‐difluoro‐benzenesulfonyl)‐4,5,6,7‐tetrahydro‐1H‐pyrazolo[4,3‐c]pyridin‐3‐yl]‐2‐((R)‐2‐methoxy‐1‐methyl‐ethylamino)‐4‐(4‐methyl‐piperazin‐1‐yl)‐benzamide, was synthesized at Nerviano Medical Sciences S.r.l. The compound was synthesized as previously reported (WO2007/068619).
2.2. Cell culture
Human cancer cell lines were obtained from ATCC (AU‐565, COLO‐205, G‐361, HCT‐116, HCT15, HPAC, HT‐29, KU812, LoVo, Malme‐3M, MCF7, MDA‐MB‐436, MDA‐MB‐468, Mewo, NCI‐H2087, NCI–H2228, NCI–H929, PANC‐1, SK‐MEL‐2, SK‐MEL‐3, SK‐MEL‐5, SK‐N‐SH, SW48, TF‐1, TF‐1a, TT, U‐138MG, WM‐115), from DSMZ (697, CAL‐148, CAL‐51, CAPAN‐1, CL‐11, COLO‐320, COLO 800, DLD‐1, EVSA‐T, GRANTA‐519, HCC‐78, HEL, IGR‐39, Jurkat, KARPAS‐299, MEC‐1, OPM‐2, RPMI‐7951, RS4‐11, SH‐SY5Y, SKM‐1, SK‐N‐MC, SW480, THP‐1), from ECACC (A2780, A375, BxPC‐3, HuP‐T3, K‐562, MDA‐MB‐231, MIA‐PaCa‐2, PSN1, RPMI‐8226, U‐937), from Interlab Cell Line Collection (ICLC) (COLO‐741, IST‐MEL1, IST‐MEL2, SW1417), from Istituto Nazionale Tumori of Milan (KMS‐11, MZ‐CRC‐1, TPC1) and from NCI (KM12, LOX IMVI, M14, MDA‐MB‐435, SF539, SK‐MEL‐28, U251, UACC‐257, UACC‐62). Cells were maintained in the media recommended by the suppliers, in a humidified 37 °C incubator with 5% CO2. The identity of all cell lines used in this study was verified using DNA fingerprinting technology (AmpFlSTR Identifiler Plus PCR Amplification kit, Applied Biosystems) (Somaschini et al., 2013).
2.3. Kinase biochemical profiling
Evaluation of the selectivity of inhibitors (IC50s) against a panel of kinases was performed using a radiometric assay format as previously described (Beria et al., 2011). All assays were performed in house, with the exception of TRKB and TRKC, for which IC50s were extrapolated from percentage inhibition values at 10 and 100 nM of inhibitor in duplicate obtained from Invitrogen, using the equation: IC50 extrap = ([I] * 100/% inhibition)‐ [I], with the assumption that Hill Slope = 1. The IC50 reported in Table S1 is the average of the IC50s calculated at each concentration.
2.4. Plasmids
To generate the TRK kinases fused to the human ETV6/TEL partner, a plasmid based on a pcDNA3.1 DEST backbone was constructed that allowed rapid in‐frame cloning of the TRK kinase domains downstream of a Tel cassette using a Gateway system.
The TEL‐TRK constructs obtained were the result of the 336 NH2‐residues of TEL fused to the amino acid residues of TRKA (440–796), TRKB (455–822) and TRKC (454–825).
2.5. Generation of TRK‐driven Ba/F3 cell lines
The murine pro‐B cell line Ba/F3, which is normally dependent on interleukin‐3 (IL‐3), but can be rendered IL‐3 independent by transfection with oncogenic kinases (Daley and Baltimore, 1988) was grown in RPMI 1640 medium containing 10% fetal bovine serum and 10 ng/ml IL‐3.
The pcDNA expression vectors containing TRKA, TRKB and TRKC were introduced into the Ba/F3 cells by electroporation (Amaxa Nucleofector II Device). Stable strains of IL‐3 independent Ba/F3 cells were established by post‐transfection selection of cells for two weeks with 800 μg/ml G418 (Enzo Life Sciences) and subsequent growth in medium lacking IL‐3.
2.6. Cell proliferation analysis
To evaluate the antiproliferative activity of test compounds, cells were seeded in 384‐well plates with appropriate complete medium. Twenty‐four hours after seeding, medium was replaced with medium containing serial dilutions of test compound and incubated for an additional 72 h. All media contained a final DMSO concentration of 0.1% (v/v). Cell viability was assessed using the CellTiter‐Glo luciferase‐based ATP detection assay (Promega) following manufacturer's instructions. CellTiter‐Glo is a homogeneous assay method based on the quantification of ATP present, an indicator of the number of metabolically active cells. Growth inhibitory activity was evaluated at the end of incubation, comparing data for treated versus control samples, using Accelrys® Assay Explorer software. IC50 values were calculated using sigmoidal interpolation curve fitting.
2.7. Clinical tumor samples
The tumor samples used in this study consisted of Formalin‐Fixed Paraffin‐Embedded (FFPE) patient surgical specimens with histological diagnosis of colorectal adenocarcinoma. Written informed consent for sample collection and subsequent histological and molecular analysis was obtained in all cases.
2.8. DNA extraction
Genomic DNA was isolated from cell lines using the NucleoSpin Tissue kit (Macherey–Nagel, Düren, Germany), according to manufacturer's instructions.
DNA yield and purity was evaluated by measurement of UV absorption at 280 nm and analysis of the 260/280 ratio using a Nanodrop 1000 Spectrophotometer (Thermo Scientific, Waltham, Massachusetts, USA).
2.9. RNA extraction
RNA was extracted from tumor cell lines using the RNeasy Mini Kit (Qiagen, Venlo, Netherlands); RNA from FFPE clinical samples was extracted from 8 μm slices with the RecoverAll™ Total Nucleic Acid Isolation Kit for FFPE (Ambion/Life Technologies, Carlsbad, CA) after tumor area selection (>70% tumor) and deparaffinization with xylene and absolute alcohol. RNA yield and purity were evaluated by measurement of UV absorption at 280 nm and analysis of the 260/280 ratio using a Nanodrop 1000 Spectrophotometer (Thermo Scientific, Waltham, Massachusetts, USA).
RNA was reverse transcribed to complementary DNA (cDNA) using TaqMan Reverse Transcription Reagents (Invitrogen/Life Technologies, Paisley, UK) and random hexamer priming, according to manufacturer's instructions.
2.10. PCR analysis and sequencing
Primers for PCR and sequencing were designed using the freely available Primer3 software package (http://www.broadinstitute.org/genome_software/other/primer3.html) and synthesized using an Applied Biosystems 3900 Synthesizer.
End‐point PCR reactions for characterization of TPM3‐NTRK1 rearrangement were performed in a total reaction volume of 50 μl containing 1X AmpliTaq Gold 360 Master Mix (Life Technologies, Paisley, UK), 1 μM of each primer and 50 ng (KM12 cell line) or 100 ng (clinical sample) of cDNA template, using the primer couples and the conditions reported in Table S3. PCR reactions were run in a GeneAmp PCR System 9700 Thermocycler (Life Technologies, Paisley, UK).
For direct sequencing, the PCR product obtained from the KM12 cell line DNA using the “chimeric” TPM3‐TRKA primer pair was electrophoresed in agarose gel, then purified using NucleoSpin Gel and PCR clean‐up (Macherey–Nagel, Düren, Germany), according to the manufacturer's protocol, and subjected to Sanger sequencing with an ABI Prism 3100 Genetic Analyzer instrument (Applied Biosystems), using the same primers utilized for PCR amplifications.
The TPM3‐NTRK1 PCR product from the T27 clinical sample was electrophoresed in an agarose gel and subsequently cloned into the pCR 2.1 vector using the TOPO TA cloning kit (Life Technologies, Paisley, UK), according to the manufacturer's protocol, prior to Sanger sequencing analysis using M13 universal primers.
End‐point PCR reactions for the identification of the genomic breakpoints in the KM12 cell line and characterization of the zygosity status of the rearrangement were performed in a total reaction volume of 50 μl containing 1X GoTaq Long PCR Master Mix (Promega, Madison, WI, USA), 1 μM of each primer and 500 ng of genomic DNA template and the conditions reported in Table S3. The band encompassing the genomic breakpoint region was purified by agarose gel electrophoresis and recovered as described above and then subjected to Sanger sequencing.
Characterization of KRAS and BRAF mutational status in the KM12 cell line was performed in a total reaction volume of 50 μl containing 1X AmpliTaq Gold 360 Master Mix (Life Technologies, Paisley, UK), 1 μM each primer and 100 ng of genomic DNA template using primer couples and conditions reported in Table S3. PCR products were purified by agarose gel electrophoresis and recovered as described above and then subjected to Sanger sequencing.
KRAS, NRAS, BRAF and PI3KCA mutational status of T27 tumor sample was determined by Sanger sequencing.
Real Time quantitative PCR (RT‐qPCR) was carried out on a ABI Prism 7900HT Applied Biosystems Sequence Detector (Life Technologies) using SYBR Green technology, with reagents and materials from Applied Biosystems/Life Technologies (Power SYBR® Green PCR Master Mix), according to manufacturer's instructions, in a volume of 12.5 μl per reaction, each containing approximately 5–10 ng cDNA (diluted in TE buffer 1x), 300 nM primers for the different gene target regions as described in Table S4 and for 4 endogenous reference control genes (ACTB, GUSB, PPIA, 18S rRNA). Each sample was assayed in duplicate for every indicated target and for all reference controls. Expression levels were quantified following the manufacturer‐suggested ΔΔCt method [Livak, Applied Biosystems Sequence Detector User Bulletin 2, https://www2.appliedbiosystems.com].
2.11. Immunoprecipitation and western blotting analysis
Cells were washed twice with ice‐cold phosphate buffered saline (PBS) and lysed in buffer containing 50 mM Tris–HCl pH 7.5, 150 mM NaCl, 1% Triton‐X‐100, 10 mM EDTA, 1 mM DTT, 1 mM sodium orthovanadate, protease and phosphatase inhibitor cocktails (Sigma). TPM3‐TRKA was immunoprecipitated from 1 mg of cell lysate proteins using a rabbit polyclonal antibody directed against the C‐terminal domain of TRKA (Calbiochem). Immune complexes were recovered with protein A Sepharose and eluted with SDS‐PAGE loading buffer.
Cellular mechanism of action of NMS‐P626 was investigated by treating KM12 cells with the compound at 10, 50 and 250 nM for 2 h at 37 °C. Whole‐cell extracts were obtained by lysing cells in a buffer containing 100 mM Tris–HCl pH 7.4, 2% SDS, 1 mM DTT, 1 mM sodium orthovanadate and 1 mM EDTA. Cell lysates were immediately boiled for 10 min, briefly sonicated, clarified by centrifugation and analyzed for protein content (BCA Protein Assay Kit, Pierce).
Immunoprecipitates and total cell extracts (20 μg per lane) were separated by SDS‐PAGE using Criterion‐XT 10% Bis‐Tris precasted gels with MOPS‐SDS running buffer (Bio‐Rad). Immunoblotting was run according to standard procedures and staining performed with the following antibodies: TRKA from Calbiochem and Santacruz, TPM3 from Sigma, Phospho‐TRKA‐Tyr490 from Calbiochem, while Phospho‐PLC‐γ‐Tyr783, PLC‐γ, AKT, Phospho‐AKT‐Ser473, p42/44 ERK and Phospho‐p42/44 ERK‐Thr202/Tyr204 were from Cell Signaling.
2.12. Efficacy studies and ex‐vivo target modulation analysis
All procedures adopted for housing and handling of animals were in strict compliance with Italian and European guidelines for Laboratory Animal Welfare. A total of 5 × 10⁶ KM12 cells/animal were inoculated subcutaneously into the flanks of nu/nu mice (Harlan). Mice subsequently bearing a minimal tumor mass in the range of 180–200 mm2 were randomized into vehicle and treated in groups of 7 animals/group. NMS‐P626 was dissolved at the appropriate dose in water containing 0.5% (w/v) Methocel suspension and administered by oral gavage. Treatment started the day after randomization, with different schedules as reported. Tumor dimensions were measured regularly using Vernier calipers and tumor volume was calculated according to the following formula: length (mm) × width2 (mm2)/2. The percentage of tumor growth inhibition (% TGI) was calculated as follows:
For ex‐vivo target modulation analysis, animals bearing established KM12 xenograft tumors were treated with a single orally administered dose and sacrificed at six and 12 h following treatment. Tumor samples were excised and immediately stored at −80 °C until analyzed. The frozen samples were homogenized using an Ultra Turrex T25 potter (Janke & Kunkel) at a 5:1 ratio (v/w) in RIPA buffer (50 mM Tris–HCl pH 7.4, 150 mM NaCl, 1% NP‐40, 0.5% Deoxycholate, 0.1% SDS) supplemented with 10 mM EDTA, protease and phosphatase inhibitor cocktails (Sigma). Following homogenization, lysates were centrifuged at 15,000 ×g for 15′ at 4 °C following which the resulting supernatants were assayed for total protein content, and used for SDS‐PAGE and Western blotting analysis.
2.13. Immunohistochemistry
TrkA protein expression was assessed in cell lines and paraffin‐embedded tumor tissue sections using a rabbit monoclonal antibody (clone EP1058Y; Epitomics, Burlingame, CA) that recognizes the carboxy‐terminus of the protein. Immunohistochemical detection was performed on automated BenchMark Ultra platform (Ventana Medical Systems, Tucson, AZ) using Ultra View Universal Alkaline Phosphatase Red Detection Kit (Ventana), according to manufacturer's instructions, and with a 1:200 dilution of anti‐TRKA primary antibody. TRKA protein expression in the KM12 cell line, which carries the TPM3‐TRKA rearrangement, was used as positive control. The HT‐29 cell line, which does not express TRKA, as well as healthy colon tissue samples were used as negative controls.
3. Results
3.1. KM12 cells are hypersensitive to NMS‐P626, a small molecule inhibitor of TRKA kinase
The Nerviano Medical Sciences (NMS) chemical collection includes a dedicated Purine Targeted Library (PTL) of ca. 70,000 compounds, intrinsically designed to be suitable ligands for purine binding pockets, such as the ATP binding pocket found in kinases (Felder et al., 2012). In order to characterize these compounds, we developed the Kinase Selectivity Screen (KSS), a panel of biochemical assays used internally to generate IC50 kinase inhibition data for selectivity profiling of NMS compounds. KSS data, because of high diversity and broad overall coverage of kinase subfamilies, allow a good assessment of inhibitor selectivity, comparable to larger panels (Felder et al., 2012).
In the course of testing sub‐libraries of the PTL against panels of human tumor cell lines, we observed a striking correlation between their antiproliferative activity on KM12 cells and high biochemical potency against TRKA (Fig. S1). In fact, all compounds with a biochemical activity <50 nM on TRKA showed a KM12 cell proliferation IC50 < 500 nM, and conversely, all compounds which were active against KM12 cells were potent TRKA inhibitors, with the exception of a few Aurora and Plk cell cycle kinase inhibitors that are very active on most cell lines tested. Among the compounds tested, NMS‐P626 (Figure 1A), a pyrazolo‐pyridine which inhibits TRKA with an IC50 of 8 nM and which has favorable pharmacokinetic properties, was selected for further characterization. NMS‐P626 also inhibits the closely related TRKB and TRKC kinases, with IC50s of 7 nM and 3 nM respectively. The cellular activity of NMS‐P626 on the TRK family members was confirmed by its strong antiproliferative activity against Ba/F3 cell lines engineered to be dependent on TRKA, TRKB or TRKC expression for IL3‐independent survival, with respective IC50 values of 29 nM, 28 nM and 62 nM and high selectivity towards the parental Ba/F3 cell line (IC50 > 10 μM).
Figure 1.
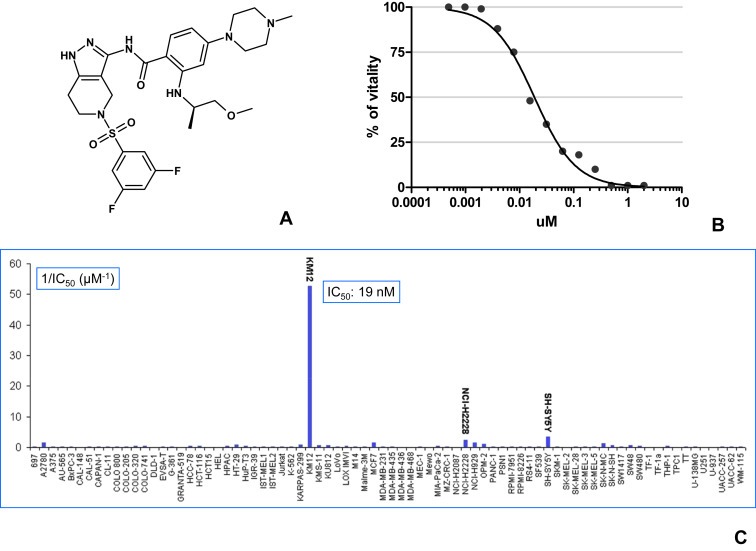
NMS‐P626: Chemical structure and cellular activity A) Chemical structure of NMS‐P626, B) IC50 determination of NMS‐P626 activity against KM12 cell line, C) Antiproliferative activity of NMS‐P626 on a panel of 78 tumor cell lines, expressed as 1/IC50 in micromoles/liter (μM−1).
Profiling using the KSS panel showed an IC50 > 500 nM for all the kinases tested with the exception of IGF‐1R, ACK and IR, for which an IC50 activity of 38, 92 and 244 nM was observed, respectively (Table S1). There is absolutely no correlation between inhibition of these kinases and KM12 sensitivity and these cross reactivities are only seldom observed among the inhibitors active on KM12 (Fig. S1).
NMS‐P626 possesses potent antiproliferative activity against KM12 cells, with an IC50 of 19 nM (Figure 1B, C and Table S2) and high selectivity, as confirmed by testing against a panel of 78 tumor cell lines of diverse tissue origin. Against this panel, NMS‐P626 exhibited only modest activity against the SH‐SY5Y neuroblastoma line (IC50 = 291 nM) and the NCI–H2228 Non Small Cell Lung Cancer (NSLC) cell line (IC50 = 433 nM) and very low, or no activity against the remaining 75 tested cell lines.
3.2. Genetic characterization of the TPM3‐NTRK1 rearrangement in KM12 cells
While NTRK1 mRNA is not normally present in colorectal tissue, the TPM3 promoter presumably drives ectopic expression of the TPM3‐NTRK1 oncogene. Therefore, we performed PCR analysis using separate pairs of primers specific for either extracellular or intracellular regions of the receptor on cDNA samples prepared from KM12 and K‐562 cells. By comparison with K‐562 cells, which express full‐length NTRK1, this analysis showed that KM12 cells selectively express mRNA encoding the cytoplasmic domain, but not the extracellular domain of TRKA (Figure 2A, panel a and panel b). Additionally, PCR primer pairs which straddle the predicted junction in the chimeric TPM3‐NTRK1 cDNA selectively amplified a band in KM12, but not in K‐562 cells, while primers corresponding to wild‐type TPM3 gave amplification products in both cell lines (Figure 2A, panel c and panel d). These results further supported our hypothesis that KM12 cells harbor a TPM3‐NTRK1 gene rearrangement. Direct DNA sequencing of the PCR product obtained using the “chimeric” primer pair 3F/R (Table S3) confirmed the junction sequence expected from previous descriptions of the TPM3‐NTRK1 rearrangement, predicting a fusion protein of the N‐terminal domain of TPM3 (codons 1‐221) with the C‐terminal portion of TRKA comprising the transmembrain domain and the entire tyrosine kinase domain (codons 419‐end) (Fig. S2A). In addition to the expected band of 163 bp, we reproducibly observed a band of ∼200 bp as a minor product of the chimeric primer PCR reaction (Figure 2A, panel c) which was sequenced and found to encode an alternative exon splicing form which cannot result in TRKA protein synthesis due to a frame‐shift which introduces a premature stop codon (Fig. S2B).
Figure 2.
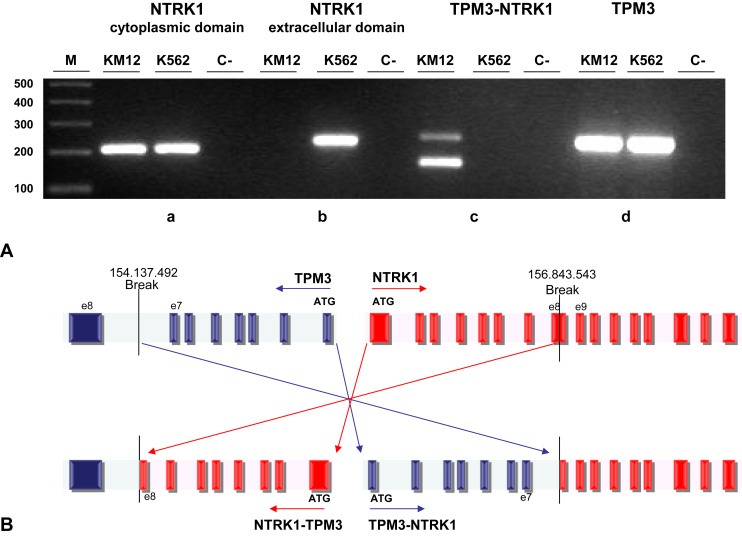
Genomic characterization of TPM3‐NTRK1 fusion in KM12 cell line A) End‐point PCR was performed on cDNA from KM12 cells with F/R primer couples designed to amplify regions in a) 1F/R: NTRK1 cytoplasmic domain, b) 2F/R: NTRK1 extracellular domain, c) 3F/R: TPM3‐NTRK1 rearrangement, d) 4F/R: TPM3 extracellular domain. See Supplementary Table S3 and Supplementary Figure S2 for primers sequence and position. B) Schematic representation of TPM3‐NTRK1 genomic DNA breakpoints in the KM12 cell line. The position of the breakpoints leading to the TPM3‐NTRK1 rearrangement is indicated with respect to genome reference hg19 version. Dark boxes: exons. Light boxes: introns. Striped box: alternative splicing exon in the TPM3 sequence.
The TPM3‐NTRK1 rearrangement first reported in literature (Martin‐Zanca et al., 1986) results from an inversion on the long arm of Chromosome 1 at the juxtaposition of the TPM3 gene located on chromosome 1q22‐23 and the NTRK1 gene located on chr1q21‐22.
In order to characterize the rearrangement event in the KM12 cell line and map its breakpoints, a long extension PCR was performed on genomic DNA using a primer set across TPM3 exon 7 and NTRK1 exon 9. Direct DNA sequence analysis of the resulting 6293 bp PCR product allowed identification of the TPM3 breakpoint in the intronic region between exons 7 and 8, while the NTRK1 breakpoint was located within exon 8, as schematically shown in Figure 2B. We next performed PCR on genomic DNA from KM12 and K‐562 cell lines using a primer pair for wild‐type NTRK1 which straddles the predicted breakpoint (Fig. S3) and in both cases we were able to amplify a WT genomic region of 9865 bp spanning from exon 4 to exon 9 of NTRK1, confirming the presence in the KM12 of the germline allele and thus showing that the TPM3‐NTRK1 rearrangement is present in heterozygosity, as described for the known rearrangement in a colorectal cancer specimen (Martin‐Zanca et al., 1986).
Finally, we also performed PCR/DNA sequencing on KM12 genomic DNA to determine the mutational status of KRAS (codons 12 and 13) and BRAF (V600) and found both to be wild‐type.
3.3. NMS‐P626 inhibits TPM3‐TRKA‐dependent cell proliferation and induces apoptosis in KM12 cells
We characterized the ability of NMS‐P626 to inhibit TRKA kinase activity and downstream signaling in the KM12 cells.
As already described (Ardini et al., 2010), Western Blot analysis performed on KM12 cell lysates with an antibody directed against the C‐terminus of TRKA evidenced the presence of a protein with an MW of ca. 70 kDa, consistent with the presence of a highly expressed, N‐terminally truncated form of TRKA (Fig. S4). Western blot analysis with anti‐TPM3 antibodies of pull‐down immunoprecipitates from KM12 using anti‐TRKA antibody revealed that the 70 kDa protein is strongly recognized, confirming the expression in these cells of a TPM3‐TRKA chimeric protein (Figure 3A).
Figure 3.
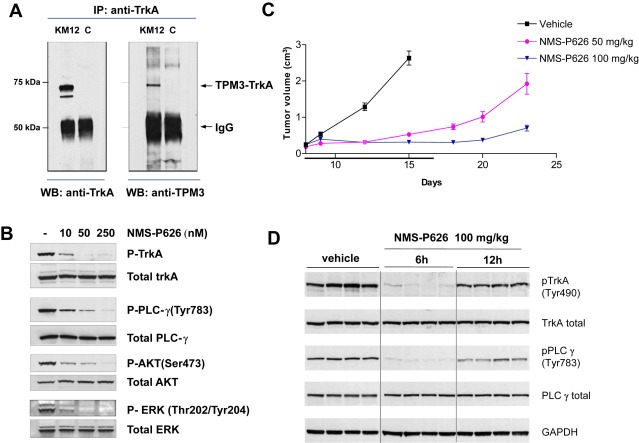
Characterization by Western Blot analysis of the TPM3‐TRKA fusion protein and in vitro and in vivo mechanism of action of NMS‐P626 in the KM12 tumor model A) Anti‐TRKA‐immunoprecipitated proteins were subjected to Western Blot analysis using anti‐TRKA antibody (left panel) or anti‐TPM3 antibody (right panel). KM12: total cell lysates, C: control lane (lysis buffer), B) In vitro inhibition of TRKA phosphorylation and downstream signaling pathways in KM12 cells. Cells were treated for 2 h with increasing concentrations of NMS‐P626 and total protein lysates were analyzed by Western Blot with the indicated Ab, C) In vivo efficacy of NMS‐P626 in KM12 xenograft model. Nu/Nu mice bearing established KM12 xenografts were administered NMS‐P626 per os bid at the indicated doses or vehicle for 10 consecutive days, D) Ex‐vivo target modulation analysis. Nu/Nu mice bearing established KM12 xenografts were administered a single dose of 100 mg/kg NMS‐P626 per os and animals were sacrificed 6 h or 12 h after treatment. Tumors were resected, snap frozen and protein lysates were analyzed by Western Blot with the indicated Ab.
Confocal fluorescent microscopy analysis using anti‐TRKA antibodies showed that TRKA immunoreactivity, rather than being located at the cell surface, as expected for the full‐length receptor, was confined to the cytoplasm of KM12 cells (Fig. S5).
To analyze the effects of KM12 treatment with NMS‐P626, cells were treated for 2 h with increasing doses of the compound, followed by cell lysis and Western Blot analysis for phospho‐TRKA (Tyr490), a major autophosphorylation site of TRKA, as well as for phosphorylated forms of PLCγ, AKT and ERK1/2, known transducers of TRKA signaling (Stephens et al., 1994; Cunningham et al., 1997; Ulrich et al., 1998). As shown in Figure 3B, in untreated KM12 cells, TPM3‐TRKA protein is present in highly phosphorylated form. Treatment with NMS‐P626 for 2 h at a concentration as low as 10 nM is sufficient to almost completely suppress autophosphorylation of TPM3‐TRKA, as well as phosphorylation of its substrates/downstream transducers PLCγ, AKT and ERK. This concentration is consistent with the antiproliferative activity of NMS‐P626 in KM12 (IC50 19 nM).
Cell cycle analysis of KM12 at 24 h of treatment showed that treatment with NMS‐P626 leads to an increase in the proportion of cells in G1 phase, with a concomitant decrease in S phase. An increase in the number of apoptotic cells, i.e. cells with a DNA content <2 N, was observed at 48 h and 72 h treatment (Fig. S6).
3.4. NMS‐P626 inhibits growth of KM12 tumor xenografts
Preliminary investigation of the pharmacokinetic properties of NMS‐P626 in the mouse indicated a favorable profile, characterized by low plasma clearance, good volume of distribution at steady state, and high oral availability (Table S5), all confirming the suitability of this compound for in vivo studies.
An efficacy study was therefore conducted to assess the in vivo antitumor activity of NMS‐P626 in nude mice bearing subcutaneously implanted KM12 tumors. NMS‐P626 was administered orally at 50 and 100 mg/kg twice a day for 10 consecutive days, starting when animals had well‐established tumors. Greater than 90% tumor growth inhibition was observed at both doses (TGI) as compared with vehicle‐treated animals. In these studies, we observed good tolerability, with no body weight loss or other overt toxicities (Figure 3C).
To evaluate TRKA inhibition by NMS‐P626, tumors were excised at 6 and 12 h following single oral administration of 100 mg/kg compound and Western Blot analysis of TRKA and PLCγ phosphorylation was performed on tumor lysates. As shown in Figure 3D, complete inhibition of both TRKA and PLC‐γ phosphorylation was observed at the 6 h time‐point in treated compared to control animals, whereas partial recovery was observed at 12 h.
The data presented above indicate that the TPM3‐TRKA protein expressed in KM12 cells is constitutively active and that TRKA kinase activity is required to drive cell growth and tumorigenesis in vitro and in vivo. Inhibition of TPM3‐TRKA signaling with NMS‐P626 results in cell growth arrest and apoptosis in vitro and antitumor efficacy in vivo, with modulation of corresponding biomarkers.
3.5. Analysis of NTRK1 rearrangement in colorectal carcinoma cases
In order to estimate the frequency of TRKA rearrangements in human colorectal carcinomas, we first evaluated the expression of TRKA by Western Blot analysis in a panel of 22 human colorectal carcinoma cell lines (Fig S7). No additional TRKA positive cell lines were identified. We then analyzed publicly available microarray gene expression data present in the Cancer Cell Line Encyclopedia (CCLE) (Barretina et al., 2012) for NTRK1 expression. Also in this case, KM12 was the only CRC cell line expressing TRKA mRNA out of 56 such lines present in the database. Interestingly, we then analyzed microarray data from 289 clinical samples of colorectal cancer made publicly available thanks to the effort of the International Genomics Consortium (IGC) and the Expression Project for Oncology (expO) (http://www.intgen.org/expo) and observed relatively high expression of NTRK1 in 3–5% of the colon carcinoma samples present in this database. Although it cannot be concluded per se that TRKA overexpression is ascribable to NTRK1 rearrangement in these tumors, these data do suggest the existence of a low‐frequency subset of colorectal carcinoma tumors with anomalous expression of this kinase.
We next developed a parallel two‐step analytical procedure suitable for reliable identification of NTRK1 rearrangements in clinical specimens and applied this to a series of 66 FFPE preparations from CRC surgical samples.
First, we used the RT‐qPCR method previously developed (see Section 3.2) to quantify relative expression levels of mRNA encoding the intracellular and extracellular domains of NTRK1 in RNA extracted from each sample, using RNA from KM12 cells as a positive control.
Out of 66 clinical samples analyzed, we identified one sample, T27, which was found to express readily detectable levels of mRNA encoding the intracellular domain, but not that encoding the extracellular domain of NTRK1, while all other samples were negative (data not shown). From sample T27 and using the primers reported in Table S4, we were able to selectively amplify by RT‐qPCR a region spanning the TPM3‐NTRK1 rearrangement junction, detectable at levels comparable to those observed in the KM12 cell line (Figure 4A). We then amplified the junction region by end‐point PCR (Figure 4B) and confirmed by direct DNA sequencing the presence of the same TPM3‐NTRK1 fusion transcript as found in KM12 cells.
Figure 4.
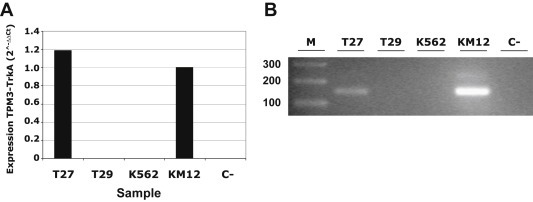
Identification of the TPM3‐NTRK1 rearrangement in a clinical sample RNA extracted and reverse transcribed from T27 colorectal cancer sample was analyzed for the presence of TPM3‐NTRK1 rearrangement using primers specifically designed across TPM3‐NTRK1 junction by A) RT‐qPCR (Supplementary Table S4, primers juncF/R) and B) end‐point PCR (Supplementary Table S3, primers 7F/R). We used the KM12 cell line as positive control and the K562 cell line expressing full‐length TRKA as negative control. T29 is a representative clinical sample showing no expression of the chimeric cDNA. C is the no template control.
The T27 sample was then investigated for the presence of mutations in KRAS (exons 2 and 3), NRAS (exons 2 and 3), BRAF (exon 15) and PI3KCA (exons 9 and 20) genes, and was wild‐type for all of these.
At the same time, we developed an immunohistochemical (IHC) method for detecting the intracellular domain of TRKA protein as a readout for NTRK1 rearrangement in colon. Among several commercially available antibodies recognizing the C‐terminal portion of the protein, we selected the anti‐TRKA monoclonal antibody clone EP1058Y (Epitomics, Burlingame, CA) based on its very good sensitivity and selectivity. Western blot analysis of total cell lysates from engineered Ba/F3 cells showed the antibody to be very sensitive and specific, recognizing only TRKA, with no cross‐reactivity versus TRKB, TRKC or other cellular proteins (Fig. S8 A, B). This high selectivity and sensitivity for TRKA was also observed for the EP1058Y antibody when used in IHC analyses performed firstly on cytospin preparations of Ba/F3 vs. Ba/F3‐TRKA cells and then on paraffin‐embedded samples of KM12 and HT29 tumor xenografts used as positive and negative controls, respectively (Fig. S8C).
Using this validated antibody, we independently analyzed the same 66 tumor specimens in blind, identifying T27 as the only sample displaying strong anti‐TRKA immunoreactivity (Figure 5 A–C). Localization of TRKA immunoreactivity in sample T27 was cytoplasmic, consistent with the intracellular localization we observed for the TPM3‐TRKA fusion protein in KM12 cells (Fig. S5). Importantly, the same strongly positive immunoreactivity was also observed in a preoperative biopsy from the same patient performed for diagnostic purposes (Figure 5 D–E).
Figure 5.
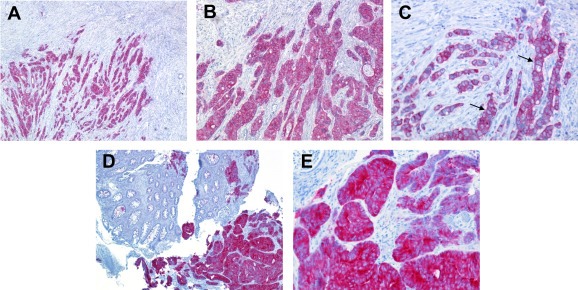
IHC detection of the intracellular domain of TRKA IHC was performed using a commercial antibody recognizing the C‐terminal portion of TRKA (Epitomics). A–C) Surgical sample (T27) from right hemicolectomy with a diagnosis of poorly differentiated adenocarcinoma showing strong cytoplasmic immunohistochemical reactivity to anti‐TRKA. Some cells seem to show a membrane positivity that, indeed, is due to the presence of a scant cytoplasm (black arrows). A) 50× magnification; B) 100× magnification; C) 200× magnification D–E) Bioptic sample of the same tumor showing a strong immunoreactivity for TRKA antibody (bottom right). In the same figure normal colonic tissue (upper left) with no positivity is found D) 50× magnification, E) 200× magnification.
These data confirm the presence at low frequency of the TPM3‐NTRK1 rearrangement in colorectal carcinoma and validate IHC with an anti C‐terminal TRKA antibody as a readily applicable method for screening colorectal carcinoma FFPE samples, aimed at identification of patients who might be candidates to clinical studies with pharmacological agents that inhibit activated/rearranged TRKA kinase.
4. Discussion
The remarkable clinical benefit observed in recent years in NSCLC following therapy with gefitinib or erlotinib in EGFR mutated and with crizotinib in ALK positive tumors, as well as with vemurafenib in BRAF mutated melanoma, has established that distinct subsets of solid tumors become addicted to activated kinases and that targeted inhibition of a single “driver” kinase can translate into significant clinical benefit. The inhibition of additional targets in NSCLC such as translocation‐activated ROS and RET is also under investigation in the clinical setting (Bergethon et al., 2012; Minuti et al., 2013). Indeed, such is the rate of progress in these fields that by comparison, the era of personalized therapy in the management of CRC appears still in its infancy.
Colorectal cancer is the third most common form of cancer and the second leading cause of cancer‐related death in western countries. Despite recent advances in understanding the pathogenesis of human CRC and the molecular characterization that has allowed the development of a comprehensive classification system, the cure rate for this disease remains low. Extensive molecular profiling efforts have led to the identification of two major mechanisms of genomic instability in CRC: approximately 15% of cases have microsatellite instability (MSI) due to alterations in genes involved in DNA mismatch‐repair pathways, whereas the remaining 85% are defined as microsatellite stable and are characterized by chromosomal instability (CIN) (Cunningham et al., 2010; Chau and Cunningham, 2009). Mutually exclusive activating point mutations in the KRAS (35–43% of cases) and BRAF (11–14%) oncogenes are also found in a significant fraction of CRCs, while extensive characterization by large scale sequencing efforts has highlighted the presence of low frequency rearrangements and point mutations of diverse kinases potentially associated with constitutive enzyme activation (Seshagiri et al., 2012; Siena et al., 2009; Bardelli et al., 2003; Han et al., 2013; Lipson et al., 2012; The Cancer Genome Atlas Network, 2012). While such studies have contributed to highlighting the complexity of development and progression of this disease, they have so far failed to identify a basis for the rational selection of patients for targeted therapy.
Unlike NSCLC, where for example EGFR mutation and ROS and ALK gene rearrangement predict response to inhibitors of these kinases, the only validated biomarker today in CRC is RAS mutation as a negative predictor of response to treatment with monoclonal anti‐EGFR‐therapy (Bardelli and Siena, 2010; Douillard et al., 2013).
Interestingly, the TPM3‐NTRK1 chimeric gene was originally isolated as early as in 1986 as a transforming oncogene from a human colon carcinoma, subsequently leading to the cloning of the full length WT NTRK1 sequence (Martin‐Zanca et al., 1986; Kaplan et al., 1991b). However, as of today there is no other description of this rearrangement in colorectal adenocarcinomas, asides from a recent technical report of a single sample out of 70 cases of primary CRC characterized by whole exome sequencing harbouring this rearrangement (Seshagiri et al., 2012).
We previously identified the presence of a TPM3‐TRKA chimeric protein in KM12 cells and demonstrated using the potent and selective TRKA inhibitor NMS‐P626, as well as by genetic ablation of NTRK1 by siRNA, that proliferation of KM12 is highly dependent on TRKA activity (Ardini et al., 2010). Similar findings have more recently been described by Doebele and colleagues using siRNA as well as ARRY‐470 and other kinase inhibitors with variable potency and selectivity on TRKA (Vaishnavi et al., 2013).
Here we report detailed characterization of the NTRK1 rearrangement in KM12 cells at the genomic level, including the TPM3 and NTRK1 gene breakpoints and its heterozygosis status in this MSI colon adenocarcinoma with wild‐type K‐RAS and B‐RAF genes. Interestingly, the observed breakpoint within exon 8 of NTRK1 in CRC differs from the breakpoints previously identified for the TPM3‐NTRK1 rearrangement in PTCs, and is more similar to those observed for TRK‐T3 rearrangements in this tumor type, which are also located within this exon (Butti et al., 1995). The breakpoint we identified in CRC falls in the region from exon 8 to exon 9 of NTRK1, proposed to represent a hot spot for recombination (Butti et al., 1995).
The rearrangement derives from a short inversion in the long arm of chromosome 1 and the resulting chimeric gene encodes a portion of the N‐terminal sequence of the non‐muscle TPM3 fused the transmembrane and the entire cytoplasmic domain of TRKA. The presence of numerous overlapping coiled‐coil domains in the TPM3 sequence (Lupas et al., 1991) is likely responsible for constitutive dimerization of the chimeric protein that leads to ligand‐independent activation of the TRKA kinase domain. This is strongly reminiscent of what is observed for ALK, RET and ROS kinase domains in lung adenocarcinoma where these kinases that acquire constitutive activation as a consequence of illegitimate chromosomal recombination have become targets for cancer therapy (Shaw et al., 2013).
We also disclose the chemical structure and biological characterization of NMS‐P626, a novel pyrazolo‐pyridine kinase inhibitor endowed with high potency and selectivity for TRK family kinases as well as favorable drug‐like properties, which include oral biovailability. NMS‐P626 strongly suppressed KM12 tumor cell growth through block of TRKA signaling both in vitro and in vivo, supporting the rationale for inhibition of this kinase as a new therapeutic option for a subset of colon carcinoma patients.
In order to facilitate future efforts to isolate and further characterize rearrangements of NTRK1 in CRC we set out to validate an IHC approach to detect overexpression of the intracellular domain of TRKA in CRC biopsies using a highly selective antibody directed against the c‐terminus of the protein. This approach takes advantage of the lack of TRKA expression in normal colon, and is a method directly applicable by most pathology labs for pro‐ or retrospective analysis of FFPE sample. Screening by IHC and RT‐qPCR of 66 clinical FFPE CRC samples led us to the identification of a positive colon adenocarcinoma sample, which was confirmed to selectively express TRKA mRNA encoding the cytoplasmic domain. This sample was then confirmed by PCR/Sanger sequencing to harbor a heterozygous TPM3‐NTRK1 rearrangement in a wild‐type RAS and B‐RAF genetic background. The strong immunostaining observed for both the surgical section as well as the preoperative biopsies from the same patient indicates that this rearrangement is abundantly expressed in a significant fraction of the tumor over time. Taken together, these observations suggest the existence of a low‐frequency recurring rearrangement of TRKA in colorectal adenocarcinomas. The IHC approach described herein makes it more feasible to screen high numbers of patient samples for treatment with TRKA kinase inhibitors rather than, for example relying solely on FISH, which is more expensive and work‐intensive. While identification of additional cases is needed to generalize these observations, we speculate, also based on what is known about the genetic background of driver kinase activation in NSCLC (Bergethon et al., 2012; Shaw et al., 2013; Gainor et al., 2013), that NTRK1 rearrangements may be mutually exclusive with other driver mutations, and that as a consequence exclusion of patients harboring RAS and B‐RAF mutations may represent an enrichment strategy for identification of NTRK1 rearrangements in CRC.
With respect to aberrant activation of TRKA in colorectal tumors, we speculated that point mutations which have been reported for the NTRK gene family in CRC (Coulier et al., 1990) might represent additional subsets of tumors sensitive to TRK inhibition. However, although NTRK1‐3 are found mutated at high frequency (15% for NTRK1) in the 55 cell lines present in the CCLE database, there appears to be little evidence for expression of the corresponding mRNA or protein. We therefore believe that such mutations are most likely irrelevant as an oncogenic mechanism in CRC, where rearrangements that lead to expression of chimeric proteins are today the only proven mechanism for NTRK1 activation.
In terms of NTRK family members other than NTRK1, it is also interesting to note that an ETV6‐NTRK3 DNA rearrangement was also recently reported in the same subset of CRC samples in which a TPM3‐NTRK1 positive sample was found (Seshagiri et al., 2012). The ETV6‐NTRK3 gene fusion results from a translocation between chromosome 12 and 15 in which the 5' region of ETV6 is fused to the 3' region of NTRK3 (Knezevich et al., 1998). The resulting transcript encodes a chimeric oncoprotein consisting of the helix‐loop‐helix dimerization domain of ETV6 fused to the tyrosine kinase domain of TRKC (Wai et al., 2000). The ETV6‐NTRK3 rearrangement was originally identified in congenital fibrosarcoma but has since also been described in secretory breast cancer, congenital mesoblastic nephroma and acute myeloid leukemia (Tognon et al., 2002; Adem et al., 2001; Kralik et al., 2011). We are currently applying IHC and RT‐qPCR methods to identify additional rearrangements of NTRK1 and 3 and to investigate their frequency in CRC specimens.
Recurring N0TRK1 rearrangements are observed in a significant fraction of PTCs, where they predict poor outcome (Greco et al., 2010). The newly described MRIP‐NTRK1 and CD74‐NTRK1 gene fusions identified in 3 out of 91 lung adenocarcinoma cases with no other common driver alterations possess oncogenic properties in fibroblasts and are sensitive to TRKA kinase inhibitors (Vaishnavi et al., 2013). Additional potential indications are emerging (Wiesner et al., 2014; Ross et al., 2014; Kim et al., 2014; Wu et al., 2014). We believe that the findings we describe herein of TPM3‐NTRK1 rearrangement in CRC and its sensitivity to NMS‐P626 have all the features of the “oncogene addiction” paradigm.
These findings support the inclusion of NTRK1 in the growing list of kinases which are aberrantly activated by mutagenic events in a subset of diverse tissues in which they drive oncogenesis, rendering the advancement in appropriate clinical settings of potent and selective TRKA inhibitors strongly warranted.
5. Conclusions
Our findings support the rationale for prospective, patient subset‐directed clinical trials of TRK kinase inhibitors in various clinical settings in which NTRK gene rearrangement occurs. For the CRC indication we provide evidence that the TPM3‐NTRK1 rearrangement is a clinically significant, low frequency recurring event, easily identifiable by IHC, which could render this subset of CRC tumors highly sensitive to TRKA inhibitors such as NMS‐P626.
Conflicts of interest
The authors disclose no potential conflicts of interest.
Supporting information
The following are the supplementary data related to this article:
Supplementary data
Supplementary data
Acknowledgments
We thank the KSS group for kinase selectivity profiling and the experimental therapy group for in vivo efficacy studies.
Niguarda Cancer Center investigators are currently supported by Grant AIRC 5 × 1000 from Associazione Italiana Ricerca Cancro (AIRC) and Grant Molecular therapies of Solid Tumors from Oncologia Ca' Granda Onlus (OCGO) Fondazioneldquo;. Istituto Nazionale Tumori is supported by Grant “5 × 1000” from Associazione Italiana Ricerca Cancro (AIRC).
Supplementary data 1.
1.1.
Supplementary data related to this article can be found at http://dx.doi.org/10.1016/j.molonc.2014.06.001.
Ardini Elena, Bosotti Roberta, Borgia Andrea Lombardi, De Ponti Cristina, Somaschini Alessio, Cammarota Rosaria, Amboldi Nadia, Raddrizzani Laura, Milani Andrea, Magnaghi Paola, Ballinari Dario, Casero Daniele, Gasparri Fabio, Banfi Patrizia, Avanzi Nilla, Saccardo Maria B., Alzani Rachele, Bandiera Tiziano, Felder Eduard, Donati Daniele, Pesenti Enrico, Sartore-Bianchi Andrea, Gambacorta Marcello, Pierotti Marco A., Siena Salvatore, Veronese Silvio, Galvani Arturo, Isacchi Antonella, (2014), The TPM3-NTRK1 rearrangement is a recurring event in colorectal carcinoma and is associated with tumor sensitivity to TRKA kinase inhibition, Molecular Oncology, 8, doi: 10.1016/j.molonc.2014.06.001.
References
- Adem, C. , Gisselsson, D. , Dal Cin, P. , Nascimento, A.G. , 2001. ETV6 rearrangements in patients with infantile fibrosarcomas and congenital mesoblastic nephromas by fluorescence in situ hybridization. Mod. Pathol. 14, 1246–1251. [DOI] [PubMed] [Google Scholar]
- Ardini, E. , Lombardi Borgia, A. , De Ponti, C. , Amboldi, N. , Ballinari, D. , Saccardo, M.B. , Magnaghi, P. , Pesenti, E. , Isacchi, A. , Galvani, A. , 2010. Identification and Preclinical Characterization of NMS-P626, a Potent, Selective and Orally Bioavailable TrkA Inhibitor with Anti-tumor Activity in a TrkA-dependent Colorectal Cancer. Poster presented at the 22nd AACR-NCI-EORTC Symposium on Molecular Targets and Cancer Therapeutics, Berlin (Germany) 16–19 November 2010 (Abstract) [Google Scholar]
- Barbacid, M. , 1995. Neurotrophic factors and their receptors. Curr. Opin. Cell Biol. 7, 148–155. [DOI] [PubMed] [Google Scholar]
- Bardelli, A. , Parsons, D.W. , Silliman, N. , Ptak, J. , Szabo, S. , Saha, S. , Markowitz, S. , Willson, J.K. , Parmigiani, G. , Kinzler, K.W. , Vogelstein, B. , Velculescu, V.E. , 2003. Mutational analysis of the tyrosine kinome in colorectal cancers. Science. 300, 949 [DOI] [PubMed] [Google Scholar]
- Bardelli, A. , Siena, S. , 2010. Molecular mechanisms of resistance to cetuximab and panitumumab in colorectal cancer. J. Clin. Oncol. 28, 1254–1261. [DOI] [PubMed] [Google Scholar]
- Barretina, J. , Caponigro, G. , Stransky, N. , Venkatesan, K. , Margolin, A.A. , Kim, S. , 2012. Cell line encyclopedia enables predictive modelling of anticancer drug sensitivity. Nature. 483, 603–607. [DOI] [PMC free article] [PubMed] [Google Scholar]
- Bergethon, K. , Shaw, T. , Ou, S.H. , Katayama, R. , Lovly, C.M. , McDonald, N.T. , Massion, P.P. , Siwak-Tapp, C. , Gonzalez, A. , Fang, R. , Mark, E.J. , Batten, J.M. , Chen, H. , Wilner, K.D. , Kwak, E.L. , Clark, J.W. , Carbone, D.P. , Ji, H. , Engelman, J.A. , Mino-Kenudson, M. , Pao, W. , Iafrate, A.J. , 2012. ROS1 rearrangements define a unique molecular class of lung cancers. J. Clin. Oncol. 30, 863–870. [DOI] [PMC free article] [PubMed] [Google Scholar]
- Beria, I. , Bossi, R.T. , Brasca, M.G. , Caruso, M. , Ceccarelli, W. , Fachin, G. , Fasolini, M. , Forte, B. , Fiorentini, F. , Pesenti, E. , Pezzetta, D. , Posteri, H. , Scolaro, A. , Re Depaolini, S. , Valsasina, B. , 2011. NMS-P937, a 4,5-dihydro-1H-pyrazolo[4,3-h]quinazoline derivative as potent and selective Polo-like kinase 1 inhibitor. Bioorg. Med. Chem. Lett. 21, 2969–2974. [DOI] [PubMed] [Google Scholar]
- Butti, M. , Bongarzone, I. , Ferraresi, G. , Modellini, P. , Borrello, M.G. , Pierotti, M.A. , 1995. A sequence analysis of the genomic regions involved in the rearrangements between TPM3 and NTRK1 genes producing TRK oncogenes in papillary thyroid carcinomas. Genomics. 28, 15–24. [DOI] [PubMed] [Google Scholar]
- Chau, I. , Cunningham, D. , 2009. Treatment in advanced colorectal cancer: what, when and how?. Br. J. Cancer. 100, 1704–1719. [DOI] [PMC free article] [PubMed] [Google Scholar]
- Coulier, F. , Kumar, R. , Ernst, M. , Klein, R. , Martin-Zanca, D. , Barbacid, M. , 1990. Human trk oncogenes activated by point mutation, in-frame deletion, and duplication of the tyrosine kinase domain. Mol. Cell Biol. 10, 4202–4210. [DOI] [PMC free article] [PubMed] [Google Scholar]
- Cunningham, M.E. , Stephens, R.M. , Kaplan, D.R. , Greene, L.A. , 1997. Autophosphorylation of activation loop tyrosines regulates signaling by the TRK nerve growth factor receptor. J. Biol. Chem. 272, 10957–10967. [DOI] [PubMed] [Google Scholar]
- Cunningham, D. , Atkin, W. , Lenz, H.J. , Lynch, H.T. , Minsky, B. , Nordlinger, B. , Starling, N. , 2010. Colorectal cancer. Lancet. 375, 1030–1047. [DOI] [PubMed] [Google Scholar]
- Daley, G.Q. , Baltimore, D. , 1988. Transformation of an interleukin 3-dependent hematopoietic cell line by the chronic myelogenous leukemia-specific P210bcr/abl protein. Proc. Natl. Acad. Sci. USA. 85, 9312–9316. [DOI] [PMC free article] [PubMed] [Google Scholar]
- Douillard, J.Y. , Oliner, K.S. , Siena, S. , Tabernero, J. , Burkes, R. , Barugel, M. , Humblet, Y. , Bodoky, G. , Cunningham, D. , Jassem, J. , Rivera, F. , Kocákova, I. , Ruff, P. , Błasińska-Morawiec, M. , Šmakal, M. , Canon, J.L. , Rother, M. , Williams, R. , Rong, A. , Wiezorek, J. , Sidhu, R. , Patterson, S.D. , 2013. Panitumumab–FOLFOX4 treatment and RAS mutations in colorectal Cancer. N. Engl. J. Med. 369, 1023–1034. [DOI] [PubMed] [Google Scholar]
- Felder, E.R. , Badari, A. , Disingrini, T. , Mantegani, S. , Orrenius, C. , Avanzi, N. , Isacchi, A. , Salom, B. , 2012. The generation of purinome-targeted libraries as a means to diversify ATP-mimetic chemical classes for lead finding. Mol. Divers. 16, 27–51. [DOI] [PubMed] [Google Scholar]
- Gainor, J.F. , Varghese, A.M. , Ou, S.H. , Kabraij, S. , Awad, M.M. , Katayama, R. , Pawlak, A. , Mino-Kenudson, M. , Yeap, B.Y. , Riely, G.J. , Iafrate, A.J. , Arcila, M.E. , Ladanyi, M. , Engelman, J.A. , Dias-Santagata, D. , Shaw, A.T. , 2013. ALK rearrangements are mutually exclusive with mutations in EGFR or KRAS: an analysis of 1,683 patients with non-small cell lung cancer. Clin. Cancer Res. 19, 4273–4281. [DOI] [PMC free article] [PubMed] [Google Scholar]
- Greco, A. , Pierotti, M.A. , Bongarzone, I. , Pagliardini, S. , Lanzi, C. , Della Porta, G. , 1992. TRK-T1 is a novel oncogene formed by the fusion of TPR and TRK genes in human papillary thyroid carcinomas. Oncogene. 7, 237–242. [PubMed] [Google Scholar]
- Greco, A. , Mirando, C. , Pagliardini, S. , Fusetti, L. , Bongarzone, I. , Pierotti, M.A. , 1997. Chromosome 1 rearrangements involving the genes TPR and NTRK1 produce structurally different thyroid-specific TRK oncogenes. Genes Chromosomes Cancer. 19, 112–123. [PubMed] [Google Scholar]
- Greco, A. , Villa, R. , Tubino, B. , Romano, L. , Penso, D. , Pierotti, M.A. , 1999. A novel NTRK1 mutation associated with congenital insensitivity to pain with anhidrosis. Am. J. Hum. Genet. 64, 1207–1210. [DOI] [PMC free article] [PubMed] [Google Scholar]
- Greco, A. , Miranda, C. , Pierotti, M.A. , 2010. Rearrangements of NTRK1 gene in papillary thyroid carcinoma. Mol. Cell. Endocrinol. 321, 44–49. [DOI] [PubMed] [Google Scholar]
- Han, S.W. , Kim, H.P. , Shin, J.Y. , Jeong, E.G. , Lee, W.C. , Lee, K.H. , Won, J.K. , Kim, T.Y. , Oh, D.Y. , Im, S.A. , Bang, Y.J. , Jeong, S.Y. , Park, K.J. , Park, J.G. , Kang, G.H. , Seo, J.S. , Kim, J.I. , Kim, T.Y. , 2013. Targeted sequencing of cancer-related genes in colorectal cancer using next-generation sequencing. PLoS One. 8, 64271 [DOI] [PMC free article] [PubMed] [Google Scholar]
- Indo, Y. , 2012. Nerve growth factor and the physiology of pain: lessons from congenital insensitivity to pain with anhidrosis. Clin. Genet. 82, 341–350. [DOI] [PubMed] [Google Scholar]
- Kaplan, D.R. , Hempstead, B.L. , Martin-Zanca, D. , Chao, M.V. , Parada, L.F. , 1991. The Trk proto-oncogene product: a signal transducing receptor for nerve growth factor. Science. 252, 554–558. [DOI] [PubMed] [Google Scholar]
- Kaplan, D.R. , Martin-Zanca, D. , Parada, L.F. , 1991. Tyrosine phosphorylation and tyrosine kinase activity of the trk proto-oncogene product induced by NGF. Nature. 350, 158–160. [DOI] [PubMed] [Google Scholar]
- Kaplan, D.R. , Miller, F.D. , 1997. Signal transduction by the neurotrophin receptors. Curr. Opin. Cell. Biol. 9, 213–221. [DOI] [PubMed] [Google Scholar]
- Kaplan, D.R. , Miller, F.D. , 2000. Neurotrophin signal transduction in the nervous system. Curr. Opin. Neurobiol. 10, 381–391. [DOI] [PubMed] [Google Scholar]
- Kralik, J.M. , Kranewitter, W. , Boesmueller, H. , Marschon, R. , Tschurtschenthaler, G. , Rumpold, H. , Wiesinger, K. , Erdel, M. , Petzer, A.L. , Webersinke, G. , 2011. Characterization of a newly identified ETV6-NTRK3 fusion transcript in acute myeloid leukaemia. Diagn. Pathol. 6, 19 [DOI] [PMC free article] [PubMed] [Google Scholar]
- Kim, J. , Lee, Y. , Cho, H.J. , Lee, Y.E. , An, J. , Cho, G.H. , Ko, Y.H. , Joo, K.M. , Nam, D.H. , 2014. NTRK1 fusion in glioblastoma multiforme. PLos One. 9, (3) e91940 [DOI] [PMC free article] [PubMed] [Google Scholar]
- Knezevich, S.R. , McFadden, D.E. , Tao, W. , Lim, J.F. , Sorensen, P.H. , 1998. A novel ETV6-NTRK3 gene fusion in congenital fibrosarcoma. Nat. Genet. 18, 184–187. [DOI] [PubMed] [Google Scholar]
- Levi-Montalcini, R. , 1987. The nerve growth factor 35 years later. Science. 237, 1154–1162. [DOI] [PubMed] [Google Scholar]
- Lipson, D. , Capelletti, M. , Yelensky, R. , Otto, G. , Parker, A. , Jarosz, M. , Curran, J.A. , Balasubramanian, S. , Bloom, T. , Brennan, K.W. , Donahue, A. , Downing, S.R. , Frampton, G.M. , Garcia, L. , Juhn, F. , Mitchell, K.C. , White, E. , White, J. , Zwirko, Z. , Peretz, T. , Nechushtan, H. , Soussan-Gutman, L. , Kim, J. , Sasaki, H. , Kim, H.R. , Park, S.I. , Ercan, D. , Sheehan, C.E. , Ross, J.S. , Cronin, M.T. , Jänne, P.A. , Stephens, P.J. , 2012. Identification of new ALK and RET gene fusions from colorectal and lung cancer biopsies. Nat. Med. 18, 382–384. [DOI] [PMC free article] [PubMed] [Google Scholar]
- Lupas, A. , Van Dyke, M. , Stock, J. , 1991. Predicting coiled coils from protein sequences. Science. 252, 5009 [DOI] [PubMed] [Google Scholar]
- Martin-Zanca, D. , Hughes, S.H. , Barbacid, M. , 1986. A human oncogene formed by the fusion of truncated tropomyosin and protein tyrosine kinase sequences. Nature. 319, 743–748. [DOI] [PubMed] [Google Scholar]
- Minuti, G. , D'Incecco, A. , Cappuzzo, F. , 2013. Targeted therapy for NSCLC with driver mutations. Expert Opin. Biol. Ther. 13, 1401–1412. [DOI] [PubMed] [Google Scholar]
- Morikawa, K. , Walker, S.M. , Nakajima, M. , Pathak, S. , Jessup, J.M. , Fidler, I.J. , 1988. Influence of organ environment on the growth, selection, and metastasis of human colon carcinoma cells in nude mice. Cancer Res. 48, 6863–6871. [PubMed] [Google Scholar]
- Ross, J.S. , Wang, K. , Gay, L. , Al-Rohil, R. , Rand, J.V. , Jones, D.M. , Lee, H.J. , Sheehan, C.E. , Otto, G.A. , Palmer, G. , Yelensky, R. , Lipson, D. , Morosini, D. , Hawryluk, M. , Catenacci, D.V. , Miller, V.A. , Churi, C. , Ali, S. , Stephens, P.J. , 2014. New routes to targeted therapy of intrahepatic cholangiocarcinomas revealed by next-generation sequencing. Oncologist. 19, 235–242. [DOI] [PMC free article] [PubMed] [Google Scholar]
- Seshagiri, S. , Stawiski, E.W. , Durinck, S. , Modrusan, Z. , Storm, E.E. , Conboy, C.B. , Chaudhuri, S. , Guan, Y. , Janakiraman, V. , Jaiswal, B.S. , Guillory, J. , Ha, C. , Dijkgraaf, G.J. , Stinson, J. , Gnad, F. , Huntley, M.A. , Degenhardt, J.D. , Haverty, P.M. , Bourgon, R. , Wang, W. , Koeppen, H. , Gentleman, R. , Starr, T.K. , Zhang, Z. , Largaespada, D.A. , Wu, T.D. , de Sauvage, F.J. , 2012. Recurrent R-spondin fusions in colon cancer. Nature. 488, 660–664. [DOI] [PMC free article] [PubMed] [Google Scholar]
- Shaw, A.T. , Hsu, P.P. , Awad, M.M. , Engelman, J.A. , 2013. Tyrosine kinase gene rearrangements in epithelial malignancies. Nat. Rev. Can. 13, 772–787. [DOI] [PMC free article] [PubMed] [Google Scholar]
- Siena, S. , Sartore-Bianchi, A. , Di Nicolantonio, F. , Balfour, J. , Bardelli, A. , 2009. Biomarkers predicting clinical outcome of epidermal growth factor receptor-targeted therapy in metastatic colorectal cancer. J. Natl. Cancer Inst. 101, 1308–1324. [DOI] [PMC free article] [PubMed] [Google Scholar]
- Snider, W.D. , 1994. Functions of the neurotrophins during nervous system development: what the knockouts are teaching us. Cell. 77, 627–638. [DOI] [PubMed] [Google Scholar]
- Somaschini, A. , Amboldi, N. , Nuzzo, A. , Scacheri, E. , Ukmar, G. , Ballinari, D. , Malyszko, J. , Raddrizzani, L. , Landonio, A. , Gasparri, F. , Galvani, A. , Isacchi, A. , Bosotti, R. , 2013. Cell line identity finding by fingerprinting, an optimized resource for short tandem repeat profile authentication. Genet. Test. Mol. Biomarkers. 17, 254–259. [DOI] [PubMed] [Google Scholar]
- Stephens, R.M. , Loeb, D.M. , Copeland, T.D. , Pawson, T. , Greene, L.A. , Kaplan, D.R. , 1994. Trk receptors use redundant signal transduction pathways involving SHC and PLC-gamma 1 to mediate NGF responses. Neuron. 12, 691–705. [DOI] [PubMed] [Google Scholar]
- The Cancer Genome Atlas Network, 2012. Comprehensive molecular characterization of human colon and rectal cancer. Nature. 330, 487 [DOI] [PMC free article] [PubMed] [Google Scholar]
- Tognon, C. , Knezevich, S.R. , Huntsman, D. , Roskelley, C.D. , Melnyk, N. , Mathers, J.A. , Becker, L. , Carneiro, F. , MacPherson, N. , Horsman, D. , Poremba, C. , Sorensen, P.H. , 2002. Expression of the ETV6-NTRK3 gene fusion as a primary event in human secretory breast carcinoma. Cancer Cell. 2, 367–376. [DOI] [PubMed] [Google Scholar]
- Ulrich, E. , Duwel, A. , Kauffmann-Zeh, A. , Gilbert, C. , Lyon, D. , Rudkin, B. , Evan, G. , Martin-Zanca, D. , 1998. Specific TrkA survival signals interfere with different apoptotic pathways. Oncogene. 16, 825–832. [DOI] [PubMed] [Google Scholar]
- Vaishnavi, A. , Capelletti, M. , Le, A.T. , Kako, S. , Butaney, M. , Ercan, D. , Mahale, S. , Davies, K.D. , Aisner, D.L. , Pilling, A.B. , Berge, E.M. , Jhingook, K. , Hidefumi, S. , Park, S. , Kryukov, G. , Garraway, L.A. , Hammerman, P.S. , Haas, J. , Andrews, S.W. , Lipson, D. , Stephens, P.J. , Miller, V.A. , Varella-Garcia, M. , Janne, P.A. , Doebele, R.C. , 2013. Oncogenic and drug-sensitive NTRK1 rearrangements in lung cancer. Nat. Med. 19, 1469–1472. [DOI] [PMC free article] [PubMed] [Google Scholar]
- Wai, D.H. , Knezevich, S.R. , Lucas, T. , Jansen, B. , Kay, R.J. , Sorensen, P.H. , 2000. The ETV6-NTRK3 gene fusion encodes a chimeric protein tyrosine kinase that transforms NIH3T3 cells. Oncogene. 19, 906–915. [DOI] [PubMed] [Google Scholar]
- Wiesner, T. , He, J. , Yelensky, R. , Esteve-Puig, R. , Botton, T. , Yeh, I. , Lipson, D. , Otto, G. , Brennan, K. , Murali, R. , Garrido, M. , Miller, V.A. , Ross, J.S. , Berger, M.F. , Sparatta, A. , Palmedo, G. , Cerroni, L. , Busam, K.J. , Kutzner, H. , Cronin, M.T. , Stephens, P.J. , Bastian, B.C. , 2014. Kinase fusions are frequent in Spitz tumours and spitzoid melanoma. Nat. Commun. 5, 3116 [DOI] [PMC free article] [PubMed] [Google Scholar]
- Wu, G. , Diaz, A.K. , Paugh, B.S. , Rankin, S.L. , Ju, B. , Li, Y. , Zhu, X. , Qu, C. , Chen, X. , Zhang, J. , Eason, J. , Edmonson, M. , Ma, X. , Lu, C. , Nagahawatte, P. , Hedlund, E. , Rusch, M. , Pounds, S. , Lin, T. , Onar-Thomas, A. , Huether, R. , Kriwacki, R. , Parker, M. , Gupta, P. , Becksfort, J. , Wei, L. , Mulder, H.L. , Boggs, K. , Vadodaria, B. , Yergeau, D. , Russell, J.C. , Ochoa, K. , Fulton, R.S. , Fulton, L.L. , Jones, C. , Boop, F.A. , Broniscer, A. , Wetmore, C. , Gajjar, A. , Ding, L. , Mardis, E.R. , Wilson, R.K. , Taylor, M.R. , Downing, J.R. , Ellison, D.W. , Zhang, J. , Baker, S.J. , St. Jude Children's Research Hospital–Washington University Pediatric Cancer Genome Project2014. The genomic landscape of diffuse intrinsic pontine glioma and pediatric non-brainstem high-grade glioma. Nat. Genet. 46, 444–450. [DOI] [PMC free article] [PubMed] [Google Scholar]
Associated Data
This section collects any data citations, data availability statements, or supplementary materials included in this article.
Supplementary Materials
The following are the supplementary data related to this article:
Supplementary data
Supplementary data