

Abstract
The mitotic kinesin KIF11 (also called Eg5) plays critical roles in spindle functions. Although a number of small‐molecule inhibitors of KIF11 are currently in clinical development, drug‐resistance could be developed through compensation by another kinesin called KIF15. Using a newly developed infrared‐based cell system, we discovered that the effectiveness of one of the latest generations of KIF11 inhibitor (SB743921) could be enhanced with several inhibitors of Aurora A kinase. Evidence including live‐cell imaging and isobologram analysis indicated that targeting KIF11 and Aurora A together promoted monoastral spindle formation and mitotic catastrophe synergistically, supporting a model of parallel pathways of centrosome regulation by Aurora A and KIF11. We also developed a KIF15‐dependent SB743921‐resistance cell model. Significantly, the drug‐resistance could also be overcome with Aurora A inhibitors. These results provide a molecular basis for increasing the effectiveness of Aurora A and KIF11 inhibitors and tackling problems of drug resistance.
Keywords: Drug‐resistance, Drug screening, Eg5, Infrared, Kinesin, Mitosis
Highlights
An infrared cell‐based screening platform is developed.
Screening of chemicals that promotes the antimitotic effects of KIF11 inhibitors.
Inhibitors of Aurora A and KIF11 promote mitotic catastrophe synergistically.
KIF15‐dependent KIF11 drug‐resistance can be overcome by Aurora A inhibition.
1. Introduction
Antimitotic drugs are among the most important chemotherapeutic agents available. Archetypal examples include spindle poisons that inhibit microtubules depolymerization (e.g. taxanes) or polymerization (e.g. vinca alkaloids). The spindle‐assembly checkpoint is artificially activated by spindle poisons, resulting in mitotic block followed by a unique form of cell death often termed mitotic catastrophe (Chow and Poon, 2010). The major shortcoming of anti‐microtubule agents is that microtubules are also critical for other cellular functions such as intracellular transport and neuronal function. More specific inhibitors of mitosis would avoid the side effects of anti‐microtubule agents such as neuropathy.
One important class of mitotic target for anticancer drugs is mitotic kinesin. KIF11 (also called Eg5, KSP, HKSP, KNSL1, and TRIP5) is a tetrameric plus‐end directed microtubule motor of the Kinesin‐5 family (Lawrence et al., 2004), which localizes along the interpolar spindle microtubules and spindle poles (Cochran et al., 2004). KIF11 is implicated in various mitotic microtubule functions including microtubule crosslinking, antiparallel microtubule sliding, and bipolar spindle formation, thereby ensuring the fidelity of chromosome segregation.
The expression of KIF11 is closely related to cell proliferation and cancer. Overexpression of KIF11 was found in bladder cancer (Ding et al., 2011) and pancreatic cancer (Liu et al., 2010). Furthermore, transgenic mice overexpressing KIF11 are prone to develop a variety of tumors (Castillo et al., 2007). These and other observations favor KIF11 as an attractive target for chemotherapy.
The first small‐molecule inhibitor of KIF11 (KIF11i), monastrol, was identified using a phenotypic screen designed to identify antimitotic compounds that do not directly interfere with microtubule dynamics (Mayer et al., 1999). Monastrol induces the formation of monoastral spindle, resulting in an activation of the spindle‐assembly checkpoint followed by apoptosis (Huszar et al., 2009). Nevertheless, the clinical potential of monastrol is limited because of its relatively weak KIF11 inhibitory activity and the variety of side effects associated with high dosages.
Newer generations of KIF11i including SB743921 have substantially higher potency and specificity towards KIF11 than monastrol (Holen et al., 2011). Nevertheless, potential issues that apply to many drugs in general, including tolerance and drug‐resistance, could hamper their clinical development. A solution to these problems is to adopt combinatorial treatments to target multiple mitotic regulators simultaneously. Synergism between two drugs may allow lower doses to be used than in single drug treatment. Another rationale of targeting multiple mitotic regulators is that drug resistance developed in cancer patients treated with single‐target drugs is often due to the activation of alternative pathways.
Here we studied one of the latest KIF11i, SB743921, which is an improved version of Ispinesib (SB715992) currently in phase I/II trials (Holen et al., 2011). We identified two AURKA inhibitors could enhance the mitotic catastrophe induced by SB743921. Moreover, AURKA inhibitors could overcome drug‐resistance developed against SB743921. One obstacle of identify compounds that act synergistically is the cost and time involved in screening. To tackle this, we developed an infrared‐based cell system for reporting cell proliferation. This proof‐of‐principle study indicates that this cost‐effective and sensitive approach can be used for many types of drug screening.
2. Materials and methods
2.1. DNA constructs
Plasmid expressing iRFP (Filonov et al., 2011) was obtained from Addgene (Cambridge, MA, USA). Plasmid expressing iFP1.4 (Shu et al., 2009) was a gift from Roger Tsien (University of California, San Diego). Histone H2B‐GFP construct was a gift from Tim Hunt (Cancer Research UK).
2.2. RNA interference
Cells were transfected with siRNA (10 nM unless stated otherwise) by Lipofectamine™ RNAiMAX (Life Technologies, Carlsbad, CA, USA). Stealth siRNA targeting AURKA (GGCCAAUGCUCAGAGAAGUACUUGA), KIF11 (GAGAGAUUCUGUGCUUUGGAGGAAA) and control siRNA were obtained from Life Technologies; siRNA against KIF15 (GCGGUUAUAAUGGUACCAU) was obtained from Genepharma (Shanghai, China).
2.3. Cell culture
The HeLa used in this study was a clone that expressed the tTA tetracycline repressor chimera (Yam et al., 2000). H1299 cells were obtained from the American Type Culture Collection (Manassas, VA, USA). Cells were propagated in Dulbecco's modified Eagle's medium (DMEM) supplemented with 10% (v/v) calf serum (Life Technologies) (for HeLa) or fetal bovine serum (Life Technologies) (for H1299) and 50 U/ml of penicillin streptomycin (Life Technologies). Cells were cultured in humidified incubators at 37 °C in 5% CO2. Unless stated otherwise, cells were treated with the following reagents at the indicated final concentration: Alisertib (Selleck Chemicals, Houston, TX, USA) (62.5 nM), Barasertib (Selleck Chemicals) (12.5 nM), MG132 (Sigma–Aldrich) (10 μM), MK‐5108 (Selleck Chemicals) (125 nM), monastrol (Enzo Life Sciences, Farmingdale, NY, USA) (25 μM), RO3306 (Enzo Life Sciences) (2.5 μM), SB743921 (Selleck Chemicals) (10 nM). Cells were transfected with plasmids using a calcium phosphate precipitation method (Ausubel et al., 1995). Trypan blue analysis (Poon et al., 1995) and clonogenic survival assays (Marxer et al., 2013) were performed as described previously. WST‐1 assays were performed according to the instructions of the manufacturer (Roche Applied Science, IN, USA). Cell‐free extracts were prepared as described previously (Poon et al., 1995).
2.4. Generation of stable cell lines
HeLa and H1299 cells expressing iRFP were generated by transfection followed by cell sorting. Cells were transfected with an iRFP‐expressing construct and the iRFP‐positive cells were enriched by sorting using a flow cytometer (FACSAria II, Becton Dickinson, Franklin Lakes, NJ, USA) using a 633‐nm red laser for excitation. The cells were propagated for one week before being sorted again. Three rounds of sorting were performed. HeLa cells that stably expressed histone H2B‐GFP were described previously (Chan et al., 2008). To generate SB743921‐resistant cells, HeLa or H1299 cells were cultured in the presence of 2.5 nM of SB743921 for 2 weeks. The cells were then subcultured with limited dilution in 5 nM of SB743921 for three weeks. Individual colonies were isolated and tested for resistance to 10 nM of SB743921‐induced G2/M arrest with flow cytometry. The cells were subsequently propagated in the absence of SB743921.
2.5. Infrared imaging
Infrared images of cells expressing iRFP or iFP1.4 were acquired and quantified with a ODYSSEY CLx system (LI‐COR Biosciences, Lincoln, NE, USA). The following parameters were used: focus offset (3.0 mm), resolution (196 μm), quality (low), and intensity (6). Unless stated otherwise, the 700 nm channel was used. Background obtained from culture medium only was subtracted from the readings.
2.6. Flow cytometry
Flow cytometry analysis after propidium iodide staining was performed as described previously (Siu et al., 1999).
2.7. Live‐cell imaging
The setup and conditions of time‐lapse microscopy of living cells were as previously described (On et al., 2011).
2.8. Drug synergism studies
HeLa cells expressing iRFP were seeded onto 96‐well plates (1000 cells/well) at 24 h before drug treatment. The cells were treated with different chemicals (see Fig S1 for list and concentrations used) either on their own or together with 1 nM of SB743921. The iRFP intensity was analyzed with an infrared imager at 96 h after drug treatment. The relative cell proliferation after single drug treatment was normalized to the untreated control and the relative cell proliferation after co‐treatment with SB743921 was normalized to cells treated with SB743921 alone.
2.9. Isobologram analysis
The combination effects of two treatments were analyzed according to the median‐effect method of Chou and Talalay (Chou and Talalay, 1984). Each dose‐response curve was used to calculate the isobologram and the linear correlation coefficient of the median‐effect plot (r). The combination index (CI) at different effective dose (ED) was calculated according to Chou and Talalay using Calcusyn Version 2.1 (Biosoft, Cambridge, UK). CI value <1 indicates synergistic effect (0.1–0.5 strong synergism; <0.1 very strong synergism); CI value of 1 indicates additive effect; and CI value >1 indicates antagonistic effect.
2.10. mRNA expression
The conditions of RT‐PCR were as previously described (Chow et al., 2013) using primers for TPX2 (5′‐GATTCATGGTTTGAGGAGAAGG‐3′; 5′‐TTCTGCCTCTTTGTAGTAAGTG‐3′), actin (5′‐GGGAAATCGTGCGTGACATT‐3′; 5′‐GGAACCGCTCATTGCCAAT‐3′), and KIF15 (5′‐AGAAGGGATGAGATTGAAGGA‐3′; 5′‐CGTAGTAAGAAGGTAAGTTTGGAG‐3′).
2.11. Antibodies and immunological methods
Antibodies against AURKA (BD Biosciences, Franklin Lakes, NJ, USA), CDC27 (BD Biosciences), cyclin B1 (Santa Cruz Biotechnology, Santa Cruz, CA, USA), KIF11 (BD Biosciences), phospho‐histone H3Ser10 (Santa Cruz Biotechnology), KIF15 (Santa Cruz Biotechnology), PARP1 (BD Biosciences), cleaved PARP1(Asp214) (BD Biosciences), TPX2 (Biolegend, San Diego, CA, USA), Alexa Fluor 488 conjugated α‐tubulin (Life Technologies), and γ‐tubulin (Santa Cruz Biotechnology) were obtained from the indicated suppliers. Immunoblotting was performed as described (Poon et al., 1995).
2.12. Fluorescence microscopy
Cells grown on poly‐l‐lysine‐treated coverslips were fixed with ice‐cold methanol at −20 °C for 10 min. The cells were then washed three times with phosphate buffered saline (PBS) for 5 min each, blocked and permeabilized with 3% bovine serum albumin (BSA) and 0.2% Triton X‐100 in PBS at 25 °C for 30 min. The subsequent incubation steps were followed by three times washing with wash buffer (1% BSA and 0.2% Triton X‐100 in PBS) for 5 min each time. The cells were first incubated with anti‐γ tubulin antibodies in wash buffer and followed by Alexa Fluor 594 goat anti‐mouse IgG secondary antibody (Life Technologies) in wash buffer for 2 h at 25 °C. The cells were further incubated with Alexa Fluor 488 conjugated α‐tubulin antibodies in wash buffer. DNA was stained with Hoechst 33258 (0.5 μg/ml in wash buffer) for 5 min. After being washed three times with wash buffer, the coverslips were mounted with 2%(w/v) N‐propyl‐gallate (Sigma–Aldrich) in glycerol. The fluorescence images were acquired with a Nikon TE2000E microscope.
3. Results
3.1. Developing an infrared fluorescent cell model for drug identification
We sought to establish an improved cellular system to facilitate drug discovery. Desirable features include the ability to report proliferation with high sensitivity, a broad linear range, providing temporal information, as well as being rapid and economical to perform. An infrared‐based system meets the above criteria. Recent advances in infrared fluorescent proteins produce probes, such as IFP1.4 (Shu et al., 2009) and iRFP (Filonov et al., 2011), which are bright and well tolerated by mammalian cells. Transient expression in HeLa cells indicated that iRFP was significantly brighter than IFP1.4 (Figure 1A). As excitation and emission maxima of iRFP (690/713) and IFP1.4 (684/708) are similar to that of the IRDye 680 dye used in standard desktop infrared imaging systems, we evaluated if the iRFP‐expressing cells can be detected using infrared imaging systems. Indeed, cells expressing iRFP could be readily detected using an ODYSSEY infrared imaging system (Figure 1B).
Figure 1.
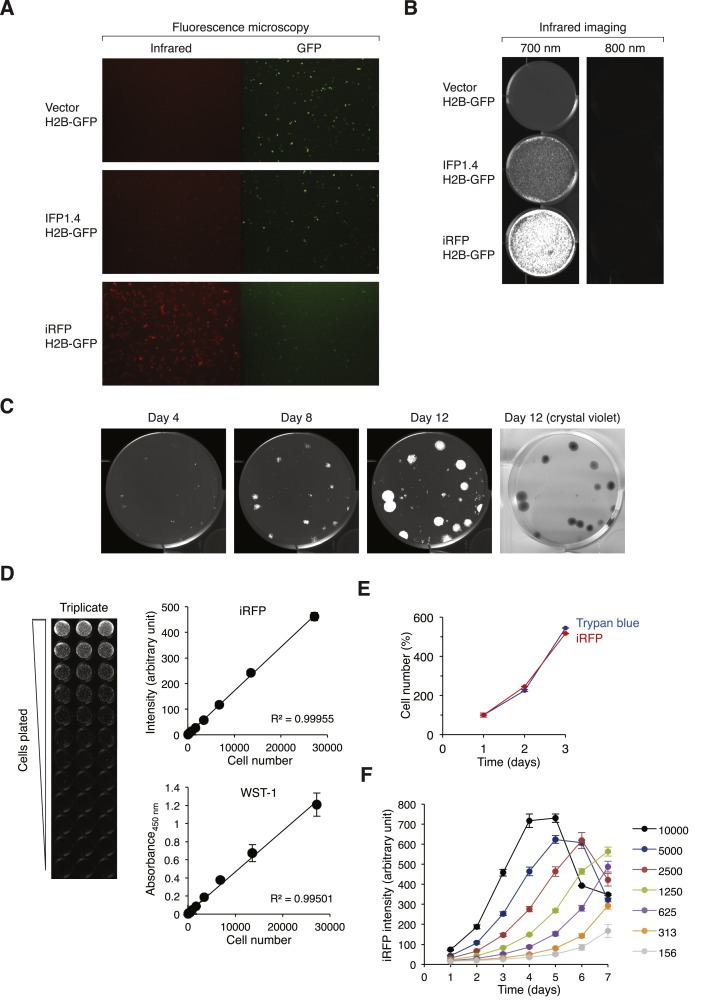
Developing an infrared fluorescent cell model for drug screening. (A) Expression of infrared fluorescent proteins. HeLa cells were transfected with a blank vector or plasmids expressing IFP1.4 or iRFP. A plasmid expressing histone H2B‐GFP was co‐transfected to serve as a transfection marker. Fluorescence images were acquired with a Cy5.5 filter set for IFP1.4 and iRFP and a GFP filter set for the histone H2B‐GFP. (B) Detection of iRFP using an infrared imager. HeLa cells were transfected as in panel (A). When near confluence, the plates were imaged with an infrared imaging system using either 700 nm or 800 nm. Both IFP1.4‐ and iRFP‐expressing cells could be detected using the 700 nm channel only. (C) Detection of iRFP‐expressing cells using colony formation assays. HeLa cells stably expressing iRFP were generated and plated at low density on a 6‐well plate. The plate was scanned with an infrared imager on the indicated days. On day 12, the cells were also fixed and stained with crystal violet. (D) iRFP provides a broad linear range for measuring cell proliferation. Two‐fold serial dilutions (from 27,200 to 27 cells) of iRFP‐expressing cells were seeded onto a 96‐well plate in triplicates. At 6 h after seeding, the plate was scanned using an infrared imaging system (left) and quantified (upper panel). The cells were then processed for WST‐1 cell proliferation assay (bottom panel). Mean ± SD of triplicate samples. (E) Infrared signal is directly proportional to the cell number. HeLa cells expressing iRFP were seeded onto 60‐mm plates in triplicates. At the indicated time points, the plates were first scanned with an infrared imager before harvested for trypan blue cell counting with a haemocytometer. Mean ± SD of triplicate samples. (F) Growth curves as quantified by infrared imaging. The indicated number of HeLa cells expressing iRFP were seeded onto a 96‐well plate in triplicates. The wells were scanned with an infrared imager at different time points and the iRFP signals quantified. Mean ± SD of triplicate samples.
To generate cells stably expressing iRFP, HeLa cells were transfected with an iRFP‐expressing plasmid and selected by sorting with flow cytometry. The mixed population contained predominantly iRFP‐positive cells (Figure 1C). Detection of infrared was very sensitive because colonies could be detected using an infrared imager as early as 4 days after plating (between 32 and 64 cells). Compare to using other fluorescent proteins such as GFP, an advantage of infrared is the low auto‐fluorescence signal from the growth medium and plastic, thereby producing excellent signal‐to‐noise ratio. As infrared imaging systems have a broad dynamic range, the signals remained linear with at least 1000‐fold difference in cell number (Figure 1D). Cell proliferation as measured by infrared was comparable to conventional metabolic‐based methods such as WST‐1 assays (Figure 1D), or more direct cell counting using trypan blue staining and a haemocytometer (Figure 1E). Unlike end‐point assays such as WST‐1 assays, the iRFP‐expressing cells remained viable after scanning. This allowed simple and economical measurement of time‐dependent changes in cell number using the same plate (Figure 1F).
Collectively, we have developed a robust iRFP‐based screening platform, which is characterized by having a broad linear range, high sensitivity, and can provide rapid and economical time‐dependent measurement of the effects of drugs on cell growth. A similar infrared‐based system and its advantages have also been described recently (Hock et al., 2013).
3.2. Identification of compounds that act synergistically with KIF11 inhibition
Using the iRFP‐expressing cell platform, we next investigated the cytotoxicity of the mitotic kinesin KIF11i SB743921 (Holen et al., 2011). Incubation of iRFP‐expressing HeLa cells with SB743921 induced growth inhibition in a dose‐dependent manner (Figure 2A). Similar ED50 values were obtained from infrared measurement and conventional WST‐1 assays (1.4 nM and 1.1 nM, respectively, at 96 h after drug addition), further supporting the usefulness of the new infrared‐based proliferation assay (Figure 2B).
Figure 2.
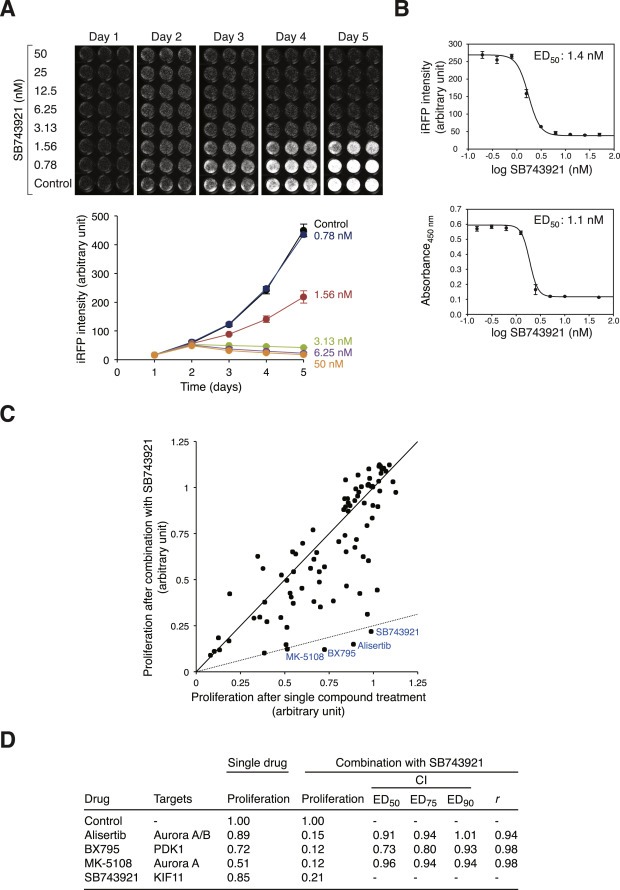
Identification of chemicals that act synergistically with KIF11i. (A) Growth inhibition by SB743921. HeLa cells expressing iRFP were seeded onto 96‐well plates and incubated with buffer or different concentrations of SB743921 (in triplicates). During the next five days, the plate was scanned with an infrared imaging system (upper panel) to quantify the infrared signals (lower panel). Mean ± SD of triplicate samples. (B) ED50 of SB743921 on HeLa cells. Cells expressing iRFP were treated with SB743921 as described in panel (A). At 96 h after treatment, the iRFP intensity was quantified using an infrared imager (upper panel). The cells were then harvested and analyzed with WST‐1 assay (lower panel). Mean ± SD of triplicates. The ED50 values obtained from the two methods are shown. (C) Chemicals that act synergistically with SB743921. HeLa cells expressing iRFP were seeded onto 96‐well plates (1000/wells) at 24 h before the experiment. The cells were treated with different chemicals (see Figure S1 for the list and concentrations used) either on their own or together with 1 nM of SB743921. After incubation for 96 h, the iRFP intensity was analyzed with an infrared imager. The relative cell proliferation after single drug treatment was normalized to the untreated control; the relative cell proliferation after co‐treatment with SB743921 was normalized to cells treated with SB743921 alone. Each dot represents the relative proliferation after incubation with the compound alone (x‐axis) or in the presence of SB743921 (y‐axis). The solid line indicates the predicted response if there was no change in cell proliferation between treatment alone and co‐treatment with SB743921. The dashed line indicates the predicted response for 75% reduction of cell proliferation in the combined treatment compared to single drug treatment. Compounds that exerted strong effects on cytotoxicity when combined with SB743921 are indicated. (D) Summary of compounds that showed synergistic effects with SB743921. The drugs and their reported targets are indicated. The relative proliferation of single drug treatment and in combination with SB743921 are shown. Isobologram analysis was performed (Materials and Methods). Combination index (CI) value < 1 indicates synergism.
Flow cytometry analysis verified that 10 nM of SB743921 was sufficient to induced an accumulation of G2/M (Figure S2A). Analysis of mitotic markers including cyclin B1 and phosphorylation of histone H3Ser10 and CDC27 confirmed that SB743921 blocked cells in mitosis (Figure S2B). It is noteworthy that the level of KIF11 was not altered in the presence of SB743921. Finally, time‐lapse microscopy (using cells expressing histone H2B‐GFP) confirmed that SB743921‐treated cells typically underwent protracted mitosis without forming a metaphase plate before undergoing cell death (Figure S2C).
To identify compounds that can potentiate the anti‐proliferation effects of SB743921, we treated iRFP‐expressing cells with a number of chemicals, either alone or in the presence of a relatively low concentration of SB743921 (1 nM). Dose responses of the different compounds on HeLa cells were tested beforehand to obtain sublethal concentrations (Figure S1). The compounds were selected mainly based on their potential cell cycle effects. Infrared imaging was used to monitor which compounds, when combined with SB743921, exerted strong anti‐proliferation effects (Figure 2C). Several compounds were found to have possible synergistic effects with SB743921, causing more than 75% reduction of cell proliferation in the combined treatment compared to effect of the compounds individually (summarized in Figure 2D). Not surprisingly, SB743921 itself was identified because the combinatorial treatment increased the concentration of the drug. Other compounds that exerted stronger effects than SB743921 included the Aurora kinase inhibitors Alisertib (also called MLN8237) and MK‐5108 (also called VX‐689), and the PDK1 inhibitor BX795.
To investigate more rigorously if the effects of the above chemicals and SB743921 together represented synergism, isobologram analysis was carried out according to the median‐effect method of Chou and Talalay (Chou and Talalay, 1984). Using infrared imaging to monitor proliferation, we found that SB743921 acted synergistically with Alisertib, BX795, and MK‐5108 (Figure 2D). The combination index (CI) was less than 1, which indicated synergism, over a range of effective dose (ED50, ED75 and ED90; with the exception of Alisertib at ED90).
Taken together, these results indicate that the KIF11i SB743921 induces mitotic arrest followed by cell death. Furthermore, the anti‐proliferation property of SB743921 is enhanced by combination with several compounds that include small‐molecule inhibitors of Aurora kinases.
3.3. Aurora A inhibitors act synergistically with KIF11 inhibitors to induce mitotic catastrophe
Given the interests for both KIF11 and Aurora kinases as drug targets, we performed detailed analysis of the interactions of their inhibitors. On its own, SB743921 exerted negligible effects on proliferation at concentrations up to 1.25 nM after 48 h (Figure 3A). Likewise, Alisertib alone at concentrations up to 31.3 nM did not affect proliferation. By contrast, proliferation was severely compromised in the presence of both SB743921 and Alisertib. Similar results were obtained for longer‐term cell survival (Figure 3B, for 1 week) or clonogenic survival after >2 weeks (Figure 3C). Survival was similarly diminished after co‐treatment with SB743921 and the Aurora A (AURKA)‐specific inhibitor MK‐5108 (Figure 3C).
Figure 3.
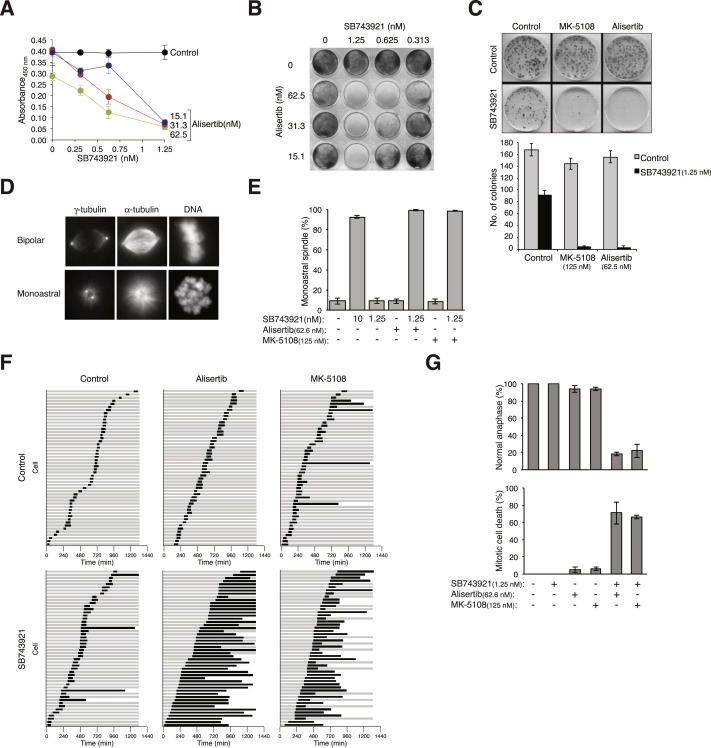
AURKAi acts synergistically with SB743921 to induce mitotic catastrophe. (A) Combinatorial treatment of Alisertib and SB743921 inhibits cell growth. HeLa cells were cultured in the presence of different concentrations of SB743921 and Alisertib for 48 h. Proliferation was analyzed using WST‐1 assays. Mean ± SD of triplicates. (B) Long‐term cell survival is inhibited by Alisertib and SB743921. HeLa cells were plated at low density and cultured in the presence of the indicated concentrations of Alisertib and SB743921. After one week, the cells were fixed and visualized with crystal violet staining. (C) Synergism between SB743921 and different AURKAi. HeLa cells were plated at low density and treated with the indicated combination of Alisertib (62.5 nM), MK‐5108 (125 nM), and SB743921 (1.25 nM). The colonies were fixed and stained with crystal violet. The number of colonies was quantified. Mean ± SD of three independent experiments. (D) SB743921‐ and Alisertib‐induced monoastral spindle mitosis. HeLa cells were either untreated or exposed to SB743921 (1.25 nM) and Alisertib (62.5 nM) for 3 h. The proteasome inhibitor MG132 was added for another 2 h to prevent mitotic exit. The cells were fixed, stained with antibodies against alpha‐tubulin and gamma‐tubulin, and analyzed with fluorescent microscopy. Representative images are shown for mitosis with bipolar spindle and monoastral spindle. (E) Targeting KIF11 and AURKA together induces monoastral spindle formation. Cells were treated with buffer, SB743921 (1.25 nM or 10 nM), Alisertib (62.5 nM), and MK‐5108 (125 nM) for 3 h. The proteasome inhibitor MG132 was added for another 2 h to prevent mitotic exit. The cells were analyzed with fluorescence microscopy as in panel (D). The percentage of mitotic cells containing monoastral spindle is shown (n = 80). Mean ± SD of three independent experiments. (F) Targeting KIF11 and AURKA extends mitosis and promotes mitotic catastrophe. HeLa cells expressing histone H2B‐GFP were exposed to Alisertib (62.5 nM), MK‐5108 (125 nM), and SB743921 (1.25 nM) as indicated. Individual cells were tracked using time‐lapse microscopy for 24 h. Each horizontal bar represents one cell (n = 50). Key: grey = interphase; black = mitosis (from DNA condensation to anaphase or cell death); truncated bars = cell death. (G) Normal mitotic exit is abolished by inhibition of KIF11 and AURKA together. Cells were treated and analyzed with time‐lapse microscopy as described in panel (F). The percentage of cells that could undergo normal anaphase (upper panel) or mitotic cell death (lower panel) is shown (n = 50). Mean ± max/min of two independent experiments.
Although KIF11, AURKA, and Aurora B (AURKB) all regulate mitosis, distinct consequences are induced by their inhibition. While KIF11i arrests cells in mitosis with monoastral spindle, inhibitors of AURKA (AURKAi) and AURKB induce mitotic arrest mainly with bipolar spindle and mitotic slippage, respectively (Marxer et al., 2013). We determine the types of spindle defects in the combinatorial treatments with immunofluorescence microscopy. Examples of bipolar mitosis and monoastral mitosis are shown in Figure 3D. As a control, 10 nM of SB743921 triggered monoastral spindle formation in >90% of mitotic cells (Figure 3E). In contrast, sublethal concentration of SB743921 (1.25 nM) did not elevate the frequency of monoastral mitosis above the background. Significantly, combining the sublethal concentration of SB743921 with either Alisertib or MK‐5108 restored monoastral mitosis. As expected, the controls of Alisertib or MK‐5108 alone did not induce monoastral mitosis. These data indicate that combining KIF11i with AURKAi produced an effect that is consistent with an inhibition of the KIF11 pathway.
We further used live‐cell imaging to investigate the effects of targeting KIF11 and AURKA together at single cells level. The fates of individual cells stably expressing histone H2B‐GFP were tracked (Figure 3F). While incubation with sublethal concentrations of KIF11i or AURKAi alone only increased the mitotic duration marginally, combining KIF11i and AURKAi dramatically increased the mitotic duration. Normal anaphase was inhibited and the majority of cells eventually succumbed to cell death during the prolonged mitotic block (summarized in Figure 3G).
We further evaluated if the cell death triggered by co‐inhibition of KIF11 and AURKA involved apoptosis. As expected, the cell cycle profile was not significantly altered in cells growing in sublethal concentrations of KIF11i or AURKAi alone (Figure 4A). In contrast, combining KIF11i with either of the two AURKAi promoted mitotic arrest as revealed by flow cytometry (Figure 4A) and increase of histone H3Ser10 phosphorylation (Figure 4B). Apoptosis was suggested by an increase in sub‐G1 population (Figure 4A). As sub‐G1 population is relatively less sensitive in detecting apoptosis, we also used PARP1 cleavage (Figure 4B) as a further indictor of apoptosis throughout this study.
Figure 4.
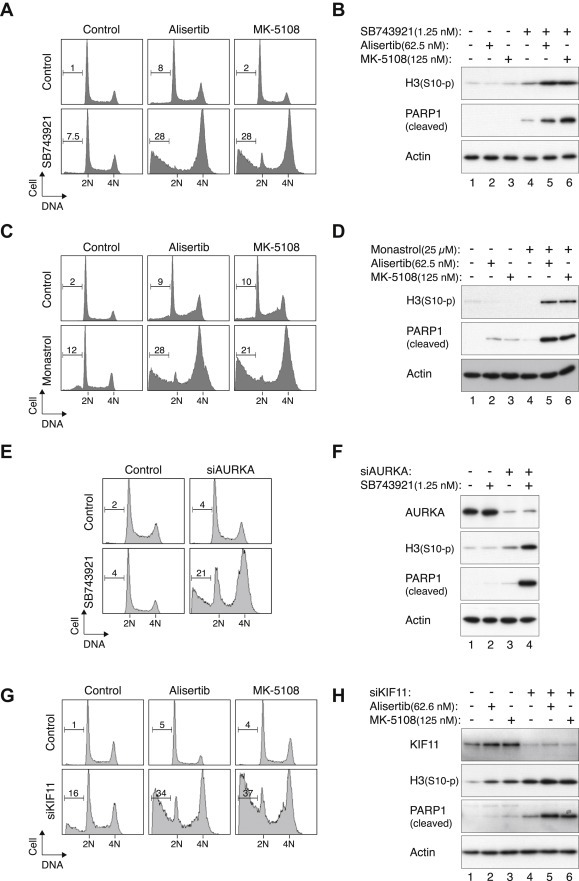
Mitotic catastrophe is induced by pharmacological or siRNA‐mediated disruption of AURKA and KIF11. (A) Disruption of the cell cycle by inhibitors of KIF11 and AURKA. HeLa cells were incubated with a combination of SB743921 (1.25 nM), Alisertib (62.5 nM), and MK‐5108 (125 nM). After 18 h, the cells were harvested and analyzed with flow cytometry. The percentage of sub‐G1 cells is indicated. (B) Inhibition of KIF11 and AURKA promotes mitotic catastrophe. Cells were treated as described in panel (A). Cell‐free extracts were prepared and phosphorylated histone H3Ser10 and cleaved PARP1 were detected with immunoblotting. Uniform loading of lysates was confirmed by immunoblotting for actin. (C) Monastrol acts synergistically with AURKAi. HeLa cells were incubated with monastrol (25 μM) in the presence of Alisertib (62.5 nM) or MK‐5108 (125 nM). After 18 h, the cells were harvested and analyzed with flow cytometry. (D) Combination of monastrol and AURKAi promote mitotic catastrophe. Cells were treated as described in panel (C). Cell‐free extracts were prepared and analyzed with immunoblotting. Actin analysis was included to assess protein loading and transfer. (E) Downregulation of AURKA sensitizes cells to SB743921. HeLa cells were transfected with either control or a relatively low concentration of siRNA against AURKA (siAURKA) (22 pM). After 24 h, the cells were treated with either buffer or SB743921 (1.25 nM). After 18 h, the cells were harvested and analyzed with flow cytometry. (F) Downregulation of AURKA sensitizes cells to SB743921. Cells were transfected and treated as described in panel (E). Cell‐free extracts were prepared and analyzed with immunoblotting. Depletion of AURKA and uniform loading of lysates were confirmed by immunoblotting for AURKA and actin respectively. (G) Downregulation of KIF11 sensitizes cells to AURKAi. HeLa cells were transfected with either control or a relatively low concentration of siRNA against KIF11 (siKIF11) (66 pM). After 24 h, the cells were treated with buffer, Alisertib (62.5 nM), or MK‐5108 (125 nM). After 18 h, the cells were harvested and analyzed with flow cytometry. (H) Downregulation of KIF11 sensitizes cells to AURKAi. Cells were transfected and treated as described in panel (G). Cell‐free extracts were prepared and analyzed with immunoblotting. Depletion of KIF11 and uniform loading of lysates were confirmed by immunoblotting for KIF11 and actin respectively.
It should be noted that at the concentrations used here, the Aurora kinase inhibitors should only target AURKA. Using antibodies against the activated forms of Aurora kinases and other functional assays, we found that while MK‐5108 exclusively inhibits AURKA, Alisertib inhibits AURKA at relative low concentrations and inhibits both AURKA and AURKB at higher concentrations (Marxer et al., 2013). Unlike Alisertib, the AURKB‐specific inhibitor Barasertib did not act synergistically with KIF11i (Figure S3). An addition control including a small‐molecule inhibitor of CDK1 (RO3306) (Vassilev et al., 2006) further support the specificity of AURKAi in synergism with KIF11i.
The synergistic actions between inhibitors of KIF11 and AURKA were not limited to one type of KIF11i. Another classic KIF11i (monastrol) also acted in concerted with AURKAi to promote mitotic catastrophe, as indicated by flow cytometry (Figure 4C) and immunoblotting analysis (Figure 4D).
To further verify that the effective target of Alisertib and MK‐5108 in our assays was indeed AURKA, the inhibitors were replaced with a siRNA specific for AURKA (siAURKA). As we aimed to mimic the conditions in which sublethal concentrations of AURKAi were used, a relatively low concentration of siAURKA was used in order to deplete AURKA partially. Figure 4E shows that while neither siAURKA nor SB743921 affected the cell cycle, combination of the two treatments induced G2/M arrest and apoptosis. Protein analysis confirmed the downregulation of AURKA as well as the mitotic block and apoptosis (Figure 4F). Conversely, we also used a siRNA to partially deplete KIF11 (siKIF11) and demonstrated that combining siKIF11 with AURKAi could promote G2/M arrest and apoptosis (Figures 4G and 4H).
Collectively, these results indicate that AURKAi acts synergistically with KIF11i to induce monoastral spindle, mitotic arrest, and eventually cell death.
3.4. KIF11‐independent growth in SB743921‐resistant cell lines
Drug resistance is one of the major obstacles that impairs the usefulness of many chemotherapeutic drugs. We generated SB743921‐resistant cells by exposing HeLa cells to progressively increasing concentrations of SB743921 (Figure 5A), similarly as previously described for another KIF11i called STLC (Raaijmakers et al., 2012). After selection with 5 nM of SB743921, some individual colonies were still sensitive to 10 nM of SB743921 (working concentration) similarly as the parental HeLa cells. However, several cell lines (e.g. SBR1 and SBR4) were unaffected by 10 nM of SB743921 as indicated by their cell cycle profiles (Figure 5B). Moreover, there was no increase in histone H3Ser10 phosphorylation and PARP1 cleavage in SBR1 and SBR4 following SB743921 challenge (Figure 5C). As expected, the SB743921‐resistant cells were able to form bipolar spindle (Figure 5D) and underwent normal anaphase (Figure 5E) even in the presence of SB743921.
Figure 5.
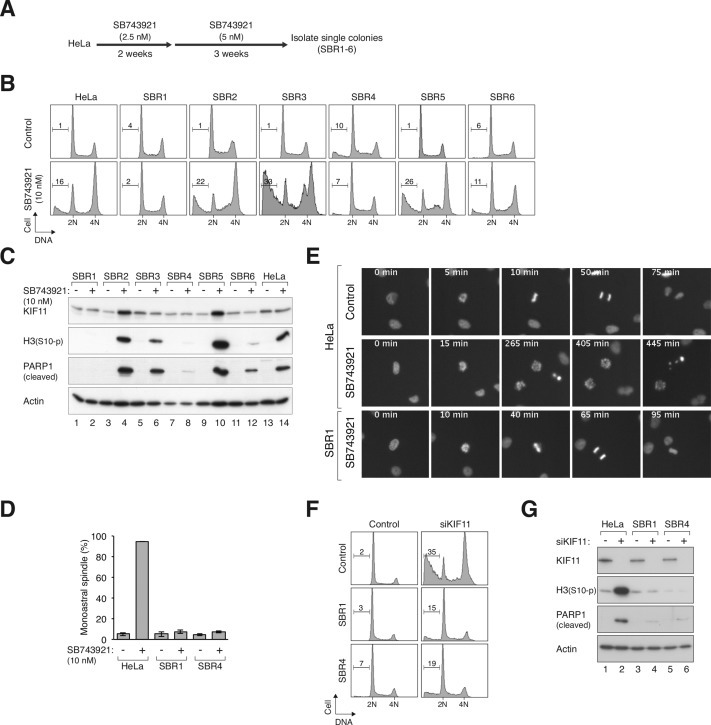
KIF11‐independent growth in SB743921‐resistant cell lines. (A) Isolation of SB743921‐resistant cell lines. HeLa cells were treated with a schedule of increasing concentrations of SB743921 as depicted. Individual colonies that could grow in 5 nM of SB743921 were isolated and designated as SBR1‐6. (B) SB743921‐resistant cells are insensitive to SB743921‐mediated mitotic arrest. The parental HeLa cells and different SB743921‐resistant cell lines were treated with 10 nM of SB743921 for 18 h. The cells were then harvested for cell cycle analysis with flow cytometry. (C) SB743921‐resistant cells are insensitive to SB743921‐mediated mitotic catastrophe. The parental HeLa cells and different SB743921‐resistant cell lines were treated with 10 nM of SB743921 for 18 h. Cell‐free extracts were prepared and the indicated proteins were detected by immunoblotting. (D) SB743921‐resistant cells do not form monoastral spindle upon SB743921 challenge. HeLa, SBR1, and SBR4 cells were treated with SB743921 (10 nM) for 3 h. MG132 was added for another 2 h to trap cells in mitosis. The cells were then fixed and stained with antibodies against γ‐tubulin and α‐tubulin. The percentage of mitotic cells containing monoastral spindle was quantified using fluorescence microscopy (n = 80). Mean ± SD of three independent experiments. (E) SB743921‐resistant cells can undergo normal anaphase in the presence of SB743921. HeLa and SBR1 cells were transfected with a plasmid expressing histone H2B‐GFP. The cells were either untreated or incubated in with SB743921 (10 nM) as indicated, and analyzed using live‐cell imaging. Representative time‐lapse images of mitotic cells are shown. (F) SB743921‐resistant cells can undergo KIF11‐indepenent cell cycle progression. HeLa, SBR1, and SBR4 cells were transfected with control or siKIF11. After 48 h, the cells were harvested and analyzed with flow cytometry. (G) Depletion of KIF11 in SB743921‐resistant cells does not induce mitotic catastrophe. HeLa, SBR1, and SBR4 cells were transfected with control or siKIF11. After 48 h, the cells were harvested and analyzed with immunoblotting.
It is reasonable to surmise that the SB743921‐resistant cell lines could undergo KIF11‐independent mitosis. To test this hypothesis, we depleted KIF11 in these cells with siRNA (siKIF11). In contrast to normal HeLa cells, which underwent G2/M arrest and cell death, SB743921‐resistant cell lines were unaffected by siKIF11 (Figure 5F). Depletion of KIF11 in all the cell lines was confirmed by immunoblotting (Figure 5G). In agreement with the flow cytometry results, neither histone H3Ser10 phosphorylation nor PARP1 cleavage was induced by siKIF11 in the SB743921‐resistant cell lines.
Collectively, these results indicate that SB743921‐resistant cell lines can undergo mitosis without KIF11.
3.5. Compensation of KIF11 in SB743921‐resistant cells by KIF15
What is molecular basis of KIF11‐independent growth? The expression of KIF11 itself probably was not a major factor as it was either unchanged or marginally decreased in some SB743921‐resistant clones (5, 6A). One possibility is that KIF11 functions may be compensated by the kinesin KIF15 as previously reported (Tanenbaum et al., 2009). We found that KIF15 was indeed overexpressed in a subset of the SB743921‐resistant cell lines (e.g. SBR4) (Figure 6A). Consistent with this finding, the mRNA of KIF15 in SBR4 was increased in comparison to HeLa cells (Figure 6B). But KIF15 overexpression did not occur in all SB743921‐resistant cell lines (e.g. SBR1).
Figure 6.
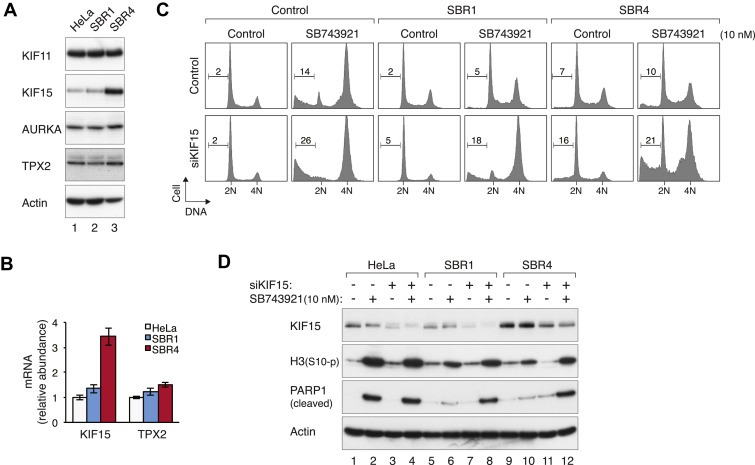
Compensation of KIF11 activity by KIF15. (A) Increase of KIF15 in a subset of SB743921‐resistant cell lines. Protein expression in HeLa, SBR1, and SBR4 cells was detected with immunoblotting. Actin analysis was included to assess protein loading and transfer. (B) The mRNA of KIF15 is elevated in a subset of SB743921‐resistant cell lines. The levels of mRNA of KIF15 and TPX2 in HeLa, SBR1, and SBR4 cells were measured with RT‐PCR. Mean ± SD of six samples (two sets of triplicates). (C) Downregulation of KIF15 overcomes SB743921‐resistance. HeLa, SBR1, and SBR4 cells were transfected with either control or siKIF15. After 24 h, the cells were incubated with either buffer or SB743921 (10 nM) for another 24 h. The cells were then harvested and analyzed with flow cytometry. (D) Downregulation of KIF15 overcomes SB743921‐resistance. HeLa, SBR1, and SBR4 cells were transfected and treated as described in panel (C). Cell‐free extracts were prepared and analyzed with immunoblotting.
To test directly if KIF15 was involved in compensating for the activity of KIF11 in SB743921‐resistant cells, KIF15 was depleted before SB743921 was added. While control SBR1 and SBR4 were resistant to SB743921‐mediated G2/M arrest, they became sensitized to the drug after KIF15 was downregulated (Figure 6C). This was also reflected by the increase in histone H3Ser10 phosphorylation and PARP1 cleavage (Figure 6D). Neither the cell cycle progression (Figure 6C) nor cell death (Figure 6D) was affected by siKIF15 alone.
These data indicate that while a subset of SB743921‐resistant cell lines were characterized by an increase in KIF15, others contained similar levels of KIF15 as control cells. Nevertheless, depletion of KIF15 could sensitize these SB743921‐resistant cell lines to mitotic catastrophe, suggesting that KIF11 functions were in part taken over by KIF15.
3.6. KIF11 drug‐resistance can be overcome by targeting AURKA
Given that no specific inhibitor of KIF15 has been developed yet, we next tested if AURKAi could promote mitotic cell death in SB743921‐resistant cells (Figure 7A). As shown above, SBR1 and SBR4 did not respond to 10 nM of SB743921. Notably, SB743921 alone was incapable to induce mitotic catastrophe in SB743921‐resistant cells even when used at 100 nM (Figure 7B). Co‐treatment with AURKAi, however, induced mitotic arrest in these cell lines (Figure 7A). Mitotic arrest and cell death were confirmed by histone H3Ser10 phosphorylation and PARP1 cleavage, respectively (Figure 7B). In agreement with the inhibition of KIF11 pathway, targeting AURKA promoted monoastral formation in SB743921‐resistant cells (Figure 7C). As expected, the long‐term cell survival of SB743921‐resistant cells treated with SB743921 was also reduced upon co‐incubation with AURKAi (Figure 7D).
Figure 7.
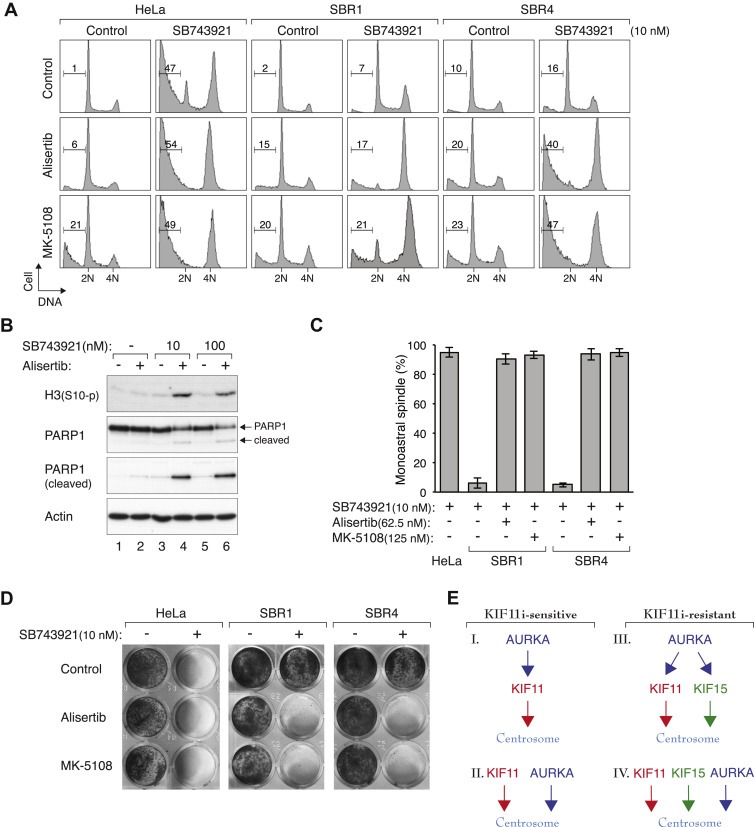
Inhibition of AURKA overcomes KIF11 drug‐resistance. (A) AURKAi and SB743921 act synergistically on SB743921‐resistant cells. HeLa, SBR1, and SBR4 were treated with SB743921 in the presence of either Alisertib (62.5 nM) or MK‐5108 (125 nM) for 18 h before analyzed with flow cytometry. (B) AURKAi and SB743921 overcome SB743921‐resistance. SBR1 cells were treated with SB743921 in the presence or absence of Alisertib (62.5 nM) for 24 h. Cell‐free extracts were prepared and analyzed with immunoblotting. Note that even at a very high concentration, SB743921 (100 nM) alone did not overcome SB743921‐resistance. (C) Targeting AURKA promotes monoastral spindle formation in SB743921‐resistant cells. HeLa, SBR1, and SBR4 were treated with SB743921 (10 nM), Alisertib (62.5 nM), and MK‐5108 (125 nM) for 3 h. The proteasome inhibitor MG132 was added for another 2 h to prevent mitotic exit. The cells were fixed, stained with antibodies against α‐tubulin and γ‐tubulin, and analyzed with fluorescence microscopy. The percentage of mitotic cells containing monoastral spindle is shown (n = 80). Mean ± SD of three independent experiments. (D) Long‐term cell survival of SB743921‐resistant cells is reduced by targeting KIF11 and AURKA. HeLa, SBR1, and SBR4 were plated at low density and cultured in the presence of SB743921 (10 nM), Alisertib (62.5 nM), and MK‐5108 (125 nM). After one week, the cells were fixed and visualized with crystal violet staining. (E) Models of the relationship between AURKA, KIF11, and KIF15 in the regulation of centrosomal functions. In KIF11i‐sensitive cells, AURKA could act upstream of KIF11 (Model I) or in parallel pathways (Model II) in regulating centrosome maturation and separation. In KIF11i‐resistant cells, some of KIF11's functions are compensated by KIF15. AURKA could act upstream of KIF11 and KIF15 (Model III). Alternatively, AURKA could act on the centrosome independently (Model IV). The models are not necessary mutually exclusive.
To ensure that the ability of AURKAi to overcome SB743921‐resistance was not limited to HeLa cells, we also used a similar strategy to generate SB743921‐resistant cell lines based on the lung carcinoma H1299 cells. In contrast to the parental cells, the SB743921‐resistant H1299 cells were insensitive to 10 nM of SB743921 (Figure S4A). Treatment of these cells with AURKAi sensitized them to SB743921 (Figure S4B), indicating that co‐inhibition of KIF11 and AURKA could overcome KIF11i‐resistant cell lines from different origins.
Taken together, these results indicate that targeting AURKA and KIF11 together can overcome drug‐resistance developed against KIF11i.
4. Discussion
KIF11 has been the focus of several drug candidates in development. However, results from clinical trials of the best‐characterized compound, Ispinesib (SB715992), have been unimpressive (Rath and Kozielski, 2012). Encouraging results have been obtained with the second‐generation Ispinesib analog SB743921, with partial response in a cholangiocarcinoma patient and stable disease in patients with relapsed lymphoma or advanced solid tumors (Holen et al., 2011). Reasons that KIF11i in general are only marginally successful in clinical studies may include the lack of potency and development of drug‐resistance. Both of these problems can in principle be tackled by combinatorial treatment with another antimitotic drug. Tests of combinatorial treatment with KIF11i have so far been limited to traditional genotoxic agents (Rath and Kozielski, 2012). Here we discovered that the efficacy of KIF11i could be markedly increased by combination with AURKAi (Alisertib and MK‐5108). Both Alisertib and MK‐5108 are themselves drug candidates undergoing Phase I and II clinical trials (Marzo and Naval, 2013).
Synergism between SB743921 and AURKAi was demonstrated using a number of approaches, including infrared‐ (Figure 2D) and WST‐1‐based (Figure 3A) cell proliferation assays, isobologram analysis (Figure 2D), clonogenic survival assays (Figures 3B and 3C), monoastral spindle formation (Figures 3D and 3E), live‐cell imaging (Figures 3F and 3G), flow cytometry (Figure 4A), and protein analysis (Figure 4B). The specificity of the combinatorial treatment for KIF11 was verified with two different KIF11i (Figures 4C and 4D) and a siRNA against KIF11 (Figures 4G and 4H). Likewise, the specificity for AURKA was validated with two different AURKAi (3, 4) and siRNA against AURKA (Figures 4E and 4F). It was further supported by the fact that an AURKB‐specific inhibitor (Barasertib) did not cooperate with KIF11 inhibition (Figure S3).
These results are consistent with some available data on KIF11i and AURKA. In a study using a KIF11i called KSP‐1A, Jackson et al. found that genes predicting resistance to the KIF11i are enriched on chromosome 20q, a region frequently amplified in tumors (Jackson et al., 2008). Moreover, siRNAs targeting genes in this chromosomal region revealed that disruption of AURKA, TPX2, and MYBL2 enhances response to KIF11i.
What is the mechanistic basis of the link between KIF11 and AURKA? One possibility is that AURKA acts directly on KIF11 (Figure 7E, Model I). Although in Xenopus, the AURKA‐related protein Eg2 associates with and phosphorylates KIF11 (Giet et al., 1999), direct evidence of interaction between human KIF11 and AURKA has yet to be demonstrated. Nevertheless, KIF11 is phosphorylated by other mitotic kinases including CDK1 (Blangy et al., 1995), NEK6 (Rapley et al., 2008), and NEK9 (Bertran et al., 2011). Hence the regulation of KIF11 by AURKA (if any) is unlikely to be exclusive. Unlike the inhibition of KIF11, which induced monoastral spindle, complete inhibition of AURKA mainly resulted in mitotic block with bipolar spindle, with ∼25% of cells showing monopolar and multipolar spindle (Figure S5). This indicates that a simple linear mechanism such as Model I is not sufficient to explain the data.
AURKA itself localizes to centrosomes (Gopalan et al., 1997); and several lines of evidence indicate that AURKA is an important regulator of centrosome function. For example, AURKA is required for centrosome maturation and separation in Drosophila (Berdnik and Knoblich, 2002; Glover et al., 1995). Several proteins, including TACC, LATS2, cyclin B–CDK1, and CDC25B are targeted to the centrosome by AURKA (Fukasawa, 2007). It is possible that due to the distinct functions of AURKA and KIF11 on the centrosome, targeting both proteins together resulted in more extensive defects in centrosome maturation and separation (Figure 7E, Model II).
Remarkably, concurrent inhibition of AURKA and KIF11 also sensitized SB743921‐resistant cells to mitotic catastrophe. A number of underlying mechanisms could be envisaged to account for KIF11i‐resistance. Overexpression of multidrug transporters including P‐glycoprotein is a common mechanism of multidrug‐resistance. Mutations of KIF11 could also render it less sensitive to KIF11i. In this connection, it was reported that Ispinesib‐resistant HCT116 cells contain two point mutations in the KIF11 allosteric binding pocket, D130V and A133D, generating inhibitor‐resistant but otherwise catalytically competent KIF11 (Knight and Parrish, 2008). Interestingly, the mutations do not act through conventional steric effects at the binding site, but through reduction of flexibility and allosteric transmissions after inhibitor binding (Talapatra et al., 2013). Finally, another process specific for antimitotic drug‐resistance is mitotic slippage, by which cells exit mitosis prematurely without sister chromatid separation.
We believe that the above processes (transporter, KIF11 mutation, and mitotic slippage) were unlikely to be explanations for KIF11i‐resistance described here. It is because the SB743921‐resistant cells were insensitive to siRNA‐mediated depletion of KIF11 (Figures 5F and 5G), indicating that they could grow independently of KIF11. Furthermore, KIF11 was still important if KIF15 function was compromised (Figures 6C and 6D). Under these conditions, KIF11 was still sensitive to 10 nM of SB743921 (arguing against the involvement of multidrug transporters and KIF11 mutations) and underwent mitotic arrest (arguing against mitotic slippage).
Several mechanisms that act in parallel to KIF11 in regulating centrosome separation have been described. For example, dynein‐dependent mechanisms may counteract KIF11 in microtubule sliding (Tanenbaum et al., 2008), although there is evidence that dynein may antagonize KIF11 indirectly rather than through a simple push–pull mechanism at the spindle equator (Florian and Mayer, 2012). Other mechanisms that act parallel with KIF11 include EGFR signaling (Mardin et al., 2013), a nuclear envelope‐associated dynein pathway (Raaijmakers et al., 2012), and KIF15 (Tanenbaum et al., 2009). SB743921‐resistance appeared to be due to compensation of KIF11 functions by KIF15. Intriguingly, not all SB743921‐resistant clones contained overexpressed KIF15 mRNA and protein (Figures 6A and 6B). Both types of SB743921‐resistant cells became sensitive to SB743921 after KIF15 was depleted (Figures 6C and 6D). How the unchanged level of KIF15 substituted for KIF11 functions remained to be deciphered. Our data are consistent with a model that in the SB743921‐resistant cells, the usual functions of KIF11 was partially taken over by KIF15. The reasoning is based on the fact that while KIF11i or siKIF15 separately was unable to promote mitotic catastrophe, inhibition of both KIF11 and KIF15 together induced mitotic catastrophe.
Our findings also support that SB743921 does not target KIF15; otherwise SB743921 should be able to trigger a mitotic arrest in SB743921‐resistant cells. The cells were insensitive even when challenged with 100 nM of SB743921, 10x the concentration normally required to induce mitotic arrest (Figure 7B).
As no specific inhibitor of KIF15 has been developed yet, our data indicate that targeting AURKA is an effective option to overcome KIF11i‐resistance (Figure 7). Co‐treatment of SB743921‐resistant cells with AURKAi and SB743921 promoted monoastral spindle formation, mitotic arrest, and cell death. As in KIF11i‐sensitive cells, AURKA could either act upstream of KIF11 (and KIF15) or in an independent pathway (Figure 7E, Models III and IV). Given the effects of AURKAi alone on centrosome (Figure S5), Model IV is perhaps more favorable.
In conclusion, pharmacological inhibition of AURKA can enhance mitotic catastrophe induced by KIF11i, most likely because both AURKA and KIF11 regulate centrosome functions independently. Moreover, targeting AURKA can also overcome KIF15‐dependent KIF11i‐resistance.
Conflict of interest
There is no conflict of interest.
Supporting information
The following are the supplementary data related to this article:
Figure S1 List of chemicals used in screening for synergism with SB743921. The common name, brief description, and final concentration used for each compound are shown. The concentration used for each compound that caused minimal cytotoxicity alone was determined with 10‐fold serial dilution of each compound using the iRFPbased proliferation assay.
Figure S2 The KIF11i SB743921 induces mitotic catastrophe. (A) SB743921 induces a G2/M arrest in HeLa cells at 10 nM. Cells were incubated with either buffer or the indicated concentrations of SB743921 for 24 h. The cells were then harvested and analyzed with flow cytometry. The positions of 2N and 4N DNA contents are indicated. (B) SB743921 induces a mitotic block at 10 nM. HeLa cells were treated with SB743921 as in panel (A). Cell‐free extracts were prepared and the indicated proteins were detected by immunoblotting. The asterisk indicates the gel mobility shift of CDC27. Uniform loading of lysates was confirmed by immunoblotting for actin. (C) SB743921 triggers prolonged mitotic arrest and cell death. HeLa cells expressing histone H2B‐GFP were either untreated or incubated with 10 nM of SB743921. The cells were then imaged using time‐lapse microscopy. Representative time‐lapse images (bright field and GFP channels) of mitotic cells in control and SB743921‐treated samples are shown.
Figure S3 SB743921 does not act synergistically with inhibitors of Aurora B, PLK1, or CDK1.HeLa cells were incubated with either buffer or SB743921 (1.25 nM) in the presence of Alisertib (62.5 nM), Barasertib (12.5 nM), or RO3306 (2.5 μM). After 18 h, the cells were harvested and analyzed with flow cytometry. The concentrations of Barasertib and RO3306 used were the lowest without the chemicals alone causing G2/M arrest.
Figure S4 Inhibition of AURKA overcomes KIF11i‐resistance in H1299 cells. (A) Generation of SB743921‐resistant H1299. H1299 cells were selected with increasing concentrations of SB743921 as described in Materials and Methods. Single colonies were isolated and one of them (SBR1) is shown. H1299 and SBR1 was treated with either buffer or 10 nM of SB743921. After 24 h, the cells were harvested and analyzed with flow cytometry. (B) AURKAi and SB743921 act synergistically on SB743921‐resistant cells. H1299 and one of the SB743921‐resistant cell lines (SBR2) were treated with 10 nM of SB743921 in the presence of either Alisertib (31.3 nM) or MK‐5108 (125 nM) for 18 h before analyzed with flow cytometry.
Figure S5 AURKAi arrests cells in mitosis with mainly bipolar spindle. HeLa cells were incubated with different concentrations of MK‐5108 for 3 h. The proteasome inhibitor MG132 was added for another 2 h to prevent mitotic exit. The cells were fixed, stained with antibodies against α‐tubulin and γ‐tubulin, and analyzed with 3 fluorescence microscopy. The percentage of mitotic cells containing monoastral spindle is shown (n=80).
Acknowledgments
This work was supported in part by the Research Grants Council grants 662213 and T13‐607/12R to R.Y.C.P.
Supplementary data 1.
1.1.
Supplementary data related to this article can be found at http://dx.doi.org/10.1016/j.molonc.2014.05.007.
Ma Hoi Tang, Erdal Sergio, Huang Shan, Poon Randy Y.C., (2014), Synergism between inhibitors of Aurora A and KIF11 overcomes KIF15‐dependent drug resistance, Molecular Oncology, 8, doi: 10.1016/j.molonc.2014.05.007.
References
- Ausubel, F.M. , Brent, R. , Kingston, R.E. , Moore, D.D. , Seidman, J.G. , Smith, J.A. , Struhl, K. , 1995. Current Protocols in Molecular Biology. Massachusetts General Hospital Harvard Medical School; [Google Scholar]
- Berdnik, D. , Knoblich, J.A. , 2002. Drosophila Aurora-A is required for centrosome maturation and actin-dependent asymmetric protein localization during mitosis. Curr. Biol. 12, 640–647. [DOI] [PubMed] [Google Scholar]
- Bertran, M.T. , Sdelci, S. , Regue, L. , Avruch, J. , Caelles, C. , Roig, J. , 2011. Nek9 is a Plk1-activated kinase that controls early centrosome separation through Nek6/7 and Eg5. EMBO J. 30, 2634–2647. [DOI] [PMC free article] [PubMed] [Google Scholar]
- Blangy, A. , Lane, H.A. , d'Herin, P. , Harper, M. , Kress, M. , Nigg, E.A. , 1995. Phosphorylation by p34cdc2 regulates spindle association of human Eg5, a kinesin-related motor essential for bipolar spindle formation in vivo. Cell. 83, 1159–1169. [DOI] [PubMed] [Google Scholar]
- Castillo, A. , Morse, H.C.r , Godfrey, V.L. , Naeem, R. , Justice, M.J. , 2007. Overexpression of Eg5 causes genomic instability and tumor formation in mice. Cancer Res. 67, 10138–10147. [DOI] [PubMed] [Google Scholar]
- Chan, Y.W. , Ma, H.T. , Wong, W. , Ho, C.C. , On, K.F. , Poon, R.Y. , 2008. CDK1 inhibitors antagonize the immediate apoptosis triggered by spindle disruption but promote apoptosis following the subsequent rereplication and abnormal mitosis. Cell Cycle. 7, 1449–1461. [DOI] [PubMed] [Google Scholar]
- Chou, T.C. , Talalay, P. , 1984. Quantitative analysis of dose-effect relationships: the combined effects of multiple drugs or enzyme inhibitors. Adv. Enzyme Regul. 22, 27–55. [DOI] [PubMed] [Google Scholar]
- Chow, J.P. , Man, W.Y. , Mao, M. , Chen, H. , Cheung, F. , Nicholls, J. , Tsao, S.W. , Li Lung, M. , Poon, R.Y. , 2013. PARP1 is overexpressed in Nasopharyngeal carcinoma and its inhibition enhances radiotherapy. Mol. Cancer Ther. 12, 2517–2528. [DOI] [PubMed] [Google Scholar]
- Chow, J.P. , Poon, R.Y. , 2010. Mitotic catastrophe. In Enders G., Cell Cycle Deregulation in Cancer. Springer; New York: 79–96. [Google Scholar]
- Cochran, J.C. , Sontag, C.A. , Maliga, Z. , Kapoor, T.M. , Correia, J.J. , Gilbert, S.P. , 2004. Mechanistic analysis of the mitotic kinesin Eg5. J. Biol. Chem. 279, 38861–38870. [DOI] [PMC free article] [PubMed] [Google Scholar]
- Ding, S. , Xing, N. , Lu, J. , Zhang, H. , Nishizawa, K. , Liu, S. , Yuan, X. , Qin, Y. , Liu, Y. , Ogawa, O. , Nishiyama, H. , 2011. Overexpression of Eg5 predicts unfavorable prognosis in non-muscle invasive bladder urothelial carcinoma. Int. J. Urol. 18, 432–438. [DOI] [PubMed] [Google Scholar]
- Filonov, G.S. , Piatkevich, K.D. , Ting, L.M. , Zhang, J. , Kim, K. , Verkhusha, V.V. , 2011. Bright and stable near-infrared fluorescent protein for in vivo imaging. Nat. Biotechnol. 29, 757–761. [DOI] [PMC free article] [PubMed] [Google Scholar]
- Florian, S. , Mayer, T.U. , 2012. The functional antagonism between Eg5 and dynein in spindle bipolarization is not compatible with a simple push–pull model. Cell Rep. 1, 408–416. [DOI] [PubMed] [Google Scholar]
- Fukasawa, K. , 2007. Oncogenes and tumour suppressors take on centrosomes. Nat. Rev. Cancer. 7, 911–924. [DOI] [PubMed] [Google Scholar]
- Giet, R. , Uzbekov, R. , Cubizolles, F. , Le Guellec, K. , Prigent, C. , 1999. The Xenopus laevis aurora-related protein kinase pEg2 associates with and phosphorylates the kinesin-related protein XlEg5. J. Biol. Chem. 274, 15005–15013. [DOI] [PubMed] [Google Scholar]
- Glover, D.M. , Leibowitz, M.H. , McLean, D.A. , Parry, H. , 1995. Mutations in aurora prevent centrosome separation leading to the formation of monopolar spindles. Cell. 81, 95–105. [DOI] [PubMed] [Google Scholar]
- Gopalan, G. , Chan, C.S. , Donovan, P.J. , 1997. A novel mammalian, mitotic spindle-associated kinase is related to yeast and fly chromosome segregation regulators. J. Cell Biol. 138, 643–656. [DOI] [PMC free article] [PubMed] [Google Scholar]
- Hock, A.K. , Lee, P. , Maddocks, O.D. , Mason, S.M. , Blyth, K. , Vousden, K.H. , 2013. iRFP is a sensitive marker for cell number and tumor growth in high-throughput systems. Cell Cycle. 13, [DOI] [PMC free article] [PubMed] [Google Scholar]
- Holen, K.D. , Belani, C.P. , Wilding, G. , Ramalingam, S. , Volkman, J.L. , Ramanathan, R.K. , Vasist, L.S. , Bowen, C.J. , Hodge, J.P. , Dar, M.M. , Ho, P.T. , 2011. A first in human study of SB-743921, a kinesin spindle protein inhibitor, to determine pharmacokinetics, biologic effects and establish a recommended phase II dose. Cancer Chemother. Pharmacol. 67, 447–454. [DOI] [PMC free article] [PubMed] [Google Scholar]
- Huszar, D. , Theoclitou, M.E. , Skolnik, J. , Herbst, R. , 2009. Kinesin motor proteins as targets for cancer therapy. Cancer Metastasis Rev. 28, 197–208. [DOI] [PubMed] [Google Scholar]
- Jackson, A.L. , Mao, M. , Kobayashi, S. , Ward, T. , Biery, M. , Dai, H. , Bartz, S.R. , Linsley, P.S. , 2008. Chromosome 20q amplification regulates in vitro response to Kinesin-5 inhibitor. Cancer Inform. 6, 147–164. [DOI] [PMC free article] [PubMed] [Google Scholar]
- Knight, S.D. , Parrish, C.A. , 2008. Recent progress in the identification and clinical evaluation of inhibitors of the mitotic kinesin KSP. Curr. Top Med. Chem. 8, 888–904. [DOI] [PubMed] [Google Scholar]
- Lawrence, C.J. , Dawe, R.K. , Christie, K.R. , Cleveland, D.W. , Dawson, S.C. , Endow, S.A. , Goldstein, L.S. , Goodson, H.V. , Hirokawa, N. , Howard, J. , Malmberg, R.L. , McIntosh, J.R. , Miki, H. , Mitchison, T.J. , Okada, Y. , Reddy, A.S. , Saxton, W.M. , Schliwa, M. , Scholey, J.M. , Vale, R.D. , Walczak, C.E. , Wordeman, L. , 2004. A standardized kinesin nomenclature. J. Cell Biol. 167, 19–22. [DOI] [PMC free article] [PubMed] [Google Scholar]
- Liu, M. , Wang, X. , Yang, Y. , Li, D. , Ren, H. , Zhu, Q. , Chen, Q. , Han, S. , Hao, J. , Zhou, J. , 2010. Ectopic expression of the microtubule-dependent motor protein Eg5 promotes pancreatic tumourigenesis. J. Pathol. 221, 221–228. [DOI] [PubMed] [Google Scholar]
- Mardin, B.R. , Isokane, M. , Cosenza, M.R. , Kramer, A. , Ellenberg, J. , Fry, A.M. , Schiebel, E. , 2013. EGF-induced centrosome separation promotes mitotic progression and cell survival. Dev. Cell. 25, 229–240. [DOI] [PMC free article] [PubMed] [Google Scholar]
- Marxer, M. , Ma, H.T. , Man, W.Y. , Poon, R.Y. , 2013. p53 deficiency enhances mitotic arrest and slippage induced by pharmacological inhibition of Aurora kinases. Oncogene. 10.1038/onc.2013.325 in press [DOI] [PubMed] [Google Scholar]
- Marzo, I. , Naval, J. , 2013. Antimitotic drugs in cancer chemotherapy: promises and pitfalls. Biochem. Pharmacol. 86, 703–710. [DOI] [PubMed] [Google Scholar]
- Mayer, T.U. , Kapoor, T.M. , Haggarty, S.J. , King, R.W. , Schreiber, S.L. , Mitchison, T.J. , 1999. Small molecule inhibitor of mitotic spindle bipolarity identified in a phenotype-based screen. Science. 286, 971–974. [DOI] [PubMed] [Google Scholar]
- On, K.F. , Chen, Y. , Ma, H.T. , Chow, J.P. , Poon, R.Y. , 2011. Determinants of mitotic catastrophe on abrogation of the G2 DNA damage checkpoint by UCN-01. Mol. Cancer Ther. 10, 784–794. [DOI] [PubMed] [Google Scholar]
- Poon, R.Y. , Toyoshima, H. , Hunter, T. , 1995. Redistribution of the CDK inhibitor p27 between different cyclin.CDK complexes in the mouse fibroblast cell cycle and in cells arrested with lovastatin or ultraviolet irradiation. Mol. Biol. Cell. 6, 1197–1213. [DOI] [PMC free article] [PubMed] [Google Scholar]
- Raaijmakers, J.A. , van Heesbeen, R.G. , Meaders, J.L. , Geers, E.F. , Fernandez-Garcia, B. , Medema, R.H. , Tanenbaum, M.E. , 2012. Nuclear envelope-associated dynein drives prophase centrosome separation and enables Eg5-independent bipolar spindle formation. EMBO J. 31, 4179–4190. [DOI] [PMC free article] [PubMed] [Google Scholar]
- Rapley, J. , Nicolas, M. , Groen, A. , Regue, L. , Bertran, M.T. , Caelles, C. , Avruch, J. , Roig, J. , 2008. The NIMA-family kinase Nek6 phosphorylates the kinesin Eg5 at a novel site necessary for mitotic spindle formation. J. Cell Sci. 121, 3912–3921. [DOI] [PMC free article] [PubMed] [Google Scholar]
- Rath, O. , Kozielski, F. , 2012. Kinesins and cancer. Nat. Rev. Cancer. 12, 527–539. [DOI] [PubMed] [Google Scholar]
- Shu, X. , Royant, A. , Lin, M.Z. , Aguilera, T.A. , Lev-Ram, V. , Steinbach, P.A. , Tsien, R.Y. , 2009. Mammalian expression of infrared fluorescent proteins engineered from a bacterial phytochrome. Science. 324, 804–807. [DOI] [PMC free article] [PubMed] [Google Scholar]
- Siu, W.Y. , Arooz, T. , Poon, R.Y. , 1999. Differential responses of proliferating versus quiescent cells to adriamycin. Exp. Cell Res. 250, 131–141. [DOI] [PubMed] [Google Scholar]
- Talapatra, S.K. , Anthony, N.G. , Mackay, S.P. , Kozielski, F. , 2013. Mitotic kinesin Eg5 overcomes inhibition to the phase I/II clinical candidate SB743921 by an allosteric resistance mechanism. J. Med. Chem. 56, 6317–6329. [DOI] [PubMed] [Google Scholar]
- Tanenbaum, M.E. , Macurek, L. , Galjart, N. , Medema, R.H. , 2008. Dynein, Lis1 and CLIP-170 counteract Eg5-dependent centrosome separation during bipolar spindle assembly. EMBO J. 27, 3235–3245. [DOI] [PMC free article] [PubMed] [Google Scholar]
- Tanenbaum, M.E. , Macurek, L. , Janssen, A. , Geers, E.F. , Alvarez-Fernandez, M. , Medema, R.H. , 2009. Kif15 cooperates with eg5 to promote bipolar spindle assembly. Curr. Biol. 19, 1703–1711. [DOI] [PubMed] [Google Scholar]
- Vassilev, L.T. , Tovar, C. , Chen, S. , Knezevic, D. , Zhao, X. , Sun, H. , Heimbrook, D.C. , Chen, L. , 2006. Selective small-molecule inhibitor reveals critical mitotic functions of human CDK1. Proc. Natl. Acad. Sci. U S A. 103, 10660–10665. [DOI] [PMC free article] [PubMed] [Google Scholar]
- Yam, C.H. , Siu, W.Y. , Lau, A. , Poon, R.Y. , 2000. Degradation of cyclin A does not require its phosphorylation by CDC2 and cyclin-dependent kinase 2. J. Biol. Chem. 275, 3158–3167. [DOI] [PubMed] [Google Scholar]
Associated Data
This section collects any data citations, data availability statements, or supplementary materials included in this article.
Supplementary Materials
The following are the supplementary data related to this article:
Figure S1 List of chemicals used in screening for synergism with SB743921. The common name, brief description, and final concentration used for each compound are shown. The concentration used for each compound that caused minimal cytotoxicity alone was determined with 10‐fold serial dilution of each compound using the iRFPbased proliferation assay.
Figure S2 The KIF11i SB743921 induces mitotic catastrophe. (A) SB743921 induces a G2/M arrest in HeLa cells at 10 nM. Cells were incubated with either buffer or the indicated concentrations of SB743921 for 24 h. The cells were then harvested and analyzed with flow cytometry. The positions of 2N and 4N DNA contents are indicated. (B) SB743921 induces a mitotic block at 10 nM. HeLa cells were treated with SB743921 as in panel (A). Cell‐free extracts were prepared and the indicated proteins were detected by immunoblotting. The asterisk indicates the gel mobility shift of CDC27. Uniform loading of lysates was confirmed by immunoblotting for actin. (C) SB743921 triggers prolonged mitotic arrest and cell death. HeLa cells expressing histone H2B‐GFP were either untreated or incubated with 10 nM of SB743921. The cells were then imaged using time‐lapse microscopy. Representative time‐lapse images (bright field and GFP channels) of mitotic cells in control and SB743921‐treated samples are shown.
Figure S3 SB743921 does not act synergistically with inhibitors of Aurora B, PLK1, or CDK1.HeLa cells were incubated with either buffer or SB743921 (1.25 nM) in the presence of Alisertib (62.5 nM), Barasertib (12.5 nM), or RO3306 (2.5 μM). After 18 h, the cells were harvested and analyzed with flow cytometry. The concentrations of Barasertib and RO3306 used were the lowest without the chemicals alone causing G2/M arrest.
Figure S4 Inhibition of AURKA overcomes KIF11i‐resistance in H1299 cells. (A) Generation of SB743921‐resistant H1299. H1299 cells were selected with increasing concentrations of SB743921 as described in Materials and Methods. Single colonies were isolated and one of them (SBR1) is shown. H1299 and SBR1 was treated with either buffer or 10 nM of SB743921. After 24 h, the cells were harvested and analyzed with flow cytometry. (B) AURKAi and SB743921 act synergistically on SB743921‐resistant cells. H1299 and one of the SB743921‐resistant cell lines (SBR2) were treated with 10 nM of SB743921 in the presence of either Alisertib (31.3 nM) or MK‐5108 (125 nM) for 18 h before analyzed with flow cytometry.
Figure S5 AURKAi arrests cells in mitosis with mainly bipolar spindle. HeLa cells were incubated with different concentrations of MK‐5108 for 3 h. The proteasome inhibitor MG132 was added for another 2 h to prevent mitotic exit. The cells were fixed, stained with antibodies against α‐tubulin and γ‐tubulin, and analyzed with 3 fluorescence microscopy. The percentage of mitotic cells containing monoastral spindle is shown (n=80).