

Abstract
Extensive research has demonstrated a tumor‐promoting role of increased WNT5A expression in malignant melanoma. However, very little light has been shed upon how WNT5A expression is up‐regulated in melanoma. A potential regulator of WNT5A expression is the pro‐inflammatory cytokine Interleukin (IL)‐6, which shares the ability of WNT5A to increase melanoma cell invasion. Here, we investigate whether IL‐6 can promote melanoma cell motility through an increased expression of WNT5A. We clearly demonstrate that the WNT5A‐antagonistic peptide Box5 could inhibit IL‐6‐induced melanoma cell migration and invasion. Furthermore, IL‐6 stimulation of the human melanoma cell lines HTB63 and A375 increased the expression of WNT5A in a dose‐dependent manner. To identify the signaling mechanism responsible for this up‐regulation, we explored the involvement of the three main signals induced by IL‐6; STAT3, Akt and ERK 1/2. Of these, only STAT3 was activated by IL‐6 in the melanoma cell lines tested. However, the STAT3 inhibitor S3I‐201 failed to inhibit IL‐6‐induced WNT5A up‐regulation in HTB63 and A375 cells. Nor did STAT3 siRNA silencing affect the expression of WNT5A. In search of an alternative signaling mechanism, we detected IL‐6‐induced activation of p38‐MAPK in HTB63 and A375 cells. The p38‐MAPK inhibitor SB203580 abolished the IL‐6‐induced WNT5A up‐regulation and blocked IL‐6‐induced melanoma cell invasion. The latter effect could be rescued by the addition of recombinant WNT5A. Notably, immunoprecipitation analysis revealed that only the p38α‐MAPK isoform was activated by IL‐6, and subsequent siRNA silencing of p38α‐MAPK abolished the IL‐6‐induced up‐regulation of WNT5A. Taken together, we demonstrate a novel link between the two melanoma pro‐metastatic agents IL‐6 and WNT5A explaining how IL‐6 can increase melanoma cell invasion and thus promote the metastatic process. This finding provides a basis for future therapeutic intervention of melanoma progression.
Keywords: WNT5A, Interleukin-6, STAT3, p38 MAPK, Melanoma, Cell motility
Highlights
We provide a novel link between the melanoma pro‐metastatic agents IL‐6 and WNT5A.
WNT5A signaling plays an important role in IL‐6‐induced melanoma cell motility.
IL‐6 can increase WNT5A expression by STAT3‐independent signaling in melanoma cells.
IL‐6‐induced WNT5A expression is mediated through p38α‐MAPK activation.
Abbreviations
- WNT5A
wingless-type mammary tumor virus integration site family member 5A
- ERK1/2
extracellular-signal-regulated kinases 1 and 2
- p38-MAPK
p38 mitogen-activated protein kinase
1. Introduction
Cutaneous melanoma is one of the fastest growing forms of cancer. Although highly curable at an early stage, once the tumor reaches stages synonymous with distant metastases, the median survival is dramatically decreased to 6–9 months (Tarhini and Agarwala, 2006). In an effort to identify genes whose dysregulation could be linked with the invasive capability of melanoma cells, Bittner et al. published the discovery of several markers that could potentially contribute to the highly metastatic nature of the disease. In particular, high transcription levels of the WNT‐gene family member WNT5A were observed to correlate with increased invasiveness of the melanoma cells (Bittner et al., 2000). This correlation was later confirmed, and WNT5A was shown to directly affect melanoma cell motility and invasion (Weeraratna et al., 2002).
In numerous studies of different tumor cells, WNT5A has been characterized as a non‐canonical WNT ligand, meaning that it elicits intracellular β‐catenin‐independent signaling, including the activation of small GTPases, such as Rho, Rac and Cdc42, and of calcium (Ca2+)‐dependent proteins such as PKC (Camilli and Weeraratna, 2010; Jenei et al., 2009; Kikuchi et al., 2012; Prasad et al., 2013). Recently, however, Grossmann et al. demonstrated the ability of WNT5A to increase β‐catenin signaling in a subset of melanoma cells (Grossmann et al., 2013). This sometimes ambiguous and highly complex signaling downstream of WNT5A is controlled and orchestrated by a plethora of different WNT‐receptors and co‐receptors, including members of the Frizzled‐family, ROR1, ROR2 and RYK (Kikuchi et al., 2012; O'Connell et al., 2013; O'Connell and Weeraratna, 2009), and most recently, LRP6 (Grossmann et al., 2013).
For more than a decade, the consequences of increased WNT5A expression in melanoma have been thoroughly studied, resulting in a deeper understanding of the mechanisms through which WNT5A can drive cell migration and invasion (Dissanayake et al., 2007; O'Connell et al., 2010; Weeraratna et al., 2002; Witze et al., 2013). However, despite this overall consensus regarding WNT5A's tumor‐promoting role, very little is known about how the expression of WNT5A is regulated. We have previously demonstrated that the cytokine tumor growth factor β1 (TGFβ1) can positively regulate the expression of WNT5A in melanoma cells (Jenei et al., 2009). Interestingly, in cardiomyocytes, two cytokines of the IL‐6‐family, leukemia inhibitory factor (LIF) and cardiotrophin‐1 (CT‐1), were shown to increase the expression of WNT5A through a STAT3‐dependent mechanism (Fujio et al., 2004). These results emphasize the importance of extracellular cues in the control of WNT5A expression, and it is reasonable to speculate that other cytokines of the IL‐6 family could have the same regulatory effects.
The pro‐inflammatory cytokine IL‐6 (Heinrich et al., 1998) is one of these potential candidates. In melanoma, IL‐6 is of particular importance, as its level of expression is increased during the progression of the disease and is correlated with reduced overall patient survival (Hoejberg et al., 2012; Moretti et al., 1999). The tumor‐promoting role of IL‐6 was initially attributed to its regulation of cell proliferation and survival; however, more recent studies have highlighted the ability of IL‐6 to drive melanoma cell invasion (Kushiro et al., 2012; Sanz‐Moreno et al., 2011). The increased level of IL‐6 is believed to originate directly from the tumor cells, and in vitro ELISA‐based analysis of melanoma cells has revealed that some cell lines can produce and secrete IL‐6 in concentrations exceeding 10 ng/ml (Dissanayake et al., 2008). After secretion, IL‐6 signals through a transmembrane receptor complex, consisting of glycoprotein 130 (gp130) and IL‐6‐receptor α (IL‐6Rα). While gp130 is expressed in all cell types, the expression of IL‐6Rα is mainly restricted to hepatocytes and various inflammatory cells (Eulenfeld et al., 2012). However, during melanoma progression, the tumor cells can initiate the expression of IL‐6Rα, enabling an autocrine or paracrine function of IL‐6 in melanoma (Moretti et al., 1999). These results highlight the important role of IL‐6 in the progression of the disease. Binding of IL‐6 to the receptor complex elicits different cellular responses, many of which are controlled by the activation of transcription factors of the STAT‐family. However, under circumstances regulated by the phosphorylation status within gp130, IL‐6 can also initiate activation of the PI3K/Akt and Ras/Raf/ERK1/2‐signaling pathways. Although it is able to activate several different signaling pathways, most of the cellular responses induced by IL‐6 are considered to be downstream of the activation of STAT3 (Eulenfeld et al., 2012).
The transcription factor STAT3 is constitutively activated in several types of cancer, and it can control the transcription of multiple target genes and thereby regulate several tumorigenic hallmarks, such as cell proliferation, apoptosis and metastasis (Johnston and Grandis, 2011). In melanoma, increased STAT3 activity was detected in brain metastases compared to primary melanoma specimens. Further examination revealed the ability of STAT3 to promote tumor invasion via the transcriptional regulation of matrix metalloproteinase‐2 (MMP‐2) (Xie et al., 2006). Although MMP‐2 is regarded as one of the key regulators of melanoma metastasis, it is likely that the metastatic process also depends on the regulation of other STAT3 target genes. Interestingly, the WNT5A gene has been shown to contain STAT3 binding sites (Katoh and Katoh, 2005, 2007).
In this study, we report that IL‐6‐induced melanoma cell motility is mediated through an up‐regulation of WNT5A. Surprisingly, however, we demonstrate that IL‐6 can increase the expression of WNT5A independently of STAT3. Instead, we demonstrate a key role of p38α‐MAPK activation in the IL‐6 induced expression of WNT5A. Our results demonstrate a novel regulatory mechanism of WNT5A expression that potentially can be targeted to prevent melanoma metastasis.
2. Materials and methods
2.1. Cell culture and treatment
The human melanoma cell line WM852 was obtained from the Wistar Institute, whereas the HTB63, A375 and A2058 cell lines were purchased from ATCC. These cell lines harbor known recurrent melanoma‐related mutations that affect the RAS/RAF/MEK/ERK (WM852: NRAS61R; HTB63: BRAFV600E; A375: BRAFV600E; A2058: BRAFV600E) and the PI3K/Akt (WM852: PTEN del; HTB63: PTEN del; A2058: PTEN del) signaling pathways. All cell lines were regularly tested for their absence of mycoplasma contamination (EZ‐PCR kit by Biological Industries). The cells were grown in RPMI‐1640 (WM852), McCoy's 5A (HTB63) and DMEM media (A375 and A2058), which were supplemented with 10% FBS, 1 U/ml penicillin, 1 μg/ml streptomycin and 2 mM l‐glutamine. All cell lines were routinely serum starved in 1% FBS‐supplemented media for approximately 24 h prior to each experiment. In treatments where either the STAT3 inhibitor S3I‐201 (Sigma; 100 μM) or the p38‐MAPK inhibitor SB203580 (Sigma; 10 μM) were used in combination with IL‐6, the cells were always pre‐treated with the indicated inhibitor or DMSO alone for 2 h prior to any further treatments. The final concentration of DMSO never exceeded 0.4% (v/v).
2.2. Cell migration
Following serum starvation, the cells were detached with Versene and resuspended in cell media supplemented with 1% FBS; the cell concentration was then calculated using an automated cell counter (Countess™, Invitrogen). At the start of each experiment, 50,000 cells were suspended in 0.5 ml low serum media (only supplemented with 1% FBS) and added to cell culture inserts (BD Bioscience) with 8‐μm pore‐size membranes in the absence or presence of recombinant IL‐6 (Peprotech; 20 ng/ml) and Box5 (Calbiochem; 100 or 500 μM). The inserts were then placed in a 24‐well plate containing 750 μl cell media supplemented with 10% FBS, and the cells were allowed to migrate for 24 h at 37 °C in a humidified atmosphere of 5% CO2. The rate of migration was analyzed according to a protocol previously published by Broom et al. (Broom et al., 2009). Briefly, after fixation and staining of the migrated cells with crystal violet, the membranes were thoroughly washed in PBS to carefully remove residual staining solution. The membranes were then excised, the remaining dye was solubilized using a 10% SDS solution, and the absorbance was measured at 590 nm.
2.3. Cell invasion
Cell invasion was analyzed using the same protocol as for cell migration, but with the use of matrigel pre‐coated cell culture inserts (BD Bioscience) with 8‐μm pore‐size membranes. The invasive capability was analyzed in the presence or absence of recombinant IL‐6 (20 ng/ml), Box5 (100 μM), SB203580 (Sigma; 10 μM) and recombinant WNT5A (R&D Systems; 0.2 μg/ml). Following siRNA silencing of WNT5A in HTB63 cells (Supplementary Figure 2A) there was a reduced number of invaded cells and therefore these experiments were manually counted using an inverted light microscope (Nikon TMS) instead of analyzed as described for the migration method.
2.4. Gelatin‐FITC degradation assay
Forty‐eight hours post‐transfection of HTB63 cells with NC siRNA (100 nM), WNT5A siRNA #1 (100 nM) or WNT5A siRNA #2 (100 nM), the cells were detached with Versene and resuspended in cell media supplemented with 10% FBS; the cell concentration was then calculated using an automated cell counter. At the start of each experiment, 15,000 cells were suspended in 0.5 ml cell media supplemented with 10% FBS and added to each well of a 8‐well glass chamber slide (BD Bioscience) coated with gelatin‐FITC according to the manufacturer's instructions (#ECM670, Millipore). The cells were then allowed to degrade the gelatin‐FITC coating for 24 h at 37 °C in a humidified atmosphere of 5% CO2. Next, the cells were fixed with 4% paraformaldehyde, stained with Phalloidin‐TRITC and DAPI and mounted with cover slip glasses using Fluorescent Mounting Medium (Dako). Four representative fields of each treatment were captured at 20x magnification using a confocal microscope (Zeiss LSM 700). Area of gelatin‐FITC degradation (loss of FITC signal) and total cell area (Phalloidin‐TRITC signal) were calculated using the ImageJ software (National Institute of Health). The number of DAPI‐stained nuclei were manually counted to ascertain that an equal number of cells were analyzed for each treatment.
2.5. Western blotting
Sample protein extraction and concentration determination were performed as previously described (Prasad et al., 2013). Briefly, equal amounts of total protein (10–15 μg) were prepared in 4x Laemmli buffer and heated to 95 °C for 5 min prior to loading on an SDS‐PAGE gel. After separation and transfer of the proteins to PVDF membranes, the membranes were blocked and subsequently probed with the following antibodies: from R&D Systems, anti‐WNT5A (1:100); from Cell Signaling Technology, anti‐phospho‐STAT3 (Tyr705) (1:1000), anti‐phospho‐STAT3 (Ser727) (1:1000), anti‐STAT3 (1:2000), anti‐phospho‐Akt (1:1000), anti‐Akt (1:2000), anti‐phospho‐ERK 1/2 (1:1000), anti‐ERK 1/2 (1:2000), anti‐phospho‐p38 MAPK (1:1000), anti‐p38α MAPK (1:1000), anti‐p38β MAPK (1:1000), anti‐p38γ MAPK (1:1000), anti‐p38δ MAPK (1:1000) and anti‐p38 MAPK (1:1000); from Santa Cruz Biotechnology, anti‐Bcl‐2 (1:1000), anti‐MMP‐9 (1:1000), and anti‐α‐tubulin (1:30,000); and from Abcam, anti‐c‐Myc (1:5000) and anti‐β‐actin (1:30,000). After washing, the membranes were incubated with either secondary rabbit anti‐goat or goat anti‐rabbit/mouse HRP‐conjugated antibodies (Dako). Following a second wash, the separated protein bands were visualized using Immobilon™ Western Chemiluminescence HRP substrate (Millipore) and imaged and analyzed using the ChemiDoc™ imaging system (Bio‐Rad). Densitometric quantifications of relative protein expression were carried out by calculating the band volume intensity using the Image Lab 3.0 software (Bio‐Rad).
2.6. siRNA transfections
Transient siRNA transfections were performed with the Lipofectamine 2000 reagent (Invitrogen), according to the manufacturer's instructions. The following siRNA oligonucleotides were used: from Invitrogen, anti‐WNT5A siRNA #1 (s14871; 100 nM), anti‐WNT5A siRNA #2 (s14872; 100 nM), anti‐STAT3 siRNA (s743; 50 nM), Negative Control siRNA #1 (#4390843; 100 and 50 nM, respectively) and from Thermo Scientific, p38α‐MAPK ON‐TARGETplus® SMARTpool siRNA (#L‐003512‐00; 50 nM), p38β‐MAPK ON‐TARGETplus® SMARTpool siRNA (#L‐003972‐00; 50 nM) and Negative Control ON‐TARGETplus® siRNA (#D‐001810‐01; 50 nM). After 5 h, the transfection complex was replaced with fresh cell media supplemented with 10% FBS, and the cells were subsequently allowed to grow for 48 or 72 h prior to analysis or further treatment.
2.7. 5‐Aza‐2′‐deoxycytidine treatment
A2058 cells incubated in DMEM supplemented with 10% FBS, 1 U/ml penicillin, 1 μg/ml streptomycin and 2 mM l‐glutamine were treated with DMSO alone or 5‐Aza‐2′‐deoxycytidine (5‐Aza; 5 μM; Sigma) in 6‐well plates for 48 h. The cell medium was replaced after 24 h to provide the cells with fresh 5‐Aza. After the treatment, cells were washed in PBS and RNA was extracted as described below.
2.8. RNA extraction, reverse transcriptase PCR and quantitative real‐time PCR
RNA was extracted using the RNeasy Plus kit (Qiagen) according to the manufacturer's instructions. Equal amounts (1 μg) of RNA from each sample were used for cDNA synthesis using random primers and M‐MuLV reverse transcriptase enzyme (Thermo Scientific). QPCR analysis was carried out on a Stratagene Mx3005P system (Agilent Technologies) using Maxima SYBR Green/Rox, according to the manufacturer's instructions (Thermo Scientific). For sample loading control, GAPDH, hypoxanthine phosphoribosyltransferase 1 (HPRT1) and TATA‐binding protein (TBP) were tested, and TBP was found to be the most evenly expressed among the different melanoma cell lines used. Furthermore, the expression of TBP remained unchanged throughout all the treatments. The primers used were as follows: WNT5A‐Fw (5′‐TCAGGACCACATGCAGTA‐3′), WNT5A‐Rv (5′‐CTCATGGCGTTCACCACC‐3′), TBP‐Fw (5′‐GACTCTCACAACTGCACCCTTGCC‐3′), and TBP‐Rv (5′‐TTTGCAGCTGCGGTACAATCCCAG‐3′).
2.9. Immunoprecipitation of phosphorylated p38‐MAPK isoforms
To determine the p38‐MAPK isoform (s) activated by recombinant IL‐6 treatment, the p38 MAPK Isoform Activation Antibody Sampler Kit (#9790, Cell Signaling) was used. Prior to immunoprecipitation, HTB63 cells were serum starved and treated with carrier (0.1% BSA in PBS) or recombinant IL‐6 (20 ng/ml) for 30 min at 37 °C in a humidified atmosphere of 5% CO2. The cells were then washed in cold PBS and lyzed (at 4 °C) in Assay/Lysis Buffer (#240102, Cell Biolabs) supplemented with phosphatase (PhoSTOP, Roche) and protease inhibitors (cOmplete Mini, Roche). The lysates were centrifuged (14,000× g, 5 min, 4 °C) and the supernatants were collected and analyzed for protein concentration using the Pierce® BCA Protein Assay kit (Thermo Scientific). Next, the supernatants were adjusted to equal concentrations, pre‐cleared with unconjugated protein g agarose beads (30 min, 4 °C), centrifuged (14,000× g, 1 min, 4 °C) and a sample from each supernatant was stored for Western blot analysis of equal loading. The remaining adjusted and pre‐cleared supernatants were thoroughly mixed with anti‐phospho‐p38 MAPK (Thr180/Tyr182) (1:400) or rabbit control IgG and protein g agarose beads; the immunoprecipitation was then performed overnight at 4 °C with gentle rocking. Following immunoprecipitation, the beads in each sample were centrifuged (3000× g, 30 s, 4 °C), washed, and resuspended in 2x Laemmli buffer. After heating to 95 °C for 5 min under reducing conditions, equal volumes from each sample were loaded onto 10% SDS‐PAGE gels, separated and finally transferred to PVDF membranes. Western blot analyses (described above) of these membranes were then carried out in parallel to detect the relative content of p38‐MAPK isoforms (α, β, γ and δ) or the loading controls α‐tubulin and total p38‐MAPK.
2.10. Statistical analysis
Statistical analysis was performed with the GraphPad Prism 5.0 software. Significant differences between two groups were determined by Student's t test and between multiple groups using analysis of variance (ANOVA). Analyses comparing the dose‐dependent expression of WNT5A were checked for significance after ANOVA using a Dunnett's multiple comparison test. All other multiple group analyses were checked for significance after ANOVA using a Bonferroni's multiple comparison test. All data are expressed as the means ± S.E.M and were considered to be significant if the p value was less than 0.05.
3. Results
3.1. The WNT5A‐antagonistic peptide Box5 inhibits IL‐6‐induced melanoma cell migration in HTB63 and A375 cells
We previously reported that a WNT5A‐derived and t‐butyloxycarbonyl‐modified hexapeptide (Box5) could block WNT5A‐induced cellular responses (Jenei et al., 2009; Sherwood et al., 2013), including migration and invasion of melanoma cells (Jenei et al., 2009). To explore if IL‐6‐induced melanoma cell motility is dependent on up‐regulation of WNT5A, we assessed the effects of the Box5 peptide on IL‐6‐induced migration in four different melanoma cell lines; WM852, HTB63, A375 and A2058. Interestingly, stimulating HTB63 and A375 cells with recombinant IL‐6 led to a significant increase in cell migration, an effect that could be reduced by co‐treating the cells with Box5 (Figure 1B and C). Using the same experimental set‐up we found no changes in the migratory capacity of WM852 and A2058 cells after treatment with either recombinant IL‐6 alone or in combination with Box5 (Figure 1A and D). These findings were tested by analyzing how IL‐6 affected the infiltrating capacity of invasive HTB63 cells through a reconstituted basement membrane. In support of previous results, the IL‐6‐induced invasiveness was almost completely abolished after co‐treatment with Box5 (Supplementary Figure 1). Our results confirm previous findings that IL‐6 induces melanoma cell motility, but also demonstrate the presence of melanoma cells whose ability to migrate is not affected by the cytokine. Most interestingly, however, our results suggest that regulation of WNT5A expression could play an important role in IL‐6‐induced melanoma cell motility.
Figure 1.
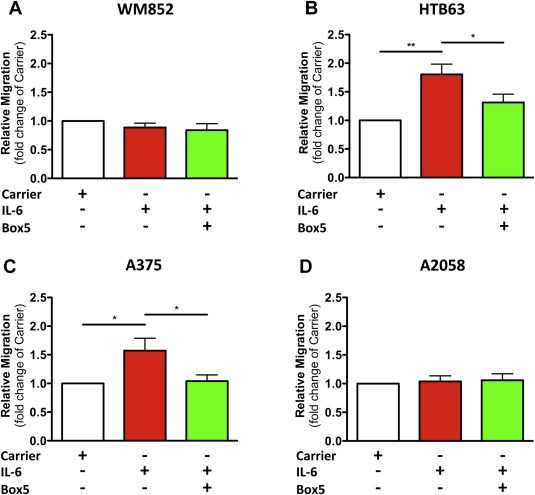
The WNT5A‐antagonistic peptide Box5 inhibits IL‐6‐induced melanoma cell migration. (A–D) The panels show transwell migration assay results of human WM852, HTB63, A375 and A2058 melanoma cells treated with either Carrier (0.1% BSA in PBS) alone or recombinant IL‐6 (20 ng/ml) in the absence or presence of Box5 (100 μM). The migration assays were performed over 24 h (n = 4) and analyzed as described in Materials and methods. The results are given as means and S.E.M; *, p < 0.05; **, p < 0.01.
3.2. Detection of endogenous WNT5A expression in human melanoma cell lines
To investigate the potential ability of IL‐6 to regulate WNT5A expression, we intended to analyze the level of endogenous WNT5A expression in the four melanoma cell lines, studied in Figure 1, using a commercially available polyclonal antibody from R&D Systems. Initially, we were confused by the detection of two distinct protein bands at approximately 40‐kDa in the WNT5A expressing cell line HTB63 (Figure 2A; Jenei et al., 2009). Because WNT5A has a theoretical molecular weight of approximately 38 kDa and is also subjected to palmitoylation and glycosylation (Kurayoshi et al., 2007), any or both of the two distinct bands of approximately 40‐kDa could potentially represent WNT5A. We therefore investigated the effect of siRNA interference on the endogenous WNT5A expression in HTB63 cells, using two different anti‐WNT5A siRNA oligos. Western blot analysis of the cell lysates 48 and 72 h post‐transfection revealed a significantly reduced expression of the upper protein band (Figure 2A) that correlated with the down‐regulation of WNT5A mRNA expression (Figure 2B). Furthermore, when recombinant WNT5A was added to the MDA‐468 cell lysate, lacking an endogenous expression of WNT5A (Säfholm 2006), this resulted in the addition of a prominent band perfectly aligned with the upper band from the other cell lysates (Figure 2A). In a functional assay we found that the two anti‐WNT5A siRNA oligos independently impaired the invasive capacity of HTB63 cells, as demonstrated by their reduced ability to infiltrate a Matrigel‐coated membrane (Supplementary Figure 2A) as well as their ability to enzymatically degrade the reconstituted extracellular matrix component collagen (gelatin; Supplementary Figure 2B). Consequently, the upper band of approximately 45 kDa represents WNT5A and its expression correlates with the invasive properties of HTB63 cells. The analysis of WNT5A protein expression in the four melanoma cell lines used in Figure 1 revealed that WM852, HTB63 and A375 cells all express WNT5A, although at different levels (Figure 2C). In agreement, a higher concentration of Box5 (500 μM) was required to reduce the basal migration of WM852 cells (Supplementary Figure 3) as compared to the lower concentration (100 μM) needed to reduce the basal migration of HTB63 cells (Jenei et al., 2009). In contrast to WM852, HTB63 and A375 cells, A2058 cells did not exhibit a detectable level of WNT5A protein expression (Figure 2C). In good agreement, the relative intensities of the upper band correlated well with the WNT5A mRNA expression levels of the different melanoma cell lines (Figure 2D), thus supporting that the upper protein band detected in the cell lysates was indeed WNT5A.
Figure 2.
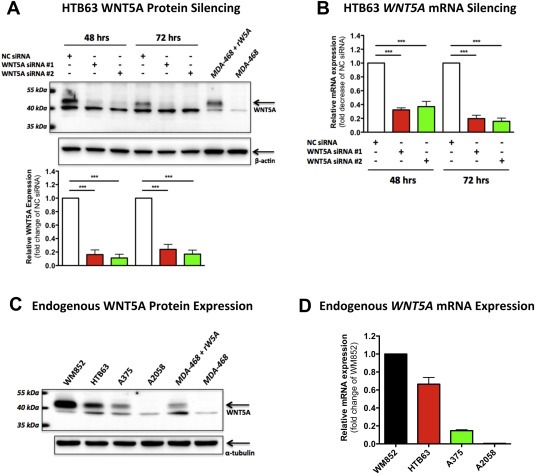
Analysis of endogenous WNT5A expression levels in melanoma cell lines. (A) Western blot analysis showing siRNA silencing of endogenous WNT5A in HTB63 cells. Cells were transfected with either negative control siRNA (NC siRNA; 100 nM), anti‐WNT5A‐siRNA #1 (WNT5A siRNA #1; 100 nM) or anti‐WNT5A‐siRNA #2 (WNT5A siRNA #2; 100 nM) and incubated for 48 or 72 h. Two protein bands in the presumed WNT5A region were clearly detected in NC siRNA transfected cells, however only the intensity of the upper band was reduced following transfection with either WNT5A siRNA #1 or WNT5A siRNA #2. Recombinant WNT5A (rW5A) was used as a positive control and was resuspended in the lysate from the WNT5A‐negative human breast cancer cell line MDA‐468. The lower panel shows densitometric analyses of the siRNA effects on WNT5A protein expression normalized against β‐actin (n = 4). (B) qPCR analysis of WNT5A mRNA expression in HTB63 cells treated as described in (A). The relative WNT5A mRNA expression level was normalized against TATA‐binding protein (TBP) mRNA expression (n = 4). (C) Western blot analysis showing the levels of endogenous WNT5A protein expression in the human melanoma cell lines WM852, HTB63, A375 and A2058. α‐tubulin was used to ensure equal loading of all samples. A representative blot from four separate experiments is shown. (D) qPCR analysis of endogenous WNT5A mRNA expression levels in human WM852, HTB63, A375 and A2058 cells. Samples were normalized against the mRNA of the housekeeping gene TBP. The results are presented as relative to WNT5A mRNA expression of WM852 cells (n = 3). The results are given as means and S.E.M; ***, p < 0.001.
3.3. IL‐6 can positively regulate the expression of WNT5A protein and mRNA
Having ascertained the specific detection of the WNT5A protein (Figure 2A), we then treated all the cell lines within the panel with recombinant IL‐6 (20 ng/ml) for 24 h to study its effects on WNT5A expression. Western blot analysis revealed a prominent increase of WNT5A protein expression in both HTB63 and A375 cells, whereas WNT5A expression in WM852 and A2058 cells was unaffected (Figure 3A). These results were further validated by qPCR analysis of the WNT5A mRNA expression. Accordingly, we found robust increases in WNT5A mRNA in HTB63 and A375 cells, but not in WM852 and A2058 cells (Figure 3B). Furthermore, stimulation of HTB63 and A375 cells with recombinant IL‐6 at concentrations as low as 2 ng/ml for 24 h resulted in distinct but small increases in WNT5A protein expression in both cell lines, although less pronounced than that observed with 20 ng/ml (Figure 3C and D). No further increase in WNT5A expression was observed even after stimulation with 50 ng/ml (data not shown). Hence, 20 ng/ml was used in all further experiments. The fact that we could not detect any WNT5A protein expression in neither un‐stimulated nor recombinant IL‐6 stimulated A2058 cells (Figure 3A) could imply that the WNT5A promoter is silenced by methylation as demonstrated to be the case in a subpopulation of colon cancers (Ying et al., 2008). The demonstration that treatment of A2058 cells with the de‐methylating agent 5‐Aza increased WNT5A mRNA expression (Supplementary Figure 4) support the existence of a similar mechanism in A2058 cells, providing an explanation for the inability of IL‐6 to regulate WNT5A expression in this cell line. These results demonstrate that IL‐6 positively regulates the expression of WNT5A in two out of four melanoma cell lines tested.
Figure 3.
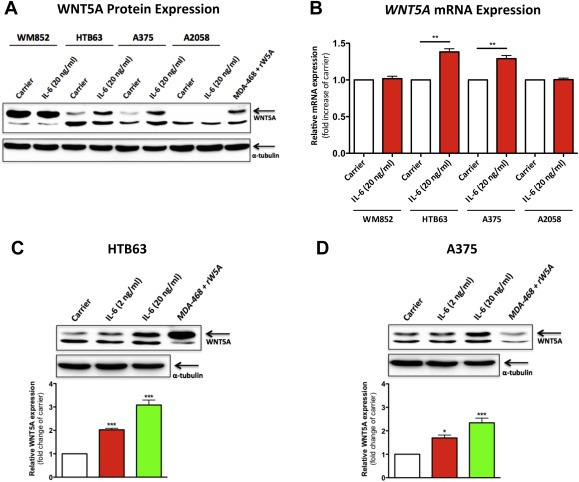
Effects of recombinant IL‐6 stimulation on WNT5A protein and WNT5A mRNA expression. (A) Western blot analysis of WNT5A expression in the human melanoma cell lines WM852, HTB63, A375 and A2058, which were treated as indicated in the figure with Carrier (0.1% BSA in PBS) alone or recombinant IL‐6 (20 ng/ml) for 24 h α‐tubulin was used to ensure equal loading of all samples. A representative blot from 4 separate experiments is shown. (B) qPCR analysis of the WNT5A mRNA expression in WM852, HTB63, A375 and A2058 cells treated as described in (A). The samples were normalized according to the expression of the housekeeping gene TATA‐binding protein (TBP). The IL‐6‐induced effects were presented as relative to the Carrier treated cells in the same experiment (n = 4). (C–D), Western blot analysis of WNT5A expression in HTB63 and A375 cells treated with either Carrier or recombinant IL‐6 (2 or 20 ng/ml). Densitometric analyses were performed, and the data were then normalized against α‐tubulin used as a loading control (HTB63, n = 5; A375, n = 4). The results are given as means and S.E.M; *, p < 0.05; **, p < 0.01 ***, p < 0.001.
3.4. IL‐6 stimulation activates STAT3 but not Akt or ERK1/2
To identify the downstream signaling mechanisms responsible for the regulation of WNT5A expression by IL‐6, we studied the main pathways triggered by IL‐6, specifically, the activation of STAT3, Akt and/or ERK1/2 (Eulenfeld et al., 2012). Phosphorylation of the tyrosine‐705 residue (Tyr705) is associated with the dimerization and activation of STAT3 (Zhong et al., 1994). After treating each of the four investigated melanoma cell lines cells with recombinant IL‐6 for 60 min, we could detect a distinct phosphorylation at Tyr705 of STAT3 in all the cell lines (Figure 4A). In addition, phosphorylation of the serine‐727 residue of STAT3 has been associated with the transcriptional regulation of certain STAT3 target genes (Eulenfeld et al., 2012). However, we could not detect any phosphorylation of this residue in any of the four cell lines, neither before nor after recombinant IL‐6 treatment (data not shown). Next, we analyzed the phosphorylation of both Akt (serine‐473) and ERK1/2 (threonine‐202/tyrosine‐204) following 60 min of recombinant IL‐6 treatment. No increased phosphorylation of either Akt or ERK1/2 was detected in any of the four cell lines (Figure 4B and C). Phosphorylation of ERK1/2 and Akt can under many circumstances occur very rapidly and transiently pass within 60 min. Therefore, we also treated HTB63 and A375 cells with recombinant IL‐6 for 1, 5, 10 and 30 min in addition to 60 min. We detected no increased phosphorylation of either Akt or ERK1/2 at any of the time points analyzed (Supplementary Figure 5), suggesting that neither of these two signaling molecules were involved in the IL‐6‐induced regulation of WNT5A expression.
Figure 4.
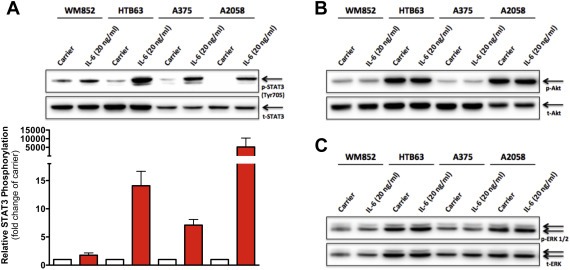
Recombinant IL‐6 stimulation triggers STAT3 but not Akt or ERK1/2 activation in melanoma cells. (A) Western blot analysis of tyrosine‐705 phosphorylation of STAT3 (p‐STAT3, Tyr705) in the human melanoma cell lines WM852, HTB63, A375 and A2058 treated with Carrier (0.1% BSA in PBS) alone or recombinant IL‐6 (20 ng/ml) for 60 min. Densitometric analyses were performed, and the data were then normalized against total STAT3 (t‐STAT3) (n = 3). (B–C) Western blot analysis of Akt phosphorylation (p‐Akt) and ERK1/2 phosphorylation (p‐ERK1/2) in the human melanoma cell lines WM852, HTB63, A375 and A2058 treated as described in (A). Total Akt and total ERK1/2 were used to ensure equal loading of all samples. Representative blots from three separate experiments are shown in (B) and (C). The results are given as means and S.E.M.
3.5. IL‐6 increases the expression of WNT5A independently of STAT3
As STAT3, but neither Akt nor ERK1/2, was activated by IL‐6 (Figure 4), we subsequently repeated the recombinant IL‐6 stimulations of HTB63 and A375 cells in the presence of a STAT3‐inhibitor to examine whether the IL‐6 induced WNT5A expression was regulated through STAT3. For this purpose, we selected the well‐characterized STAT3‐inhibitor S3I‐201, which binds the SH2 domain of STAT3 and thereby inhibits tyrosine phosphorylation and subsequently the dimerization and activation of STAT3 (Siddiquee et al., 2007). In HTB63 cells, S3I‐201 treatment alone for 24 h lowered the endogenous Tyr705 phosphorylation level of STAT3 (Figure 5A). Furthermore, when HTB63 cells were treated with S3I‐201, the prominent recombinant IL‐6‐induced increase in Tyr705 phosphorylation was completely abolished (Figure 5A). Despite the clear inhibition of STAT3 by S3I‐201, the inhibitor had no effects on basal WNT5A expression or on IL‐6‐induced WNT5A expression (Figure 5B). When applying the same experimental set‐up for A375 cells, we basically found the same results with the S3I‐201 inhibitor; specifically, there was no correlation between STAT3 activity and WNT5A expression (Figure 5C and D). To confirm the validity of the STAT3 inhibitor, we also analyzed in the same cell lysates for the expression of three proteins whose gene transcription have been previously described to be regulated by STAT3, c‐Myc (Kiuchi et al., 1999), B‐cell lymphoma‐2 (Bcl‐2) (Zhang et al., 2007) and matrix metalloproteinase‐9 (MMP‐9) (Wang et al., 2011). The treatment of both HTB63 and A375 cells with S3I‐201 alone for 24 h significantly reduced the expression of all these STAT3‐regulated proteins (Supplementary Figures 6A, 6B and 6C, respectively), demonstrating the expected function of the STAT3 inhibitor. To further support the observation that chemical inhibition of STAT3 does not reduce WNT5A expression, we silenced the expression of endogenous STAT3 for 48 h in both HTB63 and A375 cells using siRNA interference. Despite a significant reduction of STAT3 expression in both cell lines (Supplementary Figure 7A), we did not detect any significant effects on WNT5A protein expression (Supplementary Figure 7B). Altogether, these results suggest that IL‐6 regulation of WNT5A expression in HTB63 and A375 melanoma cells is not controlled by STAT3 activity.
Figure 5.
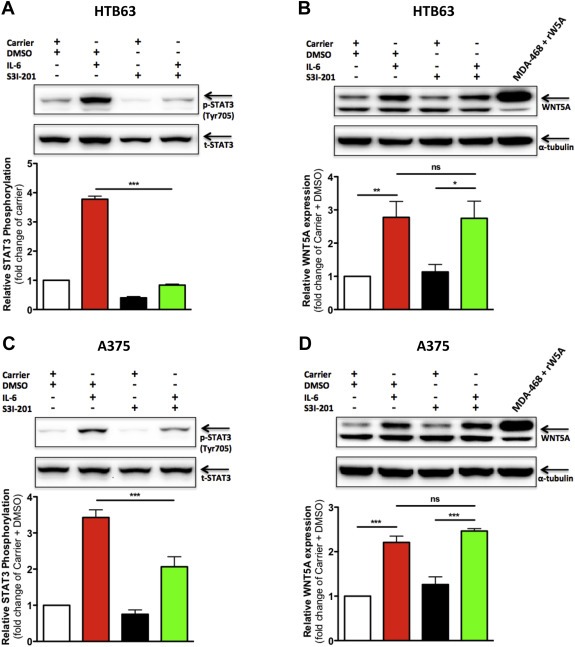
The recombinant IL‐6‐induced expression of WNT5A is not regulated by STAT3 activity. Western blot analysis of tyrosine‐705 phosphorylation of STAT3 (p‐STAT3, Tyr705) in human HTB63 (A) and A375 (C) melanoma cells treated with either Carrier (0.1% BSA in PBS) alone or recombinant IL‐6 (20 ng/ml) for 24 h in the absence (only DMSO) or presence of S3I‐201 (100 μM dissolved in DMSO). Densitometric analyses were performed, and the data were then normalized against total STAT3 (t‐STAT3; n = 4). Western blot analysis of WNT5A expression in HTB63 (B) and A375 (D) cells treated as described in A and C, respectively. Densitometric analyses were performed, and the data were then normalized against α‐tubulin (n = 4). The results are given as means and S.E.M; *, p < 0.05; **, p < 0.01; ***, p < 0.001.
3.6. The IL‐6‐induced WNT5A expression and cell invasion is mediated by p38α‐MAPK activation
In addition to STAT3, Akt and ERK1/2, IL‐6 has been shown to activate p38‐MAPK in hepatoma cells (Zauberman et al., 1999). Interestingly enough, p38‐MAPK activation was recently shown to mediate TNFα‐induced transcription of WNT5A in fibroblasts (Katula et al., 2012). Therefore, we investigated whether IL‐6 could activate p38‐MAPK in melanoma cells. Following recombinant IL‐6 stimulation for 60 min, we detected a significant increase in the threonine‐180/tyrosine‐182 phosphorylation of p38‐MAPK in HTB63 and A375 cells, whereas the p38‐MAPK phosphorylation in WM852 and A2058 cells was unaffected (Figure 6A). Furthermore, recombinant IL‐6 stimulation of HTB63 cells in a time‐dependent manner revealed that the activation of p38‐MAPK is rapid and persists for at least 4 h (Figure 6B) Next, we investigated whether the IL‐6‐induced WNT5A expression was dependent on the activation of p38‐MAPK. Treatment of HTB63 and A375 cells with the selective p38‐MAPK inhibitor SB203580 completely blocked the IL‐6‐induced WNT5A expression in both cell lines (Figure 6C and D). Furthermore, SB203580 treatment alone reduced the basal WNT5A expression in HTB63 cells (Figure 6C) as well as in WM852 cells (Supplementary Figure 8). These data indicate that the WNT5A expression in three (WM852, HTB63 and A375) out of four tested melanoma cell lines is regulated by p38‐MAPK activity. Furthermore, TGFβ has previously been reported to positively regulate WNT5A expression in melanoma cells (Jenei et al., 2009) and activate p38‐MAPK in both mouse mammary epithelial cells and mouse myoblast cells (Hanafusa et al., 1999; Yu et al., 2002). Therefore, we investigated if p38‐MAPK activation is required for the TGFβ‐induced WNT5A expression in melanoma cells. Recombinant TGFβ1 treatment (5 ng/ml) of HTB63 cells induced a rapid and persistent activation of p38‐MAPK and increased the expression of WNT5A (Supplementary Figures 9A and 9B). Interestingly enough, inhibition of p38‐MAPK activity with SB203580 completely blocked the TGFβ1‐induced WNT5A expression (Supplementary Figure 9B). These results might suggest a universal role for p38‐MAPK activity in the regulation of WNT5A expression. To examine whether the IL‐6‐induced cell invasion of HTB63 cells was regulated by p38‐MAPK activity, we performed invasion assays using recombinant IL‐6 stimulated cells in the absence or presence of SB203580. Co‐treating the cells with the p38‐MAPK inhibitor completely abolished the IL‐6‐induced cell invasion (Figure 6E). However, the addition of recombinant WNT5A significantly rescued the inhibitory effects of SB203580 on IL‐6‐induced HTB63 cell invasion (Figure 6E).
Figure 6.
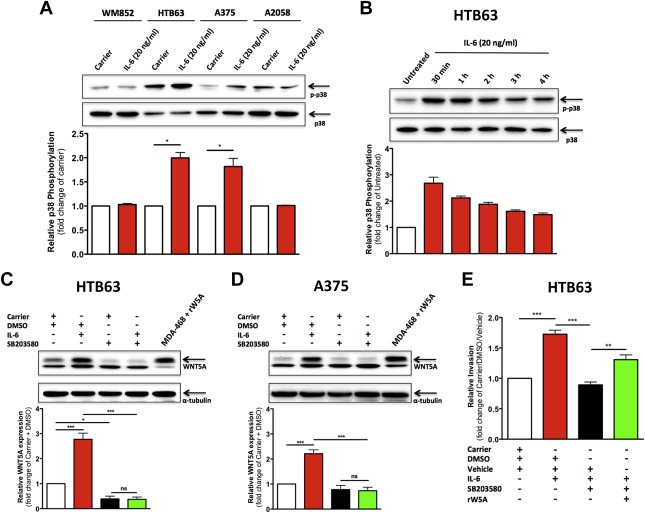
Recombinant IL‐6‐induced p38‐MAPK activation mediates elevated WNT5A expression and increased melanoma cell invasion. (A) Western blot analysis of p38‐MAPK phosphorylation (p‐p38) in the human melanoma cell lines WM852, HTB63, A375 and A2058 treated with Carrier (0.1% BSA in PBS) alone or recombinant IL‐6 (20 ng/ml) for 60 min. Densitometric analyses were performed, and the data were then normalized against total p38‐MAPK (p38; n = 3). (B) Western blot analysis of p38‐MAPK phosphorylation (p‐p38) in HTB63 cells incubated in the absence or presence of recombinant IL‐6 (20 ng/ml) for 30 min, 1 h, 2 h, 3 h or 4 h. Densitometric analyses were performed, and the data were then normalized against total p38‐MAPK (p38; n = 3). (C–D) Western blot analysis of WNT5A expression in HTB63 and A375 cells treated with either Carrier (0.1% BSA in PBS) alone or recombinant IL‐6 (20 ng/ml) for 24 h in the absence (only DMSO) or presence of SB203580 (10 μM dissolved in DMSO). Densitometric analyses were performed, and the data were then normalized against α‐tubulin (n = 4). (E) Matrigel invasion of human HTB63 melanoma cells treated with recombinant IL‐6 (20 ng/ml, dissolved in 0.1% BSA in PBS) in the absence or presence of SB203580 (10 μM dissolved in DMSO) and recombinant WNT5A (rW5A, 0.2 μg/ml, dissolved in 0.1 mM EDTA, 0.5% CHAPS, 0.1% BSA in PBS) or their respective controls, Carrier (0.1% BSA in PBS), DMSO and Vehicle (0.1 mM EDTA, 0.5% CHAPS, 0.1% BSA in PBS). The invasion assays were performed over 24 h (n = 4) and analyzed as described in Materials and methods. The results are given as means and S.E.M; ns, not significant; *, p < 0.05; **, p < 0.01; ***, p < 0.001.
Finally, we investigated which of the four different p38‐MAPK isoforms (α, β, γ and/or δ) that were responsible for the IL‐6‐induced WNT5A expression. Following stimulation of HTB63 cells with recombinant IL‐6 for 30 min, the lysates were immunoprecipitated using a monoclonal anti‐phospho‐p38‐MAPK antibody that does not distinguish in‐between the four different p38‐MAPK isoforms. Subsequent Western blot analysis revealed that out of the four isoforms, only p38α‐MAPK was endogenously active and that its activity could be further increased by recombinant IL‐6 stimulation (Figure 7A). To confirm the role of p38α‐MAPK and also validate the selectivity of the SB203580 inhibitor, we then silenced the endogenous expression of p38α‐MAPK in HTB63 cells and repeated the recombinant IL‐6 stimulation. This resulted in an almost complete block of the IL‐6‐induced WNT5A expression whereas siRNA silencing of p38β‐MAPK, as a negative control, failed to impair this effect of IL‐6 (Figure 7B). Consequently, these results demonstrate a novel IL‐6‐induced, p38α‐MAPK‐dependent up‐regulation of WNT5A expression that is of significant importance for increased melanoma cell invasion.
Figure 7.
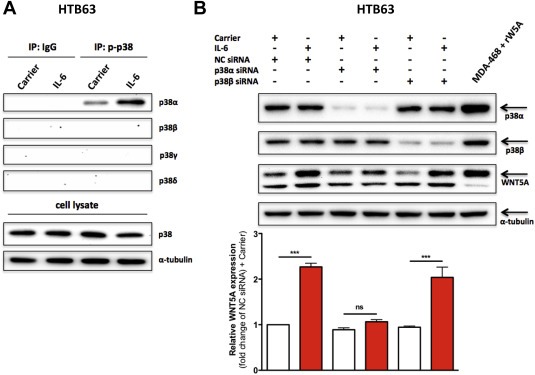
p38α‐MAPK is the only isoform activated by recombinant IL‐6 stimulation and shown to be responsible for the IL‐6‐induced increase in WNT5A expression. (A) Western blot analysis of activated p38‐MAPK isoforms in human HTB63 melanoma cells treated with either Carrier (0.1% BSA in PBS) alone or recombinant IL‐6 (20 ng/ml) for 30 min. After treatment, the cells were lysed and either directly analyzed for their contents of total p38‐MAPK (p38) and α‐tubulin or used for control IgG (IP:IgG) or phospho‐p38‐MAPK (IP:p‐p38) immunoprecipitation. These immunoprecipitates were subsequently analyzed for their contents of the p38‐MAPK isoforms (p38α, p38β, p38γ or p38δ). Representative blots from three separate experiments are shown. (B) Western blot analysis of p38α‐MAPK (p38α), p38β‐MAPK (p38β) and WNT5A expression in HTB63 cells transfected with either negative control siRNA (NC siRNA; 50 nM), anti‐p38α‐siRNA (p38α siRNA; 50 nM) or anti‐p38β‐siRNA (p38β siRNA; 50 nM) and incubated for 48 h prior to treatment with either Carrier (0.1% BSA in PBS) alone or recombinant IL‐6 (20 ng/ml) for 24 h. Densitometric analyses of WNT5A expression were performed, and the data were then normalized against α‐tubulin (n = 4). The results are given as means and S.E.M; ns, not significant; ***, p < 0.001.
4. Discussion
The highly metastatic nature of cutaneous melanoma requires the development of effective therapeutic interventions that specifically target the invasive capabilities of melanoma tumor cells. WNT5A expression has been shown to be elevated in melanoma and to be an indicator of poor prognosis (Bittner et al., 2000; Da Forno et al., 2008; Weeraratna et al., 2002). Taken together with the fact that numerous studies have demonstrated that WNT5A drives melanoma cell migration and invasion (Dissanayake et al., 2007; O'Connell et al., 2010; Weeraratna et al., 2002; Witze et al., 2013), suggests that WNT5A is a potential therapeutic target in preventing melanoma metastasis. Therefore, we developed a small WNT5A‐derived hexapeptide, Box5, which inhibits WNT5A signaling and thereby antagonizes WNT5A‐induced melanoma cell invasion (Jenei et al., 2009). In addition, a better understanding of the mechanisms responsible for the increased WNT5A expression in melanoma could provide improved therapeutic possibilities in treating dissemination and progression of the disease. Unfortunately, to date, only a few factors have been described to increase WNT5A expression during melanoma progression. In the present study, we focused on the potential role of IL‐6 in regulating WNT5A expression in melanoma cells.
Similar to WNT5A, IL‐6 has been demonstrated to drive melanoma cell invasion (Kushiro et al., 2012; Sanz‐Moreno et al., 2011). In the present study, we demonstrate an intimate relationship between IL‐6 and WNT5A in two out of four melanoma cell lines, which most likely reflects the heterogeneous nature of melanoma tumors (Fidler, 1978). The treatment of four different melanoma cell lines with recombinant IL‐6 triggered a significant increase in WNT5A protein expression in the HTB63 and the A375 cell lines, results that were validated by increased WNT5A mRNA expression. However, neither WNT5A protein nor WNT5A mRNA expression were affected in the WM852 and the A2058 cell lines. In this context, it deserves to be mentioned that a reverse mechanism has been reported, in that WNT5A can increase the expression of IL‐6 both in vitro in monocytes (Bergenfelz et al., 2013) and in vivo in the spinal cord (Li et al., 2013). These findings might explain the observation by Dissanayake et al. that increased WNT5A expression and IL‐6 release correlate in melanoma cells (Dissanayake et al., 2008). The previous (Bergenfelz et al., 2013; Li et al., 2013) and present data provide the basis for a possible mechanism whereby WNT5A can positively regulate its own expression via a positive feedback loop (see the schematic overview in Figure 8). A confirmed functional importance of the IL‐6‐induced WNT5A protein up‐regulation was revealed by the findings that a direct antagonism of WNT5A signaling reduced IL‐6‐induced melanoma cell migration and invasion.
Figure 8.
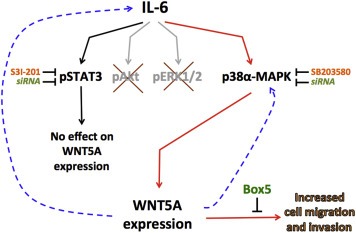
Schematic overview of the signaling events that link the two pro‐metastatic agents IL‐6 and WNT5A in melanoma. The broken arrow indicates a mechanism demonstrated by other researchers that together with the present findings suggests a positive feed back‐loop whereby WNT5A indirectly could regulate its own expression level.
To further validate the above results, we sought to elucidate the signaling mechanisms responsible for the IL‐6‐induced WNT5A expression. We initiated this study by focusing on the three main signaling molecules activated by IL‐6 (Eulenfeld et al., 2012). The data from the four investigated melanoma cell lines clearly showed that IL‐6 only induced a pronounced activation of the transcription factor STAT3, whereas neither Akt nor ERK1/2 were activated. It is reasonable to believe that the inability of IL‐6 to induce further increases in ERK phosphorylation in all studied cell lines is a reflection of their NRAS/BRAF mutational status and thus their constitutively active RAS/RAF/MEK/ERK signaling pathway. A similar reasoning might explain the lack of IL‐6‐induced Akt phosphorylation since increased RAS activity will trigger increased PI3K activity. In addition the WM852, HTB63 and A2058 cells all have a chromosomal deletion of PTEN.
In addition to the IL‐6‐induced STAT3 activation, we observed that the levels of endogenous STAT3 activity and WNT5A expression correlated well within our panel of melanoma cell lines. Altogether, these results pointed towards STAT3 as the main signaling molecule responsible for the IL‐6‐induced WNT5A expression. Surprisingly however, despite the use of a well‐characterized STAT3 inhibitor (Siddiquee et al., 2007), neither the endogenous nor the IL‐6‐induced WNT5A up‐regulation was affected in HTB63 and A375 cells. Furthermore, siRNA silencing of STAT3 did not affect the WNT5A expression in these cells. Altogether, these results suggest that STAT3 is not involved in the regulation of WNT5A expression in melanoma cells (see the schematic overview in Figure 8), despite the demonstrated presence of STAT3 binding sites within the WNT5A gene (Katoh and Katoh, 2005). However, in line with our results, a recent study by Katula et al. failed to confirm the presence of STAT3 binding sites within the WNT5A gene (Katula et al., 2012). Taken together, our results constitute a functional confirmation of the recent results published by Katula et al.
Searching for an alternate signaling mechanism that could explain the IL‐6‐induced regulation of WNT5A expression, we focused on p38‐MAPK because it has been implicated in IL‐6 signaling in hepatoma cells (Zauberman et al., 1999). Indeed, IL‐6 was also able to activate p38‐MAPK in HTB63 and A375 melanoma cells, and this correlated with IL‐6‐induced WNT5A protein expression. However, in WM852 and A2058 melanoma cells, the activity of p38‐MAPK remained unchanged, a result that correlated with the inability of IL‐6 to induce WNT5A expression in these cells. These results suggest the possibility that p38‐MAPK is responsible for IL‐6‐induced WNT5A up‐regulation. Indeed, inhibition of p38‐MAPK activity blocked the IL‐6‐induced WNT5A expression in both HTB63 and A375 melanoma cells. Furthermore, p38‐MAPK inhibition was able to reduce the basal level of WNT5A protein expression in WM852 cells indicating that p38‐MAPK activity participates in the regulation of WNT5A expression in three out of four investigated melanoma cell lines. In this context, it deserves to be mentioned that WNT5A has been shown to regulate the activity of p38‐MAPK in teratocarcinoma cells (Ma and Wang, 2007). If such a mechanism also exists in melanoma cells, it would further extend the possibilities of WNT5A to positively regulate its own expression and thereby accelerate migration and invasion of melanoma cells (see the schematic overview in Figure 8). Functionally, the inhibition of p38‐MAPK completely blocked the IL‐6‐induced invasion of HTB63 cells. Our findings that the addition of recombinant WNT5A to these cells rescued the IL‐6‐induced invasion indicate that the inhibition of p38‐MAPK activity and the resulting downstream inhibition of IL‐6‐induced cell invasion are related to impaired WNT5A expression.
In an attempt to delineate which of the four different p38‐MAPK isoforms (α, β, γ and/or δ) that were responsible for the IL‐6‐induced WNT5A up‐regulation, we identified p38α‐MAPK as the only active isoform in HTB63 cells. This information allowed us to investigate the specific role of p38α‐MAPK in IL‐6‐induced WNT5A expression by using siRNA interference instead of chemical inhibition. However, as SB203580 selectively can inhibit both p38α‐MAPK and p38β‐MAPK (Lopez‐Bergami, 2011), we choose to silence both isoforms individually prior to stimulation with recombinant IL‐6. In good agreement with the above results, silencing of p38α‐MAPK almost completely blocked the IL‐6‐induced WNT5A up‐regulation (see the schematic overview in Figure 8) whereas silencing of p38β‐MAPK had no effect.
Taken together, the present study suggests a novel approach for therapeutically targeting WNT5A up‐regulation, which, in combination with blocking WNT5A signaling, could provide an efficient approach to prevent WNT5A‐regulated metastatic spread of melanoma. If such an approach would also be useful in reducing the resistance towards BRAF inhibitors, as recently proposed (Webster and Weeraratna, 2013), remains to be further investigated.
Competing interests
L.A. and T.A. are shareholders of WntResearch and T.A. is part‐time Chief Scientific Officer of WntResearch. This does not alter the authors' adherence to all the policies on sharing data and materials as stated for the Molecular Oncology.
Supporting information
The following is the supplementary data related to this article:
Supplementary data
Acknowledgments
We thank Göran Jönsson and Jillian Howlin at the Department of Oncology, Lund University, Sweden, for kindly providing the melanoma cell line WM852. This work was supported by the Swedish Cancer Foundation (13 0635), the Swedish Research Council (B0434701), the Söderberg Foundations (MN244/09), the Skåne University Hospital Research Foundations, the Gunnar Nilsson's Cancer Foundation, the BioCare program at Lund University, Governmental Funding of Clinical Research within the national health services (ALF) all to T.A., and by the Royal Physiographic Society (to R.L.). The funders had no role in study design, data collection and analysis, decision to publish, or preparation of the manuscript.
Supplementary data 1.
Supplementary data related to this article can be found at http://dx.doi.org/10.1016/j.molonc.2014.05.008.
Linnskog Rickard, Jönsson Gunilla, Axelsson Lena, Prasad Chandra P., Andersson Tommy, (2014), Interleukin‐6 drives melanoma cell motility through p38α‐MAPK‐dependent up‐regulation of WNT5A expression, Molecular Oncology, 8, doi: 10.1016/j.molonc.2014.05.008.
References
- Bergenfelz, C. , Janols, H. , Wullt, M. , Jirstrom, K. , Bredberg, A. , Leandersson, K. , 2013. Wnt5a inhibits human monocyte-derived myeloid dendritic cell generation. Scand. J. Immunol.. 78, 194–204. [DOI] [PubMed] [Google Scholar]
- Bittner, M. , Meltzer, P. , Chen, Y. , Jiang, Y. , Seftor, E. , Hendrix, M. , Radmacher, M. , Simon, R. , Yakhini, Z. , Ben-Dor, A. , Sampas, N. , Dougherty, E. , Wang, E. , Marincola, F. , Gooden, C. , Lueders, J. , Glatfelter, A. , Pollock, P. , Carpten, J. , Gillanders, E. , Leja, D. , Dietrich, K. , Beaudry, C. , Berens, M. , Alberts, D. , Sondak, V. , 2000. Molecular classification of cutaneous malignant melanoma by gene expression profiling. Nature. 406, 536–540. [DOI] [PubMed] [Google Scholar]
- Broom, O.J. , Zhang, Y. , Oldenborg, P.A. , Massoumi, R. , Sjolander, A. , 2009. CD47 regulates collagen I-induced cyclooxygenase-2 expression and intestinal epithelial cell migration. PloS One. 4, e6371 [DOI] [PMC free article] [PubMed] [Google Scholar]
- Camilli, T.C. , Weeraratna, A.T. , 2010. Striking the target in Wnt-y conditions: intervening in Wnt signaling during cancer progression. Biochem. Pharmacol.. 80, 702–711. [DOI] [PMC free article] [PubMed] [Google Scholar]
- Da Forno, P.D. , Pringle, J.H. , Hutchinson, P. , Osborn, J. , Huang, Q. , Potter, L. , Hancox, R.A. , Fletcher, A. , Saldanha, G.S. , 2008. WNT5A expression increases during melanoma progression and correlates with outcome. Clin. Cancer Res. : An Off. J. Am. Assoc. Cancer Res.. 14, 5825–5832. [DOI] [PubMed] [Google Scholar]
- Dissanayake, S.K. , Olkhanud, P.B. , O'Connell, M.P. , Carter, A. , French, A.D. , Camilli, T.C. , Emeche, C.D. , Hewitt, K.J. , Rosenthal, D.T. , Leotlela, P.D. , Wade, M.S. , Yang, S.W. , Brant, L. , Nickoloff, B.J. , Messina, J.L. , Biragyn, A. , Hoek, K.S. , Taub, D.D. , Longo, D.L. , Sondak, V.K. , Hewitt, S.M. , Weeraratna, A.T. , 2008. Wnt5A regulates expression of tumor-associated antigens in melanoma via changes in signal transducers and activators of transcription 3 phosphorylation. Cancer Res.. 68, 10205–10214. [DOI] [PMC free article] [PubMed] [Google Scholar]
- Dissanayake, S.K. , Wade, M. , Johnson, C.E. , O'Connell, M.P. , Leotlela, P.D. , French, A.D. , Shah, K.V. , Hewitt, K.J. , Rosenthal, D.T. , Indig, F.E. , Jiang, Y. , Nickoloff, B.J. , Taub, D.D. , Trent, J.M. , Moon, R.T. , Bittner, M. , Weeraratna, A.T. , 2007. The Wnt5A/protein kinase C pathway mediates motility in melanoma cells via the inhibition of metastasis suppressors and initiation of an epithelial to mesenchymal transition. J. Biol. Chem.. 282, 17259–17271. [DOI] [PMC free article] [PubMed] [Google Scholar]
- Eulenfeld, R. , Dittrich, A. , Khouri, C. , Muller, P.J. , Mutze, B. , Wolf, A. , Schaper, F. , 2012. Interleukin-6 signalling: more than Jaks and STATs. Eur. J. Cell Biol.. 91, 486–495. [DOI] [PubMed] [Google Scholar]
- Fidler, I.J. , 1978. Tumor heterogeneity and the biology of cancer invasion and metastasis. Cancer Res.. 38, 2651–2660. [PubMed] [Google Scholar]
- Fujio, Y. , Matsuda, T. , Oshima, Y. , Maeda, M. , Mohri, T. , Ito, T. , Takatani, T. , Hirata, M. , Nakaoka, Y. , Kimura, R. , Kishimoto, T. , Azuma, J. , 2004. Signals through gp130 upregulate Wnt5a and contribute to cell adhesion in cardiac myocytes. FEBS Lett.. 573, 202–206. [DOI] [PubMed] [Google Scholar]
- Grossmann, A.H. , Yoo, J.H. , Clancy, J. , Sorensen, L.K. , Sedgwick, A. , Tong, Z. , Ostanin, K. , Rogers, A. , Grossmann, K.F. , Tripp, S.R. , Thomas, K.R. , D'Souza-Schorey, C. , Odelberg, S.J. , Li, D.Y. , 2013. The small GTPase ARF6 stimulates beta-catenin transcriptional activity during WNT5A-mediated melanoma invasion and metastasis. Sci. Signaling. 6, ra14 [DOI] [PMC free article] [PubMed] [Google Scholar]
- Hanafusa, H. , Ninomiya-Tsuji, J. , Masuyama, N. , Nishita, M. , Fujisawa, J. , Shibuya, H. , Matsumoto, K. , Nishida, E. , 1999. Involvement of the p38 mitogen-activated protein kinase pathway in transforming growth factor-beta-induced gene expression. J. Biol. Chem.. 274, 27161–27167. [DOI] [PubMed] [Google Scholar]
- Heinrich, P.C. , Behrmann, I. , Muller-Newen, G. , Schaper, F. , Graeve, L. , 1998. Interleukin-6-type cytokine signalling through the gp130/Jak/STAT pathway. Biochem. J.. 334, (Pt 2) 297–314. [DOI] [PMC free article] [PubMed] [Google Scholar]
- Hoejberg, L. , Bastholt, L. , Johansen, J.S. , Christensen, I.J. , Gehl, J. , Schmidt, H. , 2012. Serum interleukin-6 as a prognostic biomarker in patients with metastatic melanoma. Melanoma Res.. 22, 287–293. [DOI] [PubMed] [Google Scholar]
- Jenei, V. , Sherwood, V. , Howlin, J. , Linnskog, R. , Safholm, A. , Axelsson, L. , Andersson, T. , 2009. A t-butyloxycarbonyl-modified Wnt5a-derived hexapeptide functions as a potent antagonist of Wnt5a-dependent melanoma cell invasion. Proc. Natl. Acad. Sci. U.S.A.. 106, 19473–19478. [DOI] [PMC free article] [PubMed] [Google Scholar]
- Johnston, P.A. , Grandis, J.R. , 2011. STAT3 signaling: anticancer strategies and challenges. Mol. Interventions. 11, 18–26. [DOI] [PMC free article] [PubMed] [Google Scholar]
- Katoh, M. , Katoh, M. , 2005. Comparative genomics on Wnt5a and Wnt5b genes. Int. J. Mol. Med.. 15, 749–753. [PubMed] [Google Scholar]
- Katoh, M. , Katoh, M. , 2007. STAT3-induced WNT5A signaling loop in embryonic stem cells, adult normal tissues, chronic persistent inflammation, rheumatoid arthritis and cancer (Review). Int. J. Mol. Med.. 19, 273–278. [PubMed] [Google Scholar]
- Katula, K.S. , Joyner-Powell, N.B. , Hsu, C.C. , Kuk, A. , 2012. Differential regulation of the mouse and human Wnt5a alternative promoters A and B. DNA Cell Biol.. 31, 1585–1597. [DOI] [PMC free article] [PubMed] [Google Scholar]
- Kikuchi, A. , Yamamoto, H. , Sato, A. , Matsumoto, S. , 2012. Wnt5a: its signalling, functions and implication in diseases. Acta Physiol.. 204, 17–33. [DOI] [PubMed] [Google Scholar]
- Kiuchi, N. , Nakajima, K. , Ichiba, M. , Fukada, T. , Narimatsu, M. , Mizuno, K. , Hibi, M. , Hirano, T. , 1999. STAT3 is required for the gp130-mediated full activation of the c-myc gene. J. Exp. Med.. 189, 63–73. [DOI] [PMC free article] [PubMed] [Google Scholar]
- Kurayoshi, M. , Yamamoto, H. , Izumi, S. , Kikuchi, A. , 2007. Post-translational palmitoylation and glycosylation of Wnt-5a are necessary for its signalling. Biochem. J.. 402, 515–523. [DOI] [PMC free article] [PubMed] [Google Scholar]
- Kushiro, K. , Chu, R.A. , Verma, A. , Nunez, N.P. , 2012. Adipocytes promote B16BL6 melanoma cell invasion and the epithelial-to-mesenchymal transition. Cancer Microenviron. : Off. J. Int. Cancer Microenviron. Soc.. 5, 73–82. [DOI] [PMC free article] [PubMed] [Google Scholar]
- Li, B. , Shi, Y. , Shu, J. , Gao, J. , Wu, P. , Tang, S.J. , 2013. Wingless-type mammary tumor virus integration site family, member 5A (Wnt5a) regulates human immunodeficiency virus type 1 (HIV-1) envelope glycoprotein 120 (gp120)-induced expression of pro-inflammatory cytokines via the Ca2+/calmodulin-dependent protein kinase II (CaMKII) and c-Jun N-terminal kinase (JNK) signaling pathways. J. Biol. Chem.. 288, 13610–13619. [DOI] [PMC free article] [PubMed] [Google Scholar]
- Lopez-Bergami, P. , 2011. The role of mitogen- and stress-activated protein kinase pathways in melanoma. Pigment Cell Melanoma Res.. 24, 902–921. [DOI] [PubMed] [Google Scholar]
- Ma, L. , Wang, H.Y. , 2007. Mitogen-activated protein kinase p38 regulates the Wnt/cyclic GMP/Ca2+ non-canonical pathway. J. Biol. Chem.. 282, 28980–28990. [DOI] [PubMed] [Google Scholar]
- Moretti, S. , Pinzi, C. , Spallanzani, A. , Berti, E. , Chiarugi, A. , Mazzoli, S. , Fabiani, M. , Vallecchi, C. , Herlyn, M. , 1999. Immunohistochemical evidence of cytokine networks during progression of human melanocytic lesions. Int. J. of Cancer J. international du cancer. 84, 160–168. [DOI] [PubMed] [Google Scholar]
- O'Connell, M.P. , Fiori, J.L. , Xu, M. , Carter, A.D. , Frank, B.P. , Camilli, T.C. , French, A.D. , Dissanayake, S.K. , Indig, F.E. , Bernier, M. , Taub, D.D. , Hewitt, S.M. , Weeraratna, A.T. , 2010. The orphan tyrosine kinase receptor, ROR2, mediates Wnt5A signaling in metastatic melanoma. Oncogene. 29, 34–44. [DOI] [PMC free article] [PubMed] [Google Scholar]
- O'Connell, M.P. , Marchbank, K. , Webster, M.R. , Valiga, A.A. , Kaur, A. , Vultur, A. , Li, L. , Herlyn, M. , Villanueva, J. , Liu, Q. , Yin, X. , Widura, S. , Nelson, J. , Ruiz, N. , Camilli, T.C. , Indig, F.E. , Flaherty, K.T. , Wargo, J.A. , Frederick, D.T. , Cooper, Z.A. , Nair, S. , Amaravadi, R.K. , Schuchter, L.M. , Karakousis, G.C. , Xu, W. , Xu, X. , Weeraratna, A.T. , 2013. Hypoxia induces phenotypic plasticity and therapy resistance in melanoma via the tyrosine kinase receptors ROR1 and ROR2. Cancer Discovery. 3, 1378–1393. [DOI] [PMC free article] [PubMed] [Google Scholar]
- O'Connell, M.P. , Weeraratna, A.T. , 2009. Hear the Wnt Ror: how melanoma cells adjust to changes in Wnt. Pigment Cell Melanoma Res.. 22, 724–739. [DOI] [PMC free article] [PubMed] [Google Scholar]
- Prasad, C.P. , Chaurasiya, S.K. , Axelsson, L. , Andersson, T. , 2013. WNT-5A triggers Cdc42 activation leading to an ERK1/2 dependent decrease in MMP9 activity and invasive migration of breast cancer cells. Mol. Oncol.. 7, 870–883. [DOI] [PMC free article] [PubMed] [Google Scholar]
- Sanz-Moreno, V. , Gaggioli, C. , Yeo, M. , Albrengues, J. , Wallberg, F. , Viros, A. , Hooper, S. , Mitter, R. , Feral, C.C. , Cook, M. , Larkin, J. , Marais, R. , Meneguzzi, G. , Sahai, E. , Marshall, C.J. , 2011. ROCK and JAK1 signaling cooperate to control actomyosin contractility in tumor cells and stroma. Cancer Cell. 20, 229–245. [DOI] [PubMed] [Google Scholar]
- Säfholm, A. , Leandersson, K. , Dejmek, J. , Nielsen, C.K. , Villoutreix, B.O. , Andersson, T. , 2006. A formylated hexapeptide ligand mimics the ability of Wnt-5a to impair migration of human breast epithelial cells. J. Biol. Chem.. 281, 2740–2749. [DOI] [PubMed] [Google Scholar]
- Sherwood, V. , Chaurasiya, S.K. , Ekstrom, E.J. , Guilmain, W. , Liu, Q. , Koeck, T. , Brown, K. , Hansson, K. , Agnarsdottir, M. , Bergqvist, M. , Jirstrom, K. , Ponten, F. , James, P. , Andersson, T. , 2014. WNT5A-mediated beta-catenin-independent signalling is a novel regulator of cancer cell metabolism. Carcinogenesis. 35, 784–794. [DOI] [PMC free article] [PubMed] [Google Scholar]
- Siddiquee, K. , Zhang, S. , Guida, W.C. , Blaskovich, M.A. , Greedy, B. , Lawrence, H.R. , Yip, M.L. , Jove, R. , McLaughlin, M.M. , Lawrence, N.J. , Sebti, S.M. , Turkson, J. , 2007. Selective chemical probe inhibitor of Stat3, identified through structure-based virtual screening, induces antitumor activity. Proc. Natl Acad. of Sci. U.S.A.. 104, 7391–7396. [DOI] [PMC free article] [PubMed] [Google Scholar]
- Tarhini, A.A. , Agarwala, S.S. , 2006. Cutaneous melanoma: available therapy for metastatic disease. Dermatol. Ther.. 19, 19–25. [DOI] [PubMed] [Google Scholar]
- Wang, X.H. , Liu, B.R. , Qu, B. , Xing, H. , Gao, S.L. , Yin, J.M. , Wang, X.F. , Cheng, Y.Q. , 2011. Silencing STAT3 may inhibit cell growth through regulating signaling pathway, telomerase, cell cycle, apoptosis and angiogenesis in hepatocellular carcinoma: potential uses for gene therapy. Neoplasma. 58, 158–171. [DOI] [PubMed] [Google Scholar]
- Webster, M.R. , Weeraratna, A.T. , 2013. A Wnt-er migration: the confusing role of beta-catenin in melanoma metastasis. Sci. Signaling. 6, pe11 [DOI] [PubMed] [Google Scholar]
- Weeraratna, A.T. , Jiang, Y. , Hostetter, G. , Rosenblatt, K. , Duray, P. , Bittner, M. , Trent, J.M. , 2002. Wnt5a signaling directly affects cell motility and invasion of metastatic melanoma. Cancer Cell. 1, 279–288. [DOI] [PubMed] [Google Scholar]
- Witze, E.S. , Connacher, M.K. , Houel, S. , Schwartz, M.P. , Morphew, M.K. , Reid, L. , Sacks, D.B. , Anseth, K.S. , Ahn, N.G. , 2013. Wnt5a directs polarized calcium gradients by recruiting cortical endoplasmic reticulum to the cell trailing edge. Dev. Cell. 26, 645–657. [DOI] [PMC free article] [PubMed] [Google Scholar]
- Xie, T.X. , Huang, F.J. , Aldape, K.D. , Kang, S.H. , Liu, M. , Gershenwald, J.E. , Xie, K. , Sawaya, R. , Huang, S. , 2006. Activation of stat3 in human melanoma promotes brain metastasis. Cancer Res.. 66, 3188–3196. [DOI] [PubMed] [Google Scholar]
- Ying, J. , Li, H. , Yu, J. , Ng, K.M. , Poon, F.F. , Wong, S.C. , Chan, A.T. , Sung, J.J. , Tao, Q. , 2008. WNT5A exhibits tumor-suppressive activity through antagonizing the Wnt/beta-catenin signaling, and is frequently methylated in colorectal cancer. Clin. Cancer Res. : An Off. J. Am. Assoc.Cancer Res.. 14, 55–61. [DOI] [PubMed] [Google Scholar]
- Yu, L. , Hebert, M.C. , Zhang, Y.E. , 2002. TGF-beta receptor-activated p38 MAP kinase mediates Smad-independent TGF-beta responses. EMBO J.. 21, 3749–3759. [DOI] [PMC free article] [PubMed] [Google Scholar]
- Zauberman, A. , Zipori, D. , Krupsky, M. , Ben-Levy, R. , 1999. Stress activated protein kinase p38 is involved in IL-6 induced transcriptional activation of STAT3. Oncogene. 18, 3886–3893. [DOI] [PubMed] [Google Scholar]
- Zhang, X. , Zhang, J. , Wei, H. , Tian, Z. , 2007. STAT3-decoy oligodeoxynucleotide inhibits the growth of human lung cancer via down-regulating its target genes. Oncol. Rep.. 17, 1377–1382. [PubMed] [Google Scholar]
- Zhong, Z. , Wen, Z. , Darnell, J.E. , 1994. Stat3: a STAT family member activated by tyrosine phosphorylation in response to epidermal growth factor and interleukin-6. Science. 264, 95–98. [DOI] [PubMed] [Google Scholar]
Associated Data
This section collects any data citations, data availability statements, or supplementary materials included in this article.
Supplementary Materials
The following is the supplementary data related to this article:
Supplementary data