

Abstract
The inflammatory cytokine Tumor Necrosis Factor Alpha (TNF‐α) is known to trigger invasive growth, a physiological property for tissue healing, turning into a hallmark of progression in cancer. However, the invasive response to TNF‐α relies on poorly understood molecular mechanisms. We thus investigated whether it involves the MET oncogene, which regulates the invasive growth program by encoding the tyrosine kinase receptor for Hepatocyte Growth Factor (HGF). Here we show that the TNF‐α pro‐invasive activity requires MET function, as it is fully inhibited by MET‐specific inhibitors (small‐molecules, antibodies, and siRNAs). Mechanistically, we show that TNF‐α induces MET transcription via NF‐κB, and exploits MET to sustain MEK/ERK activation and Snail accumulation, leading to E‐cadherin downregulation. We then show that TNF‐α not only induces MET expression in cancer cells, but also HGF secretion by fibroblasts. Consistently, we found that, in human colorectal cancer tissues, high levels of TNF‐α correlates with increased expression of both MET and HGF. These findings suggest that TNF‐α fosters a HGF/MET pro‐invasive paracrine loop in tumors. Targeting this ligand/receptor pair would contribute to prevent cancer progression associated with inflammation.
Keywords: TNF‐α, MET, MET inhibitor, HGF, Inflammation, Invasion
Abbreviations
- TNF‐α
tumor necrosis factor alpha
- HGF
hepatocyte growth factor
- NF‐κB
nuclear factor kappa‐light‐chain‐enhancer of activated B cells
- EMT
epithelial to mesenchymal transition
- TNFR1
tumor necrosis factor receptor 1
- MSP
macrophage stimulating protein
- siRNA
small interfering RNA
- qRT‐PCR
quantitative real‐time polymerase chain reaction
- IHC
immunohistochemistry
- Egr‐1
early growth response factor‐1
- MEK
mitogen‐activated protein kinase kinase
- ERK
extracellular signal regulated kinase
- FBS
fetal bovine serum
- DAPI
4',6'‐di‐amidino‐2‐phenylindole
- FITC
fluorescein isothiocyanate
- DMSO
dimethyl sulfoxide
1. Introduction
Whereas the cell‐autonomous genetic lesions responsible for cancer invasion and metastasis remain largely elusive (Bernards and Weinberg, 2002; Hanahan and Weinberg, 2011), the cancer microenvironment is known to sustain invasive growth by secreted factors (Hanahan and Coussens, 2012). Among these, one of the prominent is TNF‐α, produced by the major players of the inflammatory response, i.e. infiltrating immune cells and fibroblasts, and by cancer cells themselves (Balkwill, 2009; Hanahan and Coussens, 2012). It is well known that TNF‐α (i) induces epithelial–mesenchymal transition (EMT), a crucial preliminary step of invasive growth (Thiery et al., 2009; Bates and Mercurio, 2003); (ii) confers a pro‐invasive phenotype on mammary epithelial cells (Montesano et al., 2005); and (iii) promotes experimental metastasis (Balkwill, 2006; Malik et al., 1990; Orosz et al., 1993).
The signaling mechanisms underlying the pro‐invasive activity of TNF‐α are still largely obscure. In epithelial cells, TNF‐α binds the high‐affinity TNF receptor 1 (TNFR1), which activates NF‐κB transcription factor (Balkwill, 2009; Karin, 2006). The latter is known to regulate expression of genes involved in EMT and invasive growth (Balkwill, 2009). An important indirect target of NF‐κB is the Snail protein (Wu et al., 2009), which plays a key role as transcriptional repressor of E‐cadherin (Thiery et al., 2009). TNF‐α signaling thus results in decreased E‐cadherin expression, which is followed by breakdown of intercellular junctions, resulting in EMT and invasive growth.
TNF‐α was also shown to upregulate the expression of the ligand–receptor pair HGF (Tamura et al., 1993) and MET (Moghul et al., 1994; Chen et al., 1996). HGF is mostly secreted by cells of mesenchymal origin, such as cancer‐associated fibroblasts (Vermeulen et al., 2010), whereas its tyrosine kinase receptor MET is expressed in cells of the epithelial stem/progenitor compartment, and carcinoma cells, and regulates the invasive growth program (Boccaccio and Comoglio, 2006). The MET gene is a direct target of NF‐κB, as shown in the case of cell treatment with TNF‐α (Dai et al., 2009), or ionizing radiation (De Bacco et al., 2011).
MET activates an intricate network of intracellular signals, mostly shared by other growth factor receptors. Its peculiar pro‐invasive activity has been associated with prolonged ERK activation (Trusolino et al., 2010); ERK, in turn, was shown to be required for expression of Egr‐1, a transcription factor that upregulates Snail, the E‐cadherin repressor (Grotegut et al., 2006).
In this work we offer mechanistic evidence that invasive growth induced by TNF‐α requires the MET signaling pathway, leading to Snail stabilization and E‐cadherin downregulation. We also show that TNF‐α sustains expression of HGF in fibroblasts, and that expression of TNF‐α significantly associates with MET and HGF in human colorectal cancer tissues. These data provide a rationale for exploring the use of MET inhibitors to prevent cell invasion associated with inflammation.
2. Material and methods
2.1. Cell lines, compounds, and siRNA
Cell lines (A549, A431, T47D, SW‐48, H322, and MRC‐5) were purchased from the American Type Culture Collection (ATCC, Rockville, MD, USA). Cells were grown in RPMI 1640 or DMEM (Sigma Chemical Co., St Louis, MO, USA), supplemented with 1% l‐glutamine (Sigma) and 10% Fetal Bovine Serum (FBS, Lonza group Ltd, Switzerland). Recombinant human Hepatocyte Growth Factor (HGF, R&D systems, Minneapolis, MN, USA) was used at a concentration of 50 ng/ml or as otherwise specified. Recombinant human TNF‐α (Sigma) and recombinant human IL‐1α and IL‐1β (Peprotech, Rocky Hill, NJ, USA) were used at a concentration of 10 ng/ml.
For MET inhibition, cells were incubated with the small molecule kinase inhibitor JNJ‐38877605 (500 nM in DMSO, 2 h before stimulation) (Janssen Pharmaceutica NV, Beerse, Belgium) (De Bacco et al., 2011), PHA 665752 (500 nM in DMSO, 2 h before stimulation) (Tocris Cookson Ltd., Bristol, UK), Crizotinib (500 nM in DMSO, 2 h before stimulation) (Sequoia Research Products Ltd., Pangbourne, UK), or the MET‐monoclonal antibody MvDN30 (28 μg/ml in PBS, 48 h before stimulation) (Metheresis Translational Research, Lugano, Switzerland) (Pacchiana et al., 2010).
For MEK inhibition, cells were incubated with PD 98059 (20 μM in DMSO, 2 h before stimulation) (Calbiochem, La Jolla, CA, USA).
For NF‐κB inhibition, cells were incubated with IKK 16 (1 μM in DMSO, 2 h before stimulation) (Santa Cruz Biotechnology, Santa Cruz, CA, USA).
For SRC inhibition, cells were incubated with Saracatinib (5 μM in DMSO, 2 h before stimulation) (Selleckchem, Houston, TX, USA).
siRNAs targeting MET, RELA SNAIL, EGR‐1 or functional non‐targeting control siRNAs (100 nM, ON‐TARGET plus SMARTpool®, Dharmacon, Lafayette, CO, USA) were transiently transfected into subconfluent cells using Lipofectamine 2000™ (Invitrogen, Carlsbad, CA, USA) according to the manufacturer's instructions.
2.2. Scatter assay
103 cells were seeded in 96‐well plates and allowed to form compact colonies. Stimuli where then added in serum‐free medium. 24 h after treatment, cells were fixed with 11% glutaraldehyde (Sigma), and stained with crystal violet. Images representative of results obtained in at least three independent experiments were acquired with a Leica photocamera (Leica DFC320, Leica, Wetzlar, Germany) connected with an inverted light microscope (DM IRB, Leica).
2.3. Oris cell migration assay
Cell migration was analyzed using the Oris™ Cell Migration Assay (Platypus Technologies, Madison, WI, USA), according to manufacturer's instructions. Briefly, 2 × 10³ A549 cells were seeded, grown to confluence and serum‐starved for 48 h. Then, cell seeding stoppers were removed and cells were stimulated with TNF‐α or HGF, in the presence of JNJ‐38877605 or MvDN30. After 72 h, cells were fixed, stained, and photographed as above. Images are representative of results obtained in at least three independent experiments.
2.4. Transwell assay
Cell migration and invasion assays were performed in Transwell™ chambers (6.5 mm diameter polycarbonate filter with 8.0 μm pore size, Corning, NY, USA). For migration assay, cells (A549: 5 × 10³/transwell; T47D: 105) were directly seeded on the upper side of the filters. For invasion assay, filters were coated with reconstituted Matrigel basement membrane (Collaborative Research, Waltham, MA, USA) at the following concentrations: A549 cells (105/transwell) with 12.5 μg/cm2; H322 cells (105/transwell) with 5 μg/cm2; SW‐48 cells (105/transwell) with 5 μg/cm2 and T47D cells (105/transwell) with 10 μg/cm2. Culture medium supplemented with 1% FBS was added to both chambers, and stimuli to the lower chamber. After 24 h cells on the filter upper side were mechanically removed, and those migrated onto the lower side were fixed, stained, and photographed with a 10× objective as above. Morphometric analysis was performed using NIH ImageJ software (National Institutes of Health, Bethesda, MD). Data shown are the mean of at least three independent experiments in duplicate ± S.E.M.
2.5. Western blot
Confluent cells were serum‐starved for 48 h, and then were treated. To obtain whole‐cell lysates, cells were solubilized in boiling Laemmli buffer. Protein concentration was determined using a BCA Protein Assay Reagent kit (Pierce Biotechnology, Rockford, IL, USA). Equal amount of proteins were resolved by SDS–PAGE in reducing conditions, and transferred onto a Hybond‐C nitrocellulose membrane (Amersham Biosciences, Uppsala, Sweden). Blots were probed with the following primary antibodies: mouse anti‐human MET (DL21) (Prat et al., 1991), mouse anti‐p65/RelA (#610869, BD Biosciences, Bredford, MA, USA), rabbit anti‐phospho MET [Tyr1349 (130H2, #3133), Cell Signaling Technology (CST), Fremont, CA, USA], mouse anti‐phospho–NF–κB p65 [Ser536 (#3036), CST], rabbit anti‐phospho ERK 1/2 [Thr202/Tyr204 (#9101), CST], rabbit anti‐ERK 1/2 (#9102, CST), rabbit anti‐phospho‐MEK 1/2 [Ser217/221 (#9154), CST], rabbit anti‐MEK 1/2 (47E6, #9126, CST), rabbit anti‐phospho Akt [Ser473, D9E (#4060), CST], rabbit anti‐Akt (#9272, CST), rabbit anti‐Snail (#3879, CST), rabbit anti‐Egr‐1 (588, #sc‐110, Santa Cruz Biotechnology) and biotinylated goat‐anti‐HGF (#BAF294, R&D). Antibodies were visualized with appropriate horseradish peroxidase‐conjugated secondary antibodies (Amersham), and the enhanced chemiluminescence system (ECL, Amersham). As a control of equal protein loading, blots were stripped with Restore Western Blot Stripping Buffer (Thermo Scientific, Rockford, IL, USA), and probed with mouse anti‐vinculin (#V9131, Sigma), goat‐anti‐GAPDH (#ab9483, Abcam, Cambridge, UK), or goat‐anti actin (I‐19, #SC‐1616, Santa Cruz). For control of equal nuclear protein loading, blots were decorated with mouse anti‐laminB (#NA12, Calbiochem). Western blots shown are representative of results obtained in at least three independent experiments.
2.6. Immunofluorescence analysis
To evaluate E‐cadherin downregulation, cells were seeded in 24‐well plates (5 × 10⁴) and treated with the indicated stimuli. After 24 h, cells were fixed in 3% para‐formaldehyde, incubated with mouse anti‐E‐cadherin antibodies (#610182, BD Biosciences) for 1 h, and revealed by appropriate Alexa‐Fluor‐tagged secondary antibodies (Molecular Probes by Life Technologies, Karlsruhe, Germany). Nuclei were counterstained with DAPI (Roche Applied Science, Basel, Switzerland). Images representative of at least three independent experiments were acquired with a Leica fluorescence microscope (Leica DMI 3000 B).
2.7. Real‐time qRT‐PCR
Cells were treated with TNF‐α, and total RNA was extracted by RNeasy Mini Kit (Qiagen, Dósseldorf, Germany), quantified using Nanodrop™ (Nanodrop products, Wilmington, DE, USA), and reverse‐transcribed with High Capacity cDNA reverse Transcription Kit (Applied Biosystems Inc, Foster City, CA, USA). Real‐Time PCR was performed on AB PRISM 7900HT Sequence Detection System, using TaqMan® PCR Master Mix, or SYBR® PCR green Master Mix (Applied Biosystems Inc). EGR‐1, HGF, TNF‐α, TNFR1, MET, RON, ACTIN, UBIQUITIN, and GAPDH TaqMan primers are commercially available (Applied Biosystem Inc). SYBR green primers for MET and PGK were designed in house; sequences are as follows:
| MET 1A sequence | 5′‐CCAAAGGCATGAAATATCTTGCA‐3′ |
| 3′‐TCAGCAACCTTGACTGTGAATTTT‐5′ | |
| PGK sequence | 5′‐CAGATTGTTTGGAATGGTCCTG‐3′ |
| 3′‐CCCCTAGAAGTGGCTTTCACC‐5′. |
Data were normalized against endogenous control (GAPDH, ACTIN, UBIQUITIN, or PGK). Non‐treated or DMSO‐treated cells were used as calibrators. Reported values are the mean of at least two independent experiments in triplicate ± S.E.M.
2.8. Immunohistochemistry
35 patients diagnosed with colorectal cancer and giving their informed consent were recruited at the Candiolo Cancer Institute, under a protocol approved by the Institutional Review Board (Study ID number: NCT02238821, registered in ClinicalTrials.gov). Fresh specimens of the surgically resected tumor and adjacent mucosa were fixed in 10% formaldehyde and embedded in paraffin for pathological diagnosis. For immunohistochemistry, tumor sections underwent antigen retrieval with Dako Epitope Retrieval citrate buffer pH 6.0 at 98 °C for 60 min (Dako, Hamburg, Germany). Sections were then incubated with rabbit anti‐MET antibodies [C‐12 (#SC‐10) Santa Cruz Biotechnology] or mouse anti‐TNF‐α antibodies [P/T2 (#ab9579) Abcam Cambridge, UK] for 1 h and NovoLink Max Polymer Detection System kit was used as the secondary detection system with DAB as chromogen (Leica Microsystems, Newcastle, UK). Intensity of the signal was classified on a scale ranging from 0 to 3 by the pathologist (I.S.).
2.9. Gene expression analysis
Published datasets were analyzed as provided by the authors (GSE 39582) (Marisa et al., 2013). The level of expression for each gene was calculated as the average expression of the corresponding probesets. Statistical analysis was performed with R‐Bioconductor (R: Development Core Team, 2004). Heatmap visualization was performed with GEDAS software (Fu and Medico, 2007).
2.10. Statistical analysis
Numerical results were expressed as mean ± S.E.M. Statistical significance was evaluated using two‐tailed Student's t test and correlations were evaluated with Fisher's exact test. P‐values <0.05 were considered significant.
3. Results
3.1. TNF‐α induces cell scatter, migration and invasion via MET
In epithelial cells, we observed that TNF‐α induces a “scattered phenotype”, featuring cell dissociation from compact islands (EMT), reminiscent of the response elicited by HGF, the MET ligand (Figure 1A). We thus investigated whether MET was involved in mediating the effects of TNF‐α in the scatter assay, and in other assays that require EMT as a prerequisite, such as cell migration and invasion. To this purpose, we treated epithelial cells lines (lung carcinoma A549 and H322, and colon carcinoma SW‐48) with TNF‐α in the presence of specific MET inhibitors, such as the small‐molecule tyrosine kinase inhibitor JNJ‐38877605 (De Bacco et al., 2011), or the monovalent Fab fragment of the anti‐MET monoclonal antibody DN30 (MvDN30) (Pacchiana et al., 2010; Petrelli et al., 2006). The latter exerts a specific MET inhibitory activity by inducing the release (or shedding) of the extracellular domain of the MET protein (Supplementary Figure 1A). Either JNJ‐38877605 or MvDN30 fully inhibited cell scatter (Figure 1A), motility (Oris assay, Figure 1B), and invasion (Transwell assay, Figure 1C and Supplementary Figure 1B and C). Similar results were obtained in invasion assays with commercially available MET inhibitors such as PHA 665752 and Crizotinib (Supplementary Figure 1A, D and E), or in cells where MET expression was knocked‐down by siRNA (Figure 1D). The concomitant administration of TNF‐α and HGF enhanced the scatter, motility and invasion responses, suggesting a mechanism of synergism or (reciprocal) sensitization (Figure 1A–C). We further assessed whether TNF‐α was able to induce a pro‐invasive activity in a cell line (T47D, ductal breast epithelial cancer) that does not express MET, but its homolog RON (Yao et al., 2013), together with TNFR1 (Figure 1E). In this cell line, the RON ligand MSP induced cell migration and invasion, while TNF‐α was ineffective (Figure 1F).
Figure 1.
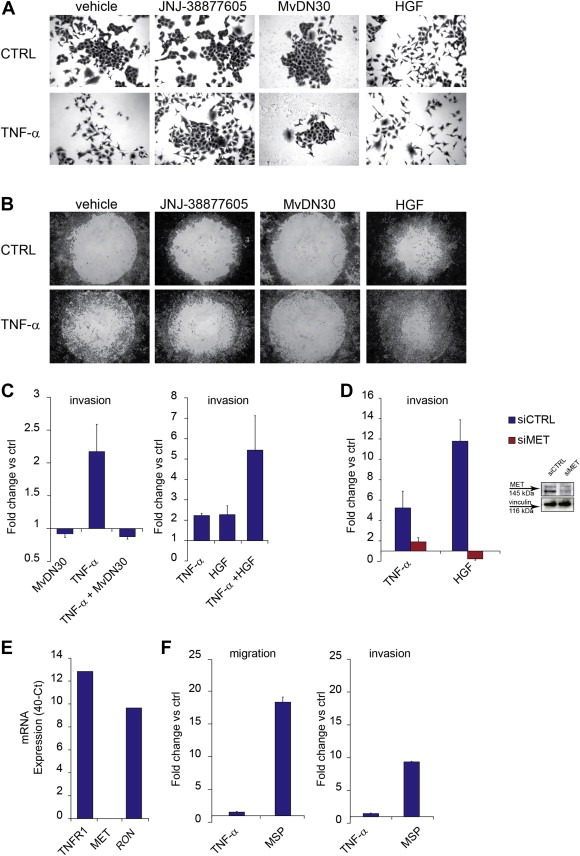
TNF‐α induces cell scatter, migration and invasion via MET. (A) Micrographs (10×) of A549 cell scatter, taken 24 h after treatment with TNF‐α (10 ng/ml), in the absence (vehicle) or in the presence of the MET small molecule kinase inhibitor JNJ‐38877605 (500 nM) or the monovalent Fab fragment of the anti‐MET monoclonal antibody DN30 (MvDN30, 0.28 μg/ml). HGF (50 ng/ml) was used alone as positive control, or in combination with TNF‐α. CTRL: cells without TNF‐α. (B) Micrographs (4×) of A549 cell migration assessed with Oris assay, taken 72 h after treatment with TNF‐α (10 ng/ml), in the absence (vehicle), or in the presence of JNJ‐38877605 (500 nM) or MvDN30 (28 μg/ml). HGF (50 ng/ml) was used alone as positive control, or in combination with TNF‐α. CTRL: cells without TNF‐α. (C) A549 cell invasion assessed in Transwell assay 24 h after treatment with TNF‐α (10 ng/ml), or MvDN30 (28 μg/ml), or the association of both (left panel), or after treatment with TNF‐α (10 ng/ml), or HGF (50 ng/ml), or the association of both (right panel). Graphs represent the fold change vs. control (untreated cells) of the number of invading cells. Bars: mean of three independent experiments ± S.E.M. (D) A549 cell invasion assessed in Transwell assay 24 h after treatment with TNF‐α (10 ng/ml) or HGF (50 ng/ml), in cells transfected 48 h before with siRNA against MET (siMET) or control siRNA (siCTRL). Graphs represent the fold change vs. control (untreated cells) of the number of invading cells. Bars: mean of three independent experiments ± S.E.M. Inset: Western blot showing MET protein in A549 cells treated for 48 h with siRNA against MET (siMET) or control siRNA (siCTRL). Vinculin was probed as control of equal protein loading. (E) qRT‐PCR showing TNFR1, MET and RON mRNA expression in T47D cells. Data were represented as 40‐ct. (F) T47D cell migration (left) and invasion (right) assessed in Transwell assay 48 h after treatment with TNF‐α (10 ng/ml), or MSP (50 ng/ml). Graphs represent the fold change vs. control of the number of migrating/invading cells. Bars: mean of three independent experiments ± S.E.M.
These results indicate that the migratory and pro‐invasive responses to TNF‐α require MET expression and activity.
3.2. MET inhibition does not interfere with TNF‐α pro‐apoptotic activity
TNF‐α exerts a bifunctional role, by promoting either cell death or survival in a context‐dependent manner (Balkwill, 2009). MET activation is crucial to protect cells from apoptosis induced by stressful events and DNA damaging agents, such as ionizing radiation (De Bacco et al., 2011). We thus reasoned that MET inhibition could unbalance the equilibrium between TNF‐α‐induced cell death and survival, in favor of apoptosis, leading to the “apparent” inhibition of cell migration and invasion. A549 cells were thus treated with TNF‐α (10 ng/ml, the dose used to induce the above pro‐invasive response), in the presence or in the absence of MET inhibitors (JNJ‐38877605 or MvDN30). Apoptosis was assessed by flow‐cytometric analysis of Annexin V labeling (Supplementary Figure 2A and B) and Caspase‐3 activation (Supplementary Figure 2C). In no case, MET inhibition associated with TNF‐α increased the number of apoptotic cells. We further assessed – again with negative results – whether association of MET inhibitors and TNF‐α induced necrosis, measured as release of lactate dehydrogenase (Supplementary Figure 2D).
Taken together, these results indicate that MET inhibition does not affect the pro‐invasive response to TNF‐α by unleashing the TNF‐α pro‐apoptotic activity.
3.3. TNF‐α induces MET expression via NF‐κB
Next, we investigated the molecular mechanisms linking the pro‐invasive activity of TNF‐α to MET, by assessing whether TNF‐α upregulates MET expression. In time‐course experiments with A549 cells, TNF‐α (10 ng/ml) induced a biphasic MET protein accumulation, peaking at 6 and at 24 h, as shown by Western blot analysis (Figure 2A). MET protein increase was associated with MET mRNA induction, as shown by quantitative Real‐Time PCR (Figure 2B). MET protein accumulation after stimulation with TNF‐α was observed also in other cell lines, although with different kinetics (Supplementary Figure 3A and B).
Figure 2.
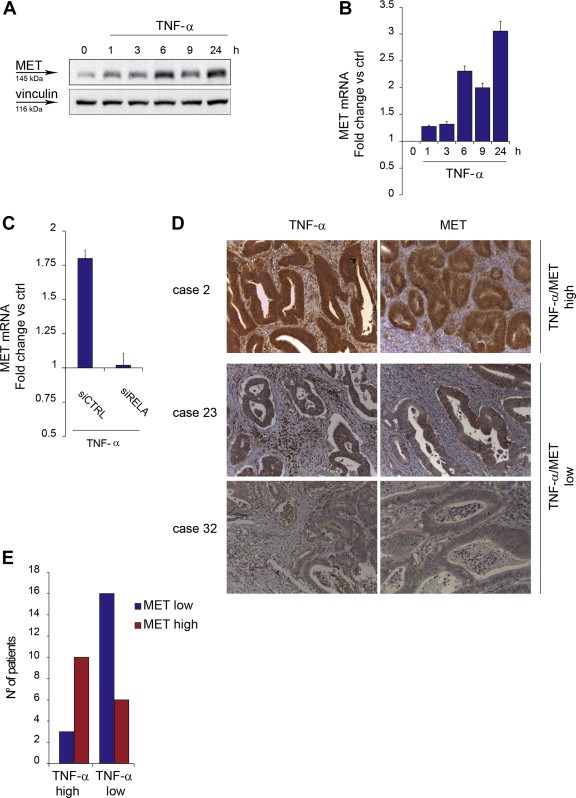
MET expression is induced by TNF‐α via NF‐κB and associates with TNF‐α in colorectal cancer. (A) Western blot showing MET protein in A549 cells at the indicated time‐points after TNF‐α treatment (10 ng/ml). Vinculin was probed as control of equal protein loading. (B) q‐RT PCR showing MET mRNA induction in A549 cells at the indicated time‐points after TNF‐α treatment (10 ng/ml). Data were normalized vs. PGK. Untreated cells were used as calibrator. Bars: mean of triplicate samples ± S.E.M of a representative experiment. (C) q‐RT PCR showing MET mRNA induction in A549 cells transfected 48 h before with siRNA against RELA (siRELA) or control siRNA (siCTRL), and treated with TNF‐α (10 ng/ml) for 6 h. Data were normalized vs. PGK. siRNA‐transfected, untreated cells were used as calibrator. Bars: mean of triplicate samples ± S.E.M of a representative experiment. (D) IHC analysis: sections of paraffin‐embedded human colorectal adenocarcinomas from representative cases stained with anti‐TNF‐α antibodies or anti‐MET antibodies. Case 2, TNF‐α/MET high: staining score 3+ for both; case 23, TNF‐α/MET low: staining score 2+ for both; case 32, staining score 2+ TNF‐α, 1+ MET. (E) Graph representing the number of patients that express high or low levels of TNF‐α in association with high or low levels of MET in their colorectal cancer sections, stained as in D. As detailed in Supplementary Table 1, TNF‐α high: staining score 3+ (13 cases); TNF‐α low: staining score 1+ and score 2+ (22 cases); MET high: staining score 3+ (16 cases); MET low: staining score 1+ or +2 (19 cases).
We then investigated whether NF‐κB, known to be a main transcription factor activated by TNF‐α, was responsible for MET induction. Therefore, expression of the NF‐κB transcriptionally functional subunit p65/RelA was knocked‐down in A549 cells by siRNAs specifically decreasing p65/RelA levels by approximately 90% (data not shown). Silencing p65/RELA completely prevented MET mRNA induction by TNF‐α, indicating that NF‐κB is indeed required for TNF‐α‐induced MET transcriptional upregulation (Figure 2C). The same was observed by treating cells with TNF‐α in the presence of IKK 16, an inhibitor of the kinase complex IKK that mediates NF‐κB activation by TNFR1 (Waelchli et al., 2006) (Supplementary Figure 3C).
Surprisingly, we also observed that IL‐1α or IL‐1β, two cytokines known to activate NF‐κB, did not induce either migration or increased MET expression in A549 (Supplementary Figure 3D and E). This unexpected result could be at least in part explained by the observation that IL‐1α and IL‐1β could not induce phosphorylation of the NF‐κB subunit RelA on Ser536, which is conversely detected after TNF‐α stimulation (Supplementary Figure 3F), and it is crucial for NF‐κB transcriptional activity (Jeong et al., 2005).
3.4. TNF‐α and MET expression correlate in colorectal cancers
In a panel of 35 surgical samples of primary colorectal adenocarcinoma (for clinical data see Supplementary Table 1), immunohistochemical analysis revealed that (i) TNF‐α is expressed – at variable levels – by both stromal and cancer cells; (ii) MET is detectable – at variable levels – almost exclusively in cancer cells (Figure 2D); (iii) high levels of TNF‐α expression significantly correlate with high levels of MET, and – vice versa – low TNF‐α significantly correlates with low MET (Figure 2E and Supplementary Table 1) (P = 0.0064, Fisher's exact test). The concordant expression between TNF‐α and MET suggests that an increased levels of the cytokine may support the expression of the oncogene in vivo.
3.5. Activation of MET signaling by TNF‐α
The blockade of the TNF‐α pro‐invasive response by MET kinase inhibitors implies that TNF‐α not only increases MET expression, but also activates MET signaling. To investigate this assumption, cells were treated with TNF‐α in time‐course experiments, and MET was immunoprecipitated and analyzed by Western blot with anti‐phospho‐tyrosine antibodies. A modest increase of MET phosphorylation was detectable, starting from 10 min and lasting up to 24 h (Supplementary Figure 4A). The extent of this phosphorylation was however comparable to that induced by sub‐optimal doses of HGF, ranging from 0.5 to 5 ng/ml (Supplementary Figure 4A), which are still capable of promoting the full spectrum of HGF biological activities (Naldini et al., 1991).
To explain the weak but significant MET phosphorylation stimulated by TNF‐α, we investigated whether TNF‐α induced HGF expression as well. However, we found that HGF mRNA was negligibly expressed by A549 cells (as well as other epithelial cells) at basal conditions, and not upregulated by TNF‐α (Supplementary Figure 4B and data not shown).
We then assessed whether, as in the case of other cell‐surface molecules, TNFR1 could physically associate with MET, thus contributing to its activation. A549 cells were treated with TNF‐α and analyzed in time‐course experiments by immunofluorescence with anti‐TNFR1 or anti‐MET antibodies. In confocal microscopy, no colocalization of the two receptors could be observed (Supplementary Figure 4C). Moreover, in co‐immunoprecipitation experiments, no association between TNFR1 and MET was detectable either in the absence or in the presence of TNF‐α (data not shown). Altogether, these experiments allowed to exclude that MET phosphorylation induced by TNF‐α resulted from direct interaction of the activated TNFR1 with MET.
We also investigated whether TNF‐α could regulate MET endocytosis and relocalization to the perinuclear compartment. This event, as a rule elicited by MET binding to HGF, was shown to facilitate activation of MET signaling, and its downstream transducers such as STAT3 and MAP kinases (Joffre et al., 2011; Kermorgant and Parker, 2008). However, unlike HGF, TNF‐α could not induce MET internalization from the cell surface and endocytosis, as observed by immunofluorescence (Supplementary Figure 5A), and cell surface biotinylation experiments (Supplementary Figure 5B).
Finally, we considered that TNFR1 activates SRC (Pincheira et al., 2008), which, in turn, can phosphorylate MET (Emaduddin et al., 2008). Indeed, in A549 cells TNF‐α activated SRC, but the specific SRC inhibitor Saracatinib (Bertotti et al., 2010) only weakly affected MET phosphorylation (data not shown). However, Saracatinib inhibited cell migration and invasion induced by TNF‐α (Supplementary Figure 5C), indicating that SRC may be critical to sustain the MET pro‐invasive signaling either directly or indirectly.
3.6. TNF‐α downregulates E‐cadherin via MET and the downstream MEK‐ERK/Snail pathway
Next we investigated whether TNF‐α exploited MET signaling to promote an early and crucial step of cell invasion such as E‐cadherin downregulation. Indeed, TNF‐α caused a strong decrease of E‐cadherin expression at the cell surface, which was prevented by the MET inhibitor, as observed by immunofluorescence (Figure 3A). It is known that both TNF‐α and HGF induce E‐cadherin downregulation through the transcriptional repressor Snail (Wu et al., 2009; Grotegut et al., 2006). This was confirmed in A549, where Snail silencing concomitantly prevented E‐cadherin downregulation (Figure 3B and Supplementary Figure 6A) and cell invasion induced by TNF‐α, as well as by HGF (Figure 3C). After TNF‐α stimulation, accumulation of the Snail protein was observed between 3 and 24 h, with a peak after 6 h, and abolished by the MET inhibitor (Figure 3D), suggesting that MET activation mediates Snail induction.
Figure 3.
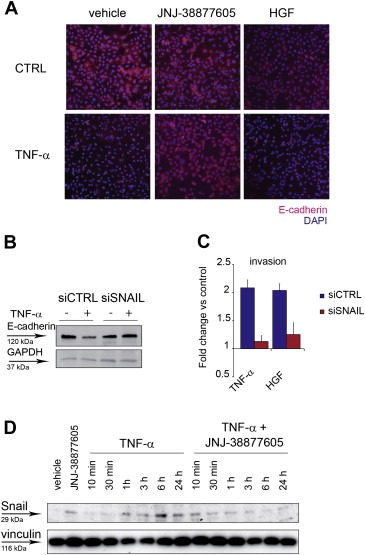
TNF‐α downregulates E‐cadherin via MET through Snail. (A) Immunofluorescence images (10×) of A549 cells treated with TNF‐α (10 ng/ml), in the presence of JNJ‐38877605 (500 nM), or vehicle (DMSO), or HGF (50 ng/ml), for 24 h. CTRL: cells without TNF‐α. Cells were stained with anti‐E‐cadherin antibodies (red). Nuclei were counterstained with DAPI (blue). (B) Western blot showing E‐cadherin protein in A549 transfected 48 h before with siRNA against Snail (siSNAIL) or control siRNA (siCTRL), and treated for 24 h with TNF‐α (10 ng/ml). GAPDH was probed as control of equal protein loading. (C) A549 invasion assessed in Transwell assay 24 h after treatment with TNF‐α (10 ng/ml), or HGF (50 ng/ml), in cells transfected 48 h before with siRNA against SNAIL (siSNAIL) or control siRNA (siCTRL). Graphs represent the fold change vs. control (untreated cells) of the number of invading cells. Bars: mean of three independent experiments ± S.E.M. (D) Western blot showing Snail protein in A549 cells at the indicated time‐points after treatment with TNF‐α (10 ng/ml), in the absence or in the presence of JNJ‐38877605 (500 nM). Vinculin was probed as control of equal protein loading.
Snail accumulation that follows MET stimulation by HGF has been associated with activation of the MAP kinase pathway (Grotegut et al., 2006). In time‐course experiments, TNF‐α induced phosphorylation of MEK, peaking at 10–30 min, and lasting up 6 h, and of p42/p44 ERK, peaking at 10–30 min and at 3–6 h. Both MEK and ERK phosphorylation was significantly reduced at late time‐points by concomitant treatment with TNF‐α and the MET inhibitor JNJ‐38877605, again suggesting that MET is required for prolonged activation of the pathway (Figure 4A and Supplementary Figure 7). Interestingly, phosphorylation of Akt, a signal transducer involved in protection from apoptosis, was induced by TNF‐α but unaffected by the MET inhibitor (Figure 4A). Activation of the MEK/ERK pathway was required to downregulate E‐cadherin and to induce Egr‐1, a transcription factor implied in Snail transcriptional induction by MET (Grotegut et al., 2006), as shown in cells treated with TNF‐α, and the specific MEK inhibitor PD 98059 (Figure 4B). Consistently, MEK inhibition or Egr‐1 silencing significantly prevented TNF‐α‐induced cell migration or invasion (Figure 4C and D and Supplementary Figure 6B).
Figure 4.
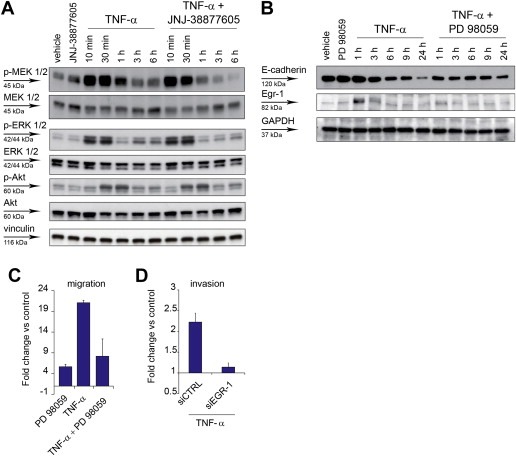
TNF‐α sustains the MEK‐ERK pathway through MET, and the MEK‐ERK pathway is required for cell invasion. (A) Western blot showing phosphorylation of MEK1/2 (p‐MEK 1/2), p42/44 ERK 1/2 (p‐ERK 1/2), and Akt (p‐Akt), and the respective total proteins, at the indicated time‐points after A549 treatment with TNF‐α (10 ng/ml), in the absence or in the presence of JNJ‐38877605 (500 nM). Vinculin was probed as control of equal protein loading. (B) Western blot showing E‐cadherin and Egr‐1 expression at the indicated time‐points after A549 treatment with TNF‐α (10 ng/ml), in the absence or in the presence of the MEK inhibitor PD 98059 (20 μM). GAPDH was probed as control of equal protein loading. (C) A549 cell migration assessed in Transwell assay 24 h after treatment with TNF‐α (10 ng/ml), in the absence or in the presence of PD 98059 (20 μM). Graphs represent the fold change vs. control (untreated cells) of the number of migrating cells. Bars: mean of three independent experiments ± SEM. (D) A549 cell invasion assessed in Transwell assay 24 h after treatment with TNF‐α (10 ng/ml), in cells transfected 48 h before with siRNA against EGR‐1 (siEGR‐1) or control siRNA (siCTRL). Graphs represent the fold change vs. control (untreated cells) of the number of invading cells. Bars: mean of three independent experiments ± S.E.M.
Taken together, these experiments indicate that the presence of a functional MET is required for Snail accumulation and E‐cadherin downregulation by TNF‐α. Among signaling pathways depending of MET, sustained activation of MEK/MAP kinases and induction of transcription factor Egr‐1 are likely critical to mediate cell migration and invasion induced by TNF‐α.
3.7. TNF‐α induces HGF expression by fibroblasts, and correlates with HGF in an inflammatory colorectal cancer subtype
As observed in scatter, migration and invasion experiments (Figure 1), TNF‐α and HGF synergize. A likely explanation is that increased expression of MET induced by TNF‐α sensitizes cells to HGF, as observed in cases of MET overexpression sustained by ionizing radiation or hypoxia (De Bacco et al., 2011; Pennacchietti et al., 2003). We further reasoned that, if HGF would be transcribed together with MET in response to TNF‐α, as indicated by previous findings (Tamura et al., 1993), this could result in a marked enhancement of the pro‐invasive MET signaling. However, we found that this was not the case in carcinoma cells, as shown by HGF mRNA and protein analysis (Supplementary Figure 4B and data not shown). Refractoriness of epithelial cells to express HGF is not surprising, as, during differentiation, this gene is repressed in cells of endodermal or ectodermal origin, while it is expressed in cells of mesodermal origin, thus allowing formation of paracrine loops (Sonnenberg et al., 1993). Consistently, we found that, in fibroblasts, TNF‐α induced both HGF mRNA and pro‐HGF, the secreted precursor of the factor activated by extracellular proteolytic cleavage (Naldini et al., 1992) (Figure 5A and B).
Figure 5.
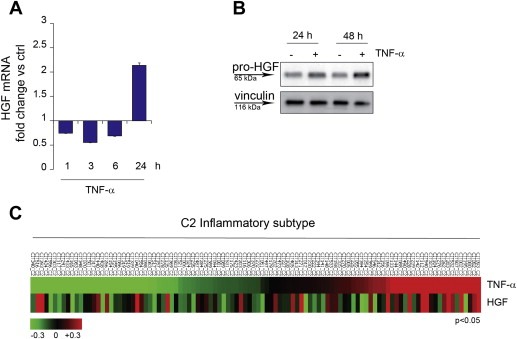
TNF‐α induces HGF expression by fibroblasts in vitro and correlates with HGF in an inflammatory colorectal cancer subtype. (A) q‐RT PCR showing HGF mRNA accumulation in MRC‐5 fibroblasts at the indicated time‐points after TNF‐α treatment (10 ng/ml). Data were normalized against endogenous control (GAPDH). Untreated cells were used as calibrator. Bars: mean of triplicate samples ± S.E.M of a representative experiment. (B) Western blot showing the HGF precursor pro‐HGF in MRC‐5 fibroblasts at the indicated time‐points after TNF‐α treatment (10 ng/ml). Vinculin was probed as control of equal protein loading. (C) Heatmap showing association of TNF‐α and HGF expression in the C2 inflammatory subtype (104 samples) of a colorectal cancer dataset (Marisa et al., 2013) (Pearson = 0.24, P < 0.05).
We then investigated whether TNF‐α and HGF expression correlate in tumor tissues. As immunohistochemical detection of HGF is unreliable, owing to unspecific immunoreactivity of the available antibodies (data not shown), we analyzed a large dataset of colon cancer global gene expression (566 cases), used for classification into six molecular subtypes (C1–C6) (Marisa et al., 2013). Not surprisingly, we found that TNF‐α expression was higher in C2 (104 cases), the subtype defined by a signature enriched in genes of the immune system/inflammatory response (Marisa et al., 2013). Interestingly, in this subtype, tumors expressing high levels of TNF‐α expressed also high levels of HGF, and the correlation was statistically significant (Pearson = 0.24, P < 0.05) (Figure 5C).
Taken together, these findings suggest that TNF‐α not only induces MET expression in carcinoma cells, but also expression of its ligand HGF in fibroblasts, a finding reflected in cancer tissues, thus suggesting that a perilous pro‐invasive paracrine circuit involving TNF‐α, HGF and MET may take place in vivo.
4. Discussion
It is now recognized that the “hallmarks of cancer” are modulated by the (inflammatory) microenvironment, but at different extents (Hanahan and Coussens, 2012). Whereas the basic hallmarks such as self‐sustained proliferation, evasion from apoptosis, and replicative immortality mainly rely on genetic alteration of specific signal transduction pathways, and thus are largely cell‐autonomous, the most advanced and lethal hallmarks, i.e. invasion and metastasis, are not yet firmly associated with specific genetic lesions, and may be crucially sustained by “landscaping factors” provided by accessory cells of the microenvironment. However, one could envision that key extracellular pro‐invasive signals still impinge on intracellular oncogenic pathways.
In this work we show that cell scatter, migration and invasion induced by TNF‐α are prevented by treatment with inhibitors (small‐molecules or monoclonal antibodies) of the tyrosine kinase receptor encoded by the MET oncogene. MET is well known for its ability to sustain “invasive growth”, a genetic program physiologically performed by stem/progenitor cells for development and tissue regeneration, and inappropriately activated by cancer cells for invasion and metastasis (Trusolino et al., 2010). Interestingly, the cooperation between TNF‐α and MET is committed to the pro‐invasive response and does not interfere with the context‐dependent control of TNF‐α on apoptosis (Balkwill, 2009).
We then observed that the pro‐invasive activity of TNF‐α associates with transcriptional upregulation of MET. Similarly, we previously reported that ionizing radiation induces invasive growth, and that the latter requires MET transcriptional upregulation. Notably, we showed that MET induction in irradiated cells is mediated by direct binding of NF‐κB to the MET promoter. In irradiated cells, NF‐κB is the crossroad of two pathways: one “intrinsic”, starting with activation of ATM kinase by DNA damage, which, in turn, activates NF‐κB through the regulatory complex IKK; the other “extrinsic”, entailing expression of TNF‐α by irradiated cells and autocrine stimulation (De Bacco et al., 2011). Starting from these observations, we now show that TNF‐α is directly responsible for MET transcriptional regulation, through the functional NF‐κB subunit p65/RelA, consistently with data obtained by others in murine models (Dai et al., 2009). Interestingly, we also found that, in cell lines such as A549, other cytokines activating NF‐κB, such as IL‐1α and IL‐1β, fail to induce MET accumulation, as well as cell scatter and invasion. Indeed we found that, unlike TNF‐α, these cytokines could not induce phosphorylation of p65/RelA at Ser536, which is required to sustain NF‐κB transcriptional activity (Jeong et al., 2005). This is at variance with previous data (Moghul et al., 1994), and may depend of the cellular context.
The reported experiments make a strong point about the involvement of the MET kinase in the signaling cascade triggered by TNF‐α to elicit the pro‐invasive phenotype. However, the detailed mechanism of MET kinase activation by TNF‐α remains to be fully elucidated. Two main hypotheses were challenged and disproved: (i) first, we considered concomitant induction of the MET ligand HGF (a known NF‐κB target gene) (Harrison and Farzaneh, 2000). This was excluded, at least in epithelial cell lines, by lack of HGF mRNA or protein expression after TNF‐α treatment. (ii) Second, as it was shown that MET can be activated by physical interaction with other surface receptors, including molecules lacking tyrosine kinase activity (Trusolino et al., 2010), we hypothesized that the activated TNF receptor could oligomerize with MET. This was ruled out by lack of receptor co‐precipitation, and by lack of receptor co‐localization after fluorescent immunostaining and confocal microscopy. We can also hypothesize that MET phosphorylation is mediated by an intracellular kinase. A likely candidate is SRC, which is known to phosphorylate MET (Emaduddin et al., 2008), and can be activated by the TNF Receptor (Pincheira et al., 2008). Indeed, in A549 cells, TNF‐α activated SRC, and invasion promoted by TNF‐α was prevented by the specific SRC inhibitor Saracatinib (Bertotti et al., 2010), but modulation of MET phosphorylation was barely detectable. These findings suggest that SRC involvement in the crosstalk between TNF receptor and MET is probable, but not conclusively proven. Moreover, we can propose that, when the MET protein accumulates as result of transcriptional upregulation, ligand‐independent receptor oligomerization may be favored. This phenomenon has been well documented in a number of conditions implying higher levels of MET expression, such as MET gene amplification (Giordano et al., 1989), or transcriptional upregulation by hypoxia or ionizing radiation (Pennacchietti et al., 2003; De Bacco et al., 2011).
Whatever the mechanisms linking TNF‐α to MET activation, we could show that the pro‐invasive response to TNF‐α relies on a chain of events depending of MET or its downstream transducers. In particular, (i) sustained MEK/ERK activation; (ii) accumulation of Snail protein; and (iii) E‐cadherin downregulation were shown to be prevented by specific MET inhibitors. Moreover, we showed that transcription factor Egr‐1, known to promote Snail induction after HGF stimulation (Grotegut et al., 2006), is required for migration induced by TNF‐α as well, and accumulates only in the presence of active MEK/ERK pathway. Conversely, CSN2, a NF‐κB target known to prevent Snail degradation (Wu et al., 2009), was not induced by TNF‐α in our experimental setting (data not shown).
Finally, we showed that, while TNF‐α does not induce expression of HGF in epithelial cancer cells, it does so in fibroblasts, frequently associated with the inflammatory tumor microenvironment (Hanahan and Coussens, 2012). This in vitro finding was reverberated by a significant association between TNF‐α and HGF expression in the “inflammatory subtype” of human colorectal cancers, classified on the basis of gene expression signatures (Marisa et al., 2013).
Taken together, the data presented in this paper allow to move a step ahead in understanding the relationship between the inflammatory microenvironment and cancer cells. It has been previously shown that NF‐κB sustains tumor progression by driving in fibroblasts expression of cytokines, among which TNF‐α is both a target and an activator of NF‐κB (Erez et al., 2010). We now show that TNF‐α bridges fibroblasts to cancer cells via the HGF/MET paracrine circuit, enabling the invasive growth program. As TNF‐α induces its own expression in both accessory and cancer cells (see Supplementary Figure 4B), chronic inflammation perpetuates and cell invasion is self‐sustained (Grivennikov et al., 2010). Therefore, inhibition of TNF‐α should prevent invasion, as well as other cancer hallmarks associated with inflammation, as shown in preclinical models (Popivanova et al., 2008). However, clinical studies showed that administration of TNF‐α antibodies to arthritis rheumatoid patients may increase the risk of serious infections and malignancies (Bongartz et al., 2006). Moreover, NF‐κB inhibitors caused severe immune deficiency and paradoxical acute inflammation in mice, hindering further development of human NF‐κB inhibitors (Grivennikov et al., 2010). To counteract cancer invasion associated with inflammation, an attractive alternative to TNF‐α inhibitors could be MET inhibitors, which conjugate effective and specific targeting of the pro‐invasive pathway with an acceptable level of toxicity (Peters and Adjei, 2012).
Authors' contributions
VB, FDB, LL and CB designed the experiments; VB, FDB, EC, and GR performed experiments; IS performed IHC analysis; CI analyzed bionformatic data; VB, PMC and CB wrote the paper.
Conflict of interest
The authors disclose no potential conflicts of interest.
Financial support
Research was supported by AIRC, Italian Association for Cancer Research (“Special Program Molecular Clinical Oncology 5xMille, N. 9970”; Investigator Grants N. 10446 to C. Boccaccio, N. 11852 to P.M. Comoglio).
Supporting information
The following is the supplementary data related to this article:
Supplementary data
Acknowledgments
We thank Francesco Sassi and Sabrina Rizzolio for help with analysis, Paolo Luraghi for discussion, and Raffaella Albano for technical help. JNJ‐38877605 was kindly provided by Dr. Timothy Perera (Janssen Research and Development).
Supplementary data 1.
1.1.
Supplementary data related to this article can be found at http://dx.doi.org/10.1016/j.molonc.2014.09.002.
Bigatto Viola, De Bacco Francesca, Casanova Elena, Reato Gigliola, Lanzetti Letizia, Isella Claudio, Sarotto Ivana, Comoglio Paolo M., Boccaccio Carla, (2015), TNF‐α promotes invasive growth through the MET signaling pathway, Molecular Oncology, 9, doi: 10.1016/j.molonc.2014.09.002.
Contributor Information
Paolo M. Comoglio, Email: antonella.cignetto@ircc.it
Carla Boccaccio, Email: carla.boccaccio@ircc.it.
References
- Balkwill, F. , 2006. TNF-alpha in promotion and progression of cancer. Cancer Metastasis Rev. 25, 409–416. [DOI] [PubMed] [Google Scholar]
- Balkwill, F. , 2009. Tumour necrosis factor and cancer. Nat. Rev. Cancer. 9, 361–371. [DOI] [PubMed] [Google Scholar]
- Bates, R.C. , Mercurio, A.M. , 2003. Tumor necrosis factor-alpha stimulates the epithelial-to-mesenchymal transition of human colonic organoids. Mol. Biol. Cell. 14, 1790–1800. [DOI] [PMC free article] [PubMed] [Google Scholar]
- Bernards, R. , Weinberg, R.A. , 2002. A progression puzzle. Nature. 418, 823 [DOI] [PubMed] [Google Scholar]
- Bertotti, A. , 2010. Inhibition of Src impairs the growth of met-addicted gastric tumors. Clin. Cancer Res. 16, 3933–3943. [DOI] [PubMed] [Google Scholar]
- Boccaccio, C. , Comoglio, P.M. , 2006. Invasive growth: a MET-driven genetic programme for cancer and stem cells. Nat. Rev. Cancer. 6, 637–645. [DOI] [PubMed] [Google Scholar]
- Bongartz, T. , 2006. Anti-TNF antibody therapy in rheumatoid arthritis and the risk of serious infections and malignancies: systematic review and meta-analysis of rare harmful effects in randomized controlled trials. JAMA. 295, 2275–2285. [DOI] [PubMed] [Google Scholar]
- Chen, Q. , 1996. Induction of met proto-oncogene (hepatocyte growth factor receptor) expression during human monocyte-macrophage differentiation. Cell Growth Differ. 7, 821–832. [PubMed] [Google Scholar]
- Dai, J.Y. , 2009. The Met protooncogene is a transcriptional target of NF kappaB: implications for cell survival. J. Cell Biochem. 107, 1222–1236. [DOI] [PMC free article] [PubMed] [Google Scholar]
- De Bacco, F. , 2011. Induction of MET by ionizing radiation and its role in radioresistance and invasive growth of cancer. J. Natl. Cancer Inst. 103, 645–661. [DOI] [PubMed] [Google Scholar]
- Emaduddin, M. , 2008. Cell growth, global phosphotyrosine elevation, and c-Met phosphorylation through Src family kinases in colorectal cancer cells. Proc. Natl. Acad. Sci. USA. 105, 2358–2362. [DOI] [PMC free article] [PubMed] [Google Scholar]
- Erez, N. , 2010. Cancer-Associated fibroblasts are activated in Incipient Neoplasia to Orchestrate tumor-promoting inflammation in an NF-kappaB-dependent manner. Cancer Cell. 17, 135–147. [DOI] [PubMed] [Google Scholar]
- Fu, L. , Medico, E. , 2007. FLAME, a novel fuzzy clustering method for the analysis of DNA microarray data. BMC Bioinformatics. 8, 3 [DOI] [PMC free article] [PubMed] [Google Scholar]
- Giordano, S. , 1989. Tyrosine kinase receptor indistinguishable from the c-met protein. Nature. 339, 155–156. [DOI] [PubMed] [Google Scholar]
- Grivennikov, S.I. , 2010. Immunity, inflammation, and cancer. Cell. 140, 883–899. [DOI] [PMC free article] [PubMed] [Google Scholar]
- Grotegut, S. , 2006. Hepatocyte growth factor induces cell scattering through MAPK/Egr-1-mediated upregulation of Snail. EMBO J. 25, 3534–3545. [DOI] [PMC free article] [PubMed] [Google Scholar]
- Hanahan, D. , Coussens, L.M. , 2012. Accessories to the crime: functions of cells recruited to the tumor microenvironment. Cancer Cell. 21, 309–322. [DOI] [PubMed] [Google Scholar]
- Hanahan, D. , Weinberg, R.A. , 2011. Hallmarks of cancer: the next Generation. Cell. 144, 646–674. [DOI] [PubMed] [Google Scholar]
- Harrison, P.M. , Farzaneh, F. , 2000. Regulation of HGF/SF gene expression in MRC-5 cells by N-acetylcysteine. Biochem. Biophys. Res. Commun. 279, 108–115. [DOI] [PubMed] [Google Scholar]
- Jeong, S.J. , 2005. A novel NF-kappaB pathway involving IKKbeta and p65/RelA Ser-536 phosphorylation results in p53 Inhibition in the absence of NF-kappaB transcriptional activity. J. Biol. Chem. 280, 10326–10332. [DOI] [PubMed] [Google Scholar]
- Joffre, C. , 2011. A direct role for Met endocytosis in tumorigenesis. Nat. Cell Biol. 13, 827–837. [DOI] [PubMed] [Google Scholar]
- Karin, M. , 2006. Nuclear factor-kappaB in cancer development and progression. Nature. 441, 431–436. [DOI] [PubMed] [Google Scholar]
- Kermorgant, S. , Parker, P.J. , 2008. Receptor trafficking controls weak signal delivery: a strategy used by c-Met for STAT3 nuclear accumulation. J. Cell Biol. 182, 855–863. [DOI] [PMC free article] [PubMed] [Google Scholar]
- Malik, S.T. , 1990. Cells secreting tumour necrosis factor show enhanced metastasis in nude mice. Eur. J. Cancer. 26, 1031–1034. [DOI] [PubMed] [Google Scholar]
- Marisa, L. , 2013. Gene expression classification of colon cancer into molecular subtypes: characterization, validation, and prognostic value. Plos Med. 10, e1001453 [DOI] [PMC free article] [PubMed] [Google Scholar]
- Moghul, A. , 1994. Modulation of c-MET proto-oncogene (HGF receptor) mRNA abundance by cytokines and hormones: evidence for rapid decay of the 8 kb c-MET transcript. Oncogene. 9, 2045–2052. [PubMed] [Google Scholar]
- Montesano, R. , 2005. Tumour necrosis factor alpha confers an invasive, transformed phenotype on mammary epithelial cells. J. Cell Sci. 118, 3487–3500. [DOI] [PubMed] [Google Scholar]
- Naldini, L. , 1991. Scatter factor and hepatocyte growth factor are indistinguishable ligands for the MET receptor. EMBO J. 10, 2867–2878. [DOI] [PMC free article] [PubMed] [Google Scholar]
- Naldini, L. , 1992. Extracellular proteolytic cleavage by urokinase is required for activation of hepatocyte growth factor/scatter factor. EMBO J. 11, 4825–4833. [DOI] [PMC free article] [PubMed] [Google Scholar]
- Orosz, P. , 1993. Enhancement of experimental metastasis by tumor necrosis factor. J. Exp. Med. 177, 1391–1398. [DOI] [PMC free article] [PubMed] [Google Scholar]
- Pacchiana, G. , 2010. Monovalency unleashes the full therapeutic potential of the DN-30 anti-Met antibody. J. Biol. Chem. 285, 36149–36157. [DOI] [PMC free article] [PubMed] [Google Scholar]
- Pennacchietti, S. , 2003. Hypoxia promotes invasive growth by transcriptional activation of the met protooncogene. Cancer Cell. 3, 347–361. [DOI] [PubMed] [Google Scholar]
- Peters, S. , Adjei, A.A. , 2012. MET: a promising anticancer therapeutic target. Nat. Rev. Clin. Oncol. 9, 314–326. [DOI] [PubMed] [Google Scholar]
- Petrelli, A. , 2006. Ab-induced ectodomain shedding mediates hepatocyte growth factor receptor down-regulation and hampers biological activity. Proc. Natl. Acad. Sci. USA. 103, 5090–5095. [DOI] [PMC free article] [PubMed] [Google Scholar]
- Pincheira, R. , 2008. Type 1 TNF receptor forms a complex with and uses Jak2 and c-Src to selectively engage signaling pathways that regulate transcription factor activity. J. Immunol. 181, 1288–1298. [DOI] [PubMed] [Google Scholar]
- Popivanova, B.K. , 2008. Blocking TNF-alpha in mice reduces colorectal carcinogenesis associated with chronic colitis. J. Clin. Invest. 118, 560–570. [DOI] [PMC free article] [PubMed] [Google Scholar]
- Prat, M. , 1991. The receptor encoded by the human c-MET oncogene is expressed in hepatocytes, epithelial cells and solid tumors. Int. J. Cancer. 49, 323–328. [DOI] [PubMed] [Google Scholar]
- R: Development Core Team, 2004. R: A Language and Environment for Statistical Computing. [Google Scholar]
- Sonnenberg, E. , 1993. Expression of the met-receptor and its ligand, HGF-SF during mouse embryogenesis. EXS. 65, 381–394. [PubMed] [Google Scholar]
- Tamura, M. , 1993. Enhancement of human hepatocyte growth factor production by interleukin-1 alpha and -1 beta and tumor necrosis factor-alpha by fibroblasts in culture. J. Biol. Chem. 268, 8140–8145. [PubMed] [Google Scholar]
- Thiery, J.P. , 2009. Epithelial-mesenchymal transitions in development and disease. Cell. 139, 871–890. [DOI] [PubMed] [Google Scholar]
- Trusolino, L. , 2010. MET signalling: principles and functions in development, organ regeneration and cancer. Nat. Rev. Mol. Cell Biol. 11, 834–848. [DOI] [PubMed] [Google Scholar]
- Vermeulen, L. , 2010. Wnt activity defines colon cancer stem cells and is regulated by the microenvironment. Nat. Cell Biol. 12, 468–476. [DOI] [PubMed] [Google Scholar]
- Waelchli, R. , 2006. Design and preparation of 2-benzamido-pyrimidines as inhibitors of IKK. Bioorg. Med. Chem. Lett. 16, 108–112. [DOI] [PubMed] [Google Scholar]
- Wu, Y. , 2009. Stabilization of snail by NF-kappaB is required for inflammation-induced cell migration and invasion. Cancer Cell. 15, 416–428. [DOI] [PMC free article] [PubMed] [Google Scholar]
- Yao, H.P. , 2013. MSP-RON signalling in cancer: pathogenesis and therapeutic potential. Nat. Rev. Cancer. 13, 466–481. [DOI] [PubMed] [Google Scholar]
Associated Data
This section collects any data citations, data availability statements, or supplementary materials included in this article.
Supplementary Materials
The following is the supplementary data related to this article:
Supplementary data