

Abstract
The human epidermal growth factor receptor 2 (HER2) and the protein tyrosine kinase 6 (PTK6) are often co‐ and over‐expressed in invasive breast cancers. At early diagnosis, only distinct groups, such as HER2‐or hormone receptor‐positive benefit from a targeted therapy. However, a part of these tumours develops resistance within a year of administration of the drug but the majority of the patients depends on general therapies with severe side effects. A PTK6‐directed approach does not yet exist.
In our present study, we successfully demonstrate, in vitro and in vivo, a significantly additive reduction of tumourigenesis of breast cancer cells simultaneously depleted of both HER2 and PTK6. In comparison with single RNAi approaches, the combined RNAi (co‐RNAi) led to a stronger reduced phosphorylation of tumour‐promoting proteins. Moreover, the co‐RNAi additively decreased cell migration as well as two and three dimensional cell proliferation in vitro. The in vivo experiments showed an additive reduction (p < 0.00001) in the growth of xenografts due to the co‐RNAi compared with HER2 or PTK6 RNAi alone. Interestingly, the complexes of HER2 or PTK6 with tumour‐relevant interaction partners, such as HER3 or the insulin‐like growth factor receptor 1 (IGF‐1R), respectively, were also reduced in xenografts although their protein expression levels were not affected following the co‐RNAi of HER2 and PTK6. Our present study reveals the potential of using combined HER2‐ and PTK6‐ knockdown as a powerful strategy for the treatment of breast cancers. Therefore, the combined inhibition of these proteins may represent an attractive tool for efficient therapy of breast cancers.
Keywords: RNA interference, Combined, Brk, ErbB2, Proximity ligation assay, PLA
Highlights
co‐RNAi of HER2 and PTK6 additively inhibits 2D and 3D tumour cell proliferation.
co‐RNAi of HER2 and PTK6 additively impairs in vivo tumour growth.
RNAi of HER2 and/or PTK6 reduces complexes with tumour‐promoting proteins.
co‐RNAi of HER2 and PTK6 is a powerful strategy for breast cancer therapy.
Abbreviations
- Brk
breast tumour kinase
- EGFR
epidermal growth factor receptor
- ERK
extracellular signal‐regulated kinase
- FFPE
formalin‐fixed and paraffin‐embedded
- GAPDH
glycerylaldehyde‐3‐phosphate dehydrogenase
- GFP
green fluorescent protein
- HER
human epidermal growth factor receptor
- IGF‐1R
insulin‐like growth factor receptor
- IHC
immunohistochemistry
- IR
insulin receptor
- MAPK
mitogen‐activated protein kinase
- MMP
matrix metalloproteinase
- PI‐3K
phosphatidylinositol‐3 kinase
- PLA
proximity ligation assay
- PTEN
phosphatase and tensin homologue
- PTK6
protein tyrosine kinase 6
- RNAi
RNA interference
- shRNA
small hairpin RNA
- SH
Src homology
- STAT
signal transducer and activator of transcription
- 2/3 D
two or three dimensional
- uPA
urokinase‐type plasminogen activator
- uPAR
uPA receptor
1. Introduction
Breast cancer is currently the most common malignant cancer found in women of the Western world (Jemal et al., 2011). A subgroup of these patients benefits from targeted therapies directed towards HER2 or the hormone receptors; however, most rely on general therapies that are often associated with severe side effects (Sergina and Moasser, 2007). In addition, the HER2‐directed approach using the humanized antibody Trastuzumab also exhibits side effects such as cardiotoxicity and often leads to the development of resistance within a year of receiving the therapy (Sparano, 2001). Some patients initially benefit from combination treatment with Trastuzumab and Lapatinib, a small‐molecule tyrosine kinase inhibitor directed towards the EGF receptor (EGFR/HER1) and HER2 (Kopper, 2008). The clinically relevant oncogene her2 is highly expressed in approximately 25% of breast cancers (Ross et al., 2003). Its overexpression promotes breast cancer malignancy and correlates with a poor prognosis. Because HER2 is an orphan receptor, its activation results from the homo‐ or heterodimerisation that occurs between the extracellular domains of other HER receptors followed by the interaction of their intracellular domains and phosphorylation of their tyrosine residues (Sergina and Moasser, 2007). With regards to breast cancer in particular, the HER2/HER3 dimers have been shown to be the most stable and effective dimer that leads to the most aggressive phenotypes with poor prognosis in patients (Citri et al., 2003; Sliwkowski et al., 1994; Spears et al., 2012). Remarkably, HER3 lacks critical residues in its catalytic domain and therefore it depends on a heterodimer with a receptor, e.g. HER2 to trigger signal transduction. HER2 in turn lacks an activating ligand and can act only through the heterodimerisation with a ligand‐binding receptor (Citri et al., 2003). Following homo‐ or heterodimerisation, many proliferation‐ and tumour‐promoting downstream pathways are activated, including the mitogen‐activated protein kinase/extracellular signal‐regulated kinase (MAPK/ERK), phosphatidylinositol‐3 kinase (PI3K)/Akt and signal transducer and activator of transcription 3 (STAT3) signalling cascades (Kamalati et al., 1996; Ludyga et al., 2011; Moasser, 2007; Xiang et al., 2008).
An additional signalling molecule of high importance in breast cancer is the non‐receptor protein tyrosine kinase PTK6 (also called Brk); it is overexpressed in approximately 80% of invasive breast cancers and in most breast cancer cell lines and it has been shown to promote tumourigenesis (Barker et al., 1997; Derry et al., 2003; Kamalati et al., 1996; Llor et al., 1999). In normal mammary tissue or benign tumours, it is poorly expressed or undetectable (Barker et al., 1997). The Src‐related PTK6 (44% amino acid sequence homology with Src) contains SH3, SH2 and a kinase domain, but it lacks the N‐terminal myristoylation domain required for lipid modification and membrane anchorage (Mitchell et al., 1997; Serfas and Tyner, 2003). Therefore, PTK6 appears to be more closely related to a distinct non‐receptor tyrosine kinase family known as the Frk family, which includes Frk, Brk/PTK6, Srm and Sik (Serfas and Tyner, 2003). Several substrates and interaction partners of PTK6, such as HER1‐3, ERK members, STAT3 and STAT5, Akt, phosphatase and tensin homologue on chromosome ten (PTEN) and IGF‐1R, have been identified over the last few years and are often involved in tumourigenesis (Aubele et al., 2008, 2013, 2010, 2000, 1996, 2006, 2007, 2005, 2007, 2008, 2005). Particularly, PTK6 was described to positively regulate IGF‐1R‐mediated signalling resulting in enhanced survival of breast and ovarian cancer cells (Fan et al., 2013; Irie et al., 2010).
Previous studies from our group and others have demonstrated a strong association and functional interaction between HER2 and PTK6 in mammary tumours and breast cancer cell lines (Aubele et al., 2010, 2008, 2011, 2008). Ai and colleagues have found that HER2 positively regulates PTK6 stability through the upregulation of calpastatin, which inhibits calpain‐1‐mediated PTK6 proteolysis (Ai et al., 2013). Recently, we have demonstrated a significant reduction of proliferation in vitro and in vivo following PTK6 knockdown in HER2‐positive and Trastuzumab‐resistant JIMT‐1 breast cancer cells (Ludyga et al., 2013). Therefore, PTK6 may be an interesting candidate for the HER2‐targeted therapy of breast cancers, including Trastuzumab‐resistant tumours. However, PTK6 inhibition (or its combination with anti‐HER2 therapy) has not yet been tested clinically (Zeng et al., 2011). Single knockdowns of HER2 or PTK6 or combination RNAi approaches with other tumour‐promoting signalling proteins (e.g. uPAR, uPA or MMP9 as shown by our group and others) led to reduced tumour progression in vitro and in vivo (Kunigal et al., 2007; Li et al., 2010; Ludyga et al., 2013; Subramanian et al., 2006). Recently, we performed simultaneous knockdown of HER2 and PTK6; however, an additive effect of the combination RNAi approach could only be shown in vitro (Ludyga et al., 2013). Since tumours are heterogeneous (Easwaran et al., 2014), in the present study, we used additional model cell lines and we have successfully demonstrated a strong additive reduction in mammary tumour progression following co‐RNAi in vitro and in vivo. Considering that PTK6 may be a promising therapeutic target, including Trastuzumab‐resistant tumour cells, and that the combined depletion of both PTK6 and HER2 leads to a strong and additive reduction in malignancy, the co‐inhibition of HER2 and PTK6 could efficiently improve breast cancer therapy.
2. Material and methods
2.1. Cell culture and stable transductions
The following three human breast cancer cell lines were used in this study: BT474, MDA‐MB‐361 and SKBR3. The BT474 (HTB‐20), MDA‐MB‐361 (HTB‐27) and SKBR3 (HTB‐30) cells were acquired from the American Type Culture Collection (Manassas, VA, USA). Cells were maintained in DMEM supplemented with GlutaMAX (Dulbecco's Modified Eagle's Medium, Life Technologies GmbH, Darmstadt, DE). The medium was also supplemented with 10% foetal bovine serum (FBS, Life Technologies GmbH, Darmstadt, DE) for the BT474 and SKBR3 cells or 20% FBS for the MDA‐MB‐361 cells, 0.25% of both penicillin and streptomycin (Life Technologies GmbH, Darmstadt, DE), or with 1% FBS when serum‐independent effects were analysed during the migration assay. The cells were maintained at 37 °C in 5% CO2. The cells have been authenticated before starting the experiments. Genetic profiles were generated by the company Eurofins (MWG Operon, Ebersberg, DE) and analysed as previously described (Ludyga et al., 2013).
The viral particles were purchased from Thermo Fisher Scientific (Lafayette, CO, USA) and each HER2‐, PTK6‐ and the co‐RNAi cell approach was infected using a pool of viral particles (with three different shRNA sequences) each at a multiplicity of infection (MOI) of 10. All viral particles were tested for specificity before the respective experiments were started. A total of 2.0 × 10⁵ breast cancer cells were infected with lentiviral vectors for the knockdown of PTK6 (PTK6‐RNAi), of HER2 (HER2‐RNAi), as well as with controls and polybrene (Invitrogen, Carlsbad, CA, USA) as described (Falkenberg et al., 2013). The negative control is a non‐targeting shRNA vector (Neg_ctrl) and the positive control leads to GAPDH knockdown (GAPDH‐RNAi) showing infection efficiency. All of the lentiviral vectors encode a green fluorescence protein (GFP) for visualization and a puromycin‐N‐acetyl transferase as selection marker. The supernatants were removed 24 h after infection, and fresh medium was added. After additional 24 h, the infected cells were selected using puromycin (2 μg/ml) and cultured for five to eight weeks. All infections were performed in duplicate. Infected cells were regularly subjected to Western blot analysis to determine knockdown efficiencies.
2.2. Western blot analysis
The three breast cancer cell lines were treated as previously described (Ludyga et al., 2011) for SDS‐PAGE, the subsequent Western blot analysis and quantification, and the antibodies were employed as recently described (Ludyga et al., 2013). In addition, primary antibodies for the detection of IGF‐1R (3027), phospho‐ERK5 (3371) and total ERK5 (3372, Cell Signaling Technology, Danvers, MA, USA) were used.
2.3. Wound scratch migration assay
The migration assay was performed in triplicate under serum‐reduced conditions to reduce proliferation and the open areas were quantified using TScratch software as previously described (Liang et al., 2007; Ludyga et al., 2011). The Student's t‐test was used for statistical analysis.
2.4. WST‐1 proliferation and clonogenic assays
Cell proliferation was determined using the water‐soluble tetrazolium WST‐1 reagent (4‐[3‐(4‐Iodophenyl)‐2‐(4‐nitrophenyl)‐2H‐5‐tetrazolio]‐1,3‐benzene disulfonate) and a spectrophotometric assay according to the manufacturer's protocol (05015944001, Roche Diagnostics, Mannheim, DE); specifics of this assay were recently described (Ludyga et al., 2013). BT474 and MDA‐MB‐361 cells (4.0 × 10³ per well) and SKBR3 cells (2.0 × 10³ per well) as well as HER2‐, PTK6‐ and cells depleted of both were plated and incubated for 14 days at 37 °C in 5% CO2 for colony formation assays. The cells were subsequently washed with PBS, fixed with (absolute) ethanol and stained with Giemsa (5% v/v). The colonies (consisting of at least 50 cells) were counted using the Clono counter software http://www.biomedcentral.com/content/supplementary/1748‐717X‐2‐4‐S1.zip (Franken et al., 2006; Niyazi et al., 2007). The assays were conducted in triplicate and Student's t‐test was used for statistical analysis.
2.5. Three dimensional (3D) microtissue formation
A scaffold‐free hanging drop approach (InSphero AG, Schlieren, CH) was used for the analysis of 3D microtissues. A total of 1.0 × 10³ cells (depleted of GAPDH, HER2, PTK6 or of both HER2 and PTK6) were seeded in 40 μl of cell line‐specific complete medium into a GravityPLUS™ microtissue plate. After three days, the cells were transferred into a GravityTRAP plate (InSphero AG, Schlieren, CH) and cultivated for 16 additional days in the presence of puromycin for selection (2 μg/ml). The spheroids' growth was quantified using the Operetta imaging system and was analysed with Harmony 3.0 software (Perkin Elmer, Waltham, MA, USA). The experiments were conducted in triplicate for the BT474 and MDA‐MB‐361 cells. The SKBR3 cells did not form 3D spheroids under these conditions and were therefore not appropriate for this assay. Polynomial regression curves were generated and Student's t‐test was used for statistical analysis.
2.6. In vivo experiments in female nude mice
The animal studies were performed in accordance with the German and European laws on animal welfare. The experimental treatments were approved by the Bavarian authorities on veterinary issues (file no. 55.2‐1‐54‐2531‐118‐10). The number of experimental animals was determined by an a‐priory statistical evaluation of the expected biological effects and the intra‐group variability. Using an unpaired t‐test, significance treshold of 0.05, statistical power of 80% and an effect of 20% tumour volume reduction by the single and combined gene knockdown (deduced from prior in vitro studies), a minimal number of eleven animals per group (including spare mice) was estimated. The mammary fat pads of five‐week‐old female athymic nude mice (Crl:NU‐Foxn1 nu, originating from Charles River Laboratories, Sulzfeld, DE) were inoculated once with 1.0 × 10⁶ BT474 cells and the mice were maintained in a pathogen‐free environment. The data were collected between day 4 post‐injection (p.i.) and day 49 p.i. (seven weeks). When the xenografts reached approximately 1 cm3, the mice were euthanized and all data were analysed as previously described (Ludyga et al., 2013). Since the final data demonstrated a larger than expected intra‐group variability in tumour sizes, to make the comparison between the four groups more robust, a non‐parametric Mann–Whitney U test was applied for statistical analysis. All of the xenografts were fixed in formalin and embedded in paraffin (FFPE) for further analyses.
2.7. Immunohistochemistry (IHC)
For the immunohistochemical analysis of target proteins expressed in the xenografts, the primary antibodies specific for HER2 (A0485, DAKO, Glostrup, DK), HER3 (MS‐201‐P1, Thermo Fisher Scientific, Fremont, CA, USA), PTK6 (H00005753‐M01, Abnova, Taipei, TW) and IGF‐1R (3027, Cell Signaling Technology, Danvers, MA, USA) were applied to 3 μm‐thick sections obtained from FFPE tissue using recently described methods (Aubele et al., 2008).
2.8. Proximity ligation assay (PLA)
To demonstrate a reduction in the protein complexes indicating interactions between HER2 and HER3 or PTK6 and IGF1‐R by PLA, the same antibodies as described in the IHC part were used for the detection of HER2, HER3, PTK6 and IGF‐1R. The PLA was conducted on 3 μm‐thick FFPE xenograft sections using DUOLink™ kit (OLINK, Uppsala, S) as previously described (Aubele et al., 2010). In this assay, specific primary antibodies of different origins (mouse and rabbit) bind to potentially interacting proteins. Species‐specific secondary antibodies that are conjugated to oligonucleotides (PLA probes) bind the primary antibodies and are incubated with additional oligonucleotides and a ligase. When the PLA probes are in close proximity (<40 nm), they are amplified via rolling circle amplification using a polymerase and free nucleotides. For detection, fluorescently labelled probes hybridize to the rolling circle amplicons and can be visualized and quantified microscopically (Aubele et al., 2010; Spears et al., 2012).
3. Results
3.1. The co‐RNAi of HER2 and PTK6 additively reduces the phosphorylation of tumour‐promoting proteins
Co‐RNAi specifically downregulated the target proteins HER2 and PTK6 and its effects on the phosphorylation status and subsequent activation of the associated tumour‐promoting proteins in Ras/MAPK, PI3K/Akt and STAT3 signalling were analysed by immunoblotting. While the expression of total HER3, IGF‐1R, MAPKs, ERK, STAT3, Akt and PTEN proteins remained unchanged, the phosphorylation status of p38MAPK at Thr180/Tyr182, ERK1/2 at Thr202/Tyr204, ERK5 at Thr202/Tyr204, STAT3 at Ser727, PTEN at Ser380/Thr382/383 and Akt at Ser473 was (additively) reduced due to co‐RNAi compared with single depletion of HER2 or PTK6 in BT474 cells (Figure 1A). These results were also confirmed in MDA‐MB‐361 and SKBR3 breast cancer cells (Supplementary Figure S1A).
Figure 1.
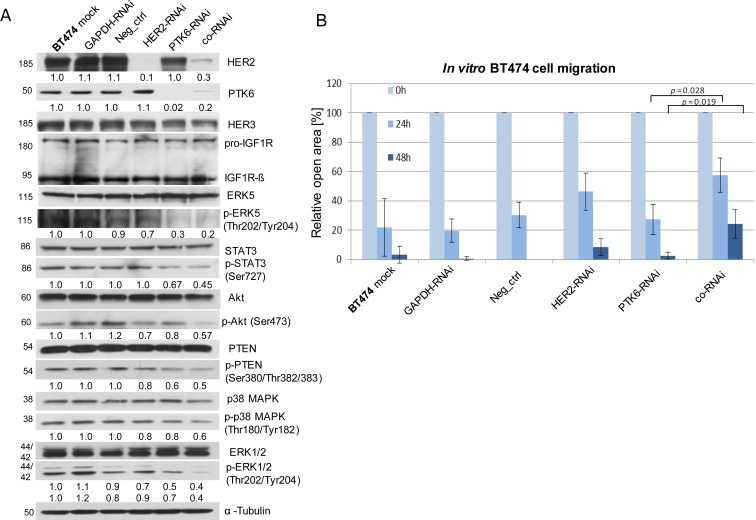
The co‐RNAi of HER2 and PTK6 additively reduces the phosphorylation of tumour‐promoting proteins and the migration of BT474 cells. A, Western blot analysis of HER2, PTK6, HER3, IGF‐1R, (p = phospho) ERK5, (p) STAT3, (p) Akt, (p) PTEN, (p) p38MAPK, (p) ERK1/2 and tubulin (loading control). For quantification, the means of three independent experiments were calculated in relation to the mock control. B, The graphs illustrate the means of the percentages of the open areas derived from three experiments; SDs and p‐values are shown. The scale bars represent 400 μm.
3.2. The co‐RNAi of HER2 and PTK6 additively decreases BT474 cell migration in vitro
The effects on the in vitro migration of breast cancer cells in response to co‐RNAi were determined using a wound healing assay. When compared with the controls, the migration of HER2‐ or PTK6‐depleted BT474 cells was slightly reduced after 24 h and 48 h. The combined depletion of both target proteins led to a significant and additive reduction in migration and increased the open area after 24 h (p = 0.028) or 48 h (p = 0.019) (Figure 1B; Supplementary Figure S1B). Compared with BT474 cells, SKBR3 cells have shown minimal migratory potential. Therefore, reduced migration of SKBR3 cells following co‐RNAi was not observed, and the MDA‐MB‐361 cells were not appropriate for this assay due to non‐confluent growth.
3.3. The co‐RNAi of HER2 and PTK6 additively diminishes 2D cell proliferation
The impact of co‐RNAi on cell proliferation was investigated using 2D in vitro assays and was confirmed by immunoblotting. Compared with the single knockdowns, a significant and additive reduction in proliferation (using WST‐1 assay) was observed in HER2‐ and PTK6‐ co‐depleted BT474 cells (both p < 0.001) (Figure 2A). In MDA‐MB‐361 cells, the proliferation was also reduced following the RNAi of HER2 or PTK6 (p = 0.008 and p < 0.001, respectively, Figure 2A) when compared with the mock control. Furthermore, the co‐RNAi led to an additive effect (p < 0.001) when compared with the mock control. However, these effects were not as pronounced as those observed in the BT474 cells and were not statistically significant when compared with the single knockdowns (Figure 2A). In SKBR3 cells, PTK6‐ and cells depleted of both proteins showed significantly reduced proliferation (p = 0.001 and p = 0.006, respectively) when compared with the mock control, but the reduction following co‐RNAi was comparable with the proliferation of PTK6‐only depleted cells (Figure 2A). Because the WST‐1 assay is based on the enzymatic activity of cells spanning a 48 h period, a colony formation assay was conducted. This assay relies on the clonogenic potential of single cells over a long‐term period (two to three weeks) and more precisely reflects treatment effects on cell proliferation (Franken et al., 2006). In all three cell lines, co‐RNAi led to a significant and additive decrease in clonogenic proliferation (Figure 2B). In BT474 cells, colony formation after combined RNAi was additively reduced (in relation to the mock control), and this effect was significant when compared with the single downregulations (HER2: p = 0.001; PTK6: p = 0.004; Figure 2B). In MDA‐MB‐361 and SKBR3 cells, the number of colonies following co‐RNAi was also additively diminished and exhibited a significant reduction in colony formation when compared with PTK6‐depleted cells (MDA‐MB‐361: p = 0.022; SKBR3: p = 0.004; Figure 2B). Furthermore, the impact of the combined approach on cell proliferation was also analysed by immunoblotting. Although the expression levels of cell cycle‐promoting proteins remained unchanged following HER2 and/or PTK6 RNAi (data not shown), the protein expression levels of the cell cycle inhibitor p27Kip1 were elevated due to HER2 or PTK6 depletion, and this effect was stronger in cells depleted of both proteins (Figure 2C). However, the positive and negative controls slightly differed from the mock controls, suggesting that non‐specific effects may occur and may also depend on the cell line used. Furthermore, the induction of apoptosis was determined by PARP cleavage via immunoblotting. Here, PARP cleavage was not observed in any of the three cell lines, regardless of whether the single RNAi approaches or the combined RNAi approaches were examined (data not shown).
Figure 2.
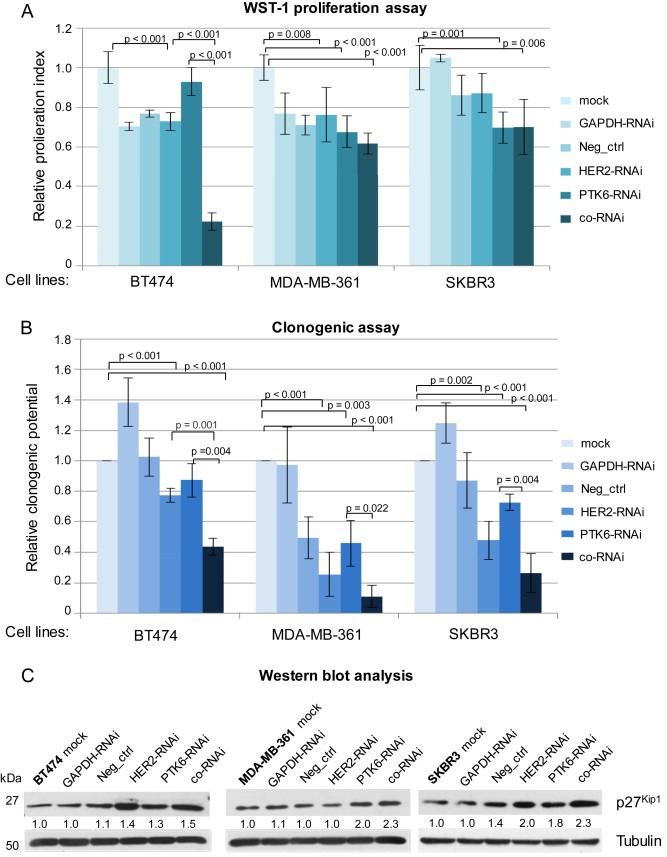
The co‐RNAi of HER2 and PTK6 significantly and additively decreased in vitro proliferation of BT474, MDA‐MB‐361 and SKBR3 cells. A, The proliferation index or B, the clonogenic potential of HER2‐ and/or PTK6‐depleted cells in relation to the mock controls based on the WST‐1 assay (A) or colony forming assay (B) is shown. The mean values of three experiments, SDs and p‐values are shown. C, Western blot analysis of p27Kip1 and tubulin (loading control) is shown. For quantifications, the means of two independent experiments were calculated in relation to the mock control.
3.4. The co‐RNAi of HER2 and PTK6 additively impairs 3D microtissue growth
To explore the impact of co‐RNAi compared with the single RNAi of HER2 or PTK6 on the formation of 3D microtissues, a scaffold‐free hanging drop approach was conducted over a 16 day period. In BT474 and MDA‐MB‐361 cells, the additively growth‐inhibitory effect in response to co‐RNAi could be demonstrated when compared with the controls (GAPDH‐RNAi) (Figure 3A and B). With regards to BT474 3D microtissues, co‐RNAi led to a significant and additive reduction in size when compared with PTK6‐ (p = 0.0145) or HER2‐depleted 3D microtissues (p = 0.0322; Figure 3A). Regarding MDA‐MB‐361 spheroids, co‐RNAi also resulted in significant and additively diminished spheroid growth when compared with PTK6‐depleted 3D microtissues (p = 0.0253) (Figure 3B). Because HER2‐downregulation alone had a slightly stronger inhibitory effect on MDA‐MB‐361 microtissues than PTK6 knockdown, no statistically significant reduction in size was observed in cells co‐depleted of both proteins when compared with HER2‐depleted cells (Figure 3B).
Figure 3.
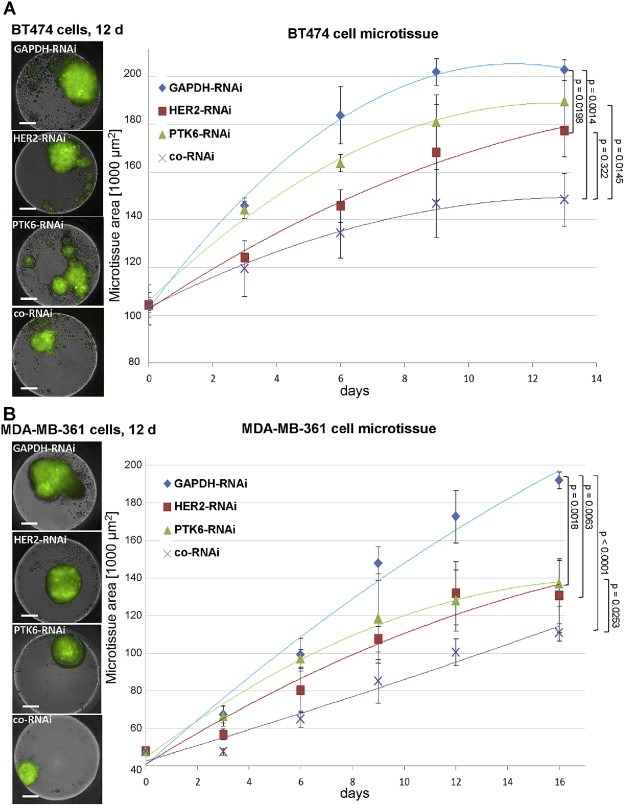
The co‐RNAi of HER2 and PTK6 significantly and additively reduced 3D microtissue growth of BT474 and MDA‐MB‐361 cells. The visualization at day (d) 12 (left) and quantification (right) of spheroids is based on GFP expression. A, polynomial regression curves of BT474 cell control spheroids compared with spheroids depleted of HER2‐ (p = 0.0198), PTK6‐ and depleted of both (p = 0.0014); HER2‐RNAi vs. co‐RNAi: p = 0.0322 and PTK6‐RNAi vs. co‐RNAi: p = 0.0145 and SDs are shown. B, polynomial regression curves of MDA‐MB‐361 cell control spheroids compared with HER2‐ (p = 0.0063), PTK6‐ (p = 0.0018) and co‐depleted (p < 0.0001) cell spheroids; and PTK6‐RNAi vs. co‐RNAi: p = 0.0253 and SDs are shown. 1000 cells were seeded in triplicate for each approach and on day 13 for BT474 cell spheroids and on day 16 for MDA‐MB‐361 cell spheroids p‐values were determined using Student's t‐test. Scale bar represents 200 μm.
3.5. The co‐RNAi of HER2 and PTK6 additively inhibits xenograft growth
To investigate the effects of co‐RNAi on xenograft growth and its potential use for breast cancer therapy, female nude mice were inoculated with control, HER2‐ and/or PTK6‐depleted BT474 cells as recently described (Ludyga et al., 2013). The average xenograft size increased more slowly upon HER2‐ or PTK6‐knockdown when compared with the control group (GAPDH‐RNAi). The average xenograft size of the co‐RNAi group demonstrated a very strong inhibitory effect on tumour growth in the in vivo experiments (Figure 4A, left). The median tumour size (normalized to the average size on day 28 p.i., when the first animal was euthanized) was significantly reduced upon knockdown of HER2 or PTK6 when compared with the control group (both 45 mm2 – 27 mm2 = −40%; p < 0.00001; Figure 4A, right). Upon using the combined RNAi approach, the xenograft size was diminished further when compared with the control group (45 mm2 – 13 mm2 = −71%; p < 0.00001) and also significantly and additively reduced when compared with the single knockdowns (both 27 mm2 – 13 mm2 = −52%; p < 0.00001; Figure 4A, right). The reduced expression of HER2 and/or PTK6 in BT474 xenografts was confirmed by immunohistochemistry (Figure 4B). The expression of the membrane‐localized receptor HER2 was very low in HER2‐depleted cells and in cells subjected to co‐RNAi, whereas these levels remained unchanged in the control and PTK6‐depleted cells (Figure 4B, the upper part). Furthermore, intracellular PTK6 expression was reduced in PTK6‐depleted cells and in cells depleted of both proteins, whereas its expression in the controls and HER2‐depleted cells was not affected (Figure 4B, the lower part).
Figure 4.
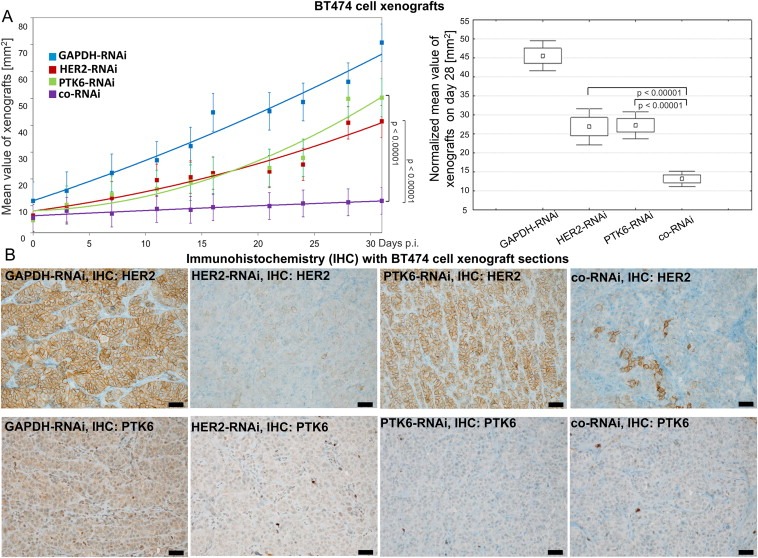
The co‐RNAi of HER2 and PTK6 results in an additive and strongly significant reduction of BT474 cell xenografts. A, The average and SD between day 0 and day 31 p.i. (left) and the normalized xenograft sizes and SD on day 28 p.i. (right) of 11 animals per group with HER2‐RNAi or PTK6‐RNAi vs. co‐RNAi p < 0.00001, respectively, are shown. B, The membrane‐bound HER2 (upper figures) and cytoplasmic PTK6 (lower figures) expression is shown using IHC of representative xenograft sections of each group. The scale bars represent 50 μm.
3.6. The co‐RNAi of HER2 and PTK6 reduces interactions with HER3 and IGF‐1R, respectively
In breast cancer, complexes of HER2/HER3 and PTK6/IGF‐1R are of great interest due to their roles in tumour promotion (Citri et al., 2003; Fan et al., 2013; Irie et al., 2010; Sliwkowski et al., 1994; Spears et al., 2012). To investigate the impact of HER2‐ and/or PTK6‐knockdown within these complexes and their effects on mammary tumour progression, in particular with respect to their potential additive effects, the proximity ligation assay was conducted on FFPE xenograft sections. Total HER3 protein expression in BT474 cells (Figure 1A) or xenografts (data not shown) was unaffected following (co)‐RNAi. Compared with the control (GAPDH‐RNAi, Figure 5A), the number of HER2/HER3 complexes detected by PLA and indicating interactions was strongly reduced in the BT474 cell xenografts depleted of both HER2 and PTK6 (Figure 5D). Moreover, compared with the control (GAPDH‐RNAi, Figure 6A), the number of PTK6 and IGF‐1R complexes present in the xenografts also decreased following co‐RNAi (Figure 6D), while the downregulation of HER2 and/or PTK6 alone did not alter IGF‐1R expression in BT474 cells (Figure 1A) or xenografts (data not shown). When HER2 or PTK6 were downregulated alone, the number of HER2/HER3 (Figure 5B and C) or PTK6/IGF‐1R (Figure 6B and C) complexes was also diminished in xenografts, respectively.
Figure 5.
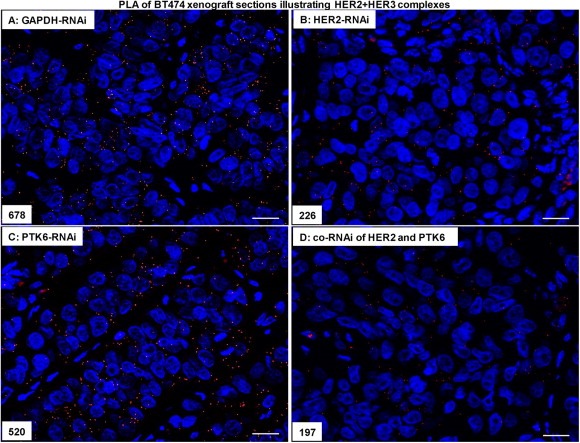
The co‐RNAi of HER2 and PTK6 additively reduced the number of complexes formed by HER2/HER3 in BT474 cell xenografts. (A), Representative proximity ligation assays of HER2 and HER3 in the control approach (GAPDH‐RNAi), in the HER2‐RNAi (B), PTK6‐RNAi (C) and in the co‐RNAi approach (D) (400× magnification), the scale bars represent 20 μm and the amounts of complexes are indicated.
Figure 6.
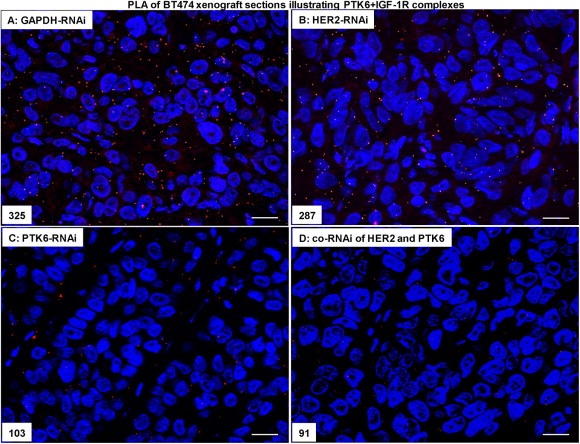
The co‐RNAi of HER2 and PTK6 additively reduced the number of complexes formed by PTK6/IGF‐1R in BT474 cell xenografts. (A), Representative proximity ligation assays of PTK6 and IGF‐1R in the control approach (GAPDH‐RNAi), in the HER2‐RNAi (B), PTK6‐RNAi (C) and in the co‐RNAi approach (D) (400× magnification), the scale bars represent 20 μm and the amounts of complexes are indicated.
4. Discussion
Since only a minority of breast cancer patients benefits from targeted therapies, novel therapeutic approaches are strongly required. In our current study, we have investigated whether the combined stable knockdown of HER2 and PTK6 results in additive effects on the reduction of mammary tumour progression. We successfully demonstrated the potential of co‐RNAi of HER2 and PTK6 as a promising strategy for the development of a more efficient therapy for mammary tumours. In response to the combined downregulation of the targeted proteins, we have observed significantly diminished tumour progression in vitro and in vivo. Based on the additive reduction of the activation of tumour‐promoting proteins (e.g. MAPK/ERK, STAT3, Akt, PTEN) that are involved in tumourigenesis observed in this and in our previous study (Ludyga et al., 2013), we investigated the effects of co‐RNAi on in vitro migration and cell proliferation. After co‐RNAi, BT474 cell migration was significantly and additively reduced when compared with cells depleted only of PTK6. In previous studies, including ours, HER2 or PTK6 have been shown to be involved in the migration of tumour cells, and the knockdown of each protein significantly reduced the migratory potential of JIMT‐1 or T47D cells (Ludyga et al., 2013; Ostrander et al., 2007). Here, we have demonstrated an additive effect following co‐RNAi of these target proteins that results in an increased inhibition of tumour malignancy. This outcome is in agreement with our previous study demonstrating additively reduced migration of JIMT‐1 cells after co‐RNAi of HER2 and PTK6 (Ludyga et al., 2013). Since we have not observed any changes of SKBR3 cell migration following single or co‐RNAi compared with mock control, we suppose that this cell line, in principle, exhibits weak migratory potential and is not applicable for this assay. This observation is in agreement with a previous study conducted by our group (Falkenberg et al., 2013).
To investigate the impact of co‐RNAi on cell proliferation, we conducted several assays reflecting cell viability over periods of two days to several weeks. In addition to the WST‐1 assay, the colony formation assay and immunoblotting analyses showed additive and significant reductions in cell proliferation of cells simultaneously depleted of both target proteins. In previous studies, a strong association of HER2 or PTK6 was observed with cell proliferation and cell cycle regulation via p27Kip1 and its transcription factor FoxO3a (Chan and Nimnual, 2010; Eddy et al., 2007); we confirmed these associations here. In addition, we recently performed a simultaneous knockdown that also led to a significant and additive reduction of 2D monolayer proliferation in two different breast cancer cell lines in vitro (Ludyga et al., 2013). Although co‐RNAi intensely decreased cell proliferation, induction of apoptosis was not detected. This outcome confirms our previous study (Ludyga et al., 2013) and indicates that a stronger treatment, e.g., co‐RNAi of HER2 and uPAR and the addition of Trastuzumab, is necessary for cells to undergo apoptosis, in a manner similar to previously published results (Li et al., 2010).
Conventional 2D monolayers are easy and versatile to investigate short‐term basic research. When compared with 3D tissues, this 2D approach is limited with respect to tissue composition, or when the analysis of the impact of stimuli over weeks is taken under consideration and they differ in gene expression (Abbott, 2003; Bissell et al., 1982). Over the last few decades, several groups have developed different 3D model systems including spontaneous aggregation in drops, spinner flasks or scaffold‐based and scaffold‐free approaches (Drewitz et al., 2011; Sutherland et al., 1971; Wartenberg et al., 2001). These systems reflected physiological conditions within a tumour more accurately than 2D models. Therefore, we cultivated tumour cells as 3D microtissues in a simple scaffold‐free system to model in vivo tumours. Here, we have successfully demonstrated the growth of 3D spheroids using two breast cancer cell lines. The growth of these 3D microtissues was significantly impaired due to HER2‐ or PTK6‐RNAi, which was exhibited by additively diminished spheroid size when both target proteins were simultaneously knocked down. Comparing the WST‐1 proliferation and clonogenic assays with 3D microtissues and xenograft experiments conducted by us, the growth‐inhibitory effects following HER2‐ or PTK6‐knockdown alone were particularly greater in 3D microtissues indicating a system that is more comparable with in vivo conditions. This outcome is in accordance with previous studies revealing the presence of stronger and more appropriate effects in 3D cell culture models (Hongisto et al., 2013; Pickl and Ries, 2009). Therefore, this scaffold‐free approach is an attractive tool for investigating the long‐term effects of potential therapeutics and may allow for the development of focused in vivo animal experiments. In addition, in the in vitro proliferation experiments using three cell lines, we have observed heterogeneous effects with regard to co‐RNAi of HER2 and PTK6. This may be assay‐dependent; however the co‐RNAi effects in the clonogenic assay after 2 weeks of incubation were very similar and significant regarding these three cell lines. An additional explanation for different outcomes after co‐RNAi in the three cell lines may also be cell line‐specific. Heterogeneous effects following simultaneous knockdown in different cell lines also agree with other studies. Subramanian and colleagues have observed a stronger effect on cell invasion in MDA‐MB‐231 cells compared with ZR751 cells when uPA and uPAR were simultaneously knocked down (Subramanian et al., 2006).
To further examine the impact of co‐RNAi with respect to a more powerful breast cancer therapy, we conducted in vivo animal experiments. The BT474 cell line xenograft growth was strongly and significantly diminished following single knockdowns of HER2 or PTK6. The fact that HER2 or PTK6 downregulation inhibits proliferation in vivo is consistent with previous studies (Hu et al., 2006; Ludyga et al., 2013). Remarkably, the xenograft size was additively and strongly reduced (p < 0.00001) when both target proteins were simultaneously depleted. This is the first in vivo study, showing significantly additive inhibition of proliferation due to the combined silencing of HER2 and PTK6. As BT474 cells in vivo demonstrated the highest co‐RNAi reduction tested so far, we suggest a cell‐line specific effect that may also be lessened in other cell lines as a consequence of strong impairment following single knockdown of HER2 or PTK6. Recently, Peng and colleagues generated HER2/PTK6 double overexpressing transgenic mice; however, the increases in tumour incidence, size or metastasis were not significant (Peng et al., 2013). They hypothesized that the effects may be underrepresented due to the induction of endogenous PTK6 expression. In contrast, Xiang et al. have convincingly demonstrated that ectopic co‐overexpression of HER2 and PTK6 synergized to promote murine mammary tumourigenesis by enhancing activation of the Ras/MAPK pathway (Xiang et al., 2008). This study underpins our present results, because co‐RNAi additively suppressed tumour cell proliferation in vitro and in vivo through a reduction in Ras/MAPK signalling.
Moreover, we analysed the rationale behind these extremely additive effects on the reduced proliferation observed in response to co‐RNAi of HER2 and PTK6. HER2 was shown to form heterodimers with HER3, which strongly promote breast cancer progression and are associated with poor prognosis (Citri et al., 2003; Sliwkowski et al., 1994; Spears et al., 2012). PTK6 has been described to functionally interact with IGF‐1R (Fan et al., 2013; Irie et al., 2010). These interactions have been shown to enhance pro‐survival signalling in tumours and are related to poor survival (Fan et al., 2013; Irie et al., 2010). PTK6 (Barker et al., 1997) and IGF‐1R are often (over)expressed in a wide range of tumours and IGF‐1R was detected in all mammary cancer subtypes including the difficult to treat triple‐negative breast cancers (TNBCs) (Law et al., 2008). Therefore, we carried out a proximity ligation assay that allows for the visualization of protein–protein interactions in tissues based on proteins localized in close proximity (Aubele et al., 2010; Spears et al., 2012). HER2/HER3 dimers were diminished in xenograft sections derived from the combination approach. The same result was observed for PTK6/IGF‐1R complexes in their respective xenograft sections. The reduced number of heterodimers indicates a reduction in tumour‐promoting signalling through several interacting partners that are not directly affected following co‐RNAi. HER2 and/or PTK6 are also involved in HER1 and Insulin Receptor (IR)‐mediated and tumour‐relevant pathways (Irie et al., 2010; Xiang et al., 2008) (Figure 7); however these proteins were not investigated in this study. We provide evidence that simultaneous knockdown of HER2 and PTK6 not only affects this pathway and its directly associated downstream signalling proteins. It also affects a large protein network containing many interacting and tumour‐relevant partners that are differentially overexpressed in various breast cancer types (Figure 7). Therefore, HER2‐ and/or PTK6‐, HER3‐, IGF‐1R‐/IR‐, HER1‐mediated tumours may be significantly suppressed by the combined inhibition of HER2 and PTK6.
Figure 7.
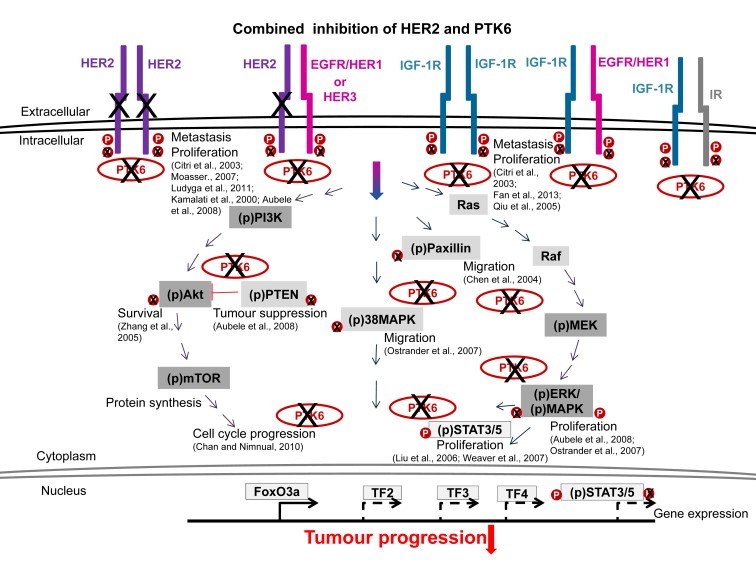
HER2 and PTK6 are strongly involved in tumourigenic signalling through interactions with HER1‐3, IGF‐1R or Insulin receptor (IR). The combined inhibition of HER2 and PTK6 strongly reduces the activation of PI3K/Akt, Ras/Raf/MEK/ERK, p38MAPK, STAT 3/5 and Paxillin (Chen et al., 2004) signalling pathways, to decreased activation of transcription factors (TF) and the following gene expression. Inhibited PTK6 does not phosphorylate PTEN and therefore stabilizes this tumour suppressor. Reduced PTK6‐mediated phosphorylation of FoxO3a translocates it to nucleus, induces the expression of the cell cycle inhibitor p27Kip1 and reduces G1‐/S‐phase progression.
5. Conclusions
Co‐RNAi of HER2 and PTK6 leads to additively reduced breast cancer progression in vitro and in vivo due to reduced interactions with HER3 or IGF‐1R. This combined approach may affect a large protein network including many interacting and tumour‐relevant partners that are often overexpressed in different breast cancer types. Therefore, HER2‐ and/or PTK6‐positive tumours may be significantly suppressed by the combined inhibition of HER2 and PTK6 and could improve breast cancer therapy.
Supporting information
Supplementary Figure 1 The co‐RNAi of HER2 and PTK6 additively reduces the phosphorylation of tumour‐promoting proteins in MDA‐MB‐361 and SKBR3 cells and the migration of BT474 cells. A, Western blot analysis of proteins using specific primary antibodies directed towards HER2, PTK6, (p = phospho) STAT3, (p) Akt, (p) PTEN, (p) p38MAPK, (p) ERK1/2 and tubulin (loading control). B, Representative figures showing BT474 cell migration at 0 h and 72 h, respective percentages of the open areas are shown and the scale bars represent 400 μm
Acknowledgements
This project was supported by the German Research Foundation (DFG, grant no. LU 1671/1‐1 to N. Falkenberg). We thank David Mörzl for technical expertise, Boris Schön and Stefan Wagner for animal care and Jacqueline Müller and Elenore Samson for animal preparations. The authors declare that they have no financial and no competing interests.
Supplementary data 1.
1.1.
Supplementary data related to this article can be found at http://dx.doi.org/10.1016/j.molonc.2014.08.012.
Falkenberg Natalie, Anastasov Nataša, Höfig Ines, Bashkueva Ksenia, Lindner Katrin, Höfler Heinz, Rosemann Michael, Aubele Michaela, (2015), Additive impact of HER2‐/PTK6‐RNAi on interactions with HER3 or IGF‐1R leads to reduced breast cancer progression in vivo, Molecular Oncology, 9, doi: 10.1016/j.molonc.2014.08.012.
Contributor Information
Natalie Falkenberg, Email: natalie.falkenberg@helmholtz-muenchen.de.
Nataša Anastasov, Email: natasa.anastasov@helmholtz-muenchen.de.
Ines Höfig, Email: ines.hoefig@helmholtz-muenchen.de.
Ksenia Bashkueva, Email: ksenbash@yandex.ru.
Katrin Lindner, Email: katrin.lindner@helmholtz-muenchen.de.
Heinz Höfler, Email: hoefler@lrz.tum.de.
Michael Rosemann, Email: rosemann@helmholtz-muenchen.de.
Michaela Aubele, Email: aubele@helmholtz-muenchen.de.
References
- Abbott, A. , 2003. Cell culture: biology's new dimension. Nature. 424, 870–872. [DOI] [PubMed] [Google Scholar]
- Ai, M. , Qiu, S. , Lu, Y. , Fan, Z. , 2013. HER2 regulates Brk/PTK6 stability via upregulating calpastatin, an inhibitor of calpain. Cell. Signal. 25, 1754–1761. [DOI] [PMC free article] [PubMed] [Google Scholar]
- Aubele, M. , Spears, M. , Ludyga, N. , Braselmann, H. , Feuchtinger, A. , Taylor, K.J. , Lindner, K. , Auer, G. , Stering, K. , Hofler, H. , Schmitt, M. , Bartlett, J.M. , 2010. In situ quantification of HER2-protein tyrosine kinase 6 (PTK6) protein-protein complexes in paraffin sections from breast cancer tissues. Br. J. Cancer. 103, 663–667. [DOI] [PMC free article] [PubMed] [Google Scholar]
- Aubele, M. , Walch, A.K. , Ludyga, N. , Braselmann, H. , Atkinson, M.J. , Luber, B. , Auer, G. , Tapio, S. , Cooke, T. , Bartlett, J.M. , 2008. Prognostic value of protein tyrosine kinase 6 (PTK6) for long-term survival of breast cancer patients. Br. J. Cancer. 99, 1089–1095. [DOI] [PMC free article] [PubMed] [Google Scholar]
- Barker, K.T. , Jackson, L.E. , Crompton, M.R. , 1997. BRK tyrosine kinase expression in a high proportion of human breast carcinomas. Oncogene. 15, 799–805. [DOI] [PubMed] [Google Scholar]
- Bissell, M.J. , Hall, H.G. , Parry, G. , 1982. How does the extracellular matrix direct gene expression?. J. Theor. Biol. 99, 31–68. [DOI] [PubMed] [Google Scholar]
- Chan, E. , Nimnual, A.S. , 2010. Deregulation of the cell cycle by breast tumor kinase (Brk). Int. J. Cancer. 127, 2723–2731. [DOI] [PubMed] [Google Scholar]
- Chen, H.Y. , Shen, C.H. , Tsai, Y.T. , Lin, F.C. , Huang, Y.P. , Chen, R.H. , 2004. Brk activates rac1 and promotes cell migration and invasion by phosphorylating paxillin. Mol. Cell. Biol. 24, 10558–10572. [DOI] [PMC free article] [PubMed] [Google Scholar]
- Citri, A. , Skaria, K.B. , Yarden, Y. , 2003. The deaf and the dumb: the biology of ErbB-2 and ErbB-3. Exp. Cell Res. 284, 54–65. [DOI] [PubMed] [Google Scholar]
- Derry, J.J. , Prins, G.S. , Ray, V. , Tyner, A.L. , 2003. Altered localization and activity of the intracellular tyrosine kinase BRK/Sik in prostate tumor cells. Oncogene. 22, 4212–4220. [DOI] [PubMed] [Google Scholar]
- Drewitz, M. , Helbling, M. , Fried, N. , Bieri, M. , Moritz, W. , Lichtenberg, J. , Kelm, J.M. , 2011. Towards automated production and drug sensitivity testing using scaffold-free spherical tumor microtissues. Biotechnol. J. 6, 1488–1496. [DOI] [PubMed] [Google Scholar]
- Easwaran, H. , Tsai, H.C. , Baylin, S.B. , 2014. Cancer epigenetics: tumor heterogeneity, plasticity of stem-like states, and drug resistance. Mol. Cell. 54, 716–727. [DOI] [PMC free article] [PubMed] [Google Scholar]
- Eddy, S.F. , Kane, S.E. , Sonenshein, G.E. , 2007. Trastuzumab-resistant HER2-driven breast cancer cells are sensitive to epigallocatechin-3 gallate. Cancer Res. 67, 9018–9023. [DOI] [PubMed] [Google Scholar]
- Falkenberg, N. , Anastasov, N. , Rappl, K. , Braselmann, H. , Auer, G. , Walch, A. , Huber, M. , Hofig, I. , Schmitt, M. , Hofler, H. , Atkinson, M.J. , Aubele, M. , 2013. MiR-221/-222 differentiate prognostic groups in advanced breast cancers and influence cell invasion. Br. J. Cancer. 109, 2714–2723. [DOI] [PMC free article] [PubMed] [Google Scholar]
- Fan, G. , Lin, G. , Lucito, R. , Tonks, N.K. , 2013. Protein-tyrosine phosphatase 1B antagonized signaling by insulin-like growth factor-1 receptor and kinase BRK/PTK6 in ovarian cancer cells. J. Biol. Chem. 288, 24923–24934. [DOI] [PMC free article] [PubMed] [Google Scholar]
- Franken, N.A. , Rodermond, H.M. , Stap, J. , Haveman, J. , van Bree, C. , 2006. Clonogenic assay of cells in vitro. Nat. Protoc. 1, 2315–2319. [DOI] [PubMed] [Google Scholar]
- Hongisto, V. , Jernstrom, S. , Fey, V. , Mpindi, J.P. , Kleivi Sahlberg, K. , Kallioniemi, O. , Perala, M. , 2013. High-throughput 3D screening reveals differences in drug sensitivities between culture models of JIMT1 breast cancer cells. PloS One. 8, e77232 [DOI] [PMC free article] [PubMed] [Google Scholar]
- Hu, X. , Su, F. , Qin, L. , Jia, W. , Gong, C. , Yu, F. , Guo, J. , Song, E. , 2006. Stable RNA interference of ErbB-2 gene synergistic with epirubicin suppresses breast cancer growth in vitro and in vivo. Biochem. Biophys. Res. Commun. 346, 778–785. [DOI] [PubMed] [Google Scholar]
- Irie, H.Y. , Shrestha, Y. , Selfors, L.M. , Frye, F. , Iida, N. , Wang, Z. , Zou, L. , Yao, J. , Lu, Y. , Epstein, C.B. , Natesan, S. , Richardson, A.L. , Polyak, K. , Mills, G.B. , Hahn, W.C. , Brugge, J.S. , 2010. PTK6 regulates IGF-1-induced anchorage-independent survival. PloS One. 5, e11729 [DOI] [PMC free article] [PubMed] [Google Scholar]
- Jemal, A. , Bray, F. , Center, M.M. , Ferlay, J. , Ward, E. , Forman, D. , 2011. Global cancer statistics. Cancer J. Clinicians. 61, 69–90. [DOI] [PubMed] [Google Scholar]
- Kamalati, T. , Jolin, H.E. , Fry, M.J. , Crompton, M.R. , 2000. Expression of the BRK tyrosine kinase in mammary epithelial cells enhances the coupling of EGF signalling to PI 3-kinase and Akt, via erbB3 phosphorylation. Oncogene. 19, 5471–5476. [DOI] [PubMed] [Google Scholar]
- Kamalati, T. , Jolin, H.E. , Mitchell, P.J. , Barker, K.T. , Jackson, L.E. , Dean, C.J. , Page, M.J. , Gusterson, B.A. , Crompton, M.R. , 1996. Brk, a breast tumor-derived non-receptor protein-tyrosine kinase, sensitizes mammary epithelial cells to epidermal growth factor. J. Biol. Chem. 271, 30956–30963. [DOI] [PubMed] [Google Scholar]
- Kopper, L. , 2008. Lapatinib: a sword with two edges. Pathol. Oncol. Res. 14, 1–8. [DOI] [PubMed] [Google Scholar]
- Kunigal, S. , Lakka, S.S. , Gondi, C.S. , Estes, N. , Rao, J.S. , 2007. RNAi-mediated downregulation of urokinase plasminogen activator receptor and matrix metalloprotease-9 in human breast cancer cells results in decreased tumor invasion, angiogenesis and growth. Int. J. Cancer. 121, 2307–2316. [DOI] [PMC free article] [PubMed] [Google Scholar] [Retracted]
- Law, J.H. , Habibi, G. , Hu, K. , Masoudi, H. , Wang, M.Y. , Stratford, A.L. , Park, E. , Gee, J.M. , Finlay, P. , Jones, H.E. , Nicholson, R.I. , Carboni, J. , Gottardis, M. , Pollak, M. , Dunn, S.E. , 2008. Phosphorylated insulin-like growth factor-i/insulin receptor is present in all breast cancer subtypes and is related to poor survival. Cancer Res. 68, 10238–10246. [DOI] [PubMed] [Google Scholar]
- Li, C. , Cao, S. , Liu, Z. , Ye, X. , Chen, L. , Meng, S. , 2010. RNAi-mediated downregulation of uPAR synergizes with targeting of HER2 through the ERK pathway in breast cancer cells. Int. J. Cancer. 127, 1507–1516. [DOI] [PubMed] [Google Scholar]
- Liang, C.C. , Park, A.Y. , Guan, J.L. , 2007. In vitro scratch assay: a convenient and inexpensive method for analysis of cell migration in vitro. Nat. Protoc. 2, 329–333. [DOI] [PubMed] [Google Scholar]
- Liu, L. , Gao, Y. , Qiu, H. , Miller, W.T. , Poli, V. , Reich, N.C. , 2006. Identification of STAT3 as a specific substrate of breast tumor kinase. Oncogene. 25, 4904–4912. [DOI] [PubMed] [Google Scholar]
- Llor, X. , Serfas, M.S. , Bie, W. , Vasioukhin, V. , Polonskaia, M. , Derry, J. , Abbott, C.M. , Tyner, A.L. , 1999. BRK/Sik expression in the gastrointestinal tract and in colon tumors. Clin. Cancer Res. 5, 1767–1777. [PubMed] [Google Scholar]
- Ludyga, N. , Anastasov, N. , Gonzalez-Vasconcellos, I. , Ram, M. , Hofler, H. , Aubele, M. , 2011. Impact of protein tyrosine kinase 6 (PTK6) on human epidermal growth factor receptor (HER) signalling in breast cancer. Mol. Biosystems. 7, 1603–1612. [DOI] [PubMed] [Google Scholar]
- Ludyga, N. , Anastasov, N. , Rosemann, M. , Seiler, J. , Lohmann, N. , Braselmann, H. , Mengele, K. , Schmitt, M. , Hofler, H. , Aubele, M. , 2013. Effects of simultaneous knockdown of HER2 and PTK6 on malignancy and tumor progression in human breast cancer cells. Mol. Cancer Res. 11, 381–392. [DOI] [PubMed] [Google Scholar]
- Mitchell, P.J. , Barker, K.T. , Shipley, J. , Crompton, M.R. , 1997. Characterisation and chromosome mapping of the human non receptor tyrosine kinase gene, brk. Oncogene. 15, 1497–1502. [DOI] [PubMed] [Google Scholar]
- Moasser, M.M. , 2007. The oncogene HER2: its signaling and transforming functions and its role in human cancer pathogenesis. Oncogene. 26, 6469–6487. [DOI] [PMC free article] [PubMed] [Google Scholar]
- Niyazi, M. , Niyazi, I. , Belka, C. , 2007. Counting colonies of clonogenic assays by using densitometric software. Radiat. Oncol. 2, 4 [DOI] [PMC free article] [PubMed] [Google Scholar]
- Ostrander, J.H. , Daniel, A.R. , Lofgren, K. , Kleer, C.G. , Lange, C.A. , 2007. Breast tumor kinase (protein tyrosine kinase 6) regulates heregulin-induced activation of ERK5 and p38 MAP kinases in breast cancer cells. Cancer Res. 67, 4199–4209. [DOI] [PubMed] [Google Scholar]
- Peng, M. , Ball-Kell, S.M. , Franks, R.R. , Xie, H. , Tyner, A.L. , 2013. Protein tyrosine kinase 6 regulates mammary gland tumorigenesis in mouse models. Oncogene. 2, e81 [DOI] [PMC free article] [PubMed] [Google Scholar]
- Pickl, M. , Ries, C.H. , 2009. Comparison of 3D and 2D tumor models reveals enhanced HER2 activation in 3D associated with an increased response to trastuzumab. Oncogene. 28, 461–468. [DOI] [PubMed] [Google Scholar]
- Qiu, H. , Zappacosta, F. , Su, W. , Annan, R.S. , Miller, W.T. , 2005. Interaction between Brk kinase and insulin receptor substrate-4. Oncogene. 24, 5656–5664. [DOI] [PubMed] [Google Scholar]
- Ross, J.S. , Fletcher, J.A. , Bloom, K.J. , Linette, G.P. , Stec, J. , Clark, E. , Ayers, M. , Symmans, W.F. , Pusztai, L. , Hortobagyi, G.N. , 2003. HER-2/neu testing in breast cancer. Am. J. Clin. Pathol. (Suppl. 120) S53–S71. [DOI] [PubMed] [Google Scholar]
- Serfas, M.S. , Tyner, A.L. , 2003. Brk, Srm, Frk, and Src42A form a distinct family of intracellular Src-like tyrosine kinases. Oncol. Res. 13, 409–419. [DOI] [PubMed] [Google Scholar]
- Sergina, N.V. , Moasser, M.M. , 2007. The HER family and cancer: emerging molecular mechanisms and therapeutic targets. Trends Mol. Med. 13, 527–534. [DOI] [PMC free article] [PubMed] [Google Scholar]
- Sliwkowski, M.X. , Schaefer, G. , Akita, R.W. , Lofgren, J.A. , Fitzpatrick, V.D. , Nuijens, A. , Fendly, B.M. , Cerione, R.A. , Vandlen, R.L. , Carraway, K.L. , 1994. Coexpression of erbB2 and erbB3 proteins reconstitutes a high affinity receptor for heregulin. J. Biol. Chem. 269, 14661–14665. [PubMed] [Google Scholar]
- Sparano, J.A. , 2001. Cardiac toxicity of trastuzumab (Herceptin): implications for the design of adjuvant trials. Semin. Oncol. 28, 20–27. [DOI] [PubMed] [Google Scholar]
- Spears, M. , Taylor, K.J. , Munro, A.F. , Cunningham, C.A. , Mallon, E.A. , Twelves, C.J. , Cameron, D.A. , Thomas, J. , Bartlett, J.M. , 2012. In situ detection of HER2:HER2 and HER2:HER3 protein-protein interactions demonstrates prognostic significance in early breast cancer. Breast Cancer Res. Treat. 132, 463–470. [DOI] [PubMed] [Google Scholar]
- Subramanian, R. , Gondi, C.S. , Lakka, S.S. , Jutla, A. , Rao, J.S. , 2006. siRNA-mediated simultaneous downregulation of uPA and its receptor inhibits angiogenesis and invasiveness triggering apoptosis in breast cancer cells. Int. J. Oncol. 28, 831–839. [PMC free article] [PubMed] [Google Scholar]
- Sutherland, R.M. , McCredie, J.A. , Inch, W.R. , 1971. Growth of multicell spheroids in tissue culture as a model of nodular carcinomas. J. Natl. Cancer Inst. 46, 113–120. [PubMed] [Google Scholar]
- Wartenberg, M. , Donmez, F. , Ling, F.C. , Acker, H. , Hescheler, J. , Sauer, H. , 2001. Tumor-induced angiogenesis studied in confrontation cultures of multicellular tumor spheroids and embryoid bodies grown from pluripotent embryonic stem cells. FASEB J. 15, 995–1005. [DOI] [PubMed] [Google Scholar]
- Weaver, A.M. , Silva, C.M. , 2007. Signal transducer and activator of transcription 5b: a new target of breast tumor kinase/protein tyrosine kinase 6. Breast Cancer Res. 9, R79 [DOI] [PMC free article] [PubMed] [Google Scholar]
- Xiang, B. , Chatti, K. , Qiu, H. , Lakshmi, B. , Krasnitz, A. , Hicks, J. , Yu, M. , Miller, W.T. , Muthuswamy, S.K. , 2008. Brk is coamplified with ErbB2 to promote proliferation in breast cancer. Proc. Natl. Acad. Sci. U S A. 105, 12463–12468. [DOI] [PMC free article] [PubMed] [Google Scholar]
- Zeng, H. , Belanger, D.B. , Curran, P.J. , Shipps, G.W. , Miao, H. , Bracken, J.B. , Arshad Siddiqui, M. , Malkowski, M. , Wang, Y. , 2011. Discovery of novel imidazo[1,2-a]pyrazin-8-amines as Brk/PTK6 inhibitors. Bioorg. Med. Chem. Lett. 21, 5870–5875. [DOI] [PubMed] [Google Scholar]
- Zhang, P. , Ostrander, J.H. , Faivre, E.J. , Olsen, A. , Fitzsimmons, D. , Lange, C.A. , 2005. Regulated association of protein kinase B/Akt with breast tumor kinase. J. Biol. Chem. 280, 1982–1991. [DOI] [PubMed] [Google Scholar]
Associated Data
This section collects any data citations, data availability statements, or supplementary materials included in this article.
Supplementary Materials
Supplementary Figure 1 The co‐RNAi of HER2 and PTK6 additively reduces the phosphorylation of tumour‐promoting proteins in MDA‐MB‐361 and SKBR3 cells and the migration of BT474 cells. A, Western blot analysis of proteins using specific primary antibodies directed towards HER2, PTK6, (p = phospho) STAT3, (p) Akt, (p) PTEN, (p) p38MAPK, (p) ERK1/2 and tubulin (loading control). B, Representative figures showing BT474 cell migration at 0 h and 72 h, respective percentages of the open areas are shown and the scale bars represent 400 μm