

Abstract
In the current study, for the first time, we found that metastasis‐associated gene 1 (MTA1) was a higher‐order chromatin structure organizer that decondenses the interphase chromatin and mitotic chromosomes. MTA1 interacts dynamically with nucleosomes during the cell cycle progression, prominently contributing to the mitotic chromatin/chromosome structure transitions at both prophase and telophase. We showed that the decondensation of interphase chromatin by MTA1 was independent of Mi‐2 chromatin remodeling activity. H1 was reported to stabilize the compact higher‐order chromatin structure through its interaction with DNA. Our data showed that MTA1 caused a reduced H1‐chromatin interaction in‐vivo. Moreover, the dynamic MTA1‐chromatin interaction in the cell cycle contributed to the periodical H1‐chromatin interaction, which in turn modulated chromatin/chromosome transitions. Although MTA1 drove a global decondensation of chromatin structure, it changed the expression of only a small proportion of genes. After MTA1 overexpression, the up‐regulated genes were distributed in clusters along with down‐regulated genes on chromosomes at parallel frequencies.
Keywords: MTA1, Chromatin, Histone H1, in‐vivo, Nucleosome remodeling and histone deacetylation complex (NuRD)
Highlights
We first reports MTA1 expression throughout the cell cycle in noncancerous cell lines.
MTA1 level in the nucleus correlates with state of chromatin condensation.
We link MTA1 expression to H1 expression and the state of chromatin condensation.
Abbreviations
- MTA1
metastasis-associated gene 1
- NuRD
nucleosome remodeling and histone deacetylase
- NRL
nucleosome repeat length
- HATs
histone acetyltransferases
- HDACs
histone deacetyases
- DE
differentially expressed
- GO
gene ontology
- CoIP
co-immunoprecipitation
- MBD3
methyl-CpG binding domain protein 3
- HMG
high mobility group
- Pol II
RNA polymerase II
1. Introduction
In eukaryotes, genomic DNA molecules are hierarchically packaged into chromatin fibers. The basic unit of chromatin is the nucleosome, which consists of 147 base pairs (bp) of DNA wrapped in approximately 1.7 superhelical turns around the core histone octamer (Luger et al., 1997). The linear repeating array of nucleosomes comprises the primary chromatin structure, and interactions between nucleosomes stabilized by linker histone H1 drive the formation of a more condensed 30 nm fiber (Horn and Peterson, 2002; Tremethick, 2007), which can be further folded into increasingly compacted structures. Higher‐order chromatin structure refers to the hierarchically condensed chromatin structures above the primary linear nucleosomal arrays, ranging from the less compacted 30 nm fiber (the first level of higher‐order compaction) to the highly compacted metaphase chromosome architecture.
Chromatin undergoes various structural hierarchy during a cell cycle. Histone modifications lead to chromatin structure alteration, hence influencing DNA replication and transcription. Linker histone H1 or its variants, such as H5, plays a major role in stabilizing both the intermediate and extensively folded nucleosomal arrays (Carruthers et al., 1998; Hizume et al., 2005; Thoma et al., 1979). Histone H1 promotes and stabilizes the folding of linear nucleosomal arrays into higher‐order chromatin structures (Allan et al., 1980; Bednar et al., 1998; Hamiche et al., 1996; Thoma et al., 1979; Travers, 1999). Binding of histone H1 to nucleosomal arrays affects the nucleosome repeat length (NRL) (Fan et al., 2003, 2005, 1984, 2006), restricts mobility of nucleosomes (Pennings et al., 1994), and promotes chromatin folding; meanwhile, loss of H1 disables normal 30‐nm chromatin fibers formation (Routh et al., 2008; Thoma et al., 1979), leads to decondensation of chromatin (Bates et al., 1981; Fan et al., 2005), and then facilitates DNA transcription. In view of the pivotal role of H1 on stabilizing higher‐order chromatin structure, any factor that affects the association of H1 with chromatin will strikingly impact the compaction of chromatin and hence DNA‐dependent processes.
ATP‐dependent nucleosome remodeling and core histone modifications were reported to be other important factors affecting the high‐order structure regulation (Varga‐Weisz and Becker, 2006). Histone hyperacetylation loosens the compaction of chromatin structure, whereas its hypoacetylation condenses it (Ahringer, 2000). Nucleosome remodeling and histone deacetylation (NuRD) complex contains two components playing opposite roles in chromatin remodeling by ATPase Mi‐2 subunit and chromatin condensing by histone deacetylase HDACs subunit. However, as a whole complex, NuRD generally displays the transcriptional repression property of HDACs, in which Mi‐2 disrupts nucleosomes to facilitate the accessibility of HDACs to DNA (Wang and Zhang, 2001; Xue et al., 1998).
MTA1 was reported to be overexpressed in a variety of tumors and strongly promoted the malignant properties especially invasion and metastasis abilities of cancer cells (Toh and Nicolson, 2009). MTA1 is a nucleosome‐bound protein (Nair et al., 2013). It has been described as an integral subunit of NuRD, providing clues to the chromatin‐modifying roles of MTA1 (Nicolson et al., 2003). However, its actual role in chromatin structure regulation is relatively unknown. Since MTA1‐containing NuRD is predominantly a transcriptional repressor, it is expected that MTA1 may work as a chromatin condensor. Herein, we attempted to assess the actual effect of MTA1 on chromatin and chromosome structure in‐vivo, analyze the role of MTA1 in transcriptional regulation, and explore the possible underlying mechanisms. Unexpectedly, we found that MTA1 produced an overall chromatin decondensation instead of the expected condensation.
2. Materials and methods
2.1. Cell culture and transfection
The cell lines HEK293, NCI‐H446, Hep3B, and HCT‐8 were obtained from the American Type Culture Collection (ATCC). The cell lines HaCaT, Ishikawa, and SF767 were maintained in our laboratory as described previously (Boukamp et al., 1988; Nishida, 2002; Wyrick et al., 1997). All cell lines were cultured in Dulbecco's modified Eagle's medium (BIOROC, China) supplemented with 10% fetal bovine serum at 37 °C in a 5% CO2 standard incubator. DNA transfection was carried out using Lipofectamine 2000 (Invitrogen, USA) according to the manufacturer's instructions.
2.2. Plasmid construction and stable cell line establishment
The complete human MTA1 CDS was cloned by RT‐PCR using the positive clones as template screened by in‐situ plaque hybridization with the human lung phage library. pEGFP‐MTA1 were constructed by inserting the complete human MTA1 CDS into the pEGFP‐C2 vector (Clontech, USA), in which GFP tag was fused to the N terminus of MTA1. The EGFP tag fused to the C terminus of MTA1 was ligated after Xho I digestion and then inserted into the pCDNA3.1 vector (Life Technologies, USA) to yield the pCDNA3.1‐MTA1‐EGFP vector; MTA1‐flag was constructed by PCR and inserted into the retroviral vector pMX‐IRES‐GFP. All sequences were verified by DNA sequencing.
The pMX‐MTA1‐flag‐IRES‐GFP was used to package retroviral particles and infect HCT116 colon cells to obtain stable MTA1‐expressing cell lines, out of which HCT116‐M1 and HCT116‐M3 were identified with different overexpression levels and used in the present study. The HCT116 cell line with MTA1 stably knocked down was established by G418 selection after transfection of shRNA targeting the GACCCTGCTGGCAGATAAA sequence in HCT116 cells.
2.3. Antibodies and immunoprecipitation
Antibodies against MTA1 and histone deacetylase (HDAC)‐2 (ab51832) were purchased from Abcam (USA); anti‐Fibrillarin (#2396) and anti‐phospho‐Histone H3 (Ser10) (#3458) antibodies were purchased from Cell Signaling Technology (USA); antibodies against H1 (BS1655) and GAPDH (AP0063) were from Bioworld Technology (USA); anti‐beta‐actin antibody was obtained from Sigma–Aldrich (A5316, USA); antibodies against MBD3 (sc‐28743) and Mi‐2 (sc‐11378) were purchased from Santa Cruz Biotechnology (USA). HCT116 cell extracts were immunoprecipitated with MTA1 antibody (3 μg for each immunoprecipitation) followed by Western blotting. As control, mouse IgG antibody was used.
2.4. Immunofluorescence studies
Cells were grown on glass coverslips in a 6‐well plate, fixed for 10 min in 4% paraformaldehyde, and permeabilized with 0.1% Triton X‐100 for 10 min. After blocking for 1 h in 0.5% BSA, they were incubated overnight with primary antibodies, washed, and incubated with secondary antibodies for 1 h. Nuclei and chromatin/chromosome compaction state were visualized after 10 min staining with DAPI (dilution 1:2000; Sigma–Aldrich, USA). Slides were analyzed under a fluorescence microscope (Olympus, BX51, Japan) or by confocal laser scanning microscopy (Leica, TCS SP2, Germany). To assess the dynamics of MTA1 or the interplay between MTA1 and H1 during the cell cycle, images of normal cells at different cell cycle stages were captured and co‐localization of MTA1 and H1 or DAPI staining was analyzed.
2.5. Protein extraction and Western blot analysis
Whole cell lysates were prepared with the RIPA buffer. The cytoplasmic and nuclear extracts were prepared using a Nuclear and Cytoplasmic Protein Extraction kit (Beyotime Biotech, China) according to the manufacturer's instructions. Protein concentrations were quantified by the BCA reagent (Sigma–Aldrich, USA), and 100 μg protein was used per lane; Western blot analysis was carried out according to standard procedures.
2.6. Flow cytometry analysis of mitotic cell proportion and cell cycle
HEK293 cells transfected with pEGFP‐MTA1 for 48 h were fixed for 10 min with 2–4% formaldehyde, permeabilized for 30 min with 90% methanol on ice, and blocked with 0.5% bovine serum albumin for 30 min. After incubation with Phospho‐Histone H3 (Ser10) conjugated with Alexa Fluor 647 (1:50 diluted) for 1 h, the fluorescence intensity of GFP and Alexa Fluor 647 was analyzed by flow cytometry (BD Biosciences FACScan, BD Biosciences, USA). First, the transfected cells were simply divided by GFP fluorescence into negative, low, moderate and high groups. Then, each group was further analyzed by Phospho‐Histone H3 fluorescence to identify the mitotic proportion. For cell cycle analysis, the transfected 293 cells were fixed with 70% ethanol, stained with 50 μg/ml propidium iodide (Sigma–Aldrich, USA) and treated with 10 μg/ml ribonuclease A (Takara, China) before flow cytometry detection of DNA content.
2.7. RNA extraction and gene expression profiling analysis
NimbleGen 12 × 135 K microarrays (NimbleGen, USA) that target 45033 genes were used for gene expression profiling analysis. In summary, total RNA was extracted from HCT116 control and HCT116‐M3 cells using Trizol, and quantified by the NanoDrop ND‐1000. RNA integrity was assessed by standard denaturing agarose gel electrophoresis. About 5 μg total RNA from each sample was used for labeling and array hybridization by the following steps: 1) Reverse transcription with Invitrogen Superscript ds‐cDNA synthesis kit (Invitrogen, USA); 2) ds‐cDNA labeling with NimbleGen one‐color DNA labeling kit; 3) Array hybridization using the NimbleGen Hybridization System followed by washing with the NimbleGen wash buffer kit; 4) Array scanning on an Axon GenePix 4000B microarray scanner (Molecular Devices Corporation, USA). Scanned images were then imported into the NimbleScan software (version 2.5) for grid alignment and expression data analysis. Expression data were normalized using quantile normalization and the Robust Multichip Average (RMA) algorithm included in the NimbleScan software. Further data analysis was performed using the Agilent GeneSpring GX v11.5.1 software (Agilent, USA). Differentially expressed (DE) genes between both samples were identified through Fold Change filtering. Pathway Analysis and GO analysis were applied to determine the roles of the differentially expressed genes in various biological pathways or GO terms. Chromosomal localization of all DE genes was analyzed, and the distributional trends between up‐regulated and down‐regulated genes were compared.
2.8. Quantitative PCR analysis
Total RNA was prepared as described above. Reverse transcription was performed using the Oligo (dT)18 and VigoScript First Strand cDNA Synthesis Kit (Vigorous Biotechnology, China). Quantitative PCR was performed using UltraSYBR mixture (with Rox) reagent (CWBIO, China) on a ABI7500 thermal cycler (Life Technologies, USA). Primer information is available upon request.
3. Results
3.1. MTA1 decondenses the higher‐order chromatin structure
MTA1 is well known as a cancer‐promoting gene, but the precise mechanisms remain elusive. To further study the functions and mechanisms of MTA1 in‐vivo, we first constructed a pEGFP‐MTA1 vector expressing the fusion protein EGFP‐MTA1 and tracked the localization of the exogenous MTA1 in cells. The nucleus was probed with the DNA‐specific fluorescent dye 4′,6‐diarmdino‐2‐phenylindole (DAPI), which is routinely used to visualize DNA and investigate chromatin structure alteration, as the amount of DAPI bound to nuclear DNA reflects the degree of chromatin compaction (Kapuscinski, 1995).
For control vectors pEGFP‐C2 and pCDNA3.1‐EGFP, GFP showed a diffused expression pattern across the entire cell. For the pEGFP‐MTA1 transfected HEK293 cells in interphase, though cytoplasmic MTA1 could be found in most transfected cells (Liu et al., 2014), the majority of MTA1‐EGFP was localized to the nucleus as previously reported (Nicolson et al., 2003) with varied densities from cell to cell. We classified the MTA1 overexpression into negative, low, moderate and high by detecting the GFP fluorescence intensity under fluorescence microscope and by flow cytometry. We found an uneven distribution of EGFP‐MTA1 in about 20% of positive nuclei, in which high EGFP‐MTA1 density showed a local‐enrichment manner (Figure 1A). A similar distributional pattern was also detected in pCDNA3.1‐MTA1‐EGFP vector transfection. This spot or speckle‐like distribution of exogenous MTA1 provided an ideal in‐vivo model to study its in‐situ functions and mechanisms at a single‐cell level.
Figure 1.
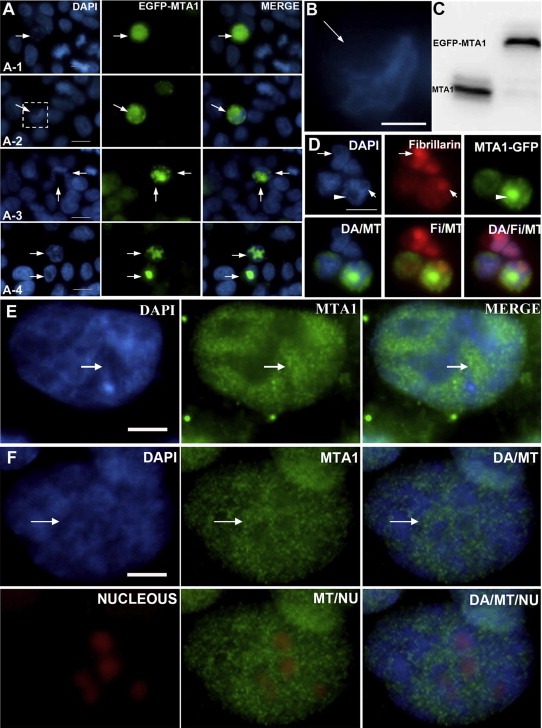
MTA1 decondenses chromatin higher‐order structure in‐vivo. (A) Different distribution patterns of EGFP‐MTA1 in nuclei and chromatin decondensation induced by exogenous MTA1. (A‐1) MTA1‐EGFP distributes throughout the whole nucleus with strikingly reduced compact chromatin structure. (A‐2, A‐3 and A‐4) Speckle and spot distribution pattern of MTA1‐EGFP in nuclei caused a decondensation of chromatin in corresponding nucleus regions. (B) Enlargement of the decondensed long and thin chromatin fiber‐like structures presented in (A‐2). (C) Expression of pEGFP‐MTA1 in 293 was analyzed by Western blot. (D) Comparisons of the decondensation extent between MTA1 highly binding regions marked by arrowhead and nucleolar euchromatin regions indicated by fibrillarin antibody and marked by arrow. (E and F) Endogenous MTA1 binding caused the decondensation of chromatin under physiological conditions indicated by arrow in HCT116 (E) and CAI‐H446 (F), also the data in (F) demonstrated that endogenous MTA1 binds less to nucleolus, but both higher MTA1 binding regions and nucleolus regions possess more open chromatin structure.
By cell immunofluorescence co‐localization assays, we found a dramatically reduced DAPI density in MTA1 highly‐expressing nuclei and in MTA1 highly‐bound local nuclear regions (Figure 1A), indicating that over‐binding of MTA1 to nucleosomes leads to a decondensation of chromatin. In the regions with high level of MTA1, decondensed long and thin chromatin fiber‐like structures were observed (Figure 1B). The exogenous EGFP‐MTA1 expression in the cells was confirmed by Western blot (Figure 1C). We excluded the possibility that the altered chromatin structure was caused by a cytotoxic effect of exogenous MTA1, since no apoptotic cells were detected in transfected 293 cells (even in those with high exogenous MTA1 overexpression), as determined by multiple methods including sub‐G1 analysis and PI staining.
In eukaryotic nuclei, euchromatin and heterochromatin are two states of interphase chromatin. Euchromatin is structurally open and transcriptionally active with weak DAPI staining, unlike heterochromatin. Nucleoli are easily recognized under fluorescence microscope because their intranucleolar euchromatin is hardly stained by DAPI (Kodiha et al., 2011) (Figure 1D). Interestingly, MTA1‐enchriched chromatin regions did not overlap with nucleoli but had similar levels of chromatin compaction (Figure 1D).
To confirm that the chromatin decondensation by MTA1 shown above also takes place under physiological conditions in‐vivo, we further validated the endogenous MTA1 in multiple cell lines. The nuclear regions with higher endogenous MTA1 binding showed a more open chromatin structure (Figure 1E and F), confirming that endogenous MTA1 also shares the properties of exogenous MTA1 to decondense chromatin.
The above results demonstrated that MTA1 is a potent regulator of chromatin structure in‐vivo. Binding of MTA1 to nucleosomes in nuclei leads to a striking decondensation of chromatin structure and confers to the bound chromatin an appearance of euchromatin.
3.2. The dynamic distribution of MTA1 during the cell cycle
The above results demonstrated a powerful effect of MTA1 in decondensing higher‐order chromatin structure on interphase chromatin. As we know, mitotic chromosome is the highest order of chromatin structure. To further confirm the role of MTA1 in decondensing higher‐order structure, we assessed its role in mitotic chromosome regulation.
In somatic cells, chromosomes exist only in mitosis in‐vivo. Therefore, we first examined the subcellular localization of MTA1 during the cell cycle, and found for the first time a dynamic MTA1‐chromatin interaction during the cell cycle (Figure 2). In interphase, MTA1 localized mainly in the nucleus, binding to chromatin (Nawa et al., 2000; Nicolson et al., 2003); upon entering into prophase, MTA1 disassociated gradually from chromatin as chromatin condensed into the chromosome. The disassociated MTA1 diffused inside the nuclear region and was gradually translocated into the cytoplasm till prometaphase, when MTA1 was completely cytoplasmic around the maximally condensed chromosomes; MTA1 remained around chromosomes through metaphase and anaphase. When the cell entered into telophase, MTA1 gradually re‐entered into the nucleus along with the decondensation of chromosomes into chromatin. The dynamic distribution of MTA1 during the cell cycle was also confirmed in other cell lines, including tumor cells (NCI‐H446, HCT‐8, Ishikawa, Hep3B, and SF‐767) and normal cells (HEK293 and HaCaT) (Data not shown), indicating that this is a physiological and universal function of MTA1 in cells. These findings were confirmed by both endogenous and exogenous MTA1 tracking (Figure 2).
Figure 2.
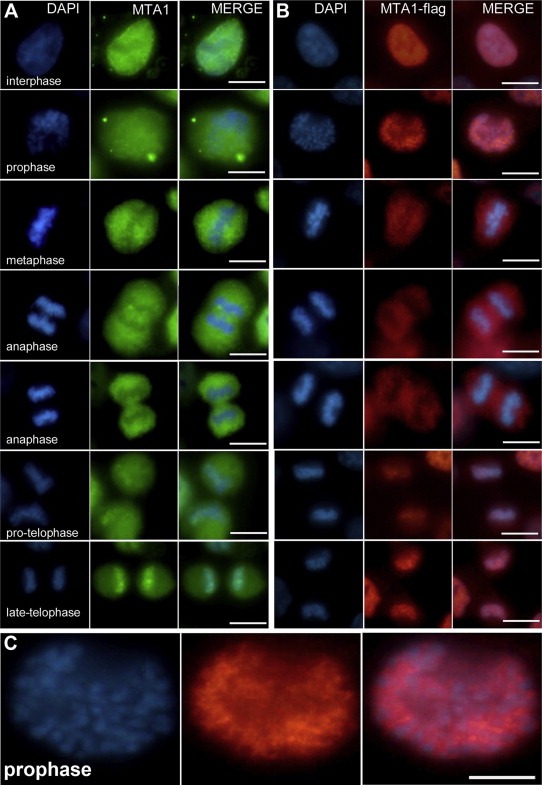
Dynamic distribution of MTA1 during the cell cycle. (A) Distribution of endogenous MTA1 during the cell cycle in HCT116 cells. Indirect immuno‐fluorescence was performed by probing endogenous MTA1 with MTA1 mono‐antibody to trace its subcellular localization at different stages of the cell cycle. At interphase, endogenous MTA1 localized mainly at the nucleus; it gradually disassociated from chromatin and translocated to the cytoplasm during the prophase; at metaphase and anaphase, MTA1 remained in the cytoplasm surrounding the chromosomes; MTA1 re‐entered and bound to the decondensing chromosomes when the cell entered telophase. (B) Distribution of exogenous MTA1‐flag during the cell cycle in HCT116‐M3 cells. The above results were verified by indirect immuno‐fluorescence to trace exogenous MTA1 using antibody against flag Tag in MTA1 stably expressing HCT116‐M3 cells. The same distribution pattern with endogenous MTA1 across the cell cycle was achieved. (C) An enlargement of the image of the exogenous MTA1 distribution in prophase in (B) showing that although most MTA1 remained in the nucleus during prophase, it had already disassociated from chromosomes.
The above results demonstrated that MTA1‐chromatin interaction is periodical in the cell cycle. The most prominent transfer (release from or re‐binding to chromatin) occurs at chromosome structure transitions in prophase and telophase.
3.3. MTA1 dynamically regulates the chromosome structure during the cell cycle
During the cell cycle, the compaction extent of the chromatin was negatively correlated with MTA1 binding density (Figure 2). At interphase when most MTA1 binds to chromatin, the chromatin displays a loosen appearance, while at metaphase when MTA1 is completely disassociated from chromatin and redistributed to the cytoplasm, the chromatin reaches its most compacted form—metaphase chromosome. Taking into account that elevated MTA1 expression drove the chromatin into a decondensed state, these results suggested that MTA1 drives the decondensation of chromosome structure during the cell cycle.
Then, to further confirm the role of MTA1 in decondensing chromosome, we analyzed the direct effect of MTA1 on chromosome structure during prophase and anaphase. The metaphase and anaphase chromosomes were not analyzed because of no MTA1 binding activity during these periods.
On entering prophase, MTA1 disassociates gradually from chromatin. Prophase nuclear regions with relatively more residual MTA1 possessed a less compacted chromosome structure (Figure 7A and B), indicating that MTA1 binding inhibits chromatin condensation during prophase.
Figure 7.
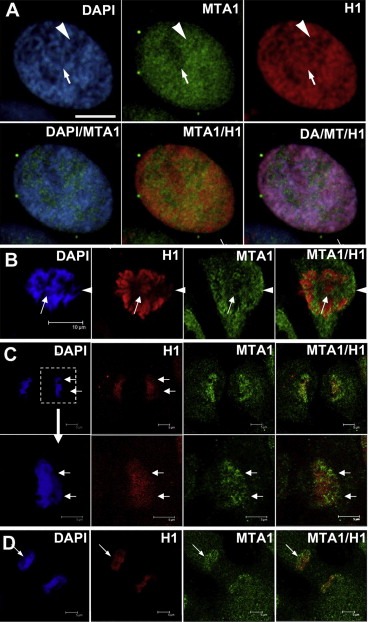
H1 binds less to the nuclear regions with higher endogenous MTA1. (A and B) During prophase, at chromatin regions that had higher residual MTA1 binding, H1 enriched slower and the chromatin was also condensed slower (white arrowheads in A and B), while at regions that possessed less residual MTA1, H1 enriched earlier concomitant with early chromatin condensation (white arrows in A and B). (C and D) At telophase, when MTA1 gradually re‐entered and bound to chromosome, at regions that MTA1 bound earlier, H1 released and chromosome decondensed also earlier (white arrows in C and D).
During telophase, MTA1 re‐enters into the nucleus and re‐binds to chromosomes. As shown in Figure 3A, two pairs of cells were undergoing telophase separation with comparable separated distance. For the right pair, the two daughter cells with no MTA1 entry into the nucleus possessed densely compacted chromosomes; while in the left pair, the two daughter cells with some MTA1 re‐binding to chromosomes had relatively loosened chromosomes. Even for the two daughter cells of the left pair, the chromosomes were re‐bound with different amounts of MTA1 (Figure 3A‐1). Cell ‘a’ with more MTA1 binding to chromosome than cell ‘b’ also had a more decondensed chromosome set. What's more, even at different regions of the same chromosome set in one daughter cell (a, b and c), MTA1 displayed a positive association between the chromatin binding amount and chromosomal decondensation degree. As shown in Figure 3A‐1 and B, the chromosomal regions with more MTA1 binding (indicated by white arrow) were more decondensed than other regions with less MTA1 (indicated by red arrow). These results indicated that MTA1 promotes chromosome decondensation during telophase.
Figure 3.
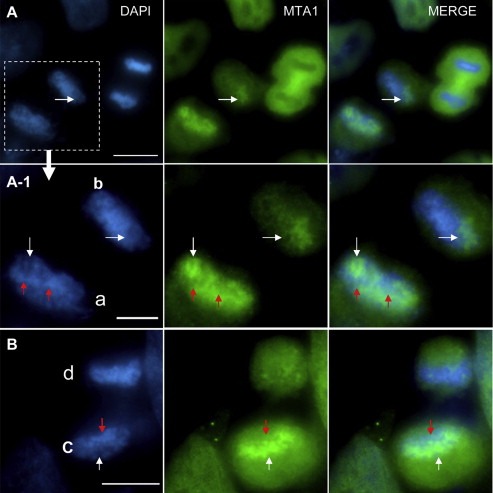
Re‐entry of MTA1 during telophase promotes decondensation of chromosomes. (A and B) Immuno‐fluorescence analysis of NCI‐H446 cells captured at telophase to clarify the effect of endogenous MTA1 on chromosome decondensation. (A) Two pairs of telophase cells with comparable separated distance. For the right pair, MTA1 had not entered into the nucleus with chromosomes densely compacted; for the left pair, MTA1 had already entered and bound to the chromosome leading to a more decondensed chromosomal structure. (A‐1) Enlargement of the left pair of telophase cell in (A). For the upper daughter cell ‘b’, MTA1 bound less to the chromosome with a relatively more compact chromosomal structure; for the lower daughter cell ‘a’, the chromosome was bound with more MTA1 resulting in a relatively more decondensed chromosomal structure. Even for different chromosomal regions in the same daughter cell, higher MTA1 re‐binding regions possessed more decondensed chromosomal structure and were marked by white arrow; lower MTA1 re‐binding regions harboring less decondensed chromosomal structure were marked by red arrow. (B) Another example of telophase NCI‐H446 cell showing the same result. Higher MTA1 re‐binding chromosome regions had more decondensed chromosomal structure and were marked by white arrow; lower MTA1 re‐binding regions had less decondensed chromosomal structure and were marked by red arrow.
Taken together, the above data indicated that MTA1 also participated in decondensing the mitotic chromosome structure. The dynamic distribution of MTA1 during the cell cycle dynamically regulates the periodic chromatin/chromosome structure transitions.
3.4. High overexpression of exogenous MTA1 blocks the compaction of chromatin into the chromosome
We further testified the role of exogenous MTA1 in decondensing chromosome. It is well known that pre‐prophase starts with the initiation of chromatin condensation. Since MTA1 inhibits chromatin condensation in prophase, we propose that high level of exogenous MTA1 in nucleus will block the compaction of chromatin into chromosome and then the transition of the cell cycle from interphase to prophase. To verify this hypothesis, exogenous MTA1 was transiently expressed in 293, and the proportion of mitotic cells in overall population with various MTA1 levels were measured by confocal microscopy and flow cytometry. The mitotic cells were probed with Alexa Fluor 647‐conjugated antibody targeting Ser10‐phosphorylated histone H3, which is a specific marker for mitosis. Results showed that low to moderate MTA1 expression did not stop the initiation of mitosis, while cells with high MTA1 expression were almost completely blocked from entering into mitosis, indicated by negative p‐H3 (Figure 4A) or flow cytometry (Figure 4B and C). By flow cytometry evaluation, low to moderate MTA1‐expressing cells did not show a significant difference in cell cycle distribution compared with control cells, while most cells with high MTA1 expression showed about 4N DNA content (Figure 4D). Combining with the negative p‐H3 status, these data indicated that these cells were blocked at G2 phase, when condensation of duplicated chromatin happens.
Figure 4.
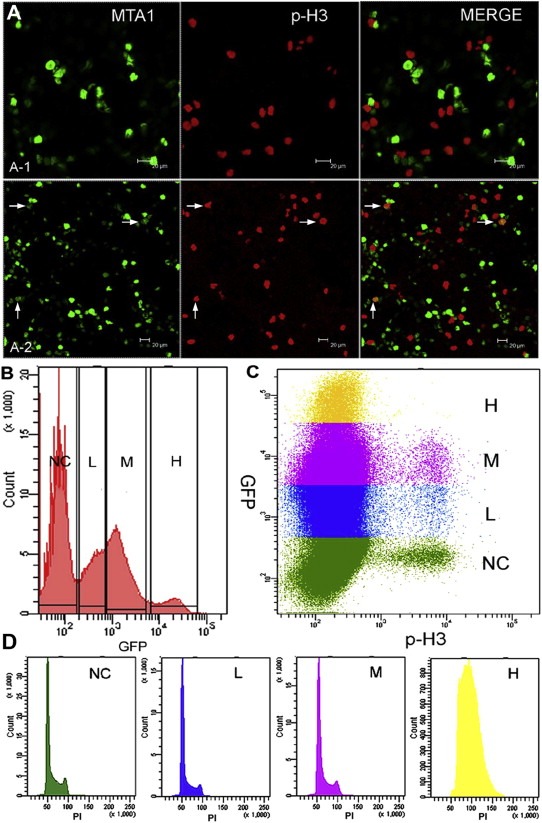
Highly accumulated MTA1 in the nucleus blocked chromatin from decondensing into the chromosome. (A) Results of immuno‐fluorescence of 293 cells transfected pEGFP‐MTA1 indicated that all highly MTA1‐expressing cells were p‐H3 negative; however, low and moderate MTA1 levels could not stop the cell from entering the mitosis (cells marked by white arrow). (B–D) Flow cytometry analysis. (B) The level of MTA1 overexpressing in 293 cells can be simply classified by the GFP fluorescence intensity into negative (NC), low (L), moderate (M) and high (H). Each section was further analyzed by (C) p‐H3 staining the mitotic cells and (D) PI staining the DNA. p‐H3 staining data support the results of immuno‐fluorescence in (A) that highly expressed MTA1 stopped the cell cycle from entering into mitosis, while low and moderate MTA1 levels could not. Further analysis of DNA content showed a replicated DNA content in highly MTA1‐expressing cells, indicating that theses cells were blocked at G2 phase prior to prophase.
To sum up, the above results indicated that MTA1 is a powerful regulator of chromatin higher‐order structure, functioning for both the less compacted interphase chromatin and highly compacted mitotic chromosomes. Highly accumulated MTA1 in nucleus prevents the replicated DNA from being condensed into chromosomes and therefore stops the cells at G2 phase prior to prophase.
3.5. Decondensation of chromatin higher‐order structure by MTA1 is independent of the remodeling function of Mi‐2/NuRD
MTA1 has been reported to be an integral component of the NuRD complex, which was also supported by CoIP‐Mass spectrum identification of MTA1 interactome (data not shown). The IP data confirmed the interaction of MTA1 with chromatin remodeling ATPase Mi‐2 and histone deacetylase HDAC2 (Figure 5A). Mi‐2, a NuRD component, is a transcriptional activator by opening chromatin structures. On exploring the mechanism of MTA1‐induced chromatin decondensation, we first proposed that Mi‐2 may be the actual effector bridging MTA1 and chromatin remodeling. Based on this hypothesis, a parallel recruitment of Mi‐2 was expected to come along with MTA1 enrichment on decondensed chromatin. Unexpectedly, no recruitment of Mi‐2 to this region was seen in most MTA1‐overexpressing nuclei (more than 80%, Figure 5B and C), with only a slight recruitment in the remaining nuclei (Figure 5D). These findings indicated that chromatin decondensation by MTA1 is independent of Mi‐2/NuRD mediated chromatin remodeling, or Mi‐2 contributes little to this process. These results provide new clues supporting the already presumed idea that MTA1 functions are not limited to the MTA1/NuRD complex as originally described (Li et al., 2012; Manavathi and Kumar, 2007; Moon et al., 2004). Methyl‐CpG binding domain protein 3 (MBD3) is another important subunit of the NuRD complex. Similar results with Mi‐2 were achieved by MTA1‐MBD3 immuno‐colocalization assay (data not shown). However, a strong recruitment of HDAC2 to the decondensed chromatin was observed with the recruitment of MTA1 in most cells (>90%, Figure 5E and F). HDACs are transcriptional repressors making chromatin more condensed by deacetylating core histones. So, function of MTA1 in chromatin decondensation is independent of Mi‐2/NuRD.
Figure 5.
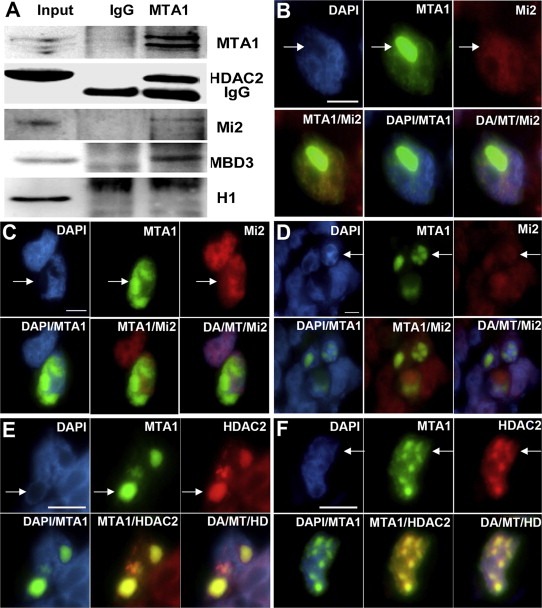
Decondensation of chromatin by MTA1 is independent of Mi‐2/NURD. (A) Immunoprecipitation with MTA1 antibody showed that MTA1 interacted with other components of NuRD (HDAC2, Mi‐2, and MBD3), but didn't interact with histone H1. (B, C and D) In‐situ immuno‐fluorescence analysis of the recruitment of Mi‐2 by MTA1 to decondensed chromation regions. In most situations (B and C), no Mi‐2 was recruited by MTA1. Only a slight recruitment of Mi‐2 was observed in some cells (D). (E and F) Immuno‐fluorescence analysis of the recruitment of HDAC2 by MTA1 to the decondensed chromation regions. In more than 90% cells, MTA1 had a strong recruitment of HDAC2.
3.6. Histone H1 stabilizes the chromatin higher‐order structure
Besides Mi‐2/NuRD, we screened other candidate intermediates for MTA1‐induced chromatin decondensation. Linker histone H1 is a major regulator of high‐order chromatin structure (Bustin et al., 2005; Thoma and Koller, 1977), and it is known that reduction of total H1 in‐vivo leads to a globally decondensed chromatin structure (Fan et al., 2005; Shen et al., 1995).
In our experiments, we noted that H1 enrichment on chromosomal regions was closely related to the degree of chromatin compaction. The NCI‐H446 cell line was adopted because of its larger nuclei and more recognizable mitosis phases, as compared to other cell lines assessed herein. As shown in Figure 6A, H1 enrichment was parallel to the compaction density of chromatin in the cell cycle. Interphase chromatin has the lowest H1 staining (nucleolus is excluded with relative higher H1 staining that has been reported previously to be associated with the H1 subtype H1x (Stoldt et al., 2007)) (cell ‘a’); H1 intensity rised as chromatin was gradually condensed into chromosomes in prophase (cell ‘b’) and peaked at metaphase when chromatin was maximally compacted (cell ‘c’); while entering into telophase (cell ‘d’), with chromosomes gradually decondensed into chromatin at early G1 (cell ‘e’), H1 was gradually disassociated from chromosomes down to the level of interphase. Even in the same chromosome set, H1 intensity was also positively associated with the compaction extent of chromatin regions with higher H1 more compact, while regions with reduced H1 were less compact (Figure 6B). All these data support the notion that H1 stabilizes the higher‐order chromatin structure.
Figure 6.
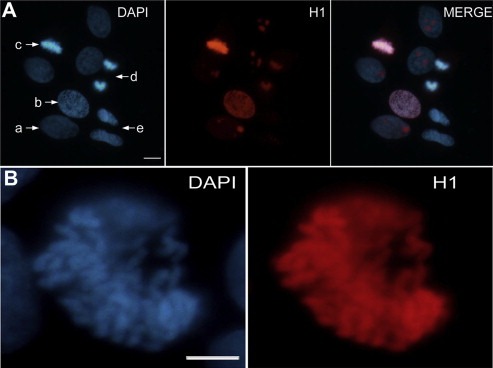
Histone H1 intensity is closely related to the compaction degree of chromatin. (A) Cells at different cell cycle stages were enriched with varied amounts of H1. With the progression of the cell cycle, from interphase (‘a’), prophase (‘b’), metaphase (‘c’), to telophase (‘d’) and again returned to pre‐G1 (‘e’), binding of Histone H1 to chromatin followed a cell cycle‐dependent enrichment and disassociation process. (B) A nucleus in prophase indicated that binding intensity of H1 on subfields of the chromosome was consistent with the degree of chromosome compaction.
3.7. H1 binds less to nuclear regions with higher endogenous MTA1
To explore whether H1 contributes to the decondensation role of MTA1 in higher‐order chromatin structure regulation, we then analyzed the relationship between MTA1 and H1 on chromatin binding. The above results identified that MTA1 functioned in prophase and telophase. So, we chose these two phases to investigate the relationship between MTA1 and H1.
In prophase, less compact areas with more residual MTA1 were enriched with less H1; While the most compact areas with less MTA1 binding were occupied with more H1 (Figure 7A and B). On entering telophase, MTA1 gradually re‐enters the nucleus from the cytoplasm and re‐associates with the decondensing chromosomes, promoting the decondensation of chromosomes. We noted that less H1 was associated with more MTA1 re‐binding on subfields of the chromosome (Figure 7C and D).
These results showed a negative relationship between MTA1 binding and H1‐chromatin interaction, indicating that MTA1 may participate in decondensing the chromatin higher‐order structure through disrupting the H1‐chromatin interaction.
3.8. H1‐chromatin interaction varied inversely with the dynamic MTA1‐chromatin interaction during the cell cycle
Since MTA1 regulates chromatin decondensation dynamically during the cell cycle, we supposed the H1‐chromatin interaction during the cell cycle should follow this process negatively. Therefore, we analyzed the interplay between MTA1 and H1 during the different cell cycle stages.
To visualize the interplay between MTA1 and H1, we probed the endogenous MTA1 and total H1 by indirect double immunofluorescent staining in the NCI‐H446 cell model. As shown in Figure 8, at interphase, the majority of MTA1 attached to the loosely compacted chromatin in nucleus but was low in nucleoli, as was supported by data from other group (Nawa et al., 2000). At this period, less H1 was enriched on chromatin (except nucleolus), where more MTA1 was attached to chromatin in nucleus; for the cell entering pre‐prophase with MTA1 disassociating from the chromatin, H1 gradually increased its enrichment on chromatin until late‐prophase/prometaphase, when MTA1 was totally disassociated from chromatin and expelled from the nuclear region; H1 peak of binding to chromatin lasted through anaphase. MTA1 remained at periphery of chromosomes and H1 sustained its binding on chromosomes during metaphase and anaphase. As cells progressed into telophase with MTA1 gradually regaining its occupation on chromosome, H1 was released from chromosome and faded to the interphase level. The highly complementary harmony of MTA1 and H1 in localization and intensity on chromatin during the cell cycle supports our hypothesis that MTA1 regulates chromatin higher‐order structure through regulating H1‐chromatin interaction.
Figure 8.
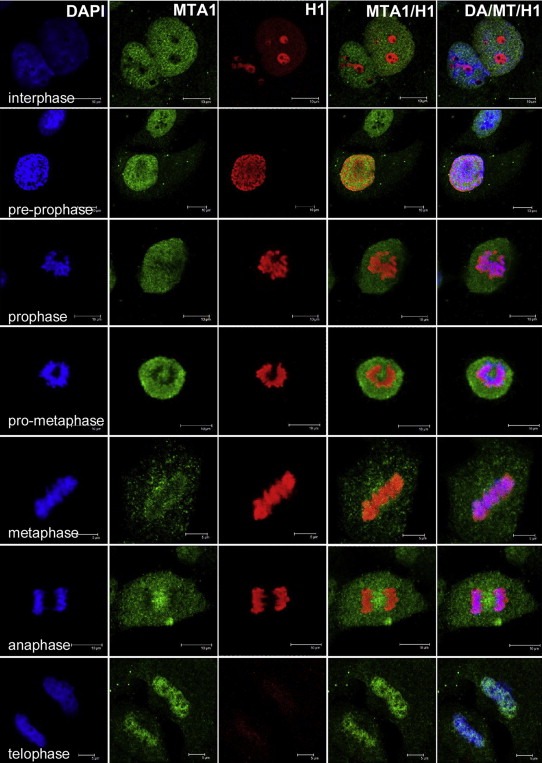
The interplay between endogenous MTA1 and H1 on chromatin binding during the cell cycle. H1‐chromatin interaction varied inversely with the dynamic MTA1‐chromatin interaction during the cell cycle (from interphase to telophase).
3.9. Enforced expression of MTA1 drives H1 away from chromatin in‐vivo
To verify the indicated role of MTA1 in H1‐chromatin interaction disruption, we first checked whether MTA1 overexpression altered H1 level in the nucleus. Although H1 binding is inter‐exchanging continuously between chromatin regions, almost the entire H1 pool in nuclei binds to chromatin at any time (Misteli et al., 2000). Thus, the amount of H1 in nuclei represents well the binding intensity of H1 to chromatin. Indeed, we found apparently decreased H1 in MTA1 stably‐overexpressing nuclei compared with the control nuclei (Figure 9A), while stably silencing MTA1 in HCT116 cells (HCT116‐siMTA1) resulted in increased H1 in nuclei (Figure 9B).
Figure 9.
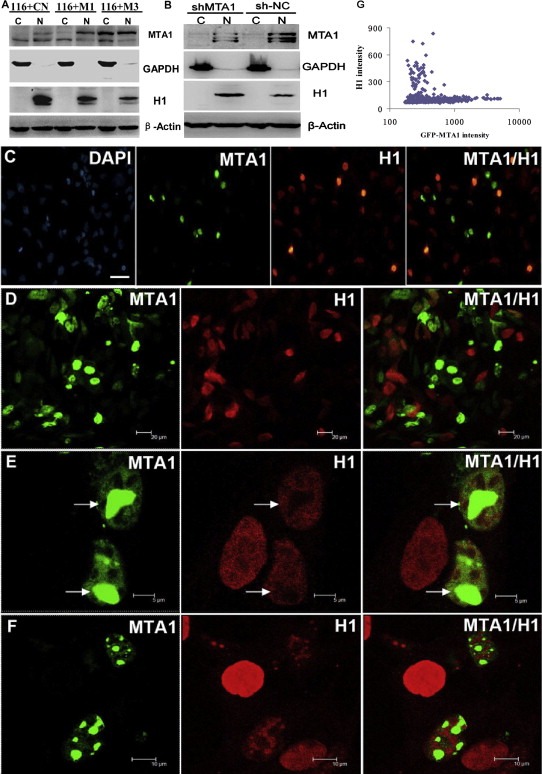
Enforced MTA1 decreases H1‐chromatin interaction. (A) In vitro Western blot analysis showed that with the increase of nuclear MTA1, the amount of H1 binding to chromatin in the nucleus decreased accordingly (C: cytoplasmic N: nuclear) (B) H1 in the nucleus increased in MTA1 stably knocked down HCT116 sh‐MTA1 cells. (C–F) In‐vivo study of the effect of MTA1 on H1‐DNA interaction by immuno‐fluorescence. (C and D) All the nuclei with high EGFP‐MTA1 expression were diminished or depleted of H1 binding in nuclei. (E and F) In‐situ analysis of the interplay between MTA1 and H1 in a single nucleus. H1 binds much less to chromatin regions with high MTA1 binding (white arrows). (G) Quantitative presentation of MTA1 and H1 relationship using high content analysis system in the case of EGFP‐MTA1 overexpression.
Enforced pEGFP‐MTA1 expression in HEK293 cells confirmed the interplay between MTA1 and H1 on chromatin binding in‐situ. All the nuclei with high EGFP‐MTA1 expression (500 out of 500) were diminished or depleted of H1 binding compared with those with lower EGFP‐MTA1 signals (Figure 9C and D), indicating a strong capacity of MTA1 to decrease H1 binding. This rule applied to the different chromatin areas with various MTA1 binding in a single nucleus. The chromatin regions with higher EGFP‐MTA1 intensity showed an apparently decreased H1 binding compared with areas with lower GFP‐MTA1 signals (Figure 9E and F). Quantitative plot showed a negative relationship between MTA1 and H1 levels (Figure 9G). The reduced H1 was not supposed to occur at transcriptional level, in which case an overall and a homogenous reduction of H1 but not a mosaic reduction negatively complementary to MTA1 distribution on chromatin will be observed. Moreover, from the gene expression profiling data, no obvious change in total H1 at mRNA level was observed after high MTA1 overexpression. This line of evidence confirms that MTA1 binding to chromatin leads to the release of H1 from the same part of chromatin, causing chromatin decondensation.
3.10. Dual effects of MTA1 on gene transcription
The dynamic high‐order chromatin regulation plays a critical role in all DNA‐dependent processes, such as DNA replication, transcription, recombination and damage repair. MTA1 enrichment on chromatin leads to a marked decondensation state, which facilitates the access of transcriptional factors and RNA polymerases to DNA, hence the gene expression regulation. Therefore, it is of great interest to determine how the MTA1‐induced chromatin structure alteration affects genome‐wide transcription. To address this issue, we performed DNA microarray assays to screen the differentially expressed (DE) gene signature in MTA1‐overexpressing HCT116 cells in comparison with control cells. NimbleGen 12 × 135 K arrays that cover 45033 genes were used and 24399 genes were expressed in both samples beyond the cutoff value. A specific gene set was found to be differentially expressed by MTA1 overexpression 3030 genes (12.42%) at a threshold of >1.5 fold, and 663 (2.72%) at the threshold of >2.0 fold. Contrary to the generally reported transcriptionally repressing effect of MTA1, we found that MTA1 exerted both activation and repression of gene transcription (Figure 10A and B). The data yielded 1760/342 up‐regulated and 1270/321 down‐regulated genes when taking 1.5/2.0 as the thresholds. When subjected to GO analysis of Biological Processes, the up‐regulated genes showed an enrichment on items focusing on RNA polymerase II promoter‐driven transcription (Figure 10C), indicating that MTA1 may promote RNA polymerase II to bind to the promoters of these genes, hence changing their transcriptional status. We also confirmed an enrichment of ‘regulation of transcription from RNA polymerase II promoter’ in down‐regulated genes in MTA1 knock‐down HCT116 cells compared to control cells (data not shown), supporting that MTA1 is closely involved in polymerase II‐mediated DNA transcription. Our findings provide further evidence supporting the previous reports that MTA1 may cooperate with polymerase II to promote multiple genes transcription (Balasenthil et al., 2007; Gururaj et al., 2006; Pakala et al., 2011).
Figure 10.
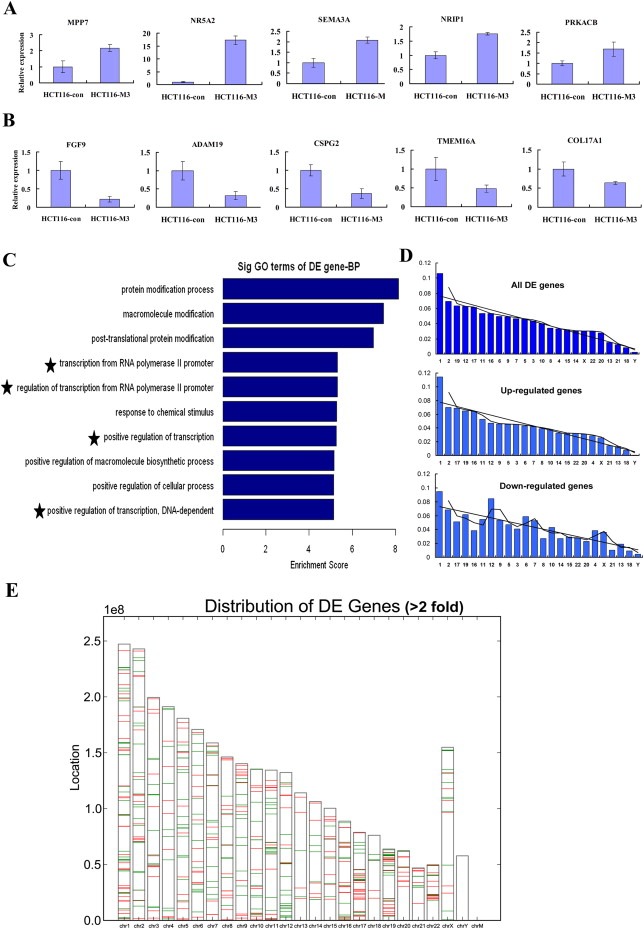
Role of MTA1 on transcriptional regulation. (A) Quantitative PCR results showing some of the genes activiated by MTA1 overexpression. (B) Quantitative PCR results showing some of the genes repressed by MTA1 overexpression. (C) GO analysis result showing that the up‐regulated genes were enriched in items focusing on RNA polymerase II promoter‐driven transcription (indicated by the five‐star symbols). (D) Chromosome distribution analysis of DE genes. MTA1 showed a high regulational preference for specific chromosomes, such as 1, 2, 19, 12, 17. When analyzed separately, the up‐regulated genes and down‐regulated genes showed a similar distributional pattern. (E) The up‐regulated genes (red) distributed in clusters with the down‐regulated genes (green) at many chromosome loci.
To show a possible chromosomal preference of MTA1 on gene transcription, we spotted the up‐regulated and down‐regulated genes above 1.5/2.0 fold change onto the chromosomes. It was interesting to find that MTA1 showed a high regulational preference for specific chromosomes, such as 1, 2, 19, 12, 17 11 and 16, which totally covered nearly half of the DE genes. However, only less than 4% of the DE genes distributed to chromosomes 20, 13, 21, 18 and Y (Table 1, Figure 10D). When analyzed separately, the up‐regulated and down‐regulated genes showed a similar distributional pattern, both with the highest preference for chromosomes 1, 2, 19 and the lowest for chromosomes 21, 13, 18 and Y (Table 1, Figure 10D). When the DE genes were mapped onto chromosomes with a high resolution, many of the up‐regulated genes distributed in clusters with the down‐regulated genes at certain loci (Figure 10E). These findings indicated that MTA1 could promote and coordinate both transcription activation and repression of genes at the same chromosomal locus.
Table 1.
Chromosomal distribution pattern of the DE genes (>1.5 fold).
| Chromosome number | Number of DE genes | Percentage of Differentially Expressed (DE) genes (%) |
|---|---|---|
| 1 | 321 | 10.60 |
| 2 | 210 | 6.94 |
| 19 | 192 | 6.34 |
| 12 | 190 | 6.27 |
| 17 | 186 | 6.14 |
| 11 | 162 | 5.35 |
| 16 | 162 | 5.35 |
| 6 | 150 | 4.95 |
| 9 | 149 | 4.92 |
| 7 | 141 | 4.66 |
| 5 | 140 | 4.62 |
| 3 | 132 | 4.36 |
| 10 | 122 | 4.03 |
| 8 | 103 | 3.40 |
| 4 | 100 | 3.30 |
| 15 | 94 | 3.10 |
| 14 | 92 | 3.04 |
| X | 91 | 3.01 |
| 22 | 92 | 3.04 |
| 20 | 84 | 2.77 |
| 13 | 47 | 1.55 |
| 21 | 38 | 1.25 |
| 18 | 25 | 0.83 |
| Y | 7 | 0.23 |
| Total | 3030 | 100.00 |
4. Discussion
4.1. In‐vivo visualization revealed a dynamic regulation of chromatin higher‐order structure by MTA1
Research on MTA1 has been focused mainly on cancerous behaviors. MTA1 promotes a series of malignant properties in cancers such as invasion and metastasis, proliferation, chemoresistance and angiogenesis (Toh and Nicolson, 2009). Though its role in basic cell biology besides malignancy has been proposed (Li et al., 2007, 2009, 2007, 2008, 2007, 2003, 1999, 2009, 2009, 2001), the potential fundamental role and underlying mechanisms of MTA1 in the basic biological processes remain unknown. Revealing the biological function of MTA1 may help clarify its contribution to cancer development.
In this study, the alteration of chromatin higher‐order structure was visualized in‐situ by DAPI staining, which is a reliable tool to track chromatin morphology. Both exogenous and endogenous MTA1 were evaluated in‐vivo for their role in chromatin higher‐order structure regulation. By in‐situ analysis, we found a decondensing function of MTA1 on both interphase chromatin and mitotic chromosome transitions during the cell cycle. As a clue and starting point, we found that increased binding of MTA1 to chromatin was accompanied by more relaxed chromatin structure. Further, we discovered that the dynamic MTA1‐nucleosome interaction and localization contributed to chromatin/chromosome transitions during the cell cycle.
Till now, the mechanisms of higher‐order chromatin structure regulation are poorly understood. Studies on higher‐order chromatin structure regulation is hard to carry out due to the lack of satisfying models. Inaccurate imitations in vitro usually lead to inconsistent and even contradictory conclusions (Maresca et al., 2005; Ohsumi et al., 1993). Most studies on chromatin structure regulation are conducted in in vitro models that barely reproduce the physiological processes, especially for the chromatin structure transitions during cell cycle progression. In‐vivo models take advantages of demonstrating in real time the biological processes.
The MTA1 protein comprises three nuclear localization domains and multiple DNA‐binding motifs. It was thought to mainly localize in the nucleus (Nicolson et al., 2003). Recent advances reported that MTA1 associates dynamically with nucleosomes and nucleosome remodeling complexes (Nair et al., 2013). MTA1 also possesses obvious cytoplasmic distribution (Liu et al., 2014). Here, we showed that the binding of MTA1 to chromatin is dynamic and reversible during the cell cycle. MTA1 gradually disassociates from chromatin and is translocated to the cytoplasm in prophase and then re‐enters the nucleus in telophase. The dynamic nature of MTA1‐chromatin interaction endowed a potential for MTA1 to regulate high‐order chromatin structure and all downstream DNA structure‐dependent activities. The cell‐cycle‐dependent dynamic distribution of MTA1 demonstrated here has not been reported elsewhere. It starts a new subfield of MTA1 research, and provides new insights on chromatin structure regulation mechanism.
Chromatin structure modulation is one of the biological bases for most cellular activities, such as embryogenesis, pluoripotency maintenance, differentiation and aging (Ahmed et al., 2010; Bhattacharya et al., 2009; Campisi, 2000; Gaspar‐Maia et al., 2011; Mattout and Meshorer, 2010; Meshorer and Misteli, 2006). Our findings may provide new clues for MTA1 in aforementioned physiological processes. There is a more open chromatin structure in cancer cells (Gaspar‐Maia et al., 2011). Whether MTA1‐regulated chromatin structure alteration contributes to cancer development deserves further exploration.
4.2. H1, the major modulator of chromatin structure is involved in MTA1‐induced chromatin state modulation
Histone H1 is well characterized in stabilizing higher‐order chromatin structure through interaction with nucleosomes. It regulates the formation and stabilization of the 30 nm chromatin fiber, which is speculated as the primary higher‐order structure. The 30 nm fiber hierarchically forms the interphase chromatin and then more compact mitotic chromosome. Evidences have demonstrated that recruitment of H1 to nucleosomes stabilizes the compacted high‐order chromatin structure (Bustin et al., 2005; Catez et al., 2006), while loss of H1 causes a chromosome decondensation (Maresca et al., 2005; Maresca and Heald, 2006; Shen et al., 1995). Modulation of H1‐chromatin interaction is considered as one of the earliest events leading directly to chromatin structure and activity alteration (Catez et al., 2006).
It is proven that H1 binds less tightly to DNA in chromatin than core nucleosomal histones such as H2A, H2B, H3 and H4. H1 binds dynamically and exchanges continuously among binding sites of both interphase chromatin and mitotic chromosomes in living cells (Lever et al., 2000; Misteli et al., 2000). The dynamic binding property of H1 is generally modulated by posttranslational modifications of H1 or by nuclear proteins that continuously compete with H1 for chromatin binding sites (Bustin et al., 2005). Our data suggested a critical role for MTA1 in modulating H1‐chromatin interaction during the cell cycle. The underlying mechanism seems not to be due to modifications of H1, although MTA1 is indeed involved in modification (such as deacetylation) of many proteins, because no physical interaction was detected between MTA1 and H1 (Figure 5A); competition for overlapped chromatin‐binding sites by a wide range of DNA‐interacting proteins were reported to be a major mechanism regulating both site‐specific and non‐site‐specific H1‐chromatin interaction (Bustin et al., 2005; Catez et al., 2006). The HMG superfamily is one of the well studied non‐site‐specific competitors for H1 to decrease chromatin compaction. HMG proteins are highly mobile molecules that compete with H1 and impair H1‐chromatin interaction in a dose‐dependent fashion, which is a characterized feature of molecular competition (Catez et al., 2004; Gerlitz et al., 2009; Rochman et al., 2010). Similarly, MTA1 is also mobile in nucleosome binding. Over‐binding of MTA1 to chromatin also causes a weakened interaction of H1‐chromatin in a dose‐dependent manner. Moreover, combined with the seemingly complementary distribution pattern of MTA1 and H1 during the cell cycle, we suggest a possible competition mechanism between MTA1 and H1 for chromatin binding.
4.3. MTA1 dually regulates transcription as a consequence of chromatin structure modulation
MTA1 has been reported to be an integral component of the NuRD complex through which it is primarily considered to be involved in transcriptional gene repression (Toh and Nicolson, 2009). However, recent studies have indicated that MTA1 also acts to activate the transcription of genes such as Pax5 (Balasenthil et al., 2007), BCAS3 (Gururaj et al., 2006), FosB (Pakala et al., 2011) and STAT3 (Pakala et al., 2013) through MTA1/Pol II rather than NuRD, with the detailed mechanisms remaining elusive. Recent advances also reported that MTA1 associates with both the corepressor and coactivator complexes (Nair et al., 2013).
The gene expression profiling in the present study revealed a dual regulation of transcription by MTA1. Moreover, there were three new points to mention. First, MTA1‐induced transcription activation of a group of genes, even outnumbering those that underwent transcription repression, These findings relativize the notion that MTA1 functions mainly to suppress gene transcription. Secondly, though a global decondensation of chromatin was observed after MTA1 overexpression, it caused transcriptional changes in only a small proportion of genes. This functional model is consistent with recent reports that H1 deletion causes a global decondensation but affects the expression of only a small number of genes (Alami et al., 2003; Fan et al., 2005; Shen and Gorovsky, 1996). Thirdly, the localization of the altered genes on chromosomes was highly preferential for both up‐regulated and down‐regulated genes. Nearly half of the differentially expressed genes were mapped onto chromosomes 1, 2, 19, 12, 17, 11 and 16, while only about 4% of the differentially expressed genes distributed to chromosomes 20, 13, 21, 18 and Y. Both up‐regulated and down‐regulated gene localization showed chromosome preference, with the highest number on chromosome 1 and lowest on chromosome Y. Moreover, many of the up‐regulated genes distributed in clusters with the down‐regulated genes, indicating that the MTA1‐regulated gene transcription is highly selective and causes both activation and repression on the same region of chromatin.
The fact that activated and repressed gene expression occurred on the chromosomes with a parallel preferential tendency indicates a quite subtle regulation by MTA1 of gene expression. How MTA1 coordinates the two opposite effects in gene regulation (activation and repression of genes) is the center of questions (Li et al., 2012). Though here we did not focus on answering this question, the new findings on the fundamental role of MTA1 in chromatin higher‐order structure decondensation provide a clue for a possible explanation. As a first consequence of MTA1 binding, decondensed chromatin structure is one of the necessary steps in favor of gene transcription by facilitating accessibility of transcription activators and RNA polymerases, which enhances gene expression. On the other hand, opened chromatin structure and MTA1 binding also meet the prerequisite to recruit the transcriptional corepressors of MTA1, such as HDACs (Figure 5E and F), through physical interaction. The recruitment of MTA1's corepressors works to repress the transcription of specific genes. Based on this inference, we speculate that the role of MTA1 in regulating higher‐order chromatin structure may be an event upstream of NuRD assembly, which plays repressive roles in gene transcription.
Funding
This work was financially supported by grants from National ‘‘973’’ Project (no. 2009CB521807, 2015CB553904), the National Natural Science Foundation of China (Surface project, no. 81071773, 81372158, 81372159), the National Natural Science Foundation of China (Youth fund projects, no. 81101518) and the Basic Scientific Research Funds from Peking Union Medical College (JK2010B27 and 2012JKB13).
Competing interests
The authors have declared that no competing interests exist.
Supporting information
Figure S1. The up‐regulated genes distributed in clusters with the down‐regulated genes. Red: up‐regulated genes; Green: down‐regulated genes.
Supplementary data 1.
1.1.
Supplementary data related to this article can be found at http://dx.doi.org/10.1016/j.molonc.2014.08.007.
Liu Jian, Wang Haijuan, Ma Fei, Xu Dongkui, Chang Yanan, Zhang Jinlong, Wang Jia, Zhao Mei, Lin Chen, Huang Changzhi, Qian Haili, Zhan Qimin, (2015), MTA1 regulates higher‐order chromatin structure and histone H1‐chromatin interaction in‐vivo, Molecular Oncology, 9, doi: 10.1016/j.molonc.2014.08.007.
Contributor Information
Changzhi Huang, Email: huang8849@126.com.
Haili Qian, Email: qianhaili001@163.com.
Qimin Zhan, Email: qiminzhan@163.com.
References
- Ahmed, K. , Dehghani, H. , Rugg-Gunn, P. , Fussner, E. , Rossant, J. , Bazett-Jones, D.P. , 2010. Global chromatin architecture reflects pluripotency and lineage commitment in the early mouse embryo. PLoS One. 5, e10531 [DOI] [PMC free article] [PubMed] [Google Scholar]
- Ahringer, J. , 2000. NuRD and SIN3 histone deacetylase complexes in development. Trends Genet.. 16, 351–356. [DOI] [PubMed] [Google Scholar]
- Alami, R. , Fan, Y. , Pack, S. , Sonbuchner, T.M. , Besse, A. , Lin, Q. , Greally, J.M. , Skoultchi, A.I. , Bouhassira, E.E. , 2003. Mammalian linker-histone subtypes differentially affect gene expression in vivo. Proc. Natl. Acad. Sci. U S A. 100, 5920–5925. [DOI] [PMC free article] [PubMed] [Google Scholar]
- Allan, J. , Hartman, P.G. , Crane-Robinson, C. , Aviles, F.X. , 1980. The structure of histone H1 and its location in chromatin. Nature. 288, 675–679. [DOI] [PubMed] [Google Scholar]
- Balasenthil, S. , Gururaj, A.E. , Talukder, A.H. , Bagheri-Yarmand, R. , Arrington, T. , Haas, B.J. , Braisted, J.C. , Kim, I. , Lee, N.H. , Kumar, R. , 2007. Identification of Pax5 as a target of MTA1 in B-cell lymphomas. Cancer Res.. 67, 7132–7138. [DOI] [PubMed] [Google Scholar]
- Bates, D.L. , Butler, P.J. , Pearson, E.C. , Thomas, J.O. , 1981. Stability of the higher-order structure of chicken-erythrocyte chromatin in solution. Eur. J. Biochem.. 119, 469–476. [DOI] [PubMed] [Google Scholar]
- Bednar, J. , Horowitz, R.A. , Grigoryev, S.A. , Carruthers, L.M. , Hansen, J.C. , Koster, A.J. , Woodcock, C.L. , 1998. Nucleosomes, linker DNA, and linker histone form a unique structural motif that directs the higher-order folding and compaction of chromatin. Proc. Natl. Acad. Sci. U S A. 95, 14173–14178. [DOI] [PMC free article] [PubMed] [Google Scholar]
- Bhattacharya, D. , Talwar, S. , Mazumder, A. , Shivashankar, G.V. , 2009. Spatio-temporal plasticity in chromatin organization in mouse cell differentiation and during Drosophila embryogenesis. Biophys. J.. 96, 3832–3839. [DOI] [PMC free article] [PubMed] [Google Scholar]
- Boukamp, P. , Petrussevska, R.T. , Breitkreutz, D. , Hornung, J. , Markham, A. , Fusenig, N.E. , 1988. Normal keratinization in a spontaneously immortalized aneuploid human keratinocyte cell line. J. Cell Biol.. 106, 761–771. [DOI] [PMC free article] [PubMed] [Google Scholar]
- Bustin, M. , Catez, F. , Lim, J.H. , 2005. The dynamics of histone H1 function in chromatin. Mol. Cell. 17, 617–620. [DOI] [PubMed] [Google Scholar]
- Campisi, J. , 2000. Aging, chromatin, and food restriction–connecting the dots. Science. 289, 2062–2063. [DOI] [PubMed] [Google Scholar]
- Carruthers, L.M. , Bednar, J. , Woodcock, C.L. , Hansen, J.C. , 1998. Linker histones stabilize the intrinsic salt-dependent folding of nucleosomal arrays: mechanistic ramifications for higher-order chromatin folding. Biochemistry. 37, 14776–14787. [DOI] [PubMed] [Google Scholar]
- Catez, F. , Ueda, T. , Bustin, M. , 2006. Determinants of histone H1 mobility and chromatin binding in living cells. Nat. Struct. Mol. Biol.. 13, 305–310. [DOI] [PMC free article] [PubMed] [Google Scholar]
- Catez, F. , Yang, H. , Tracey, K.J. , Reeves, R. , Misteli, T. , Bustin, M. , 2004. Network of dynamic interactions between histone H1 and high-mobility-group proteins in chromatin. Mol. Cell Biol.. 24, 4321–4328. [DOI] [PMC free article] [PubMed] [Google Scholar]
- Fan, Y. , Nikitina, T. , Morin-Kensicki, E.M. , Zhao, J. , Magnuson, T.R. , Woodcock, C.L. , Skoultchi, A.I. , 2003. H1 linker histones are essential for mouse development and affect nucleosome spacing in vivo. Mol. Cell Biol.. 23, 4559–4572. [DOI] [PMC free article] [PubMed] [Google Scholar]
- Fan, Y. , Nikitina, T. , Zhao, J. , Fleury, T.J. , Bhattacharyya, R. , Bouhassira, E.E. , Stein, A. , Woodcock, C.L. , Skoultchi, A.I. , 2005. Histone H1 depletion in mammals alters global chromatin structure but causes specific changes in gene regulation. Cell. 123, 1199–1212. [DOI] [PubMed] [Google Scholar]
- Gaspar-Maia, A. , Alajem, A. , Meshorer, E. , Ramalho-Santos, M. , 2011. Open chromatin in pluripotency and reprogramming. Nat. Rev. Mol. Cell Biol.. 12, 36–47. [DOI] [PMC free article] [PubMed] [Google Scholar]
- Gerlitz, G. , Hock, R. , Ueda, T. , Bustin, M. , 2009. The dynamics of HMG protein-chromatin interactions in living cells. Biochem. Cell Biol.. 87, 127–137. [DOI] [PMC free article] [PubMed] [Google Scholar]
- Gururaj, A.E. , Singh, R.R. , Rayala, S.K. , Holm, C. , den Hollander, P. , Zhang, H. , Balasenthil, S. , Talukder, A.H. , Landberg, G. , Kumar, R. , 2006. MTA1, a transcriptional activator of breast cancer amplified sequence 3. Proc. Natl. Acad. Sci. U S A. 103, 6670–6675. [DOI] [PMC free article] [PubMed] [Google Scholar]
- Hamiche, A. , Schultz, P. , Ramakrishnan, V. , Oudet, P. , Prunell, A. , 1996. Linker histone-dependent DNA structure in linear mononucleosomes. J. Mol. Biol.. 257, 30–42. [DOI] [PubMed] [Google Scholar]
- Hizume, K. , Yoshimura, S.H. , Takeyasu, K. , 2005. Linker histone H1 per se can induce three-dimensional folding of chromatin fiber. Biochemistry. 44, 12978–12989. [DOI] [PubMed] [Google Scholar]
- Horn, P.J. , Peterson, C.L. , 2002. Molecular biology. Chromatin higher order folding–wrapping up transcription. Science. 297, 1824–1827. [DOI] [PubMed] [Google Scholar]
- Kapuscinski, J. , 1995. DAPI: a DNA-specific fluorescent probe. Biotech. Histochem.. 70, 220–233. [DOI] [PubMed] [Google Scholar]
- Kodiha, M. , Banski, P. , Stochaj, U. , 2011. Computer-based fluorescence quantification: a novel approach to study nucleolar biology. BMC Cell Biol.. 12, 25 [DOI] [PMC free article] [PubMed] [Google Scholar]
- Lever, M.A. , Th'ng, J.P. , Sun, X. , Hendzel, M.J. , 2000. Rapid exchange of histone H1.1 on chromatin in living human cells. Nature. 408, 873–876. [DOI] [PubMed] [Google Scholar]
- Li, D.Q. , Pakala, S.B. , Nair, S.S. , Eswaran, J. , Kumar, R. , 2012. Metastasis-associated protein 1/nucleosome remodeling and histone deacetylase complex in cancer. Cancer Res.. 72, 387–394. [DOI] [PMC free article] [PubMed] [Google Scholar]
- Li, W. , Liu, X.P. , Xu, R.J. , Zhang, Y.Q. , 2007. Immunolocalization assessment of metastasis-associated protein 1 in human and mouse mature testes and its association with spermatogenesis. Asian J. Androl.. 9, 345–352. [DOI] [PubMed] [Google Scholar]
- Li, W. , Ma, L. , Zhao, J. , Liu, X. , Li, Z. , Zhang, Y. , 2009. Expression profile of MTA1 in adult mouse tissues. Tissue Cell. 41, 390–399. [DOI] [PubMed] [Google Scholar]
- Li, W. , Zhang, J. , Liu, X. , Xu, R. , Zhang, Y. , 2007. Correlation of appearance of metastasis-associated protein1 (Mta1) with spermatogenesis in developing mouse testis. Cell Tissue Res.. 329, 351–362. [DOI] [PubMed] [Google Scholar]
- Li, W. , Zhu, H. , Bao, W. , Fu, H. , Li, Z. , Liu, X. , Xu, R. , Zhao, J. , Zhang, Y. , 2008. Involvement of metastasis tumor antigen 1 in hepatic regeneration and proliferation. Cell Physiol. Biochem.. 22, 315–326. [DOI] [PubMed] [Google Scholar]
- Liu, J. , Xu, D. , Wang, H. , Zhang, Y. , Chang, Y. , Zhang, J. , Wang, J. , Li, C. , Liu, H. , Zhao, M. , Lin, C. , Zhan, Q. , Huang, C. , Qian, H. , 2014. The subcellular distribution and function of MTA1 in cancer differentiation. Oncotarget. 5, 5153–5164. [DOI] [PMC free article] [PubMed] [Google Scholar]
- Luger, K. , Mader, A.W. , Richmond, R.K. , Sargent, D.F. , Richmond, T.J. , 1997. Crystal structure of the nucleosome core particle at 2.8 A resolution. Nature. 389, 251–260. [DOI] [PubMed] [Google Scholar]
- Manavathi, B. , Kumar, R. , 2007. Metastasis tumor antigens, an emerging family of multifaceted master coregulators. J. Biol. Chem.. 282, 1529–1533. [DOI] [PubMed] [Google Scholar]
- Manavathi, B. , Singh, K. , Kumar, R. , 2007. MTA family of coregulators in nuclear receptor biology and pathology. Nucl. Recept. Signal.. 5, e010 [DOI] [PMC free article] [PubMed] [Google Scholar]
- Maresca, T.J. , Freedman, B.S. , Heald, R. , 2005. Histone H1 is essential for mitotic chromosome architecture and segregation in Xenopus laevis egg extracts. J. Cell Biol.. 169, 859–869. [DOI] [PMC free article] [PubMed] [Google Scholar]
- Maresca, T.J. , Heald, R. , 2006. The long and the short of it: linker histone H1 is required for metaphase chromosome compaction. Cell Cycle. 5, 589–591. [DOI] [PubMed] [Google Scholar]
- Mattout, A. , Meshorer, E. , 2010. Chromatin plasticity and genome organization in pluripotent embryonic stem cells. Curr. Opin. Cell Biol.. 22, 334–341. [DOI] [PubMed] [Google Scholar]
- Meshorer, E. , Misteli, T. , 2006. Chromatin in pluripotent embryonic stem cells and differentiation. Nat. Rev. Mol. Cell Biol.. 7, 540–546. [DOI] [PubMed] [Google Scholar]
- Misteli, T. , Gunjan, A. , Hock, R. , Bustin, M. , Brown, D.T. , 2000. Dynamic binding of histone H1 to chromatin in living cells. Nature. 408, 877–881. [DOI] [PubMed] [Google Scholar]
- Moon, W.S. , Chang, K. , Tarnawski, A.S. , 2004. Overexpression of metastatic tumor antigen 1 in hepatocellular carcinoma: relationship to vascular invasion and estrogen receptor-alpha. Hum. Pathol.. 35, 424–429. [DOI] [PubMed] [Google Scholar]
- Nair, S.S. , Li, D.Q. , Kumar, R. , 2013. A core chromatin remodeling factor instructs global chromatin signaling through multivalent reading of nucleosome codes. Mol. Cell. 49, 704–718. [DOI] [PMC free article] [PubMed] [Google Scholar]
- Nawa, A. , Nishimori, K. , Lin, P. , Maki, Y. , Moue, K. , Sawada, H. , Toh, Y. , Fumitaka, K. , Nicolson, G.L. , 2000. Tumor metastasis-associated human MTA1 gene: its deduced protein sequence, localization, and association with breast cancer cell proliferation using antisense phosphorothioate oligonucleotides. J. Cell Biochem.. 79, 202–212. [PubMed] [Google Scholar]
- Nicolson, G.L. , Nawa, A. , Toh, Y. , Taniguchi, S. , Nishimori, K. , Moustafa, A. , 2003. Tumor metastasis-associated human MTA1 gene and its MTA1 protein product: role in epithelial cancer cell invasion, proliferation and nuclear regulation. Clin. Exp. Metastasis. 20, 19–24. [DOI] [PubMed] [Google Scholar]
- Nishida, M. , 2002. The Ishikawa cells from birth to the present. Hum. Cell. 15, 104–117. [DOI] [PubMed] [Google Scholar]
- Ohsumi, K. , Katagiri, C. , Kishimoto, T. , 1993. Chromosome condensation in Xenopus mitotic extracts without histone H1. Science. 262, 2033–2035. [DOI] [PubMed] [Google Scholar]
- Pakala, S.B. , Rayala, S.K. , Wang, R.A. , Ohshiro, K. , Mudvari, P. , Reddy, S.D. , Zheng, Y. , Pires, R. , Casimiro, S. , Pillai, M.R. , Costa, L. , Kumar, R. , 2013. MTA1 promotes STAT3 transcription and pulmonary metastasis in breast cancer. Cancer Res.. 73, 3761–3770. [DOI] [PMC free article] [PubMed] [Google Scholar]
- Pakala, S.B. , Singh, K. , Reddy, S.D. , Ohshiro, K. , Li, D.Q. , Mishra, L. , Kumar, R. , 2011. TGF-beta1 signaling targets metastasis-associated protein 1, a new effector in epithelial cells. Oncogene. 30, 2230–2241. [DOI] [PMC free article] [PubMed] [Google Scholar]
- Pearson, E.C. , Bates, D.L. , Prospero, T.D. , Thomas, J.O. , 1984. Neuronal nuclei and glial nuclei from mammalian cerebral cortex. Nucleosome repeat lengths, DNA contents and H1 contents. Eur. J. Biochem.. 144, 353–360. [DOI] [PubMed] [Google Scholar]
- Pennings, S. , Meersseman, G. , Bradbury, E.M. , 1994. Linker histones H1 and H5 prevent the mobility of positioned nucleosomes. Proc. Natl. Acad. Sci. U S A. 91, 10275–10279. [DOI] [PMC free article] [PubMed] [Google Scholar]
- Rochman, M. , Malicet, C. , Bustin, M. , 2010. HMGN5/NSBP1: a new member of the HMGN protein family that affects chromatin structure and function. Biochim. Biophys. Acta. 1799, 86–92. [DOI] [PMC free article] [PubMed] [Google Scholar]
- Routh, A. , Sandin, S. , Rhodes, D. , 2008. Nucleosome repeat length and linker histone stoichiometry determine chromatin fiber structure. Proc. Natl. Acad. Sci. U S A. 105, 8872–8877. [DOI] [PMC free article] [PubMed] [Google Scholar]
- Shen, X. , Gorovsky, M.A. , 1996. Linker histone H1 regulates specific gene expression but not global transcription in vivo. Cell. 86, 475–483. [DOI] [PubMed] [Google Scholar]
- Shen, X. , Yu, L. , Weir, J.W. , Gorovsky, M.A. , 1995. Linker histones are not essential and affect chromatin condensation in vivo. Cell. 82, 47–56. [DOI] [PubMed] [Google Scholar]
- Solari, F. , Bateman, A. , Ahringer, J. , 1999. The Caenorhabditis elegans genes egl-27 and egr-1 are similar to MTA1, a member of a chromatin regulatory complex, and are redundantly required for embryonic patterning. Development. 126, 2483–2494. [DOI] [PubMed] [Google Scholar]
- Stoldt, S. , Wenzel, D. , Schulze, E. , Doenecke, D. , Happel, N. , 2007. G1 phase-dependent nucleolar accumulation of human histone H1x. Biol. Cell. 99, 541–552. [DOI] [PubMed] [Google Scholar]
- Thakur, M.K. , Ghosh, S. , 2009. Interaction of estrogen receptor alpha transactivation domain with MTA1 decreases in old mouse brain. J. Mol. Neurosci.. 37, 269–273. [DOI] [PubMed] [Google Scholar]
- Thoma, F. , Koller, T. , 1977. Influence of histone H1 on chromatin structure. Cell. 12, 101–107. [DOI] [PubMed] [Google Scholar]
- Thoma, F. , Koller, T. , Klug, A. , 1979. Involvement of histone H1 in the organization of the nucleosome and of the salt-dependent superstructures of chromatin. J. Cell Biol.. 83, 403–427. [DOI] [PMC free article] [PubMed] [Google Scholar]
- Toh, Y. , Nicolson, G.L. , 2009. The role of the MTA family and their encoded proteins in human cancers: molecular functions and clinical implications. Clin. Exp. Metastasis. 26, 215–227. [DOI] [PubMed] [Google Scholar]
- Travers, A. , 1999. The location of the linker histone on the nucleosome. Trends Biochem. Sci.. 24, 4–7. [DOI] [PubMed] [Google Scholar]
- Tremethick, D.J. , 2007. Higher-order structures of chromatin: the elusive 30 nm fiber. Cell. 128, 651–654. [DOI] [PubMed] [Google Scholar]
- Varga-Weisz, P.D. , Becker, P.B. , 2006. Regulation of higher-order chromatin structures by nucleosome-remodelling factors. Curr. Opin. Genet. Dev.. 16, 151–156. [DOI] [PubMed] [Google Scholar]
- Wang, H.B. , Zhang, Y. , 2001. Mi2, an auto-antigen for dermatomyositis, is an ATP-dependent nucleosome remodeling factor. Nucleic Acids Res.. 29, 2517–2521. [DOI] [PMC free article] [PubMed] [Google Scholar]
- Woodcock, C.L. , Skoultchi, A.I. , Fan, Y. , 2006. Role of linker histone in chromatin structure and function: H1 stoichiometry and nucleosome repeat length. Chromosome Res.. 14, 17–25. [DOI] [PubMed] [Google Scholar]
- Wyrick, B.J. , Ozawa, T. , Lamborn, K.R. , Bollen, A.W. , Deen, D.F. , 1997. Effects of Matrigel on the SF-767 malignant glioma athymic mouse tumor model. Anticancer Res.. 17, 2419–2425. [PubMed] [Google Scholar]
- Xue, Y. , Wong, J. , Moreno, G.T. , Young, M.K. , Cote, J. , Wang, W. , 1998. NURD, a novel complex with both ATP-dependent chromatin-remodeling and histone deacetylase activities. Mol. Cell. 2, 851–861. [DOI] [PubMed] [Google Scholar]
Associated Data
This section collects any data citations, data availability statements, or supplementary materials included in this article.
Supplementary Materials
Figure S1. The up‐regulated genes distributed in clusters with the down‐regulated genes. Red: up‐regulated genes; Green: down‐regulated genes.