

Abstract
Compelling evidences indicate that relative telomere length (RTL) in peripheral blood leukocytes (PBLs) can predict the clinical outcome of several cancers. However, to date, the prognostic value of leukocyte RTL in gastric cancer (GC) patients has not been explored. In this study, relative telomere length (RTL) in peripheral blood leukocytes (PBLs) was measured using a real‐time PCR‐based method in a total of 693 GC patients receiving surgical resection. The prognostic value of leukocyte RTL was first explored in the training set (112 patients) using Kaplan–Meier and Cox proportional hazards regression analyses. Then an independent cohort of 581 patients was used as a validation set. To explore potential mechanism, we detected the immunophenotypes of peripheral blood mononuclear cells and plasma concentrations of several cytokines in GC patients. Patients with short RTL showed significantly worse overall survival (OS) and relapse‐free survival (RFS) than those with long RTL in all patient sets. Furthermore, leukocyte RTL and TNM stage exhibited a notable joint effect in prognosis prediction. Integration of TNM stage and leukocyte RTL significantly improved the prognosis prediction efficacy for GC. In addition, we found that patients with short RTL had a higher CD4+ T cell percentage in PBMCs, CD19+IL‐10+ Breg percentage in B cells and plasma IL‐10 concentration, indicating an enhanced immunosuppressive status with short leukocyte RTL. In conclusion, our study for the first time demonstrates that leukocyte RTL is an independent prognostic marker complementing TNM stage and associated with an immunosuppressive phenotype in the peripheral blood lymphocytes in GC patients.
Keywords: Leukocyte telomere length, Gastric cancer, Prognosis, Regulatory B lymphocyte
Highlights
Short leukocyte RTL independently contributes to worse prognosis in GC patients.
Leukocyte RTL can improved the prognosis prediction efficacy of TNM stage for GC.
Short leukocyte RTL indicates an immunosuppressive phenotype of GC patients.
1. Introduction
Gastric cancer (GC) is a life‐threatening malignant tumor in humans, and has the fourth highest incidence among all malignant tumors. Nearly 1 million people are diagnosed with GC every year worldwide, among which, 70% are in developing countries and more than half in East Asia, especially China (Jemal et al., 2011). In China, the incidence of GC ranks second among all types of malignant tumors, accounting for approximately 40% of the overall mortality due to GC worldwide (Ferlay et al., 2010). Despite improvements in diagnosis, surgery, chemotherapy, and target therapy, a substantial number of GC patients develop locoregional recurrence or distant metastases, the main cause of GC‐related deaths (Amedei et al., 2011). Tumor–Node–Metastasis (TNM) staging system has been widely used to assist therapeutic decision‐making and prognosis predicting in GC patients (Edge et al., 2009). However, due to the molecular and genetic heterogeneity, GC patients with the similar clinical and pathologic features often exhibit distinct outcomes (Milne et al., 2009), indicating that TNM stage alone is not sufficient to accurately predict the clinical outcomes of GC patients. Therefore, it is urgent to explore new molecular biomarkers to complement TNM staging system for more precise prognostic prediction of GC.
Telomeres consist of a tandem TTAGG repeat located at ends of linear chromosomes of eukaryote cells that often decrease in length over time (largely due to oxidative damage and the end replication problem during cell division) and may trigger cellular senescence once telomere become critically short (von Zglinicki, 2000; Weng, 2012). While telomerase can recover telomere length, suggesting that telomere length is determined by the balance of processes that shorten and lengthen the telomere (Hug and Lingner, 2006). Previous observational studies have found shorter immune cell (e.g. lymphocyte) telomere lengths in individuals suffering from age‐related diseases, including cancer (Murnane, 2010). The critical telomere length shortening in leukocytes can reduce the immune response capacity of patients (Effros, 2011). In addition, it has been found that telomere length shortening can induce chromosome instability and further contribute to the development and progression of many malignancies (Bisoffi et al., 2006). Therefore, recent studies have focused on the role of leukocyte telomere length in the prediction of cancer risk and prognosis. Some studies have demonstrated that shorter leukocyte relative telomere length (RTL) was associated with higher risk of kidney, lung, and colorectal cancer (CRC) (Hou et al., 2012; Jang et al., 2008; Shao et al., 2007), whereas several other reports showed that longer leukocyte RTL was linked to higher risk of hepatocellular carcinoma (HCC), breast cancer and non‐Hodgkin lymphoma (NHL) (Gramatges et al., 2010; Lan et al., 2009; Liu et al., 2011). Furthermore, two studies have evaluated the association between leukocyte RTL and cancer prognosis and reported that patients with longer leukocyte RTL had worse overall survival of breast cancer (Svenson et al., 2008) and kidney cancer (Svenson et al., 2009). Our previous study has indicated that patients with shorter leukocyte RTL had a significantly poor prognosis of CRC (Chen et al., 2014). Taken together, these data suggest a potentially important role of leukocyte telomere length in the prediction of cancer risk and prognosis.
Previous studies have suggested that telomere length shortening might contribute to the development of GC (Maruyama et al., 1997). However, these studies have been focused on the measurement of the telomere length in tissues rather than the easily accessible blood sample. In a recent study, we found that short RTL was associated with an increase risk of developing GC (Liu et al., 2009). However, to date, whether leukocyte RTL can predict GC patients' prognosis has never been investigated.
In this study, to test the hypothesis that leukocyte RTL affect GC prognosis, we measured the leukocyte RTL using a real‐time PCR‐based method and assessed its prognostic value in GC patients receiving surgical resection. Furthermore, we explored the potential mechanisms underlying the association between leukocyte RTL and the survival of GC patients. To the best of our knowledge, this is the first study to investigate the prognostic and predictive significance of leukocyte RTL in GC patients.
2. Materials and methods
2.1. Study population
A total of 726 patients with GC were recruited into an ongoing molecular epidemological study at the Department of General Surgery of Tangdu and Xijing Hospital, affiliated to the Fourth Military Medical Univeristy, in Xi'an, China between January 2008 and December 2012. Patient eligibility criteria in this study were as follows: (1) histological confirmed gastric adenocarcinoma; (2) receiving surgical resection; (3) availability of complete clinical and follow‐up data; (4) no preoperative anticancer treatment; (5) no history of other malignancy; (6) no history of blood transfusion; and (7) alive at least 1 months after surgery. According to the eligibility criteria, we excluded 33 patients, including 13 patients who did not undergo surgery or only received palliative operation, 8 patients who had incomplete clinical information, and 12 patients who died within 1 month after surgery. All patients in our study population were Han Chinese. Finally, 693 patients with resected gastric adenocarcinoma were included in the present study for prognostic analysis. Among them, the 112 patients from the Xijing Hospital of Digestive Disease between January 2008 and May 2009 were used as a training set. The 581 patients from the Department of General Surgery, Tangdu Hospital between July 2008 and December 2012 were used as an independent validation set. Moreover, 30 additional GC patients from the Department of General Surgery, Tangdu Hospital were enrolled for the detection of peripheral blood mononuclear cell (PBMC) immunophenotypes and plasma cytokine concentrations.
2.2. Clinical and follow‐up data collection
Epidemiological information was collected using a standardized questionnaire by well‐trained staff interviewers, including age, sex, ethnicity, residential region, education status, and family history of cancer. Detailed clinical data were abstracted from medical records or consultation with treating physicians, including time of diagnosis, time of surgery and/or chemotherapies, time of relapse and/or death, tumor stage, differentiation, histological type, tumor site, lymph node invasiveness, and treatment protocol. Follow‐up data was obtained by trained clinical specialists through on‐site interview, telephone calling, or medical chart review. The latest follow‐up date was October 2014 and the median follow‐up duration was 42 months (range 6–82 months). The percentage of patient lost during follow‐up was 9.9%. Overall survival (OS) was defined as the time from surgery to GC‐specific death. Relapse‐free survival (RFS) was defined as the time from surgery to the date of the first recurrence or distant metastasis of GC. Patients alive at the last follow‐up were censored.
2.3. Collection, processing and preservation of specimens
Before surgery, 5 mL venous blood from each GC patient was drawn into coded sodium citrate anticoagulant tubes and were centrifuged within 30 min. Genomic DNA was extracted from 5 mL venous blood by using the E.Z.N.A. blood DNA Midi Kit, and then the genomic DNA was aliquoted and stored at −80 °C for future analysis (726 cases). For 30 additional GC patients, 5 mL venous blood was divided into two parts, of which 4 mL was used for the detection of PBMC immunophenotype and plasma cytokine concentrations and 1 mL for DNA extraction and the detection of leukocyte RTL. The study was approved by the Institutional Ethic Committee of the Fourth Military Medical University and written informed consent was obtained from all participants.
2.4. Detection of RTL by real‐time quantitative PCR
High‐quality genomic DNA was extracted from PBLs using the E.Z.N.A. Blood DNA Midi Kit (Omega Bio‐Tek, Norcross, Ga). RTL was measured by a two‐step real‐time quantitative PCR‐based method as previously described (Liu et al., 2011). Briefly, two pairs of primers were used in the two steps of relative quantification for telomere length. The primer sequences for the telomere gene were as follows: forward primer (tel‐c), 5′‐ACACTAAGGTTTGGGTTTGGGTTTGGGTTTGGGTTAGTGT‐3′; reverse primer (tel‐g), 5′‐TGTTAGGTATCCCTATCCCTATCCCTATCCCTATCCCTAACA‐3′. The single‐copy nuclear gene human globulin (HGB) was used as a housekeeping gene control and the primer pair was as follows: forward primer (HGB‐1), 5′‐GTGCACCTGACTCCTGAGGAGA‐3′; reverse primer (HGB‐2), 5′‐CCTTGATACCAACCT GCCCAG‐3′. In the first step, the ratio of telomere repeat copy number (T) to the single copy gene (HGB) copy number (S) was determined for each sample using standard curves. The derived T/S ratio was proportional to the RTL. In the second step, the T/S ratio of each sample was normalized to a calibrator DNA to standardize between different PCR runs. The calibrated T/S ratio was then used as the measurement of RTL in this study.
Gene‐specific amplification was performed in a LightCycler480 Real‐Time PCR System (Roche) with a 10 μL PCR mix containing 1 × SYBR green master mix (TaKaRa), 10 nM Tel‐g (or HGB‐1) primer, 10 nM Tel‐c (or HGB‐2) primer, and 4 ng of genomic DNA. The thermal cycling profile for telomere amplification was 1 cycle at 95 °C for 30 s, 2 cycles at 94 °C for 15 s and 49 °C for 15 s; then followed by 32 cycles of 86 °C for 15 s, 62 °C for 10 s, and 74 °C for 15 s with signal acquisition. The thermal cycling profile for human globulin amplification was at 95 °C for 30 s, followed by 35 cycles of 94 °C for 30 s, 58 °C for 30 s, and 72 °C for 50 s with signal acquisition. The same negative and positive controls, a calibrator DNA, and a sample for constructing a standard curve were included in each run. The R 2 for each standard curve was ≥0.99, with acceptable standard deviations set under 0.25 (for the Ct values). Otherwise, the test was repeated. The reproducibility of the assay was assessed by analyzing the intra‐ and inter‐assay coefficient of variation. All persons conducting this experimental procedure were blinded to the endpoint of our study.
2.5. Immunophenotype analysis of PBMCs by flow cytometry
PBMCs of GC patients were isolated from 4 mL of venous blood by density gradient centrifugation over Ficoll‐Hypaque (Amersham Pharmacia Biotech, NJ). The PBMCs were then fixed and stained with fluorescence‐conjugated antibodies against the following immune markers: CD3, CD4, CD8, CD25, FOXP3, CD19 and IL‐10. Appropriate isotype controls were included for each sample. The immunophenotype detection was performed on a FACScan flow cytometer (Becton Dickinson, Franklin Lakes, NJ).
2.6. Concentration detection of cytokines by enzyme‐linked immunoassay (ELISA)
Blood plasma from the same 30 GC patients was separated by centrifugation at 3000 × g under 4 °C. The concentrations of interleukin (IL)‐2, IL‐4, IL‐10, transforming growth factor (TGF)‐β1, tumor necrosis factor (TNF)‐α and interferon (IFN)‐γ were detected by using ELISA kits according to the manufacturer's instructions (eBioscience, San Diego, CA). All persons conducting the experimental and further analytic procedures were blinded to the endpoint data of GC patients.
2.7. Statistical analysis
Normally distributed continuous variables were expressed as mean ± SD, while abnormally distributed continuous variables were expressed as median and range. Chi‐squared test was used to examine differences of categorical variables between subgroups. Student's t‐test was used to analyze the difference of normally distributed continuous variables between two groups, while Mann–Whitney U test and Kruskal–Wallis H test were employed for the comparison of abnormally distributed continuous variables. The receiver operating characteristic (ROC) curves were used to select to a leukocyte RTL cutoff point for OS and RFS in the training set as previously described (Zlobec et al., 2007) and assessed the sensitivity and specificity of different prognostic prediction models. Kaplan–Meier survival curve was plotted and compared with a log‐rank test. Multivariate Cox proportional hazards regression model was used to calculate the hazard ratio (HR) and 95% confidence interval (CI) for the association of clinicopathological variables, and RTL on survival and relapse. All statistical analyses were performed using the IBM SPSS Statistics 19.0 software (IBM), and P < 0.05 was considered statistically significant.
3. Results
3.1. Characteristics of patient populations and distribution of leukocyte RTL
Demographic and clinical characteristics of GC patients were summarized in Supplementary Table 1. The median follow‐up time was shorter in the independent validation set (37 months ranging from 6 to 74 months) than in the training (59 months ranging from 6 to 82 months) set due to the late ending date of patient enrollment at the validation set. Thus patients in the validation set had lower rates of relapse (47.2%) and death (35.1%) than those in the training (79.5% and 67.9%, respectively) (P < 0.001). At latest follow‐up, 363 patients (89 and 274 in the training and validation group, respectively) developed relapse and 280 died (76 and 204 in the training and validation group, respectively).
We used a quantitative real‐time PCR‐based method to measure leukocyte RTL. The mean inter‐assay coefficient of variation (CV) was 7.8% (range, 4.6%–9.3%), whereas the mean intra‐assay CV was 5.3% (range, 2.1%–7.9%), indicating excellent assay reproducibility. The median value (range) of normalized RTL was 0.71 (0.30–3.64) in total samples and no significant difference was observed for RTL among training [0.73 (0.30–2.46)] and validation [0.70 (0.30–3.64)] sets (P = 0.912) (Supplementary Table 1), as well as between active follow‐up subgroup [0.71 (0.30–3.64)] and loss to follow‐up subgroup [0.74 (0.31–2.96)] (P = 0.822) (data not shown). In consistence with previous findings, RTL was negatively correlated with age in training (ρ = −0.397, P < 0.001; Supplementary Figure 1A) and validation sets (ρ = −0.167, P = 0.014; Supplementary Figure 1B), as well as in total patients (ρ = −0.199, P = 0.009; Supplementary Figure 1C).
We then explored the distributions of RTL by characteristics of GC patients. As shown in Table 1, there was no significant difference between RTL and most host characteristics such as age, sex, tumor site, TNM stage, differentiation, Lauren classification and adjuvant treatment groups (P value ranging from 0.082 to 0.766). However, leukocyte RTL was significantly shorter in patients with relapse than in those without relapse, and in patients who died than in those who were alive in the training and validation sets, as well as in the combining set (all P < 0.05).
Table 1.
Clinical characteristics of patients with GC according to the RTL in the training, validation and combining sets.
| Characteristics | Training set (n = 112) | Validation set (n = 581) | Combining set (n = 693) | ||||||
|---|---|---|---|---|---|---|---|---|---|
| Short RTL (n = 57) | Long RTL (n = 55) | P value | Short RTL (n = 326) | Long RTL (n = 255) | P value | Short RTL (n = 383) | Long RTL (n = 310) | P value | |
| Age, years | 61.67 (11.39) | 59.91 (10.32) | 0.277b | 58.15 (9.93) | 56.96 (11.04) | 0.101b | 58.57 (10.21) | 57.36 (10.93) | 0.203b |
| Sex | |||||||||
| Male | 48 (84.2) | 43 (78.2) | 257 (78.8) | 190 (74.5) | 305 (79.6) | 233 (75.2) | |||
| Female | 9 (15.8) | 12 (21.8) | 0.414a | 69 (21.2) | 65 (25.5) | 0.219a | 78 (20.4) | 77 (24.8) | 0.160a |
| Tumor site | |||||||||
| Proximal | 9 (15.8) | 14 (25.5) | 74 (22.7) | 73 (28.6) | 83 (21.6) | 87 (28.1) | |||
| Middle | 22 (35.6) | 26 (47.3) | 128 (39.3) | 103 (40.4) | 150 (39.2) | 129 (41.6) | |||
| Distal | 26 (48.6) | 15 (27.2) | 0.114a | 124 (38.0) | 79 (31.0) | 0.131a | 150 (39.2) | 94 (30.3) | 0.082a |
| TNM stage | |||||||||
| I | 14 (24.5) | 8 (14.5) | 74 (22.7) | 52 (20.4) | 88 (23.1) | 60 (19.7) | |||
| II | 21 (36.8) | 25 (45.5) | 155 (47.5) | 105 (41.2) | 176 (44.7) | 130 (43.6) | |||
| III | 20 (35.1) | 20 (36.4) | 74 (22.7) | 74 (29.0) | 94 (25.6) | 94 (28.6) | |||
| IV | 2 (3.6) | 2 (3.6) | 0.766a | 23 (7.1) | 24 (9.4) | 0.217a | 25 (6.6) | 26 (8.1) | 0.563a |
| Differentiation | |||||||||
| Well | 9 (15.8) | 10 (18.2) | 50 (15.3) | 30 (11.8) | 59 (15.4) | 40 (12.9) | |||
| Moderate | 23 (40.4) | 15 (27.3) | 129 (39.6) | 94 (36.9) | 152 (39.7) | 109 (35.2) | |||
| Poor | 25 (43.8) | 30 (54.5) | 0.340a | 147 (45.1) | 131 (51.3) | 0.249a | 172 (44.9) | 161 (51.9) | 0.179a |
| Lauren classificationd | |||||||||
| Intestinal | 23 (41.8) | 25 (47.2) | 135 (41.7) | 110 (43.7) | 158 (41.7) | 135 (44.3) | |||
| Diffuse | 32 (58.2) | 28 (52.8) | 0.471a | 189 (58.3) | 142 (56.3) | 0.593a | 221 (58.3) | 170 (55.7) | 0.487a |
| Chemotherapy | |||||||||
| No | 21 (28.1) | 23 (32.7) | 144 (41.2) | 95 (37.3) | 165 (33.1) | 118 (38.1) | |||
| Yes | 36 (71.9) | 32 (67.3) | 0.590a | 182 (58.8) | 160 (62.7) | 0.103a | 218 (56.9) | 192 (61.9) | 0.182a |
| Relapse | |||||||||
| Yes | 54 (94.7) | 35 (63.6) | 167 (51.2) | 107 (42.0) | 221 (57.7) | 142 (45.8) | |||
| No | 3 (5.3) | 20 (36.4) | <0.001c | 159 (48.8) | 148 (58.0) | 0.001c | 162 (42.3) | 168 (54.2) | <0.001c |
| Death | |||||||||
| Yes | 48 (84.2) | 28 (50.9) | 131 (40.2) | 73 (28.6) | 179 (46.7) | 101 (32.6) | |||
| No | 9 (15.8) | 27 (49.1) | <0.001c | 195 (59.8) | 182 (71.4) | 0.003c | 204 (53.3) | 209 (67.4) | <0.001c |
Notes: Data are mean (SD) or n (%), unless otherwise stated. TNM, tumor‐node‐metastasis; RTL, relative telomere length.
The P values were calculated using a Pearson Chi‐Square test.
The P values were calculated using an unpaired student's t test.
The P values were calculated using Log‐rank test.
Other classification were censored due to the small number of subjects in this subgroup.
3.2. Prognostic value of leukocyte RTL in GC patients
To predict the OS and RFS of GC patients with both best sensitivity and specificity, the optimal cutoff point of RTL value in the training set (0.75 for both OS and RFS) was determined by ROC curve and then used as a uniform cutoff point to dichotomize patients into either long or short RTL subgroups in all the subsequent analyses (Supplementary Figure 2). With the cutoff point established by ROC curve, we first explored the prognostic value of RTL in the training set using Kaplan–Meier survival analysis. As showed in Figure 1A, patients with short RTL had both poorer OS and RFS than those with long RTL (log‐rank P < 0.001 for both OS and RFS, respectively). We then examined the effects of RTL on the survival of GC patients in the independent validation set (Figure 1B). As expected, patients with short RTL in validation set also showed worse OS and RFS than those with long RTL (log‐rank P = 0.003 and 0.001 for OS and RFS, respectively). Finally, we assessed the prognostic value of RTL in the combined patient population (Figure 1C). Consistent results were obtained, indicating that patients with short RTL showed worse OS and RFS than those with long RTL (log‐rank P < 0.001 for both OS and RFS).
Figure 1.
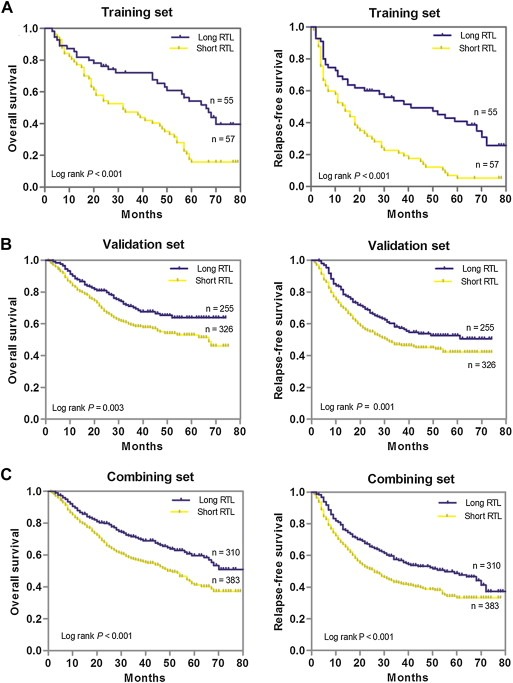
Kaplan–Meier estimation of OS and RFS of gastric cancer patients by leukocyte RTL. (A), OS and RFS in the training set; (B), OS and RFS in the validation set; (C), OS and RFS in the combination of training and validation sets.
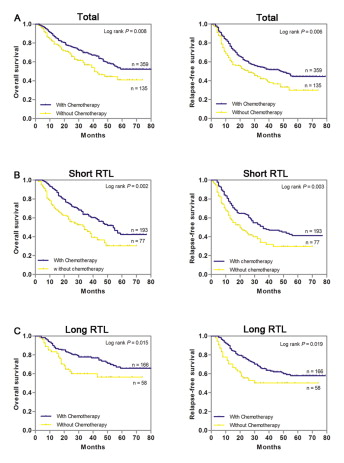
We further evaluated the associations of patients' characteristics or RTL with GC outcomes using Cox proportional hazards regression analyses. Univariate analysis showed that both OS and RFS were significantly worse in patients with higher TNM stage diseases, short RTL, poor differentiation, Lauren classification of diffuse or patients without adjuvant chemotherapy after surgery in all patient sets than corresponding control groups (all P < 0.05, Supplementary Table 2). Multivariate analysis found that TNM stage, adjuvant chemotherapy and RTL were independent prognostic factors for both OS and RFS of GC patients (Table 2). When combined the training and validation sets, the significant results were consistently observed in the multivariate analysis, showing that patients with short RTL had a 2.78‐fold (95% CI, 1.24–4.48; P = 0.003) death risk increment and a 2.64‐fold (95% CI, 1.19–4.55; P = 0.007) relapse risk increment than those with long RTL (Table 2). Furthermore, when stratified by RTL, all patient subgroups had similar OS and RFS for the response to adjuvant chemotherapy (Supplementary Figure 3), indicating no predictive value of RTL for benefit from adjuvant chemotherapy.
Table 2.
Multivariable Cox regression analysis of GC patients' prognosis in training, validation and combining sets.
| Variables | Training set | Validation set | Combining set | |||
|---|---|---|---|---|---|---|
| HR (95% CI) | P value | HR (95% CI) | P value | HR (95% CI) | P value | |
| Overall survival | ||||||
| Age (≥58 vs. < 58) | 1.26 (0.83–1.54) | 0.397 | 1.12 (0.61–1.41) | 0.665 | 1.18 (0.72–1.49) | 0.547 |
| Sex (male vs. female) | 1.17 (0.86–1.45) | 0.748 | 1.37 (0.88–1.64) | 0.339 | 1.23 (0.84–1.56) | 0.438 |
| Tumor site (proximal + middle vs. distal) | 1.13 (0.66–1.74) | 0.437 | 0.98 (0.81–1.32) | 0.933 | 1.06 (0.78–1.44) | 0.864 |
| TNM stage (III + IV vs. I + II) | 2.51 (1.29–5.39) | 0.001 | 2.36 (1.22–5.17) | 0.006 | 2.43 (1.24–5.26) | 0.004 |
| Differentiation (poor vs. well + moderate) | 1.63 (0.89–2.27) | 0.171 | 1.77 (0.92–2.89) | 0.102 | 1.68 (0.94–2.37) | 0.115 |
| Lauren classification (diffuse vs. intestinal) | 1.74 (0.97–2.53) | 0.075 | 1.69 (0.88–2.36) | 0.121 | 1.72 (0.94–2.46) | 0.107 |
| RTL (short vs. long) | 2.95 (1.31–5.53) | 0.001 | 2.46 (1.18–4.37) | 0.005 | 2.78 (1.24–4.48) | 0.003 |
| Chemotherapya (yes vs. no) | 0.41 (0.17–0.84) | 0.008 | 0.49 (0.21–0.86) | 0.012 | 0.47 (0.19–0.84) | 0.009 |
| Relapse‐free survival | ||||||
| Age (≥58 vs. <58) | 1.13 (0.86–1.36) | 0.769 | 1.09 (0.79–1.52) | 0.541 | 1.10 (0.83–1.45) | 0.494 |
| Sex (male vs. female) | 1.20 (0.73–1.98) | 0.354 | 1.25 (0.91–1.69) | 0.113 | 1.21 (0.87–1.78) | 0.215 |
| Tumor site (proximal + middle vs. distal) | 1.28 (0.76–1.87) | 0.247 | 1.15 (0.81–1.47) | 0.673 | 1.19 (0.78–1.64) | 0.345 |
| TNM stage (III + IV vs. I + II) | 2.46 (1.38–5.93) | <0.001 | 2.41 (1.28–5.48) | 0.002 | 2.45 (1.22–5.36) | 0.003 |
| Differentiation (poor vs. well + moderate) | 1.61 (0.82–2.81) | 0.178 | 1.69 (0.89–2.97) | 0.102 | 1.67 (0.87–2.86) | 0.115 |
| Lauren classification (diffuse vs. intestinal) | 1.65 (0.91–2.59) | 0.084 | 1.73 (0.98–2.88) | 0.062 | 1.69 (0.95–2.64) | 0.073 |
| RTL (short vs. long) | 2.76 (1.22–4.73) | 0.004 | 2.52 (1.21–3.98) | 0.006 | 2.64 (1.19–4.55) | 0.007 |
| Chemotherapya (yes vs. no) | 0.42 (0.20–0.91) | 0.022 | 0.51 (0.24–0.88) | 0.016 | 0.49 (0.28–0.80) | 0.017 |
Notes: RTL, relative telomere length; HR, hazard ratio; 95% CI, 95% confidence interval; TNM, tumor‐node‐metastasis.
We calculated hazarded ratios and P values with an adjusted multivariate Cox proportional hazards regression model, including RTL, age, sex, tumor site, TNM stage, differentiation, Lauren classification, and chemotherapy as covariates. Significant P value was in bold.
Only including stage II and stage III GC patients.
3.3. Leukocyte RTL can predict patient survival within TNM stages, histological subgroups and Lauren classification
We further used the combination of the training and independent set to examine whether leukocyte RTL can predict patients survival within each stage stratum (GC stage I, II, III or IV). We found that among patients with four stages of GC, the short RTL curve all lies below the long RTL curve. Patients with short RTL at stage I, II, III and IV exhibited significantly worse OS and RFS than those with long RTL (all P < 0.05) (Figure 2A–D). Next, we stratified the GC patients by the histological subtype of well plus moderate differentiated or poor differentiated and Lauren classification of intestinal or diffuse. Kaplan–Meier survival analysis showed that patients with short RTL at each differentiation or Lauren classification subgroup exhibited significantly worse OS and RFS than those with long RTL (all P < 0.05), indicating that leukocyte RTL can predict patient survival within each GC histological subtype and Lauren classification (Figure 3A–D).
Figure 2.
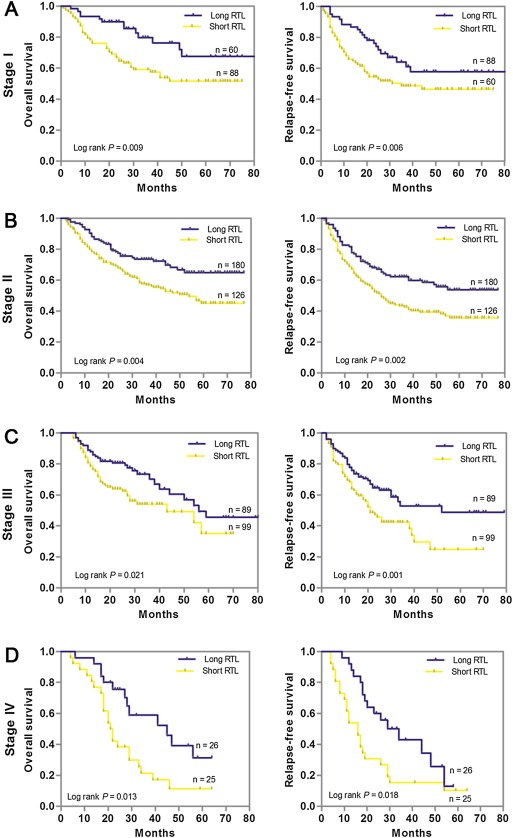
Kaplan–Meier estimation of OS and RFS according to leukocyte RTL differential stages of gastric cancer patients in the combination of training and validation sets. (A) Stage I (n = 148); (B) Stage II (n = 306); (C) Stage III (n = 188); (D) Stage IV (n = 51).
Figure 3.
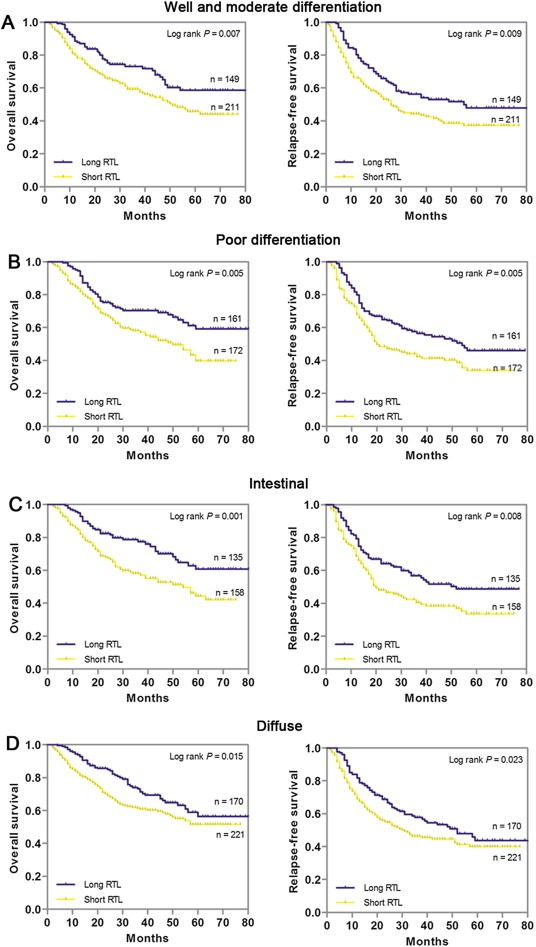
Kaplan–Meier estimation of OS and RFS according to leukocyte RTL differential histological types or Lauren classification of gastric cancer patients in the combination of training and validation sets. (A) Well and moderate differentiation (n = 360); (B) Poor differentiation (n = 333); (C) Intestinal (n = 293); (D) Diffuse (n = 391).
3.4. Prognostic prediction of leukocyte RTL complementing to TNM stage
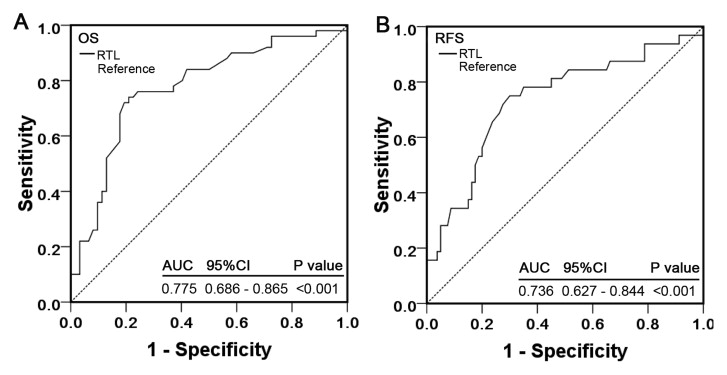
Since leukocyte RTL is an independent prognostic marker, we next evaluated whether leukocyte RTL can improve prognostic prediction based on TNM stage in combined GC patients. We constructed ROC curves based on TNM stage only, RTL only, and TNM stage plus RTL and compared the area under the ROC curves (AUC). For OS, the AUC and 95% CIs were 0.683 (0.596–0.737) for the TNM stage model and 0.704 (0.618–0.781) for the RTL model; for the combined model of TNM stage and RTL, the AUC was 0.769 (95% CI, 0.681–0.815), a significant improvement over TNM only model (P = 0.003, Figure 4A). For RFS, the AUC and 95% CIs for TNM stage model, RTL, and TNM plus RTL model were 0.665 (0.584–0.722), 0.687 (0.604–0.745) and 0.721 (0.663–0.792), respectively (Figure 4B). Again, the addition of RTL to TNM stage‐based prognosis prediction model significantly improved prognosis prediction (P = 0.009). We then compared the OS and RFS of GC patients in different subgroups divided by TNM stage together with RTL. Kaplan–Meier survival analysis indicated that patients with short RTL at TNM stage III/IV exhibited the worst OS and RFS, whereas those with long RTL at TNM stage I/II had the best OS and RFS (both log‐rank P < 0.001) (Figure 4C and D). In addition, multivariate Cox regression analysis also confirmed that patients with short RTL in TNM stage III/IV had the highest risk of both death (HR = 4.94, 95% CI = 1.96–8.73; P < 0.001) and relapse (HR = 4.49, 95% CI = 1.58–8.17; P < 0.001) (Figure 4C and D). All these data suggested that the combination use of TNM stage and RTL had a better efficacy in predicting GC prognosis.
Figure 4.
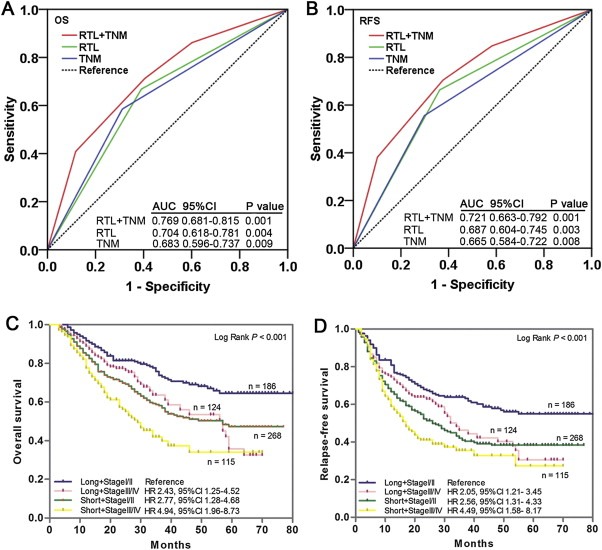
Joint prognostic value of leukocyte RTL and TNM stage in gastric cancer patients. ROC analysis showed that combined leukocyte RTL and TNM stage model had a better prediction value than did leukocyte RTL alone or TNM stage alone model in both OS (A) and RFS (B). (C and D) Kaplan–Meier curves of OS and RFS subgrouped by leukocyte RTL and TNM stage. Hazards ratios and 95% CIs were calculated by multivariate Cox proportional hazards regression model, adjusted for age, sex, tumor site, differentiation, TNM stage, Lauren classification, chemotherapy and RTL as covariates.
3.5. Immunophenotypes of PBMCs and plasma concentration of cytokines in GC patients with different leukocyte RTL
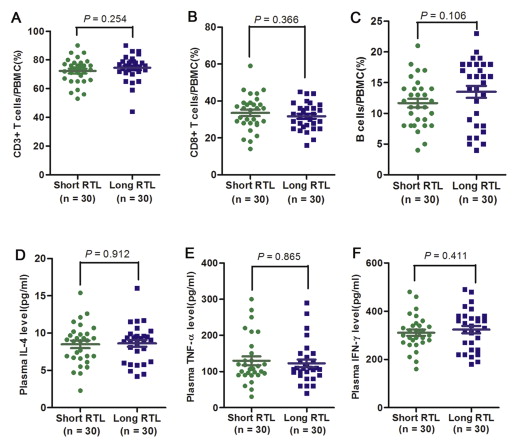
To explore the potential mechanisms that account for the different prognosis of GC patients with different leukocyte RTL, we first examined the subtypes of PBMCs from additional 30 GC patients by flow cytometry analysis. Our results showed that there was a significant difference in the frequency of CD4+ T cell in PBMCs between patients with short and long RTL (41.5% vs. 36.2%, P = 0.02, Figure 5A). More importantly, patients with short RTL had significantly higher frequency of CD19+IL‐10+ regulatory B cells (Bregs) (4.6% vs. 2.5%, P = 0.005, Figure 5B) in B cells than those with long RTL, which suggests an immunosuppressive phenotype for patients with short RTL. No significant difference on percentage of total CD3+ T cell, CD8+ T cell, B cell and CD4+CD25+Foxp3+ regulatory T cells (Tregs) was observed between patients with short and long RTL (P = 0.254, 0.366, 0.106 and 0.455, respectively; Supplementary Figure 4A–C and Figure 5C). We further examined the plasma concentrations of several cytokines that may reflect the immune function of the body. ELISA results showed that patients with short RTL had significantly higher plasma IL‐10 concentration than those with long RTL (34.8 pg/mL vs. 24.5 pg/mL, P = 0.019, Figure 5E), while there was no significant difference in the concentration of IL‐4, TNF‐α, IFN‐γ, IL‐2 or TGF‐β1 between two patient subgroups (P = 0.912, 0.865, 0.411, 0.195 and 0.149, respectively; Supplementary Figure 4D–F, Figure 5D and F).
Figure 5.
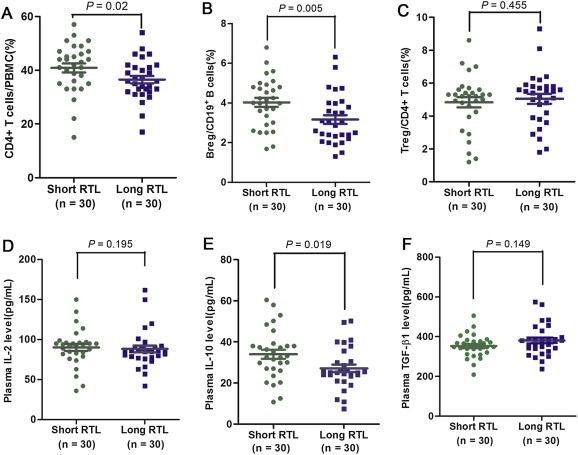
Immune phenotype and plasma cytokine concentrations in gastric cancer patients. (A–C) Flow cytometry detection of the percentage of CD4+ cells in PBMCs, CD19+IL‐10+ Bregs in B cells and CD4+CD25+FOXP3+ Tregs in CD4+ T cells of gastric cancer patients with long and short RTL (both n = 30). (D–F) Plasma concentrations of IL‐2, IL‐10 and TGF‐β1 were measured by ELISA in gastric cancer patients with long and short RTL (both n = 30).
4. Discussion
In the present study, we evaluated the prognostic value of leukocyte RTL in 693 GC patients. We found that patients with short leukocyte RTL showed poorer prognosis of both OS and RFS, suggesting that leukocyte RTL can serve as an independent prognostic factor for GC patients. Furthermore, integration of TNM stage and leukocyte RTL significantly improved the prognosis prediction efficacy for GC. In addition, short leukocyte telomere length was significantly associated with higher CD4+ T cell percentage in PBMCs, CD19+IL‐10+ Breg percentage in B cells and plasma IL‐10 concentration, indicating an enhanced immunosuppressive status with short leukocyte RTL. To the best of our knowledge, this is the first study that investigated the prognostic value of leukocyte RTL in GC patients.
As mentioned in the introduction, extensive alterations of telomere length might lead to genomic instability contributing to cancer development and prognosis (Wentzensen et al., 2011). Telomere length measured in surrogate tissues, such as blood leukocytes, has emerged as a putative biomarker for risk assessment and prognostication of malignancies. A growing number of epidemiological studies have demonstrated that leukocyte RTL is closely related to risk and prognosis of various cancers (Svenson and Roos, 2009). Two independent studies showed an increased association between short leukocyte RTL and the risk of GC (Hou et al., 2009; Liu et al., 2009). Previous study conducted using cancer somatic tissue samples has indicated that shortening telomere length involves in the carcinogenesis of gastric mucosa (Maruyama et al., 1997). Our recent study also reported that short leukocyte RTL was significantly associated with poor clinical outcomes of CRC patients (Chen et al., 2014). Consistent with these findings, our present study confirmed the significant association between short leukocyte telomere length and prognosis in GC patients, which further indicates the vital role of aberrant telomere in cancer development and progression. In contrast, several studies have evaluated the association between leukocyte RTL and cancer prognosis and reported that patients with longer leukocyte RTL have worse survival of breast, renal and liver cancer (Liu et al., 2012, 2009, 2008). These discrepant results suggested that the relationship between leukocyte telomere length and cancer evolution may be cancer organ‐specific. Although the detail molecular mechanisms underlying these findings remain to be investigated further, recent studies have suggested that these may be accounted for in part by the functional balance between the effects of oncogenic (such as telomere dysfunction) and tumor‐suppressing factors that are essential to the maintenance of normal physiological homeostasis (Svenson and Roos, 2009). The length of telomeres represents the status of a wide array of cellular activities, such as growth, proliferation, senescence, and apoptosis. Although short telomeres may give rise to greater chromosome instability, which may be a constitutional or acquired predisposition factor to tumorigenesis (Bailey and Murnane, 2006), conversely, long telomeres also may result in cancer development through delaying cellular senescence and apoptosis, thus leading to a greater chance that cells will be exposed to various genetic and environmental insults and will accumulate genetic lesions (Mooi and Peeper, 2006). Furthermore, genetic polymorphism in telomere‐maintenance genes is an important determinant of endogenous causes for telomere dysfunction and contributes to cancer development (Hu et al., 2010; Jung et al., 2014). Taken together, these reports indicate that there may be a balance of telomere length to maintain chromosome stability and programmed cell death. Either excessively short or long telomere length may contribute to cancer development once the balance is broken.
Another potential biological mechanism for the association between leukocyte telomere length shortening and GC prognosis is that telomere shortening may causally contribute to the declining of immune function of patients (Damjanovic et al., 2007). The immune system is highly sensitive to shortening of telomeres as its immunocompetence depends strictly on cell renewal and clonal expansion of T‐ and B‐cell populations (Hodes et al., 2002). In present study, we found that short leukocyte telomere length was significantly associated with higher percentage of CD4+ T cells in PBMCs. These results gave rise to the postulation that CD4+ T cells might be underwent more extensive cell division and clonal expansion in GC patients with short RTL than those with long RTL, and hence exhibited an increased degree of immunosenescence. Immunosuppressive contexture, such as high frequency of Tregs and Bregs, may decrease the immune surveillance on the microresidual lesions after resection, the root of cancer relapse (Mauri and Bosma, 2012; Wang and Wang, 2007). Previous studies have been demonstrated that Bregs play an important role during squamous carcinogenesis (Schioppa et al., 2011). The increased frequency of circulating Bregs has been found in HCC patients after surgery and the frequency of peripheral Bregs was positively correlated with tumor stage (Chen et al., 2012). Consistent with these reports, our results indicated that GC patients with short leukocyte RTL had an immunosuppressive phenotype, i.e., more Bregs in peripheral blood. Additionally, Tregs have been described in many types of cancer and their immunosuppressive activity often promotes tumor growth (Mougiakakos et al., 2010). Previous study has demonstrated that patients with long leukocyte RTL had higher percentage of Tregs than those with short leukocyte RTL (Svenson et al., 2013). However, in present study, no significant differences in percentage of Tregs were found between long and short leukocyte RTL subgroups. These inconsistent findings suggested that telomere length alteration may affect the immune functions of cancer patients in a disease‐specific manner.
Apart from regulatory immune cells, cytokines are also the important effector molecules of immune contextures. Many evidences highlight that immune contextures exert significant immunoregulatory functions through the production of several immunosuppressive cytokines such as IL‐17, IL‐10, etc. (Amedei et al., 2014; Moore et al., 2001). Observational studies have been found that high systemic levels of IL‐10 correlate with poor survival of several cancer patients (Bohlen et al., 2000; Chau et al., 2000), indicating its suppressive role responsible for restraining tumor growth. In this study, we found that patients with short RTL had a significant higher concentration of IL‐10, representing a more widespread effect of leukocyte telomere length on host immune system. Taken together, all above mentioned findings support our preceding postulation that leukocyte telomere length shortening might be a causative factor to worsen the host immune system by regulating lymphocyte phenotypes and cytokine secretion, which promote tumor immune escape and eventually lead to poor prognosis in GC patients. Additionally, our observation that leukocyte telomere length declined with increasing age is consistent with previous studies (Iwama et al., 1998), which further confirmed that telomere length act as an indicator of biological age.
GC is a highly heterogeneous disease where even similar clinical and pathologic features lead to distinct outcomes (Milne et al., 2009). These observations indicated that current TNM staging system, based on clinical and pathologic findings, may have reached their limit of usefulness and impelled the need for molecular biomarkers, as an added value, to improve the prognosis prediction of GC patients. Several high‐throughput screening‐based biomarker studies have been carried out to evaluate the prognostic power of combination of molecular biomarkers and TNM stage, such as gene expression profile, microsatellite analysis and genetic polymorphisms analysis, which add significant prognostic value to the current TNM staging system (Yasui et al., 2005). However, these biomarkers are limited for routine clinical application due to several disadvantages, such as high cost, multiple comparison issue and complex detection method, etc. In this study, we measured leukocyte RTL using a real‐time PCR‐based approach, which is easy to conduct and yields accurate data. The hypothesis‐driven approach targeting a single biomarker of interest eliminated the multiple comparison issue in the majority of current high‐throughput screening‐based biomarker studies. We identified leukocyte RTL as an independent prognostic factor for both OS and RFS of GC patients in present study and we also conducted a joint effect analysis to evaluate whether combination of leukocyte RTL and TNM stage can improve prognostic prediction in GC patients. As expected, integration of leukocyte RTL into TNM stage‐based prognosis prediction models significantly improved the prediction power of both OS and RFS in GC patients.
Our study has several strengths. First, the patient population is enrolled from Xi'an and adjacent areas. This region is highly attractive in conducting population‐based research due to the geographical stability with low mobility rate. Second, the patients with GC had relatively homogenous treatments. All patients received surgery to remove the primary tumor and in around half of patients received the same first‐line chemotherapy after surgery. These homogenous patient characteristics and treatments greatly reduced the confounding effects of the heterogeneous therapeutic modalities in most cancer clinical outcomes studies. One major limitation of our study is that in contrast to the training population, our validation population has a relatively short follow‐up time. However, the validation population has already presented with a considerable percentage of events. The continuing growth of our population with a low rate of patient loss during follow‐up will further enable us to obtain adequate power for more in‐depth interaction analyses. Furthermore, the immune‐related mechanism analysis has been performed in a relative small sample size (n = 30), which would limit the accuracy and generality of our results. Future studies in larger populations are warranted to further confirm our findings.
In conclusion, our study for the first time demonstrates that short leukocyte RTL is significantly associated with poor prognosis of GC patients, which may involve an immune‐related mechanism. Furthermore, the integration of leukocyte RTL and TNM stage dramatically improved the prognostic prediction efficacy. Our findings suggest that leukocyte RTL may serve as a novel biomarker for evaluating the immune functions and prognosis of GC patients. Once validated in larger prospective and multicentric studies, this marker might be implemented in the routine clinical setting to optimize risk stratification and ultimately personalize the therapeutic management of GC patients.
Conflict of interest
The authors have no conflicts of interest to declare.
Contributions
GQB, JGL and FLQ designed the study, FLQ, RLL and XLH carried out experimental procedures, QCL, SX, LG, GJ, RLL and FLQ collected patient samples and clinical data, FLQ, RLL and QCL contributed to acquisition of follow‐up data, FLQ and RLL analyzed data, FLQ wrote the manuscript, GQB, JGL and XLH performed the critical revision of the manuscript.
Supporting information
The following are the supplementary data related to this article:
Supplementary data
Supplementary data
Supplementary data
Supplementary data
Supplementary data
Acknowledgments
This work was supported by the National Natural Science Foundation of China (81272201, 81272275) and the International Science and Technology Cooperation Program of China (2013DFA32110).
Supplementary data 1.
1.1.
Supplementary data related to this article can be found at http://dx.doi.org/10.1016/j.molonc.2014.11.008.
Qu Falin, Li Renli, He Xianli, Li Qiucheng, Xie Shuang, Gong Li, Ji Gang, Lu Jianguo, Bao Guoqiang, (2015), Short telomere length in peripheral blood leukocyte predicts poor prognosis and indicates an immunosuppressive phenotype in gastric cancer patients, Molecular Oncology, 9, doi: 10.1016/j.molonc.2014.11.008.
Contributor Information
Jianguo Lu, Email: tdsurg@fmmu.edu.cn.
Guoqiang Bao, Email: guoqiang@fmmu.edu.cn.
References
- Amedei, A. , Benagiano, M. , della Bella, C. , Niccolai, E. , D'Elios, M.M. , 2011. Novel immunotherapeutic strategies of gastric cancer treatment. J. Biomed. Biotechnol. 2011, 437348 [DOI] [PMC free article] [PubMed] [Google Scholar]
- Amedei, A. , Munari, F. , Bella, C.D. , Niccolai, E. , Benagiano, M. , Bencini, L. , Cianchi, F. , Farsi, M. , Emmi, G. , Zanotti, G. , de Bernard, M. , Kundu, M. , D'Elios, M.M. , 2014. Helicobacter pylori secreted peptidyl prolyl cis, trans-isomerase drives Th17 inflammation in gastric adenocarcinoma. Intern. Emerg. Med. 9, 303–309. [DOI] [PubMed] [Google Scholar]
- Bailey, S.M. , Murnane, J.P. , 2006. Telomeres, chromosome instability and cancer. Nucleic Acids Res. 34, 2408–2417. [DOI] [PMC free article] [PubMed] [Google Scholar]
- Bisoffi, M. , Heaphy, C.M. , Griffith, J.K. , 2006. Telomeres: prognostic markers for solid tumors. Int. J. Cancer. 119, 2255–2260. [DOI] [PubMed] [Google Scholar]
- Bohlen, H. , Kessler, M. , Sextro, M. , Diehl, V. , Tesch, H. , 2000. Poor clinical outcome of patients with Hodgkin's disease and elevated interleukin-10 serum levels. Clinical significance of interleukin-10 serum levels for Hodgkin's disease. Ann. Hematol. 79, 110–113. [DOI] [PubMed] [Google Scholar]
- Chau, G.Y. , Wu, C.W. , Lui, W.Y. , Chang, T.J. , Kao, H.L. , Wu, L.H. , King, K.L. , Loong, C.C. , Hsia, C.Y. , Chi, C.W. , 2000. Serum interleukin-10 but not interleukin-6 is related to clinical outcome in patients with resectable hepatocellular carcinoma. Ann. Surg. 231, 552–558. [DOI] [PMC free article] [PubMed] [Google Scholar]
- Chen, T. , Song, D. , Min, Z. , Wang, X. , Gu, Y. , Wei, B. , Yao, J. , Chen, K. , Jiang, Z. , Xie, H. , Zhou, L. , Zheng, S. , 2012. Perioperative dynamic alterations in peripheral regulatory T and B cells in patients with hepatocellular carcinoma. J. Transl. Med. 10, 14 [DOI] [PMC free article] [PubMed] [Google Scholar]
- Chen, Y. , Qu, F. , He, X. , Bao, G. , Liu, X. , Wan, S. , Xing, J. , 2014. Short leukocyte telomere length predicts poor prognosis and indicates altered immune functions in colorectal cancer patients. Ann. Oncol. – Off. J. Eur. Soc. Med. Oncol./ESMO. 25, 869–876. [DOI] [PubMed] [Google Scholar]
- Damjanovic, A.K. , Yang, Y. , Glaser, R. , Kiecolt-Glaser, J.K. , Nguyen, H. , Laskowski, B. , Zou, Y. , Beversdorf, D.Q. , Weng, N.P. , 2007. Accelerated telomere erosion is associated with a declining immune function of caregivers of Alzheimer's disease patients. J. Immunol. 179, 4249–4254. [DOI] [PMC free article] [PubMed] [Google Scholar]
- Edge, S. , Byrd, D.R. , Compton, C.C. , Fritz, A.G. , Greene, F.L. , Trotti, A. , 2009. AJCC Cancer Staging Manual seventh ed. Springer-Verlag; New York: 117–126. [Google Scholar]
- Effros, R.B. , 2011. Telomere/telomerase dynamics within the human immune system: effect of chronic infection and stress. Exp. Gerontol. 46, 135–140. [DOI] [PMC free article] [PubMed] [Google Scholar]
- Ferlay, J. , Shin, H.R. , Bray, F. , Forman, D. , Mathers, C. , Parkin, D.M. , 2010. Estimates of worldwide burden of cancer in 2008: GLOBOCAN 2008. Int. J. Cancer. 127, 2893–2917. [DOI] [PubMed] [Google Scholar]
- Gramatges, M.M. , Telli, M.L. , Balise, R. , Ford, J.M. , 2010. Longer relative telomere length in blood from women with sporadic and familial breast cancer compared with healthy controls. Cancer Epidemiol. Biomarkers Prev. – A Publication of the American Association for Cancer Research, Cosponsored by the American Society of Preventive Oncology. 19, 605–613. [DOI] [PubMed] [Google Scholar]
- Hodes, R.J. , Hathcock, K.S. , Weng, N.P. , 2002. Telomeres in T and B cells. Nat. Rev. Immunol. 2, 699–706. [DOI] [PubMed] [Google Scholar]
- Hou, L. , Savage, S.A. , Blaser, M.J. , Perez-Perez, G. , Hoxha, M. , Dioni, L. , Pegoraro, V. , Dong, L.M. , Zatonski, W. , Lissowska, J. , Chow, W.H. , Baccarelli, A. , 2009. Telomere length in peripheral leukocyte DNA and gastric cancer risk. Cancer Epidemiol. Biomarkers Prev. – A Publication of the American Association for Cancer Research, Cosponsored by the American Society of Preventive Oncology. 18, 3103–3109. [DOI] [PMC free article] [PubMed] [Google Scholar]
- Hou, L. , Zhang, X. , Gawron, A.J. , Liu, J. , 2012. Surrogate tissue telomere length and cancer risk: shorter or longer?. Cancer Lett. 319, 130–135. [DOI] [PubMed] [Google Scholar]
- Hu, H. , Zhang, Y. , Zou, M. , Yang, S. , Liang, X.Q. , 2010. Expression of TRF1, TRF2, TIN2, TERT, KU70, and BRCA1 proteins is associated with telomere shortening and may contribute to multistage carcinogenesis of gastric cancer. J. Cancer Res. Clin. Oncol. 136, 1407–1414. [DOI] [PMC free article] [PubMed] [Google Scholar]
- Hug, N. , Lingner, J. , 2006. Telomere length homeostasis. Chromosoma. 115, 413–425. [DOI] [PubMed] [Google Scholar]
- Iwama, H. , Ohyashiki, K. , Ohyashiki, J.H. , Hayashi, S. , Yahata, N. , Ando, K. , Toyama, K. , Hoshika, A. , Takasaki, M. , Mori, M. , Shay, J.W. , 1998. Telomeric length and telomerase activity vary with age in peripheral blood cells obtained from normal individuals. Hum. Genet. 102, 397–402. [DOI] [PubMed] [Google Scholar]
- Jang, J.S. , Choi, Y.Y. , Lee, W.K. , Choi, J.E. , Cha, S.I. , Kim, Y.J. , Kim, C.H. , Kam, S. , Jung, T.H. , Park, J.Y. , 2008. Telomere length and the risk of lung cancer. Cancer Sci. 99, 1385–1389. [DOI] [PMC free article] [PubMed] [Google Scholar]
- Jemal, A. , Bray, F. , Center, M.M. , Ferlay, J. , Ward, E. , Forman, D. , 2011. Global cancer statistics. CA Cancer J. Clin. 61, 69–90. [DOI] [PubMed] [Google Scholar]
- Jung, S.W. , Park, N.H. , Shin, J.W. , Park, B.R. , Kim, C.J. , Lee, J.E. , Shin, E.S. , Kim, J.A. , Chung, Y.H. , 2014. Prognostic impact of telomere maintenance gene polymorphisms on hepatocellular carcinoma patients with chronic hepatitis B. Hepatology. 59, 1912–1920. [DOI] [PubMed] [Google Scholar]
- Lan, Q. , Cawthon, R. , Shen, M. , Weinstein, S.J. , Virtamo, J. , Lim, U. , Hosgood, H.D. , Albanes, D. , Rothman, N. , 2009. A prospective study of telomere length measured by monochrome multiplex quantitative PCR and risk of non-Hodgkin lymphoma. Clin. Cancer Res. – Off. J. Am. Assoc. Cancer Res. 15, 7429–7433. [DOI] [PMC free article] [PubMed] [Google Scholar]
- Liu, H.Q. , An, J.Z. , Liu, J. , Yang, Y.F. , Zhang, H.X. , Zhao, B.Y. , Li, J.B. , Yang, H.S. , Chen, Z.N. , Xing, J.L. , 2012. Leukocyte telomere length predicts overall survival in hepatocellular carcinoma treated with transarterial chemoembolization. Carcinogenesis. 33, 1040–1045. [DOI] [PMC free article] [PubMed] [Google Scholar]
- Liu, J. , Yang, Y. , Zhang, H. , Zhao, S. , Liu, H. , Ge, N. , Yang, H. , Xing, J.L. , Chen, Z. , 2011. Longer leukocyte telomere length predicts increased risk of hepatitis B virus-related hepatocellular carcinoma: a case-control analysis. Cancer. 117, 4247–4256. [DOI] [PubMed] [Google Scholar]
- Liu, X. , Bao, G. , Huo, T. , Wang, Z. , He, X. , Dong, G. , 2009. Constitutive telomere length and gastric cancer risk: case-control analysis in Chinese Han population. Cancer Sci. 100, 1300–1305. [DOI] [PMC free article] [PubMed] [Google Scholar]
- Maruyama, Y. , Hanai, H. , Fujita, M. , Kaneko, E. , 1997. Telomere length and telomerase activity in carcinogenesis of the stomach. Jpn. J. Clin. Oncol. 27, 216–220. [DOI] [PubMed] [Google Scholar]
- Mauri, C. , Bosma, A. , 2012. Immune regulatory function of B cells. Annu. Rev. Immunol. 30, 221–241. [DOI] [PubMed] [Google Scholar]
- Milne, A.N. , Carneiro, F. , O'Morain, C. , Offerhaus, G.J. , 2009. Nature meets nurture: molecular genetics of gastric cancer. Hum. Genet. 126, 615–628. [DOI] [PMC free article] [PubMed] [Google Scholar]
- Mooi, W.J. , Peeper, D.S. , 2006. Oncogene-induced cell senescence – halting on the road to cancer. N. Engl. J. Med. 355, 1037–1046. [DOI] [PubMed] [Google Scholar]
- Moore, K.W. , de Waal Malefyt, R. , Coffman, R.L. , O'Garra, A. , 2001. Interleukin-10 and the interleukin-10 receptor. Annu. Rev. Immunol. 19, 683–765. [DOI] [PubMed] [Google Scholar]
- Mougiakakos, D. , Choudhury, A. , Lladser, A. , Kiessling, R. , Johansson, C.C. , 2010. Regulatory T cells in cancer. Adv. Cancer Res. 107, 57–117. [DOI] [PubMed] [Google Scholar]
- Murnane, J.P. , 2010. Telomere loss as a mechanism for chromosome instability in human cancer. Cancer Res. 70, 4255–4259. [DOI] [PMC free article] [PubMed] [Google Scholar]
- Schioppa, T. , Moore, R. , Thompson, R.G. , Rosser, E.C. , Kulbe, H. , Nedospasov, S. , Mauri, C. , Coussens, L.M. , Balkwill, F.R. , 2011. B regulatory cells and the tumor-promoting actions of TNF-alpha during squamous carcinogenesis. Proc. Natl. Acad. Sci. U. S. A. 108, 10662–10667. [DOI] [PMC free article] [PubMed] [Google Scholar]
- Shao, L. , Wood, C.G. , Zhang, D. , Tannir, N.M. , Matin, S. , Dinney, C.P. , Wu, X. , 2007. Telomere dysfunction in peripheral lymphocytes as a potential predisposition factor for renal cancer. J. Urol. 178, 1492–1496. [DOI] [PubMed] [Google Scholar]
- Svenson, U. , Gronlund, E. , Soderstrom, I. , Sitaram, R.T. , Ljungberg, B. , Roos, G. , 2013. Telomere length in relation to immunological parameters in patients with renal cell carcinoma. PLoS One. 8, e55543 [DOI] [PMC free article] [PubMed] [Google Scholar]
- Svenson, U. , Ljungberg, B. , Roos, G. , 2009. Telomere length in peripheral blood predicts survival in clear cell renal cell carcinoma. Cancer Res. 69, 2896–2901. [DOI] [PubMed] [Google Scholar]
- Svenson, U. , Nordfjall, K. , Stegmayr, B. , Manjer, J. , Nilsson, P. , Tavelin, B. , Henriksson, R. , Lenner, P. , Roos, G. , 2008. Breast cancer survival is associated with telomere length in peripheral blood cells. Cancer Res. 68, 3618–3623. [DOI] [PubMed] [Google Scholar]
- Svenson, U. , Roos, G. , 2009. Telomere length as a biological marker in malignancy. Biochim. Biophys. Acta. 1792, 317–323. [DOI] [PubMed] [Google Scholar]
- von Zglinicki, T. , 2000. Role of oxidative stress in telomere length regulation and replicative senescence. Ann. N. Y. Acad. Sci. 908, 99–110. [DOI] [PubMed] [Google Scholar]
- Wang, H.Y. , Wang, R.F. , 2007. Regulatory T cells and cancer. Curr. Opin. Immunol. 19, 217–223. [DOI] [PubMed] [Google Scholar]
- Weng, N.P. , 2012. Telomeres and immune competency. Curr. Opin. Immunol. 24, 470–475. [DOI] [PMC free article] [PubMed] [Google Scholar]
- Wentzensen, I.M. , Mirabello, L. , Pfeiffer, R.M. , Savage, S.A. , 2011. The association of telomere length and cancer: a meta-analysis. Cancer Epidemiol. Biomarkers Prev. – A Publication of the American Association for Cancer Research, Cosponsored by the American Society of Preventive Oncology. 20, 1238–1250. [DOI] [PMC free article] [PubMed] [Google Scholar]
- Yasui, W. , Oue, N. , Aung, P.P. , Matsumura, S. , Shutoh, M. , Nakayama, H. , 2005. Molecular-pathological prognostic factors of gastric cancer: a review. Gastric Cancer – Off. J. Int. Gastric Cancer Assoc. Jpn. Gastric Cancer Assoc. 8, 86–94. [DOI] [PubMed] [Google Scholar]
- Zlobec, I. , Vuong, T. , Hayashi, S. , Haegert, D. , Tornillo, L. , Terracciano, L. , Lugli, A. , Jass, J. , 2007. A simple and reproducible scoring system for EGFR in colorectal cancer: application to prognosis and prediction of response to preoperative brachytherapy. Br. J. Cancer. 96, 793–800. [DOI] [PMC free article] [PubMed] [Google Scholar]
Associated Data
This section collects any data citations, data availability statements, or supplementary materials included in this article.
Supplementary Materials
The following are the supplementary data related to this article:
Supplementary data
Supplementary data
Supplementary data
Supplementary data
Supplementary data