

Abstract
ATR‐CHEK1 signalling is critical for genomic stability. ATR‐CHEK1 signalling may be deregulated in breast cancer and have prognostic, predictive and therapeutic significance. We investigated ATR, CHEK1 and phosphorylated CHEK1 Ser345 protein (pCHEK1) levels in 1712 breast cancers. ATR and CHEK1 mRNA expression was evaluated in 1950 breast cancers. Pre‐clinically, biological consequences of ATR gene knock down or ATR inhibition by the small molecule inhibitor (VE‐821) were investigated in MCF7 and MDA‐MB‐231 breast cancer cell lines and in non‐tumorigenic breast epithelial cells (MCF10A). High ATR and high cytoplasmic pCHEK1 levels were significantly associated with higher tumour stage, higher mitotic index, pleomorphism and lymphovascular invasion. In univariate analyses, high ATR and high cytoplasmic pCHEK1 levels were associated with poor breast cancer specific survival (BCSS). In multivariate analysis, high ATR level remains an independent predictor of adverse outcome. At the mRNA level, high CHEK1 remains associated with aggressive phenotypes including lymph node positivity, high grade, Her‐2 overexpression, triple negative, aggressive molecular phenotypes and adverse BCSS. Pre‐clinically, CHEK1 phosphorylation at serine345 following replication stress was impaired in ATR knock down and in VE‐821 treated breast cancer cells. Doxycycline inducible knockdown of ATR suppressed growth, which was restored when ATR was re‐expressed. Similarly, VE‐821 treatment resulted in a dose dependent suppression of cancer cell growth and survival (MCF7 and MDA‐MB‐231) but was less toxic in non‐tumorigenic breast epithelial cells (MCF10A). We provide evidence that ATR and CHEK1 are promising biomarkers and rational drug targets for personalized therapy in breast cancer.
Keywords: ATR, CHEK1, Breast cancer, Biomarker
Highlights
ATR‐CHEK1 pathway is critical for genomic stability.
Deregulation of ATR‐CHEK1 network may influence breast cancer pathogenesis.
High ATR protein is associated with aggressive phenotype and poor prognosis.
High cytoplasmic CHEK1 is linked to aggressive breast cancer and poor prognosis.
High CHEK1 mRNA is linked to aggressive breast cancer and poor prognosis.
1. Introduction
Ataxia telangiectasia mutated and Rad3 related protein (ATR), a serine threonine kinase belonging to the PIKK family (phosphoinositide 3‐kinase‐like‐family of protein kinase), is a key regulator of genomic integrity (Flynn and Zou, 2011; Marechal and Zou, 2013; Nam and Cortez, 2011; Sorensen and Syljuasen, 2012). ATR is activated by single stranded (ss)‐double stranded (ds) DNA junctions generated at sites of DNA damage, during nucleotide excision repair, at resected double strand breaks and stalled replication forks. Activated ATR in turn phosphorylates CHEK1 at Ser 345 and Ser 317, as well as several other target proteins involved in homologous recombination repair and DNA cross link repair (Flynn and Zou, 2011; Marechal and Zou, 2013; Nam and Cortez, 2011; Sorensen and Syljuasen, 2012). Phosphorylation of CHEK1 at Ser 345 (pCHEK1) leads to its activation which not only promotes further autophosphorylation at Ser 296, but also results in phosphorylation and inactivation of Cdc25A and Cdc25C. Whereas Cdc25A activates S‐phase progression, Cdc25C regulates mitotic entry through CDK1 (Cdc2). In addition, pCHEK1 also targets many other proteins involved in cell cycle regulation and DNA repair (Bartek and Lukas, 2003; Meuth, 2010; Smith et al., 2010; Zhang and Hunter, 2014). As a consequence of the considerable cross talk, ATR‐pCHEK1 activation ultimately results in arrest of cell cycle progression allowing sufficient time for DNA repair to be completed for the maintenance of genomic integrity (Bartek and Lukas, 2003; Flynn and Zou, 2011; Marechal and Zou, 2013; Meuth, 2010; Nam and Cortez, 2011; Smith et al., 2010; Sorensen and Syljuasen, 2012; Zhang and Hunter, 2014).
ATR gene mutation is associated with Seckel syndrome which is characterised by growth retardation and microcephaly (Alderton et al., 2004). However the role of ATR gene mutations or polymorphisms in cancer pathogenesis is less well defined. In breast cancer, no significant associations between ATR or CHEK1 polymorphism, cancer risk or survival outcomes have been demonstrated (Lin et al., 2013). The clinical significance of ATR or CHEK1 mRNA expression or protein level is also not fully known in human cancer. Despite a paucity of clinical studies, ATR and CHEK1 have emerged as promising anti‐cancer drug targets (Carrassa and Damia, 2011; Chen et al., 2012; Fokas et al., 2014; Merry et al., 2010; Zhang and Hunter, 2014). In cell line models, dominant negative inhibition of ATR function resulted in hypersensitivity to multiple chemotherapeutic agents and radiation. Similarly, ATR or CHEK1 knockdown by siRNA lead to chemotherapy and radiotherapy potentiation. Pharmacological inhibition of ATR or CHEK1 by small molecule inhibitors results in chemotherapy and radiotherapy potentiation in cancer cell lines, as well as in xenograft models (Carrassa and Damia, 2011; Chen et al., 2012; Fokas et al., 2014; Merry et al., 2010; Zhang and Hunter, 2014). Extensive preclinical data therefore provides compelling evidence to investigate ATR and/or CHEK1 blockade as a promising therapeutic target in patients.
Our hypothesis is that altered ATR, CHEK1 and pCHEK1 expression may be associated with aggressive biology, adversely impact clinical outcomes and could be suitable for rational therapeutic targeting in breast cancer. In the current study we have investigated ATR, CHEK1 and pCHEK1 in large cohorts of primary breast cancers at the protein and mRNA level and have demonstrated for the first time that high levels of nuclear ATR and cytoplasmic pCHEK1 are linked to aggressive phenotype and poor outcomes in breast cancer. Pre‐clinically, in breast cancer cells we show that phosphorylation and activation of CHEK1 at Ser345 is ATR dependent. ATR gene knock down or ATR inhibition by small molecule inhibition impairs breast cancer cell growth. We conclude that ATR‐pCHEK1 is a rational target for therapeutic application in breast cancer.
2. Methods
2.1. Clinical study
2.1.1. Patients
The study was performed in a consecutive series of 1712 patients with primary invasive breast carcinoma who were diagnosed from 1986 to 1999 and entered into the Nottingham Tenovus Primary Breast Carcinoma series. Patient demographics are summarised in Supplementary Table S1. This is a well‐characterized series of patients with long‐term follow‐up that have been investigated in a wide range of biomarker studies (Abdel‐Fatah et al., 2013, 2013, 2014, 2014, 2014, 2013). All patients were treated in a uniform way in a single institution with standard surgery (mastectomy or wide local excision) with radiotherapy. Prior to 1989, patients did not receive systemic adjuvant treatment (AT). After 1989, AT was scheduled based on prognostic and predictive factor status, including Nottingham Prognostic Index (NPI), oestrogen receptor‐α (ER‐α) status, and menopausal status. Patients with NPI scores of <3.4 (low risk) did not receive AT. In pre‐menopausal patients with NPI scores of ≥3.4 (high risk), classical Cyclophosphamide, Methotrexate, and 5‐Flurouracil (CMF) chemotherapy was given; patients with ER‐α positive tumours were also offered endocrine therapy. Postmenopausal patients with NPI scores of ≥3.4 and ER‐α positivity were offered endocrine therapy, while ER‐α negative patients received classical CMF chemotherapy. Median follow‐up was 111 months (range 1–233 months). Survival data, including overall survival, disease‐free survival (DFS), and development of loco‐regional and distant metastases (DM), was maintained on a prospective basis. DFS was defined as the number of months from diagnosis to the occurrence of local recurrence, local lymph node (LN) relapse or DM relapse. Breast cancer specific survival (BCSS) was defined as the number of months from diagnosis to the occurrence of BC related‐death. Local recurrence free survival (LRS) was defined the number of months from diagnosis to the occurrence of local recurrence. DM‐free survival was defined as the number of months from diagnosis to the occurrence of DM relapse. Survival was censored if the patient was still alive at the time of analysis, lost to follow‐up, or died from other causes.
Tumour Marker Prognostic Studies (REMARK) criteria, recommended by McShane et al. (McShane et al., 2005), were followed throughout this study. Ethical approval was obtained from the Nottingham Research Ethics Committee (C202313).
2.1.2. Construction of tissue microarray (TMA)
TMAs were constructed. Area‐specialised histopathologists identified and marked formalin‐fixed paraffin‐embedded tissue blocks containing tumour tissue on haematoxylin and eosin stained slides. Two replicate 0.6 mm cores from the centre and periphery of the tumours were taken and arrayed into a recipient paraffin block using a tissue puncher/arrayer (Beecher Instruments, Silver Spring, MD, USA). Four micron sections of the tissue array block were cut and placed on Superfrost Plus slides for immunohistochemical staining.
2.1.3. Immunohistochemistry (IHC)
The TMAs were immunohistochemically profiled for ATR, phosphorylated CHEK1 and other biological antibodies (Supplementary Table S2) as previously described (Abdel‐Fatah et al., 2013, 2013, 2014, 2014, 2014, 2013). Immunohistochemical staining was performed using the Thermo Scientific Shandon Sequenza chamber system (REF: 72110017), in combination with the Novolink Max Polymer Detection System (RE7280‐K: 1250 tests), and the Leica Bond Primary Antibody Diluent (AR9352), each used according to the manufacturer's instructions (Leica Microsystems). The tissue slides were deparaffinised with xylene and then rehydrated through five decreasing concentrations of alcohol (100%, 90%, 70%, 50% and 30%) for 2 min each. Pre‐treatment antigen retrieval was performed on the TMA sections using sodium citrate buffer (pH 6.0) and heated for 20 min at 95 °C in a microwave (Whirlpool JT359 Jet Chef 1000W). A set of slides were incubated for 18 h at 4 °C with the primary mouse monoclonal anti‐ATR antibody, clone 1E9 (H00000545‐M03, Novus Biologicals, Cambridge, UK), at a dilution of 1:20. A set of slides were incubated for 30 min at 4 °C with the primary polyclonal Rabbit anti‐CHEK1 antibody, clone ab47574 (Abcam, UK), at a dilution of 1:100. A further set of slides were incubated for 60 min with the primary rabbit polyclonal anti‐phosphorylated CHEK1 antibody (Ab58567, Abcam, Cambridge, UK), at a dilution of 1:140.
To validate the use of TMAs for immunophenotyping, full‐face sections of 40 cases were stained and protein expression levels of ATR and pCHEK1 antibodies were compared. The concordance between TMAs and full‐face sections was excellent (k = 0.8). Positive and negative (by omission of the primary antibody and IgG‐matched serum) controls were included in each run.
2.1.4. Evaluation of immunohistochemical staining
The tumour cores were evaluated by specialist pathologists and oncologists blinded to the clinicopathological characteristics of patients. Whole field inspection of the core was scored and intensities of nuclear staining were grouped as follows: 0 = no staining, 1 = weak staining, 2 = moderate staining, 3 = strong staining. The percentage of each category was estimated (0–100%). H‐score (range 0–300) was calculated by multiplying intensity of staining and percentage staining. X‐tile (version 3.6.1, Yale University, USA) was used to identify a cut‐off for protein expression. H‐score of ≥60 was taken as the cut‐off for high ATR expression, H‐score of ≥130 was taken as cut‐off for high nuclear CHEK1 expression, H‐score of ≥50 was taken as the cut‐off for high cytoplasmic pCHEK1 expression and H‐score of ≥50 was taken as the cut‐off for high nuclear pCHEK1 expression. Not all cores within the TMA were suitable for IHC analysis as some cores were missing or lacked tumour. HER2 expression was assessed according to the new ASCO/CAP guidelines using chromogenic in situ hybridisation (CISH) (Wolff et al., 2013).
2.1.5. Statistical analyses for IHC
Data analysis was performed using SPSS (SPSS, version 17 Chicago, IL). Where appropriate, Pearson's Chi‐square and Fisher's exact tests were performed using SPSS software (SPSS, version 17 Chicago, IL). Cumulative survival probabilities were estimated using the Kaplan–Meier method. Differences between survival rates were tested for significance using the log‐rank test. Multivariate analysis for survival was performed using the Cox hazard model. The proportional hazards assumption was tested using standard log–log plots. Each variable was assessed in univariate analysis as a continuous and categorical variable and the two models were compared using an appropriate likelihood ratio test. Hazard ratios (HR) and 95% confidence intervals (95% CI) were estimated for each variable. All tests were two‐sided with a 95% CI. p values for each test were adjusted with Benjamini and Hochberg multiple p‐value adjustment and an adjusted p value of <0.05 was considered significant.
2.1.6. ATR and CHEK1 gene expression
The mRNA expression of ATR and CHEK1 was performed in the METABRIC (Molecular Taxonomy of Breast Cancer International Consortium) cohort. The METABRIC study protocol, detailing the molecular profiling methodology in a cohort of 1980 breast cancer samples is described by Curtis et al. (Curtis et al., 2012). Patient demographics are summarized in Supplementary Table S3 of supporting information. ER positive and/or lymph node negative patients did not receive adjuvant chemotherapy. ER negative and/or lymph node positive patients received adjuvant chemotherapy. RNA was extracted from fresh frozen tumours and subjected to transcriptional profiling on the Illumina HT‐12 v3 platform. The data was pre‐processed and normalized as described previously (Curtis et al., 2012). ATR and CHEK1 expression was investigated in this data set. X‐tile (version 3.6.1, Yale University, USA) was used to identify a cut‐off in gene expression values to divide the population in to high/low subgroups prior to analysis. The Chi‐square test was used for testing association between categorical variables and a multivariate Cox model was fitted to the data using as endpoint breast cancer specific death. Cumulative survival probabilities were estimated using the Kaplan–Meier method.
2.2. Pre‐clinical study
2.2.1. Chemicals and reagents
All chemicals and reagents were obtained from Sigma (St Louis, MO, USA) unless otherwise stated. VE‐821 was a kind gift from John R Pollard (Vertex Pharmaceuticals, Abingdon, UK).
2.2.2. Cells and cell lines
MCF7 (p53 wild type, ER +ve human breast adenocarcinoma) and MDA‐MB‐231 (p53 mutant, triple negative human breast adenocarcinoma) cells were grown in RPMI‐1640 media containing 10% FBS, 100 units/ml penicillin and 0.1 mg/ml streptomycin. MCF10A (p53 wild type, immortalised human non‐tumorigenic breast epithelium) cells from ATCC (Manassas, VA, USA) were maintained in DMEM/Ham's F12 Nutrient mixture with 5% horse serum (Gibco, Life Technologies, Paisley, UK), 0.5 μg/ml hydrocortisone, 20 ng/ml epidermal growth factor, 10 μg/ml insulin and 100 ng/ml cholera toxin. Cells were maintained at 37 °C and 5% CO2 and were authenticated (LGC Standards, Teddington, UK) and confirmed to be mycoplasma free (MycoAlert, Lonza, Basel, Switzerland).
2.2.3. siRNA knockdown of ATR
MCF7 cells were added to either scrambled siRNA (5'‐UUCUCCGAACGUGUCACGUdtdt) or ATR specific siRNA (5′‐CAUCUUAUCCCAUGCGUGUdtdt) diluted in OptiMEM (Gibco, Life Technologies, Paisley, UK) and Lipofectamine RNAiMAX (Life Technologies, Paisley, UK) to a final siRNA concentration of 10 nM. Cells were allowed to adhere for 48 h before being treated for 1 h with 1 μM gemcitabine or 10 mM hydroxyurea.
2.2.4. shRNA knockdown of ATR
Lentivirus particles containing ATR‐specific shRNA were formed by transfecting HEK293T cells with pCMVΔ8.91 packaging vector, pMD2.G envelope vector and pTRIPZ doxycycline‐inducible lentiviral vector containing ATR shRNA (Thermo, Northumberland, UK). Virus particles released into the media were collected and purified via ultracentrifugation using Lenti‐X concentrator (Clontech, Mountain View, USA). MCF7 cells were transduced with ATR shRNA lentivirus and stably expressing clones identified and grown by selection using 1 μg/ml puromycin. MCF7 shATR cells were maintained in full media supplemented with 1 μg/ml puromycin. shATR expression was induced by supplementing media with 1 μg/ml doxycycline. Cells grown in the absence of doxycycline were used as a control.
2.2.5. Gel electrophoresis and western blotting
Cells were prepared for gel electrophoresis by lysis using PhosphoSafe extraction reagent (Merck, Darmstadt, Germany) and sonication. Protein concentration was determined using a Pierce BCA protein assay (Thermo, Northumberland, UK). Lysates were diluted in 4× XT sample buffer (Bio‐Rad, Hemel Hempstead, UK) and subjected to gel electrophoresis using 4–15% Tris‐Glycine cells (Bio‐Rad, Hemel Hempstead, UK). Proteins were transferred onto Hybond C‐Extra nitrocellulose membrane (GE Healthcare, Buckinghamshire, UK) using western blotting. Proteins were detected using primary antibodies incubated overnight at 4 °C: goat anti‐ATR (1:300 N‐19 – Santa Cruz Biotechnology, Santa Cruz, CA, USA), rabbit anti‐pCHEK1Ser345 (1:300 133D3 – Cell Signalling Technologies, Danvers, MA, USA), mouse anti‐CHEK1 (1:300 G‐4 – Santa Cruz Biotechnology, Santa Cruz, CA, USA), mouse anti‐actin (1:1000 AC40 – Sigma, Poole, UK), mouse anti‐β‐actin (1:10000 2D1D10 – GenScript, Piscataway, NJ, USA). Secondary antibodies were anti‐goat‐HRP (1:2000, Santa Cruz Technologies, Santa Cruz, CA, USA), anti‐mouse‐HRP (1:2000 – Dako UK Ltd, Ely, UK) and anti‐rabbit‐HRP (1:1000 – Dako UK Ltd, Ely, UK). Chemiluminescence from ECL Prime detection reagent (GE Healthcare, Buckinghamshire, UK) was detected using a G‐box (Syngene, Cambridge, UK) and band intensities were measured by densitometry using GeneTools software (Syngene, Cambridge, UK).
2.2.6. Growth assay
MCF7, MCF7 shATR or MDA‐MB‐231 cells were seeded at a density of 1000 cells/well into 96‐well tissue culture plates. To assess the effect of ATR knockdown on cell growth MCF7 shATR cells were treated with 1 μg/ml doxycycline for 3 days prior to seeding then growth was measured over the next 11 days in fresh medium. For growth inhibition assays cells were treated for 24 h with VE‐821 then allowed to grow in fresh media for 5 days. Cells were fixed using Carnoy's fixative and allowed to dry overnight. Cell growth was measured by staining cells with 10 μg/ml DAPI in 0.001% Triton‐X‐100. Cells were solubilised using 10 mM EDTA (pH 2.2) and the fluorescence measured at 460 nm using an MFX Microtiter Plate Fluorometer (Dynex Technologies, Chantilly, VA, USA).
2.2.7. Clonogenic survival assay
MCF7, MDA‐MB‐231 or MCF10A cells seeded at a density of 1 × 10⁵ cells/ml. Following treatment with VE‐821 for 24 h cells were counted and re‐seeded at low density for colony formation. Colonies were allowed to grow for 2 weeks in fresh media before being fixed using Carnoy's fixative and stained using 1% crystal violet. Colonies were counted and the % plating efficiency calculated.
3. Results
3.1. ATR, CHEK1 and pCHEK1 protein level correlate to aggressive breast cancer phenotypes
3.1.1. ATR
High ATR level was seen in 409/1298 (31.5%) tumours compared to 889/1298 (68.5%) tumours that had low ATR level (Figure 1A). There was no cytoplasmic expression in any tumours. High ATR level was associated with higher stage (p = 0.036), higher tumour grade (p < 0.001), higher mitotic index (p < 0.001), pleomorphism (p < 0.001) and lymphovascular invasion (p = 0.009) (Table 1, Supplementary Figure 1). Low SMUG1, low APE1 and low DNA‐PKcs were also more likely associated with high ATR level in tumours (p < 0.05). High MIB1, high TOPO2A, high CDK1, Low Bax and low MDM2 was likely in tumours with high ATR levels (p < 0.05) (Table 1, Supplementary Figure 1).
Figure 1.
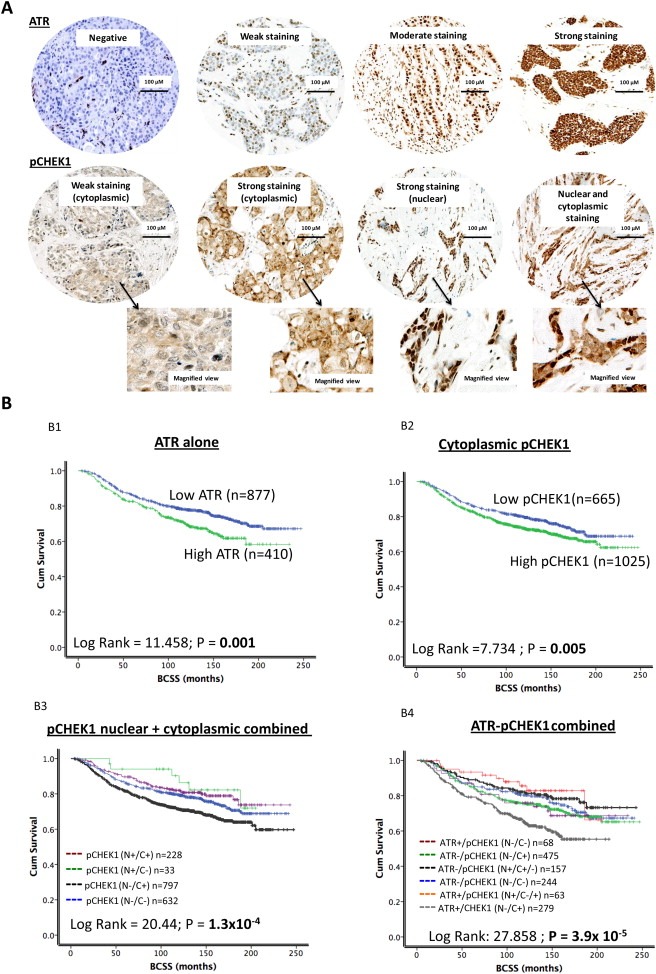
ATR and pCHEK1 protein level in breast cancer. A. Microphotograph of ATR and pCHEK1 negative and positive breast cancer tissue. B. Kaplan Meier curves showing breast cancer specific survival (BCSS) and ATR level (B1). Kaplan Meier curves showing breast cancer specific survival (BCSS) and cytoplasmic pCHEK1 level (B2). Kaplan Meier curves showing breast cancer specific survival (BCSS) and combined nuclear/cytoplasmic pCHEK1 level (B3). Kaplan Meier curves showing breast cancer specific survival (BCSS) and combined ATR/pCHEK1 level (B4).
Table 1.
ATR protein expression in breast cancer.
| Variable | ATR protein expression | p‐value | Adjusted p‐values | |
|---|---|---|---|---|
| Low N (%) | High N (%) | |||
| A) Pathological parameters | ||||
| Tumour size | ||||
| <1 cm | 96 (10.8) | 32 (7.8) | 1.6 × 10 −4 | 0.0008 |
| >1–2 cm | 476 (53.5) | 178 (43.5) | ||
| >2–5 cm | 296 (33.3) | 187 (45.7) | ||
| >5 cm | 21 (2.4) | 12 (2.9) | ||
| Tumour stage | ||||
| 1 | 577 (64.8) | 236 (57.4) | 0.036 | 0.0864 |
| 2 | 241 (27.1) | 133 (32.4) | ||
| 3 | 72 (8.1) | 42 (10.2) | ||
| Tumour grade | ||||
| G1 | 175 (19.7) | 39 (9.5) | 1.0× 10⁻⁵ | 0.0002 |
| G2 | 295 (33.2) | 112 (27.4) | ||
| G3 | 419 (47.1) | 258 (63.1) | ||
| Mitotic index | ||||
| M1 (low; mitoses < 10) | 338 (38.3) | 97 (23.7) | 1.0 × 10 −5 | 0.0001 |
| M2 (medium; mitoses 10–18) | 160 (18.1) | 73 (17.8) | ||
| M3 (high; mitosis >18) | 384 (43.5) | 239 (58.4) | ||
| Tubule formation | ||||
| 1 (>75% of definite tubule) | 62 (7.0) | 15 (3.7) | 0.529* | 0.731 |
| 2 (10%–75% definite tubule) | 287 (32.5) | 135 (33.0) | ||
| 3 (<10% definite tubule) | 533 (60.4) | 259 (63.3) | ||
| Pleomorphism | ||||
| 1 (small‐regular uniform) | 30 (3.4) | 3 (0.7) | 1.0 × 10 −5 | 0.0001 |
| 2 (Moderate variation) | 361 (41.0) | 117 (28.6) | ||
| 3 (Marked variation) | 489 (55.6) | 289 (70.7) | ||
| Tumour type | ||||
| IDC‐NST | 449 (58.2) | 223 (65.6) | 0.061 | 0.1292 |
| Tubular Carcinoma | 164 (21.2) | 58 (17.1) | ||
| Medullary Carcinoma | 26 (3.4) | 5 (1.5) | ||
| ILC | 65 (8.4) | 21 (6.2) | ||
| Others | 68 (8.8) | 33 (9.7) | ||
| Lymphovascular invasion | ||||
| No | 606 (69.0) | 252 (61.6) | 0.009 | 0.0295 |
| Yes | 272 (31.0) | 157 (38.4) | ||
| B) Aggressive phenotype | ||||
| Her2 overexpression | ||||
| No | 775 (89.0) | 348 (87.0) | 0.307 | 0.5024 |
| Yes | 96 (11.0) | 52 (13.0) | ||
| Triple negative phenotype | ||||
| No | 702 (81.1) | 326 (81.1) | 0.947 | 34.0920 |
| Yes | 162 (18.8) | 76 (18.9) | ||
| Basal like phenotype | ||||
| No | 731 (86.9) | 340 (88.3) | 0.496 | 0.7142 |
| Yes | 110 (13.1) | 45 (11.7) | ||
| Cytokeratin 6 (CK6) | ||||
| Negative | 618 (82.1) | 285 (86.4) | 0.081 | 0.1620 |
| Positive | 135 (17.9) | 45 (13.6) | ||
| Cytokeratin 14 (CK14) | ||||
| Negative | 641 (85.6) | 292 (89.3) | 0.099 | 0.1876 |
| Positive | 108 (14.4) | 35 (10.7) | ||
| Cytokeratin 18 (CK18) | ||||
| Negative | 75 (11.0) | 36 (11.5) | 0.814 | 0.9453 |
| Positive | 607 (89.0) | 277 (88.5) | ||
| Cytokeratin 19 (CK19) | ||||
| Negative | 42 (5.6) | 25 (7.6) | 0.201 | 0.3618 |
| Positive | 708 (94.4) | 302 (92.4) | ||
| C) Hormone receptors | ||||
| ER | ||||
| Negative | 231 (26.5) | 114 (27.9) | 0.595 | 0.7933 |
| Positive | 642 (73.5) | 295 (72.1) | ||
| PgR | ||||
| Negative | 357 (43.2) | 165 (43.5) | 0.918 | 0.9720 |
| Positive | 469 (56.8) | 214 (56.5) | ||
| AR | ||||
| Negative | 266 (38.1) | 120 (37.9) | 0.938 | 0.9648 |
| Positive | 432 (61.9) | 197 (62.1) | ||
| D) DNA repair | ||||
| BRCA1 | ||||
| Absent | 114 (19.2) | 63 (21.5) | 0.425 | 0.6375 |
| Normal | 479 (80.8) | 230 (78.5) | ||
| XRCC1 | ||||
| Low | 101 (16.3) | 48 (15.7) | 0.822 | 0.9248 |
| High | 520 (83.7) | 258 (84.3) | ||
| FEN1(Nuclear) | ||||
| Low | 443 (74.5) | 205 (72.4) | 0.526 | 0.7283 |
| High | 152 (25.5) | 78 (27.6) | ||
| SMUG1 | ||||
| Low | 189 (34.9) | 122 (43.7) | 0.013 | 0.0390 |
| High | 353 (65.1) | 157 (56.3) | ||
| APE1 | ||||
| Low | 400 (55.2) | 151 (41.3) | 1.4 × 10 −5 | 0.0001 |
| High | 325 (44.8) | 215 (58.7) | ||
| PolB | ||||
| Low | 298 (38.8) | 140 (37.2) | 0.608 | 0.7817 |
| High | 470 (61.2) | 236 (62.8) | ||
| DNA‐PK | ||||
| Low | 274 (39.0) | 113 (30.5) | 0.006 | 0.0216 |
| High | 428 (61.0) | 257 (69.5) | ||
| E) Cell cycle/apoptosis regulators | ||||
| P16 | ||||
| Low | 521 (86.1) | 243 (86.5) | 0.885 | 0.9655 |
| High | 84 (13.9) | 38 (13.5) | ||
| P21 | ||||
| Low | 379 (58.4) | 153 (55.0) | 0.343 | 0.5369 |
| High | 270 (41.6) | 125 (45.0) | ||
| MIB1 | ||||
| Low | 377 (52.5) | 112 (31.8) | 1.0 × 10 −5 | 0.0001 |
| High | 341 (47.5) | 240 (68.2) | ||
| P53 | ||||
| Low expression | 559 (78.5) | 257 (79.3) | 0.768 | 0.9534 |
| High expression | 153 (21.5) | 67 (20.7) | ||
| Bcl‐2 | ||||
| Negative | 284 (35.5) | 126 (36.3) | 0.781 | 0.9372 |
| Positive | 517 (64.5) | 221 (63.7) | ||
| TOP2A | ||||
| Low | 295 (48.6) | 118 (37.9) | 0.002 | 0.0080 |
| Overexpression | 312 (51.4) | 193 (62.1) | ||
| Phospho‐Chk1 (cytoplasmic) | ||||
| Low | 272 (30.6) | 74 (17.8) | 1.0 × 10 −6 | 0.0001 |
| High | 618 (69.4) | 341 (82.2) | ||
| Phospho‐Chk1 (Nuclear) | ||||
| Low | 731 (82.1) | 351 (84.6) | 0.275 | 0.4714 |
| High | 159 (17.9) | 64 (15.4) | ||
| Bax | ||||
| Low | 329 (66.7) | 177 (75.0) | 0.023 | 0.0637 |
| High | 164 (33.3) | 59 (25.0) | ||
| CDK1 | ||||
| Low | 390 (75.0) | 190 (62.9) | 2.5 × 10 −4 | 0.0011 |
| High | 130 (25.0) | 112 (37.1) | ||
| MDM2 | ||||
| Low | 449 (72.9) | 219 (79.6) | 0.032 | 0.0823 |
| Overexpression | 167 (27.1) | 56 (20.4) | ||
Bold = Statistically significant; BRCA1: Breast cancer 1, early onset; HER2: human epidermal growth factor receptor 2; ER: oestrogen receptor; PgR: progesterone receptor; CK: cytokeratin; Basal‐like: ER‐, HER2 and positive expression of either CK5/6, CK14 or EGFR; Triple negative: ER‐/PgR‐/HER2‐. Adjusted p values were calculated using Benjamini‐Hochberg method to adjust for multiple testing. *Fischer test was used to obtain p values where one or more of cells have an expected frequency of five or less.
3.1.2. CHEK1
High CHEK1 level was seen in 666/1307 (51%) tumours compared to 641/1307 (49%) tumours that had low CHEK1 level (Supplementary Table S4). There was no cytoplasmic expression in any tumours. Low nuclear CHEK1 was significantly associated with larger tumour size, higher stage, higher grade, higher mitotic index, nuclear pleomorphism, histological tumour type, lymphovascular invasion and HER‐2 overexpression (p < 0.001). Absence of BRCA1, low XRCC1, low FEN1, low APE1, low polβ, and low DNA‐PKcs were also more likely in tumours with high cytoplasmic pCHEK1 protein levels (p < 0.05). High MIB1, low Bcl2, low Bax and low MDM2 was likely in tumours with low CHEK1 levels (p < 0.05). Low CHEK1 was also associated with low cytoplasmic pCHEK1 and low nuclear pCHEK1 levels in tumours (p < 0.001) (Supplementary Table S4).
3.1.3. pCHEK1
High cytoplasmic pCHEK1 level was seen in 672/1712 (39.25%) tumours compared to 1040/1712 (60.74%) tumours that had low pCHEK1 level (Figure 1A) (Table 2, Supplementary Figure 1). High cytoplasmic pCHEK1protein level was significantly associated with higher mitotic index, nuclear pleomorphism, histological tumour type and lymphovascular invasion (p < 0.05). Triple negative and basal like phenotypes were more likely in tumours with high cytoplasmic pCHEK1 protein levels (p < 0.05). Absence of BRCA1, low APE1, low polβ, high ATR and high DNA‐PKcs were also more likely in tumours with high cytoplasmic pCHEK1 protein levels (p < 0.05). High MIB1, high TOPO2A, high CDK1 and low MDM2 were likely in tumours with high cytoplasmic pCHEK1 protein levels (p < 0.05).
Table 2.
Cytoplasmic pCHK1 expression in breast cancer.
| Variable | Cytoplasmic pCHK1 protein expression | p‐value | Adjusted p‐values | |
|---|---|---|---|---|
| Low N (%) | High N (%) | |||
| A) Pathological parameters | ||||
| Tumour size | ||||
| <1 cm | 93 (13.8) | 107 (10.3) | 0.067 | 0.1269 |
| >1–2 cm | 342 (50.9) | 520 (50.0) | ||
| >2–5 cm | 219 (32.6) | 388 (37.3) | ||
| >5 cm | 18 (2.7) | 25 (2.4) | ||
| Tumour stage | ||||
| 1 | 445 (66.1) | 634 (60.8) | 0.021 | 0.0687 |
| 2 | 183 (27.2) | 304 (29.1) | ||
| 3 | 45 (6.7) | 105 (10.1) | ||
| Tumour grade | ||||
| G1 | 131 (19.5) | 166 (16.0) | 0.091 | 0.1638 |
| G2 | 226 (33.6) | 339 (32.6) | ||
| G3 | 315 (46.9) | 535 (51.4) | ||
| Mitotic index | ||||
| M1 (low; mitoses < 10) | 271 (40.8) | 349 (33.7) | 0.012 | 0.0480 |
| M2 (medium; mitoses 10–18) | 113 (17.0) | 200 (19.3) | ||
| M3 (high; mitosis >18) | 280 (42.2) | 487 (47.0) | ||
| Tubule formation | ||||
| 1 (>75% of definite tubule) | 41 (6.2) | 60 (5.8) | 0.830 | 0.9055 |
| 2 (10%–75% definite tubule) | 213 (32.1) | 346 (33.4) | ||
| 3 (<10% definite tubule) | 410 (61.7) | 630 (60.8) | ||
| Pleomorphism | ||||
| 1 (small‐regular uniform) | 21 (3.2) | 23 (2.2) | 0.034 | 0.0874 |
| 2 (Moderate variation) | 279 (42.1) | 382 (36.9) | ||
| 3 (Marked variation) | 363 (54.8) | 630 (60.9) | ||
| Tumour type | ||||
| IDC‐NST | 304 (55.1) | 546 (60.6) | 0.041 | 0.0984 |
| Tubular Carcinoma | 117 (21.2) | 1376 (19.5) | ||
| Medullary Carcinoma | 18 (3.3) | 20 (2.2) | ||
| ILC | 69 (12.5) | 76 (8.4) | ||
| Others | 44 (8.0) | 83 (9.2) | ||
| Lymphovascular invasion | ||||
| No | 473 (71.0) | 676 (65.8) | 0.025 | 0.0750 |
| Yes | 193 (29.0) | 351 (34.2) | ||
| B) Aggressive phenotype | ||||
| Her2 overexpression | ||||
| No | 580 (89.2) | 895 (88.2) | 0.510 | 0.6331 |
| Yes | 70 (10.8) | 120 (11.8) | ||
| Triple negative phenotype | ||||
| No | 548 (84.3) | 811 (80.0) | 0.026 | 0.0720 |
| Yes | 102 (15.7) | 203 (20.0) | ||
| Basal like phenotype | ||||
| No | 576 (91.9) | 846 (86.0) | 4.1 × 10 −5 | 0.0002 |
| Yes | 51 (8.1) | 138 (14.0) | ||
| Cytokeratin 6 (CK6) | ||||
| Negative | 453 (85.0) | 726 (83.0) | 0.319 | 0.4417 |
| Positive | 80 (15.0) | 149 (17.0) | ||
| Cytokeratin 14 (CK14) | ||||
| Negative | 461 (86.8) | 757 (87.2) | 0.831 | 0.8799 |
| Positive | 70 (13.2) | 111 (12.8) | ||
| Cytokeratin 18 (CK18) | ||||
| Negative | 52 (10.5) | 87 (10.8) | 0.895 | 0.9206 |
| Positive | 441 (89.5) | 720 (89.2) | ||
| Cytokeratin 19 (CK19) | ||||
| Negative | 37 (6.9) | 53 (6.1) | 0.579 | 0.6948 |
| Positive | 500 (93.1) | 810 (93.9) | ||
| C) Hormone receptors | ||||
| ER | ||||
| Negative | 158 (23.9) | 288 (28.0) | 0.060 | 0.120 |
| Positive | 503 (76.1) | 739 (72.0) | ||
| PgR | ||||
| Negative | 246 (40.3) | 420 (43.5) | 0.211 | 0.3165 |
| Positive | 364 (59.7) | 545 (56.5) | ||
| AR | ||||
| Negative | 180 (36.4) | 298 (36.3) | 0.972 | 34.992 |
| Positive | 314 (63.6) | 522 (63.7) | ||
| D) DNA repair | ||||
| BRCA1 | ||||
| Absent | 68 (15.9) | 150 (20.6) | 0.049 | 0.1102 |
| Normal | 360 (84.1) | 579 (79.4) | ||
| XRCC1 | ||||
| Low | 72 (16.4) | 108 (14.5) | 0.359 | 0.4787 |
| High | 366 (83.6) | 639 (85.5) | ||
| FEN1 | ||||
| Low | 319 (75.1) | 495 (71.0) | 0.141 | 0.2417 |
| High | 106 (24.9) | 202 (29.0) | ||
| SMUG1 | ||||
| Low | 157 (38.8) | 238 (36.6) | 0.483 | 0.6210 |
| High | 248 (61.2) | 412 (63.4) | ||
| APE1 | ||||
| Low | 264 (65.3) | 389 (43.8) | 1.0 × 10 −5 | 0.0002 |
| High | 140 (34.7) | 500 (56.2) | ||
| PolB | ||||
| Low | 242 (50.9) | 295 (31.9) | 1.0 × 10 −5 | 0.0001 |
| High | 233 (49.1) | 630 (68.1) | ||
| ATR | ||||
| Low | 272 (78.6) | 618 (64.4) | 1.0 × 10 −6 | 0.0001 |
| High | 74 (21.4) | 341 (35.6) | ||
| DNA‐PK | ||||
| Low | 159 (52.1) | 252 (29.0) | 1.0 × 10 −5 | 0.0001 |
| High | 146 (47.9) | 616 (71.0) | ||
| E) Cell cycle/apoptosis regulators | ||||
| P16 | ||||
| Low | 364 (86.1) | 607 (87.1) | 0.621 | 0.7212 |
| High | 59 (13.9) | 90 (12.9) | ||
| P21 | ||||
| Low | 255 (56.9) | 425 (57.6) | 0.821 | 0.9236 |
| High | 193 (43.1) | 313 (42.4) | ||
| MIB1 | ||||
| Low | 220 (41.6) | 299 (34.0) | 0.004 | 0.0206 |
| High | 309 (58.4) | 580 (66.0) | ||
| P53 | ||||
| Low expression | 409 (81.2) | 663 (78.0) | 0.168 | 0.2630 |
| High expression | 95 (18.8) | 187 (22.0) | ||
| Bcl‐2 | ||||
| Negative | 189 (32.6) | 337 (36.3) | 0.146 | 0.2389 |
| Positive | 390 (67.4) | 591 (63.7) | ||
| TOP2A | ||||
| Low | 227 (50.4) | 305 (42.2) | 0.006 | 0.0270 |
| Overexpression | 223 (49.6) | 418 (57.8) | ||
| Phospho‐Chk1 (Nuclear) | ||||
| Low | 642 (95.1) | 813 (77.7) | 1.0 × 10 −5 | 0.0001 |
| High | 33 (4.9) | 233 (22.3) | ||
| Bax | ||||
| Low | 216 (66.9) | 423 (70.6) | 0.240 | 0.3456 |
| High | 107 (33.1) | 176 (29.4) | ||
| CDK1 | ||||
| Low | 202 (75.1) | 457 (68.6) | 0.049 | 0.1038 |
| High | 67 (24.9) | 209 (31.4) | ||
| MDM2 | ||||
| Low | 294 (70.8) | 552 (77.2) | 0.018 | 0.0648 |
| Overexpression | 121 (29.2) | 163 (22.8) | ||
Bold = Statistically significant; BRCA1: Breast cancer 1, early onset; HER2: human epidermal growth factor receptor 2; ER: oestrogen receptor; PgR: progesterone receptor; CK: cytokeratin; Basal‐like: ER‐, HER2 and positive expression of either CK5/6, CK14 or EGFR; Triple negative: ER‐/PgR‐/HER2‐. Adjusted p values were calculated using Benjamini‐Hochberg method to adjust for multiple testing.
High nuclear pCHEK1 level was seen in 264/1712 (15.4%) tumours compared to 1448/1712 (84.6%) tumours that had low nuclear pCHEK1 expression (Figure 1A) (Supplementary Table S5). Low nuclear pCHEK1 protein level was significantly associated with higher grade, higher mitotic index, de‐differentiation and nuclear pleomorphism (p < 0.05). ER‐, PR‐, AR‐, Her‐2 positive tumours were more likely in tumours with low nuclear pCHEK1 protein levels (p < 0.05). Absence of BRCA1, low XRCC1, low SMUG1, low APE1, low polβ and low DNA‐PKcs were also more likely in tumours with low nuclear pCHEK1 protein levels (p < 0.05). High MIB1, low TOPO2A and low MDM2 was likely in tumours with low nuclear pCHEK1 protein levels (p < 0.05).
3.1.4. ATR‐pCHEK1 combined analysis
The data presented above suggests that differential ATR/pCHEK1 level may influence breast cancer phenotypes. To evaluate further, we performed ATR/pCHEK1 combined analysis. As shown in Supplementary Table S6, tumours that had high ATR level/high cytoplasmic pCHEK1 level/low nuclear pCHEK1 level had larger size, higher stage, higher grade, higher mitotic index, de‐differentiation, pleomorphism, HER‐2 overexpression, ER‐/PR‐/AR‐, high MIB1, low TOP2A, low Bax and high CDK1 phenotypes (all p values <0.05). In addition, such tumours also exhibited a genomic instability phenotype characterised by absence of BRCA1, low XRCC1, low SMUG1, low polβ and low DNA‐Pkcs expression (all p values <0.01). Interestingly, although there was no association with p53 mutation, low MDM2 was more likely in tumours with high ATR/high cytoplasmic pCHEK1/low nuclear pCHEK1 tumours.
3.2. ATR, CHEK1 and pCHEK1 protein level associate with poor survival outcomes in patients
3.2.1. Univariate analysis
High ATR level was associated with worse breast cancer specific survival in patients (p = 0.001) (Figure 1B1). Low nuclear CHEK1 was associated with worse breast cancer specific survival in patients (p < 0.001) (Supplementary Figure 2A). Similarly, low nuclear pCHEK1 level was associated with worse BCSS (p = 0.007) (Supplementary Figure 3A). On the other hand, high cytoplasmic pCHEK1 level was associated with worse BCSS (p = 0.005) (Figure 1B2). Investigating nuclear and cytoplasmic pCHEK1 together we found that patients whose tumours have low nuclear and high cytoplasmic CHEK1 have the worst survival compared to tumours that have high nuclear and low cytoplasmic CHEK1 (p < 0.001) (Figure 1B3). We then combined ATR and pCHEK1 in the analysis. As shown in Figure 1B4, high ATR/low nuclear pCHEK1/high cytoplasmic pCHEK1 tumours have the worst survival (p < 0.001). As p53 may be involved in the activation of ATR‐CHEK1 pathway we also conducted an exploratory analysis in p53 mutant and proficient tumours. As shown in Figure 2A and B, high ATR/p53 mutants, high cytoplasmic pCHEK1/p53 mutants have the worst survival compared to tumours that are p53 wild type. Similarly, high nuclear pCHEK1/p53 mutants have the worst survival compared to tumours that are p53 wild type (Supplementary Figure 3B).
Figure 2.
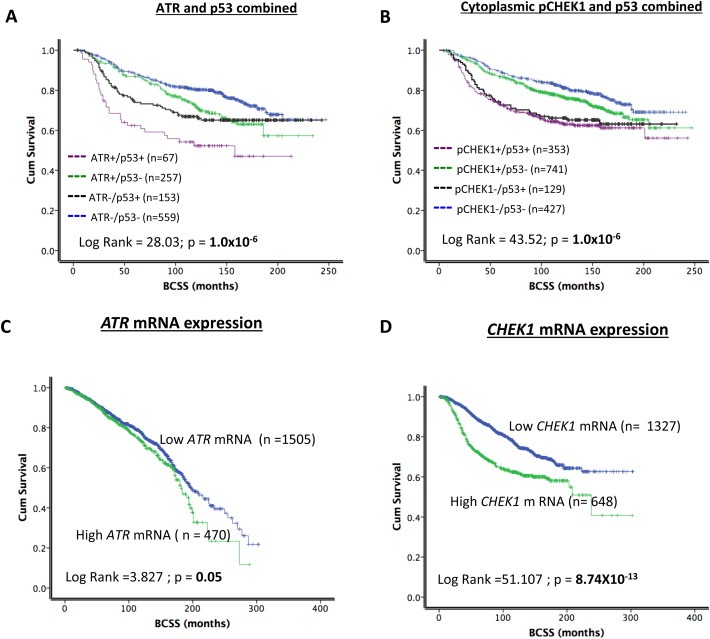
A. Kaplan Meier curves showing breast cancer specific survival (BCSS) and combined p53/ATR level. B. Kaplan Meier curves showing breast cancer specific survival (BCSS) and combined p53/cytoplasmic pCHEK1 level. C. Kaplan Meier curves showing breast cancer specific survival (BCSS) and ATR mRNA expression. D. Kaplan Meier curves showing breast cancer specific survival (BCSS) and CHEK1 mRNA expression.
We then proceeded to various sub‐group analysis in ER+ and ER− breast cancer cohorts (Supplementary Figures 2, 4 and 5). In ER− negative tumours that received no chemotherapy, high ATR remains associated with poor survival (Supplementary Figure 4A1). In ER− negative tumours that received adjuvant chemotherapy, ATR level does not appear to influence survival (Supplementary Figure 4A2 and A3). CHEK1 nuclear level does not influence survival in ER− tumours (Supplementary Figure 2B–D). On the other hand, in ER− negative tumours that received adjuvant chemotherapy (anthracycline or CMF chemotherapy), cytoplasmic pCHEK1 was associated with poor survival (Supplementary Figure 4B2 and B3). Interestingly, whereas, high cytoplasmic pCHEK1 was associated with poor survival after CMF chemotherapy (Supplementary Figure 4B3), low cytoplasmic pCHEK1 was associated with poor survival after anthracycline chemotherapy (Supplementary Figure 4B2). Nuclear pCHEK1 did not influence survival in various sub‐groups (Supplementary Figure 4C). In ER+ tumours, no significance was evident except for nuclear CHEK1 and nuclear pCHEK1, where low level was associated with poor survival to adjuvant endocrine therapy (Supplementary Figures 2E, F, G and 5B3).
3.2.2. Multivariate analysis
High ATR was an independent predictor of worse BCSS in the multivariate analysis (p = 0.006) (Supplementary Table S7). Stage, grade, endocrine therapy, and bcl‐2 level status were other independent markers of poor survival in patients. The level of cytoplasmic or nuclear CHEK1 did not independently influence survival.
3.3. ATR and CHEK1 mRNA expression in breast cancer
The data presented above provides evidence that high ATR and high cytoplasmic pCHEK1 levels have prognostic and predictive significance in breast cancer. To investigate whether high protein level in human tumours is due to transcriptional up‐regulation or due to post‐transcriptional/translational mechanisms, we investigated ATR and CHEK1 mRNA expression in the METABRIC cohort comprising 1950 breast tumours (Curtis et al., 2012).
Interestingly, high ATR mRNA was not significantly associated with any clinicopathological features or survival in the METABRIC cohort (Figure 2C, Supplementary Table S8, Supplementary Figure 6A and C). On the other hand, as shown in Table 3, high CHEK1 mRNA was very highly significantly associated with high T‐stage, high grade, lymph node positivity, high risk Nottingham Prognostic index (NPI) score (>3.4), HER‐2 over expression, ER negative, triple negative, Genefu subtypes (ER−/Her‐2 negative, ER+/Her‐2 negative/high proliferation), PAM50.Her 2, PAM50. Basal, integrative molecular cluster (intClust).1, intClust.5, intClust.9 and intClust.10 phenotypes (all p values <0.01). Patients with tumours that had high CHEK1 mRNA had significantly worse BCSS compared to tumours that had low CHEK1 mRNA expression (p < 00001) (Figure 2D). In ER+ tumours that received adjuvant endocrine therapy, high CHEK1 mRNA was significantly associated with worse BCSS (p < 0.001) (Supplementary Figure 6B). Conversely, in ER− tumours that received adjuvant chemotherapy, high CHEK1 mRNA was not associated with worse BCSS (Supplementary Figure 6D).
Table 3.
CHEK1 mRNA expression and clinico‐pathologic variables in the METABRIC cohort.
| Variable | CHEK1 mRNA expression | p‐value | |
|---|---|---|---|
| Low N (%) | High N (%) | ||
| A) Pathological parameters | |||
| Lymph node stage | |||
| Negative | 746 (56.2%) | 287 (44.3%) | 6.2 × 10 −7 |
| Positive | 581 (43.8%) | 361 (55.7%) | |
| Grade** | |||
| G1 | 159 (12.7%) | 9 (1.4%) | 2.05 × 10−70 |
| G2 | 644 (51.5%) | 125 (19.7%) | |
| G3 | 448 (35.8%) | 502 (78.9%) | |
| Tumour size (cm) | |||
| T 1a + b (1.0) | 73 (5.6%) | 19 (3.0%) | 0.003 |
| T 1c (>1.0–2.0) | 538 (40.9%) | 227 (35.5%) | |
| T2 (>2.0–5) | 641 (48.7%) | 359 (56.1%) | |
| T3 (>5) | 63 (4.8%) | 35 (5.5%) | |
| NPI | |||
| ≤3.4 | 594 (44.8%) | 84 (13.0%) | 2.2 × 10 −44 |
| >3.4 | 733 (55.2%) | 564 (87.0%) | |
| Her2 overexpression (No) | 1220 (91.9%) | 510 (78.7%) | 5.4 × 10 −17 |
| (Yes) | 107 (8.1%) | 138 (21.3%) | |
| Triple negative (No) | 1240 (93.4) | 419 (64.7) | 2.5 × 10 −60 |
| (Yes) | 87 (6.6) | 229 (35.3) | |
| ER (Negative) | 132 (9.9%) | 337 (52.0%) | 1.6 × 10 −98 |
| (Positive) | 1195 (90.1%) | 311 (48.0%) | |
| PgR (Negative) | 497 (25.20%) | 438 (22.2%) | 2.2 × 10 −36 |
| (Positive) | 830 (42.0%) | 210 (10.6%) | |
| Genefu subtype | |||
| ER‐/Her‐2 negative | 38 (5.7%) | 111 (34.4%) | 1.8 × 10 −32 |
| ER+/Her‐2 negative/high proliferation | 227 (33.9%) | 139 (43.0%) | 0.005 |
| ER+/Her‐2 negative/low proliferation | 362 (54.0%) | 6 (1.9%) | 2.9 × 10 −57 |
| Her‐2 positive | 43 (6.4%) | 67 (20.7%) | 1.6 × 10 −11 |
| PAM50 subtype | |||
| PAM50.Her2 | 113 (9.9%) | 125 (19.7%) | 7.3 × 10 −9 |
| PAM50.Basal | 61 (5.4%) | 269 (42.4%) | 3.4 × 10 −82 |
| PAM50.LumA | 670 (58.9%) | 44 (6.9%) | 1.9 × 10 −101 |
| PAM50.LumB | 293 (25.8%) | 196 (30.9%) | 0.020 |
| IntClust subgroups | |||
| intClust.1 | 72 (5.4%) | 65 (10.0%) | 1.5 × 10 −4 |
| intClust.2 | 57 (4.3%) | 15 (2.3%) | 0.027 |
| intClust.3 | 262 (19.7%) | 28 (4.3%) | 9.7 × 10 −20 |
| intClust.4 | 281 (21.2%) | 61 (9.4%) | 8.8 × 10 −11 |
| intClust.5 | 80 (6.0%) | 109 (16.8%) | 1.9 × 10 −14 |
| intClust.6 | 55 (4.1) | 31 (4.8%) | 0.513 |
| intClust.7 | 166 (12.5%) | 23 (3.5%) | 2.07 × 10 −10 |
| intClust.8 | 257 (19.4) | 42 (6.5%) | 6.3 × 10 −14 |
| intClust.9 | 81 (6.1%) | 65 (10.0%) | 0.002 |
| intClust.10 | 16 (01.2%) | 209 (32.3%) | 2.04 × 10 −92 |
Bold = Statistically significant; HER2: human epidermal growth factor receptor 2; ER: oestrogen receptor; PgR: progesterone receptor; Triple negative: ER‐/PgR‐/HER2‐.
3.4. Replication stress induced phosphorylation of CHEK1 at serine345 is ATR dependent in breast cancer cells
Multivariate analysis in human tumours provides evidence that ATR level independently influences survival in patients and is a key biomarker. To provide further preclinical evidence we proceeded to mechanistic studies in breast cancer cell lines. We first generated ATR knockdown (KD) breast cancer cells using an ATR specific siRNA construct. As shown in Figure 3A1 and A2, we achieved more than 80% KD of ATR in MCF7 cells. To induce replication stress, ATR wild type or ATR KD MCF7 cells were treated with 1 μM of gemcitabine or 10 mM of hydroxyurea (HU). Following gemcitabine or HU treatment phosphorylation of CHEK1 at serine345 was impaired in ATR KD cells but not in MCF7 cells treated with scrambled control (Figure 3A1 and A2) These data confirm that CHEK1 phosphorylation is ATR dependent in breast cancer cells. To provide further evidence, we treated MCF7 with VE‐821, a potent and selective ATP competitive inhibitor of ATR (K i = 13 nM) (Charrier et al., 2011). Whereas gemcitabine treatment in the absence of VE‐821 induced robust phosphorylation of CHEK1 at serine345, there was a dose dependent inhibition of CHEK1 phosphorylation by VE‐821 in Gemcitabine treated cells (Figure 3B1, B2 and B3) [IC50 (μM): MCF7 = 3.62 ± 1.94,]. In MDA‐MB‐231 and in non‐tumorigenic breast epithelium cells (MCF10A) we also observed a similar impairment of CHEK1 phosphorylation by VE‐821 (Figure 3B2 and B3) (IC50 (μM) = 0.57 ± 0.30 and 1.16 ± 1.32). Taken together the data confirms that CHEK1 activation is ATR dependent in MCF7, MDA‐MB‐231 and MCF10A cells.
Figure 3.
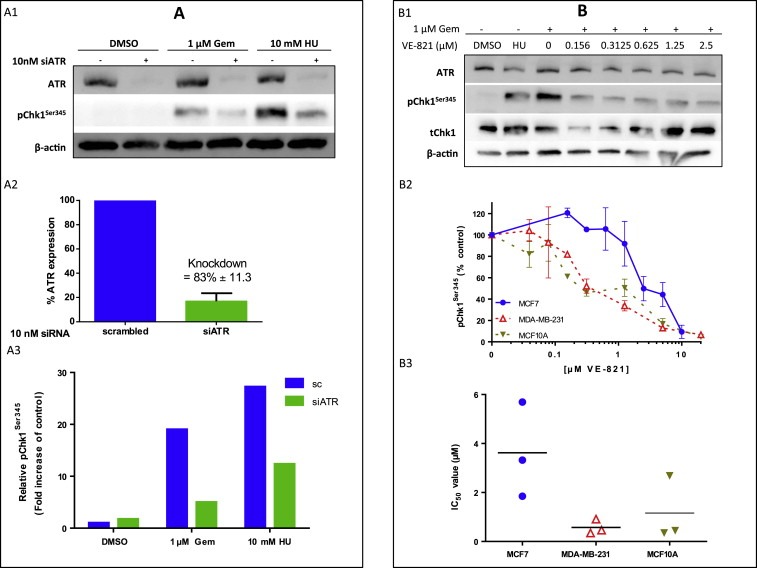
A. ATR is responsible for CHEK1 phosphorylation at serine345 following replication stress. A1. MCF7 cells were subjected to 10 nM siRNA for 48 h before being treated with 1 μM gemcitabine (Gem) or 10 mM hydroxyurea (HU) for 1 h. Cells were harvested, lysed and the proteins separated using gel electrophoresis. ATR, pCHEK1Ser345 and β‐actin were detected using western blotting. Bands were quantified using densitometry (A2 and A3). Figure 3A3 shows data from a single representative experiment where 10 mM hydroxyurea had been used as this is the most frequently used inducer of ATR activity. The data for gemcitabine was a pooled analysis of three independent experiments. * = significant. See text for details. B. VE‐821 inhibits gemcitabine‐induced ATR activity as measured by pCHEK1Ser345. MCF7, MDA‐MB‐231 or MCF10A cells were treated with 1 μM gemcitabine ± VE‐821 for 1 h before being harvested and lysed. Proteins were separated and detected using western blotting. Blot shown is in MDA‐MB‐231 cells and is representative of all experiments (B1). Concentration‐response curve (B2) data shown is the mean ± standard deviation of three individual experiments in each cell line. IC50 values from the 3 independent experiments are shown in B3.
3.5. ATR is required for breast cancer cell growth
To investigate whether ATR depletion has biological consequences in cells, we generated stable ATR KD MCF7 cells using doxycycline inducible shRNA. Following 3 days of treatment with doxycycline, robust KD of ATR was evident (Figure 4A1). Doxycycline was then removed and cells were monitored for growth and ATR protein level over 11 days. As shown in Figure 4A1 and A2, ATR depletion arrested cell growth. However upon re‐expression of ATR, cell growth was restored. Doxycycline treatment alone in un‐transfected MCF7 cells had no effect (Supplementary Figure 7A).
Figure 4.
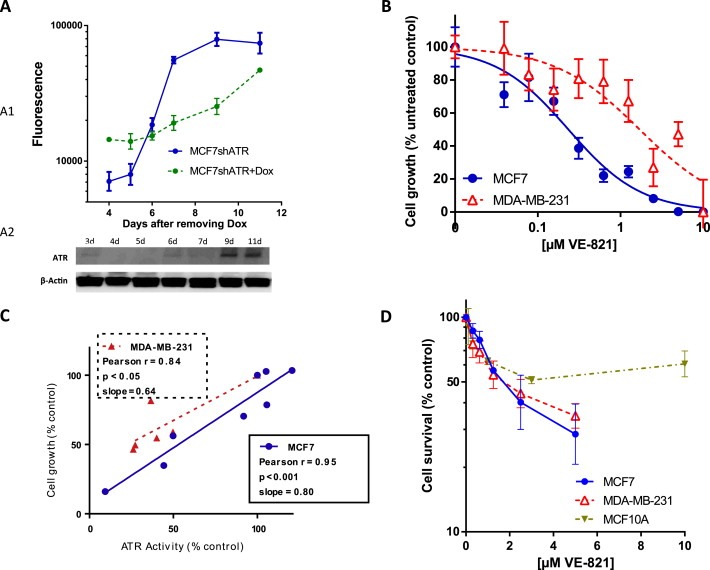
ATR is required for cell growth in MCF7 cells. Cells with doxycycline (Dox) – inducible shATR were incubated with or without Dox for 3 days. Then Dox was removed and cells were cultured for further indicated days. Cell growth was analysed using DAPI fluorescence (A1). ATR level was monitored by western blotting (A2). Knockdown of ATR following Dox induction suppressed growth, which was restored when ATR was re‐expressed. B. ATR inhibitor VE‐821 reduces breast cancer cell growth. MCF7 or MDA‐MB‐231 were treated for 24 h with a dose range of VE‐821. Cells were then allowed to grow for 5 days in fresh media. Cell growth was measured by DAPI fluorescence. C. There was a direct correlation between growth inhibition and ATR inhibition in MCF7 and MDA‐MB‐231 cells. D. VE‐821 is selective against breast cancer cells compared to non‐cancer cells. MCF7, MDA‐MB‐231 and MCF10A cells were seeded into 6‐well tissue culture plates and allowed to adhere for 24 h. Cells were treated with VE‐821 for 24 h before being counted and re‐seeded for colony formation. Cells were then allowed to grow for 14 days. Colonies were then fixed, stained and counted.
We then investigated the effect of VE‐821 in breast cancer cells. As shown in Figure 4B, a dose dependent suppression of cell growth was evident in MCF7 (GI50 = 0.25 μM) and in MDA‐MB‐231 cells (GI50 = 1.70 μM). There was also a significant direct correlation between growth inhibition and ATR inhibition in MCF7 and MDA‐MB‐231 cells (Figure 4C). To investigate whether VE‐821 has selective toxicity to cancer cells, we performed clonogenic cell survival assays in MCF7, MDA‐MB‐231 and MCF10A cells. Whereas LC50 (concentration needed to kill 50% of cells) was 1.89 ± 0.81 (μM) and 1.93 ± 0.93 (μM) for MCF7 and MDA‐MB‐231 cells, the LC50 was >10 μM for MCF10A cells suggesting that VE‐821 was relatively less toxic to non‐tumourigenic breast epithelial cells (Figure 4D). To clarify whether the data may reflect non‐cycling MCF10A cells, we conducted growth assay and demonstrated that MCF10A cells grow at the same rate as MCF7 cells (Supplementary Figure 7B).
Taken together the preclinical study provides evidence that ATR is essential for breast cancer growth and survival. In addition, the data concurs with the clinical study presented here that demonstrated ATR overexpression as an independent prognostic factor in breast cancer.
4. Discussion
ATR, an essential factor for genomic integrity, is activated by replication stress or genotoxic DNA damage in cells. Activated ATR in turn phosphorylates CHEK1 at Ser345 (pCHEK1) resulting in regulation of cell cycle progression and DNA repair (Flynn and Zou, 2011; Marechal and Zou, 2013; Nam and Cortez, 2011; Sorensen and Syljuasen, 2012). We hypothesised a role for ATR‐CHEK1 pathway in breast cancer pathogenesis and survival. This is the first study to comprehensively investigate ATR and pCHEK1 in large cohorts of breast cancers. The data presented here provides compelling evidence that ATR and pCHEK1 have prognostic and predictive significance in breast cancer.
CHEK1 is a key mediator of checkpoint regulation, genomic stability and cellular survival (Bartek and Lukas, 2003; Meuth, 2010; Smith et al., 2010; Zhang and Hunter, 2014). Emerging evidence suggests that CHEK1 undergoes alterations in sub‐cellular localisation in response to DNA damage (Wang et al., 2012). Under normal conditions, CHEK1 is localized to the nucleus. Upon DNA damage, ATR induced phosphorylation of CHEK1 results in rapid localization to the cytoplasm (Wang et al., 2012). Nuclear CHEK1 is known to activate RAD‐51 dependent DNA repair whereas cytoplasmic CHEK1 may be involved in cytoplasmic downstream checkpoint events (Reinhardt et al., 2010; Reinhardt and Yaffe, 2009). CHEK1 phosphorylated at serine345 is known to accumulate in the cytoplasm (Niida et al., 2007). In breast tumours, CHEK1 staining is purely nuclear and we did not observe any cytoplasmic staining. We found that low nuclear CHEK1 was associated with aggressive phenotypes [high grade, high mitotic index, de‐differentiation, pleomorphism, HER‐2 over expression, low expression of DNA repair markers (including BRCA1, XRCC1, FEN1, pol β and DNA‐PKcs)]. Low nuclear CHEK1 was associated with poor breast cancer specific survival (whole cohort as well as in ER+ tumours). In ER− tumours, CHEK1 levels did not influence survival. Interestingly at the mRNA level, high CHEK1 was associated with poor survival in the whole cohort and in ER+ sub‐group. In ER− tumours, CHEK1 mRNA did not influence survival. Given the complex data, we speculated that pCHEK1 which is a marker of activated CHEK1 and a functional ATR pathway may be a more reliable as biomarker. To address whether cytoplasmic or nuclear pCHEK1 has clinicopathological significance in breast cancer, we evaluated pCHEK1 level in the nucleus as well as in the cytoplasm of breast tumour cells. The data presented here provides evidence that high levels of cytoplasmic pCHEK1 is associated with aggressive features such as high grade, higher mitotic index including association with high MIB1, pleomorphism, triple negative, basal‐like phenotype and poor survival. The data would concur with preclinical observation that suggest a genomic instability phenotype for cells that sequester CHEK1 in the cytoplasm thereby driving a mutator phenotype characterised by aggressive pathology and clinical behaviour (Puc et al., 2005). Interestingly, low nuclear CHEK1 and low nuclear pCHEK1 levels also appear to be associated with lower grade, lower mitotic index, better differentiated tumours and poor survival providing further supportive evidence for a mutator phenotype. Moreover, nuclear pCHEK1 overexpressing tumours are likely to be ER+ and frequently associated with high levels of DNA repair proteins such as BRCA1, XRCC1, FEN1, SMUG1, APE1, polymerase beta and DNA‐PKcs. The data would concur with preclinical observations suggesting a genomic stability role for nuclear CHEK1. Combined analysis also showed that tumours with high cytoplasmic/low nuclear pCHEK1 tumours have the worst survival compared with low cytoplasmic/high nuclear tumours implying that altered sub‐cellular localisation of CHEK1 has clinicopathological significance. Although the data presented here suggests that pCHEK1 level may be an important biomarker of functional ATR‐CHEK1 pathway, evaluation of further downstream markers such as CDC25 a key substrate for cytoplasmic pCHEK1 (Xiao et al., 2003) may provide additional insights and could be a focus of future investigations. Of note we have investigated the level of CDK1, a substrate of Cdc25 and have provided evidence that high cytoplasmic pCHEK1 may be associated with high CDK1 level albeit with borderline significance. A striking observation in the current study was that CHEK1 mRNA overexpression was very highly significantly associated with aggressive phenotypes (such as lymph node positivity, high grade, high risk NPI score, ER+ luminal phenotype, Her‐2 overexpression, triple negative phenotype) and poor survival. CHEK1 mRNA expression was also linked to biologically distinct integrative clusters reported in the METABRIC study. High CHEK1 mRNA level was frequent in intClust 10 subgroup which is the most highly genomically instable sub group with basal‐like features. Whereas low CHEK1 mRNA expression was seen in intClust 3 subgroup that is characterised by low genomic instability. In addition, high CHEK mRNA level is also frequently seen in intClust 5 (HER‐2 enriched with worst survival), intClust 9 (8q cis‐acting/20qamplified mixed subgroup), and intClust 1 (17q23/20q cis‐acting luminal B subgroup) subgroups that also manifest an aggressive phenotype. On the other hand, low CHEK1 mRNA expression was linked to intClust 4 (includes both ER‐positive and ER‐negative cases with a flat copy number landscape and termed the ‘CNA‐devoid’ subgroup with extensive lymphocytic infiltration), intClust 7 (16p gain/16q loss with higher frequencies of 8q amplification luminal A subgroup) and intClust 8 subgroups (classical 1q gain/16q loss luminal A subgroup) (Curtis et al., 2012). High CHEK1 mRNA was associated with poor survival in the METABRIC cohort. Interestingly, intClust 10, intClust 9, intClust 5 and intClust 1 sub‐groups that are associated with high CHEK1 levels were also associated with poor prognosis in METABRIC study (Curtis et al., 2012). In contrast, intClust 3, intClust 4, intClust 7 and intClust 8 that are associated with low CHEK1 expression, are associated with good to intermediate prognosis. In a study in triple negative breast cancer, CHEK1 was found to be overexpressed by transcriptional up‐regulation through E2F1 Transcription factor (Verlinden et al., 2007). At the protein level, however, we found that low non‐phosphorylated CHEK1 level was associated with poor outcome whereas high pCHEK1 level was associated with poor prognosis in the current study. Together the data suggest that further studies are required to clarify the role of CHEK1 expression in breast cancer.
A surprising observation in the METABRIC cohort was that ATR mRNA expression was not associated with any adverse clinicopathological features or survival implying, that high ATR protein level is likely due to post‐transcriptional/translational mechanisms. High ATR protein level was associated with aggressive tumours (such as high grade, size, higher mitotic index, pleomorphism) and poor survival. As proficient ATR and pCHEK1 indicate a functional ATR‐CHEK1 signalling pathway in cells, we performed combined analysis and demonstrated that tumours that are high ATR/high cytoplasmic pCHEK1/low nuclear CHEK1 have the most aggressive phenotype and the worst survival.
Preclinical data provide a link between p53 and ATR‐CHEK1 network (Hammond et al., 2002; Derheimer et al., 2007). Loss of p53 may lead to increased replication stress and influence ATR/CHEK1 levels (Hammond et al., 2002; Derheimer et al., 2007). Interestingly, p53 deficient tumours appear to be sensitive to blockade by ATR or CHEK1 inhibitors (Reaper et al., 2011). In the current study, although there was no association with p53 mutation, low MDM2 was more likely in tumours with high ATR expression/high cytoplasmic pCHEK1 level/low nuclear pCHEK1 expressing tumours. We also demonstrate that ATR high/p53 mutants and CHEK1 high/p53 mutants have the worst survival compared to that ATR low/p53 wild type and CHEK1 high/p53 wild type. The data suggest that such breast cancer would be particularly suitable for personalized therapy.
An unexpected finding in the current study was a lack of clear evidence for predictive significance of ATR or CHEK1 in breast cancer patients receiving adjuvant chemotherapy. At the mRNA level ATR or CHEK1, did not influence survival in ER− negative tumours receiving chemotherapy. At the protein level, only high cytoplasmic pCHEK1 level appears to be associated with worse survival in patients treated with CMF (cyclophosphamide, methotrexate and 5‐fluorouracil) chemotherapy. Surprisingly, low cytoplasmic pCHEK1 was associated with poor survival in patients receiving anthracycline chemotherapy. This is in contrast to previous pre‐clinical observation suggesting anthracycline sensitivity in CHEK1 deficient cancer cell lines. Therefore further clinical studies are required to confirm these observations.
In the multivariate model, high ATR level was independently associated with worse BCSS implying that ATR is an important prognostic biomarker in breast cancer. To provide additional evidence, we investigated in breast cancer cell lines. The preclinical data presented here provides additional evidence that pCHEK1s345 is a specific marker of ATR activity and clinically we have validated this marker. Pre‐clinically, hydroxyurea (HU) is the most commonly used inducer of ATR activity but is not commonly used in breast cancer treatment. We therefore also validated our findings using gemcitabine that is frequently used for the treatment of breast cancers. Firstly, we showed that ATR was directly involved in phosphorylation of CHEK1 at serine345 in breast cancer cells. Secondly, ATR knock down reduced cell proliferation. Thirdly, VE‐821, a specific and potent small molecule inhibitor of ATR not only blocked ATR induced CHEK1 phosphorylation but also reduced breast cancer cell survival in a concentration dependent manner. Taken together, the clinical and pre‐clinical data provides compelling evidence that ATR is a promising target for anti‐cancer therapy.
In conclusion, we provide confirmatory evidence that ATR‐CHEK1 influences breast cancer pathogenesis and clinical outcomes. Our data would support accelerated evaluation of ATR and CHEK1 inhibitors currently under clinical development for personalized therapy in breast cancer patients.
Competing interests
Fiona K Middleton and Nicola J Curtin are in receipt of research funding from Vertex Pharmaceuticals. All other authors have declared no conflicts of interest.
Authors' contributions
TA.F., S.M. provided intellectual input, conceptual framework, designed the study and helped writing the manuscript. T.A.F, A.A., C.P., and R.D., collected protein expression data, performed data analysis and helped writing the manuscript. S.C., A.R.G., E.R., performed data analysis and helped writing the manuscript. D.A., G.B., performed gene expression analysis in the METABRIC cohort. F.K.M., T.C., N.J.C performed cell based experiments. All authors reviewed and approved the final version of the manuscript.
Supporting information
The following are the supplementary data related to this article:
Supplementary Figure 1 Representative histograms of clinicopathological associations between ATR and cytoplasmic pCHEK1 expression.
Supplementary Figure 2 Kaplan Meier curves showing breast cancer specific survival (BCSS) in Nottingham Cohort (protein expression). A. CHEK1 and BCSS. B. ER−, NPI > 3.4 and BCSS. C. ER−, NPI > 3.4, no chemotherapy and BCSS. D. ER−, NPI > 3.4, chemotherapy and BCSS.E. ER+, NPI > 3.4 and BCSS. F. ER+, NPI > 3.4, no endocrine therapy and BCSS. G. ER+, NPI > 3.4, tamoxifen therapy and BCSS.
Supplementary Figure 3 Kaplan Meier curves showing breast cancer specific survival (BCSS) in Nottingham Cohort (protein expression). A. Nuclear pChk1 and BCSS. B. Nuclear pChk1 and p53 combined and BCSS.
Supplementary Figure 4 Kaplan Meier curves showing breast cancer specific survival (BCSS) in Nottingham Cohort (protein expression). A. ATR and BCSS [A1. ER−, NPI > 3.4, no chemotherapy, A2. ER−, NPI > 3.4, anthracycline chemotherapy, A3. ER−, NPI > 3.4, CMF chemotherapy]. B. Cytoplasmic pChk1 and BCSS [B1. ER−, NPI > 3.4, no chemotherapy, B2. ER−, NPI > 3.4, anthracycline chemotherapy, B3. ER−, NPI > 3.4, CMF chemotherapy]. C. Nuclear pChk1 and BCSS [C1. ER−, NPI > 3.4, no chemotherapy, C2. ER−, NPI > 3.4, anthracycline chemotherapy, C3. ER−, NPI > 3.4, CMF chemotherapy].
Supplementary Figure 5 Kaplan Meier curves showing breast cancer specific survival (BCSS) in Nottingham Cohort (protein expression). A. ER+, NPI > 3.4, no adjuvant endocrine therapy [A1. ATR, A2. Cytoplasmic pChk1, A3. Nuclear pChk1. B. ER+, NPI > 3.4, received adjuvant endocrine therapy [B1. ATR, B2. Cytoplasmic pChk1, B3. Nuclear pChk1].
Supplementary Figure 6 Kaplan Meier curves showing breast cancer specific survival (BCSS) in METABRIC Cohort (mRNA expression). A. ER+, ATR mRNA (received endocrine therapy). B. ER+, Chk1 mRNA (received endocrine therapy). C. ER−, ATR mRNA (received chemotherapy). D. ER−, Chk1 mRNA (received chemotherapy).
Supplementary Figure 7 A. Doxycycline (Dox) had no effect on untransfected MCF7 cells. B. MCF10A and MCF7 cells grow at the same rate.
Supplementary data
Supplementary data 1.
1.1.
Supplementary data related to this article can be found at http://dx.doi.org/10.1016/j.molonc.2014.10.013.
Abdel-Fatah Tarek M.A., Middleton Fiona K., Arora Arvind, Agarwal Devika, Chen Tao, Moseley Paul M., Perry Christina, Doherty Rachel, Chan Stephen, Green Andrew R., Rakha Emad, Ball Graham, Ellis Ian O., Curtin Nicola J., Madhusudan Srinivasan, (2015), Untangling the ATR‐CHEK1 network for prognostication, prediction and therapeutic target validation in breast cancer, Molecular Oncology, 9, doi: 10.1016/j.molonc.2014.10.013.
References
- Abdel-Fatah, T.M. , Albarakati, N. , Bowell, L. , Agarwal, D. , Moseley, P. , Hawkes, C. , Ball, G. , Chan, S. , Ellis, I.O. , Madhusudan, S. , 2013. Single-strand selective monofunctional uracil-DNA glycosylase (SMUG1) deficiency is linked to aggressive breast cancer and predicts response to adjuvant therapy. Breast Cancer Res. Treat. 142, 515–527. [DOI] [PubMed] [Google Scholar]
- Abdel-Fatah, T.M. , Perry, C. , Dickinson, P. , Ball, G. , Moseley, P. , Madhusudan, S. , Ellis, I.O. , Chan, S.Y. , 2013. Bcl2 is an independent prognostic marker of triple negative breast cancer (TNBC) and predicts response to anthracycline combination (ATC) chemotherapy (CT) in adjuvant and neoadjuvant settings. Ann. Oncol. 24, 2801–2807. [DOI] [PubMed] [Google Scholar]
- Abdel-Fatah, T.M. , Perry, C. , Moseley, P. , Johnson, K. , Arora, A. , Chan, S. , Ellis, I.O. , Madhusudan, S. , 2014. Clinicopathological significance of human apurinic/apyrimidinic endonuclease 1 (APE1) expression in oestrogen-receptor-positive breast cancer. Breast Cancer Res. Treat. 143, 411–421. [DOI] [PubMed] [Google Scholar]
- Abdel-Fatah, T.M. , Russell, R. , Agarwal, D. , Moseley, P. , Abayomi, M.A. , Perry, C. , Albarakati, N. , Ball, G. , Chan, S. , Caldas, C. , Ellis, I.O. , Madhusudan, S. , 2014. DNA polymerase beta deficiency is linked to aggressive breast cancer: a comprehensive analysis of gene copy number, mRNA and protein expression in multiple cohorts. Mol. Oncol. 8, 520–532. [DOI] [PMC free article] [PubMed] [Google Scholar]
- Abdel-Fatah, T.M. , Russell, R. , Albarakati, N. , Maloney, D.J. , Dorjsuren, D. , Rueda, O.M. , Moseley, P. , Mohan, V. , Sun, H. , Abbotts, R. , Mukherjee, A. , Agarwal, D. , Illuzzi, J.L. , Jadhav, A. , Simeonov, A. , Ball, G. , Chan, S. , Caldas, C. , Ellis, I.O. , Wilson, D.M. , Madhusudan, S. , 2014. Genomic and protein expression analysis reveals flap endonuclease 1 (FEN1) as a key biomarker in breast and ovarian cancer. Mol. Oncol. 8, 1326–1338. [DOI] [PMC free article] [PubMed] [Google Scholar]
- Alderton, G.K. , Joenje, H. , Varon, R. , Borglum, A.D. , Jeggo, P.A. , O'Driscoll, M. , 2004. Seckel syndrome exhibits cellular features demonstrating defects in the ATR-signalling pathway. Hum. Mol. Genet. 13, 3127–3138. [DOI] [PubMed] [Google Scholar]
- Bartek, J. , Lukas, J. , 2003. Chk1 and Chk2 kinases in checkpoint control and cancer. Cancer Cell. 3, 421–429. [DOI] [PubMed] [Google Scholar]
- Carrassa, L. , Damia, G. , 2011. Unleashing Chk1 in cancer therapy. Cell Cycle. 10, 2121–2128. [DOI] [PubMed] [Google Scholar]
- Charrier, J.D. , Durrant, S.J. , Golec, J.M. , Kay, D.P. , Knegtel, R.M. , MacCormick, S. , Mortimore, M. , O'Donnell, M.E. , Pinder, J.L. , Reaper, P.M. , Rutherford, A.P. , Wang, P.S. , Young, S.C. , Pollard, J.R. , 2011. Discovery of potent and selective inhibitors of ataxia telangiectasia mutated and Rad3 related (ATR) protein kinase as potential anticancer agents. J. Med. Chem. 54, 2320–2330. [DOI] [PubMed] [Google Scholar]
- Chen, T. , Stephens, P.A. , Middleton, F.K. , Curtin, N.J. , 2012. Targeting the S and G2 checkpoint to treat cancer. Drug Discov. Today. 17, 194–202. [DOI] [PubMed] [Google Scholar]
- Curtis, C. , Shah, S.P. , Chin, S.F. , Turashvili, G. , Rueda, O.M. , Dunning, M.J. , Speed, D. , Lynch, A.G. , Samarajiwa, S. , Yuan, Y. , Graf, S. , Ha, G. , Haffari, G. , Bashashati, A. , Russell, R. , McKinney, S. , Langerod, A. , Green, A. , Provenzano, E. , Wishart, G. , Pinder, S. , Watson, P. , Markowetz, F. , Murphy, L. , Ellis, I. , Purushotham, A. , Borresen-Dale, A.L. , Brenton, J.D. , Tavare, S. , Caldas, C. , Aparicio, S. , 2012. The genomic and transcriptomic architecture of 2,000 breast tumours reveals novel subgroups. Nature. 486, 346–352. [DOI] [PMC free article] [PubMed] [Google Scholar]
- Derheimer, F.A. , O'Hagan, H.M. , Krueger, H.M. , Hanasoge, S. , Paulsen, M.T. , Ljungman, M. , 2007. RPA and ATR link transcriptional stress to p53. Proc. Natl. Acad. Sci. U. S. A. 104, 12778–12783. [DOI] [PMC free article] [PubMed] [Google Scholar]
- Flynn, R.L. , Zou, L. , 2011. ATR: a master conductor of cellular responses to DNA replication stress. Trends Biochem. Sci. 36, 133–140. [DOI] [PMC free article] [PubMed] [Google Scholar]
- Fokas, E. , Prevo, R. , Hammond, E.M. , Brunner, T.B. , McKenna, W.G. , Muschel, R.J. , 2014. Targeting ATR in DNA damage response and cancer therapeutics. Cancer Treat Rev. 40, 109–117. [DOI] [PubMed] [Google Scholar]
- Hammond, E.M. , Denko, N.C. , Dorie, M.J. , Abraham, R.T. , Giaccia, A.J. , 2002. Hypoxia links ATR and p53 through replication arrest. Mol. Cell Biol. 22, 1834–1843. [DOI] [PMC free article] [PubMed] [Google Scholar]
- Lin, W.Y. , Brock, I.W. , Connley, D. , Cramp, H. , Tucker, R. , Slate, J. , Reed, M.W. , Balasubramanian, S.P. , Cannon-Albright, L.A. , Camp, N.J. , Cox, A. , 2013. Associations of ATR and CHEK1 single nucleotide polymorphisms with breast cancer. PLoS One. 8, e68578 [DOI] [PMC free article] [PubMed] [Google Scholar]
- Marechal, A. , Zou, L. , 2013. DNA damage sensing by the ATM and ATR kinases. Cold Spring Harb. Perspect. Biol. 5, [DOI] [PMC free article] [PubMed] [Google Scholar]
- McShane, L.M. , Altman, D.G. , Sauerbrei, W. , Taube, S.E. , Gion, M. , Clark, G.M. , 2005. Reporting recommendations for tumor marker prognostic studies (REMARK). J. Natl. Cancer Inst. 97, 1180–1184. [DOI] [PubMed] [Google Scholar]
- Merry, C. , Fu, K. , Wang, J. , Yeh, I.J. , Zhang, Y. , 2010. Targeting the checkpoint kinase Chk1 in cancer therapy. Cell Cycle. 9, 279–283. [DOI] [PMC free article] [PubMed] [Google Scholar]
- Meuth, M. , 2010. Chk1 suppressed cell death. Cell Div. 5, 21 [DOI] [PMC free article] [PubMed] [Google Scholar]
- Nam, E.A. , Cortez, D. , 2011. ATR signalling: more than meeting at the fork. Biochem. J. 436, 527–536. [DOI] [PMC free article] [PubMed] [Google Scholar]
- Niida, H. , Katsuno, Y. , Banerjee, B. , Hande, M.P. , Nakanishi, M. , 2007. Specific role of Chk1 phosphorylations in cell survival and checkpoint activation. Mol. Cell Biol. 27, 2572–2581. [DOI] [PMC free article] [PubMed] [Google Scholar]
- Puc, J. , Keniry, M. , Li, H.S. , Pandita, T.K. , Choudhury, A.D. , Memeo, L. , Mansukhani, M. , Murty, V.V. , Gaciong, Z. , Meek, S.E. , Piwnica-Worms, H. , Hibshoosh, H. , Parsons, R. , 2005. Lack of PTEN sequesters CHK1 and initiates genetic instability. Cancer Cell. 7, 193–204. [DOI] [PubMed] [Google Scholar]
- Reaper, P.M. , Griffiths, M.R. , Long, J.M. , Charrier, J.D. , Maccormick, S. , Charlton, P.A. , Golec, J.M. , Pollard, J.R. , 2011. Selective killing of ATM- or p53-deficient cancer cells through inhibition of ATR. Nat. Chem. Biol. 7, 428–430. [DOI] [PubMed] [Google Scholar]
- Reinhardt, H.C. , Hasskamp, P. , Schmedding, I. , Morandell, S. , van Vugt, M.A. , Wang, X. , Linding, R. , Ong, S.E. , Weaver, D. , Carr, S.A. , Yaffe, M.B. , 2010. DNA damage activates a spatially distinct late cytoplasmic cell-cycle checkpoint network controlled by MK2-mediated RNA stabilization. Mol. Cell. 40, 34–49. [DOI] [PMC free article] [PubMed] [Google Scholar]
- Reinhardt, H.C. , Yaffe, M.B. , 2009. Kinases that control the cell cycle in response to DNA damage: Chk1, Chk2, and MK2. Curr. Opin. Cell Biol. 21, 245–255. [DOI] [PMC free article] [PubMed] [Google Scholar]
- Smith, J. , Tho, L.M. , Xu, N. , Gillespie, D.A. , 2010. The ATM-Chk2 and ATR-Chk1 pathways in DNA damage signaling and cancer. Adv. Cancer Res. 108, 73–112. [DOI] [PubMed] [Google Scholar]
- Sorensen, C.S. , Syljuasen, R.G. , 2012. Safeguarding genome integrity: the checkpoint kinases ATR, CHK1 and WEE1 restrain CDK activity during normal DNA replication. Nucleic Acids Res. 40, 477–486. [DOI] [PMC free article] [PubMed] [Google Scholar]
- Sultana, R. , Abdel-Fatah, T. , Abbotts, R. , Hawkes, C. , Albarakati, N. , Seedhouse, C. , Ball, G. , Chan, S. , Rakha, E.A. , Ellis, I.O. , Madhusudan, S. , 2013. Targeting XRCC1 deficiency in breast cancer for personalized therapy. Cancer Res. 73, 1621–1634. [DOI] [PubMed] [Google Scholar]
- Verlinden, L. , Vanden Bempt, I. , Eelen, G. , Drijkoningen, M. , Verlinden, I. , Marchal, K. , De Wolf-Peeters, C. , Christiaens, M.R. , Michiels, L. , Bouillon, R. , Verstuyf, A. , 2007. The E2F-regulated geneChk1 is highly expressed in triple-negative estrogen receptor/progesterone receptor/HER-2 breast carcinomas. Cancer Res. 67, 6574–6581. [DOI] [PubMed] [Google Scholar]
- Wang, J. , Han, X. , Feng, X. , Wang, Z. , Zhang, Y. , 2012. Coupling cellular localization and function of checkpoint kinase 1 (Chk1) in checkpoints and cell viability. J. Biol. Chem. 287, 25501–25509. [DOI] [PMC free article] [PubMed] [Google Scholar]
- Wolff, A.C. , Hammond, M.E. , Hicks, D.G. , Dowsett, M. , McShane, L.M. , Allison, K.H. , Allred, D.C. , Bartlett, J.M. , Bilous, M. , Fitzgibbons, P. , Hanna, W. , Jenkins, R.B. , Mangu, P.B. , Paik, S. , Perez, E.A. , Press, M.F. , Spears, P.A. , Vance, G.H. , Viale, G. , Hayes, D.F. , 2013. Recommendations for human epidermal growth factor receptor 2 testing in breast cancer: American Society of Clinical Oncology/College of American Pathologists clinical practice guideline update. J. Clin. Oncol. 31, 3997–4013. [DOI] [PubMed] [Google Scholar]
- Xiao, Z. , Chen, Z. , Gunasekera, A.H. , Sowin, T.J. , Rosenberg, S.H. , Fesik, S. , Zhang, H. , 2003. Chk1 mediates S and G2 arrests through Cdc25A degradation in response to DNA-damaging agents. J. Biol. Chem. 278, 21767–21773. [DOI] [PubMed] [Google Scholar]
- Zhang, Y. , Hunter, T. , 2014. Roles of Chk1 in cell biology and cancer therapy. Int. J. Cancer. 134, 1013–1023. [DOI] [PMC free article] [PubMed] [Google Scholar]
Associated Data
This section collects any data citations, data availability statements, or supplementary materials included in this article.
Supplementary Materials
The following are the supplementary data related to this article:
Supplementary Figure 1 Representative histograms of clinicopathological associations between ATR and cytoplasmic pCHEK1 expression.
Supplementary Figure 2 Kaplan Meier curves showing breast cancer specific survival (BCSS) in Nottingham Cohort (protein expression). A. CHEK1 and BCSS. B. ER−, NPI > 3.4 and BCSS. C. ER−, NPI > 3.4, no chemotherapy and BCSS. D. ER−, NPI > 3.4, chemotherapy and BCSS.E. ER+, NPI > 3.4 and BCSS. F. ER+, NPI > 3.4, no endocrine therapy and BCSS. G. ER+, NPI > 3.4, tamoxifen therapy and BCSS.
Supplementary Figure 3 Kaplan Meier curves showing breast cancer specific survival (BCSS) in Nottingham Cohort (protein expression). A. Nuclear pChk1 and BCSS. B. Nuclear pChk1 and p53 combined and BCSS.
Supplementary Figure 4 Kaplan Meier curves showing breast cancer specific survival (BCSS) in Nottingham Cohort (protein expression). A. ATR and BCSS [A1. ER−, NPI > 3.4, no chemotherapy, A2. ER−, NPI > 3.4, anthracycline chemotherapy, A3. ER−, NPI > 3.4, CMF chemotherapy]. B. Cytoplasmic pChk1 and BCSS [B1. ER−, NPI > 3.4, no chemotherapy, B2. ER−, NPI > 3.4, anthracycline chemotherapy, B3. ER−, NPI > 3.4, CMF chemotherapy]. C. Nuclear pChk1 and BCSS [C1. ER−, NPI > 3.4, no chemotherapy, C2. ER−, NPI > 3.4, anthracycline chemotherapy, C3. ER−, NPI > 3.4, CMF chemotherapy].
Supplementary Figure 5 Kaplan Meier curves showing breast cancer specific survival (BCSS) in Nottingham Cohort (protein expression). A. ER+, NPI > 3.4, no adjuvant endocrine therapy [A1. ATR, A2. Cytoplasmic pChk1, A3. Nuclear pChk1. B. ER+, NPI > 3.4, received adjuvant endocrine therapy [B1. ATR, B2. Cytoplasmic pChk1, B3. Nuclear pChk1].
Supplementary Figure 6 Kaplan Meier curves showing breast cancer specific survival (BCSS) in METABRIC Cohort (mRNA expression). A. ER+, ATR mRNA (received endocrine therapy). B. ER+, Chk1 mRNA (received endocrine therapy). C. ER−, ATR mRNA (received chemotherapy). D. ER−, Chk1 mRNA (received chemotherapy).
Supplementary Figure 7 A. Doxycycline (Dox) had no effect on untransfected MCF7 cells. B. MCF10A and MCF7 cells grow at the same rate.
Supplementary data