

Abstract
Both Myc and Ras oncogenes impact cellular metabolism, deregulate redox homeostasis and trigger DNA replication stress (RS) that compromises genomic integrity. However, how are such oncogene‐induced effects evoked and temporally related, to what extent are these kinetic parameters shared by Myc and Ras, and how are these cellular changes linked with oncogene‐induced cellular senescence in different cell context(s) remain poorly understood. Here, we addressed the above‐mentioned open questions by multifaceted comparative analyses of human cellular models with inducible expression of c‐Myc and H‐RasV12 (Ras), two commonly deregulated oncoproteins operating in a functionally connected signaling network. Our study of DNA replication parameters using the DNA fiber approach and time‐course assessment of perturbations in glycolytic flux, oxygen consumption and production of reactive oxygen species (ROS) revealed the following results. First, overabundance of nuclear Myc triggered RS promptly, already after one day of Myc induction, causing slow replication fork progression and fork asymmetry, even before any metabolic changes occurred. In contrast, Ras overexpression initially induced a burst of cell proliferation and increased the speed of replication fork progression. However, after several days of induction Ras caused bioenergetic metabolic changes that correlated with slower DNA replication fork progression and the ensuing cell cycle arrest, gradually leading to senescence. Second, the observed oncogene‐induced RS and metabolic alterations were cell‐type/context dependent, as shown by comparative analyses of normal human BJ fibroblasts versus U2‐OS sarcoma cells. Third, the energy metabolic reprogramming triggered by Ras was more robust compared to impact of Myc. Fourth, the detected oncogene‐induced oxidative stress was due to ROS (superoxide) of non‐mitochondrial origin and mitochondrial OXPHOS was reduced (Crabtree effect). Overall, our study provides novel insights into oncogene‐evoked metabolic reprogramming, replication and oxidative stress, with implications for mechanisms of tumorigenesis and potential targeting of oncogene addiction.
Keywords: Myc, Ras, Replication stress, DNA fork progression, Energy metabolism, DNA damage response
Highlights
Ras and Myc oncogenes induce replication stress, yet with distinct kinetics.
Myc‐induced replication stress precedes alterations in energy metabolism.
Oncogene‐induced oxidative stress reflects non‐mitochondrial ROS.
Oncogene‐evoked metabolic alterations are cell‐type/context‐dependent.
Ras reprograms bioenergetic metabolism more robustly than Myc.
Abbreviations
- DDR
DNA damage response
- ROS
reactive oxygen species
- CIN
chromosome instability
- RS
replication stress
- FBS
fetal bovine serum
- 4‐OHT
4‐hydroxytamoxifen
- Dox
doxycycline
- OCR
oxygen consumption rate
- ECAR
extracellular acidification rate
- oxoG
8‐oxoguanine
- OIS
oncogene‐induced senescence
- CFS
common fragile sites
- OXPHOS
oxidative phosphorylation
- NADPH
nicotinamide adenine dinucleotide phosphate
- ATP
adenosinetriphosphate
- DHE
dihydroethidium
- dNTP
deoxynucleoside triphosphates
- LDHA
lactate dehydrogenase A
- ETC
electron transport chain
1. Introduction
Genome replication and its coordination with cell metabolism including bioenergetics are among fundamental processes that require careful orchestration to avoid errors that might contribute to severe pathologies at the organism level, such as cancer or premature aging. Thus, DNA synthesis must be performed with precision as any defects compromise genetic integrity (Machida et al., 2005). DNA synthesis in mammalian cells occurs in discrete nuclear foci. Foci contain synthetic units named replicons; each replicon ranges in size from 30 to 500 kbp, with an average of ∼100 kbp in most cell types. Majority of replication foci engage 1–6 origins that fire together at specific time during the S phase. If DNA damage takes place during the synthetic process, the speed of replication is compromised and commonly compensated by extra‐origin activation (Maya‐Mendoza et al., 2007). Impaired replication fork progression induces DNA replication stress (RS) and chromosome instability (CIN) in human cells (Henry‐Mowatt et al., 2013, 2013, 2003). Moreover, overexpression or activation of oncoproteins stimulates cell proliferation and causes DNA replication fork stress (Ohtsubo and Roberts, 1993; Bartkova et al., 2006; Di Micco et al., 2006; Halazonetis et al., 2008). For example, overexpression of cyclin E accelerates S phase entry and induces DNA replication stress and ensuing DNA damage by enhancing replication initiation and impairing fork progression (Bartkova et al., 2005, 2006, 2013). Prolonged expression of oncogenic Ras (H‐RasV12) also generates DNA replication stress in fibroblasts presumably through higher production of reactive oxygen species (ROS) levels leading to cell cycle arrest and senescence (Di Micco et al., 2006; Bartkova et al., 2006; Kosar et al., 2011; Rai et al., 2011; Weyemi et al., 2012; Hubackova et al., 2012). Analogously, Myc increases ROS and induces DNA damage response (DDR) (Vafa et al., 2002).
The Ras proteins (K‐Ras, H‐Ras and N‐Ras) are low molecular weight G proteins whose activity is dictated by the binding of guanine nucleotides. Following activation by upstream receptor tyrosine kinases, Ras proteins replace their load of GDP with GTP and engage in signaling (Barbacid, 1987). In the GTP‐bound state, Ras proteins bind to and activate several downstream effectors including RAF, PI3K and RAL guanine nucleotide exchange factors (RAL‐GEFs). Cancer‐associated mutations in Ras genes generally act by locking the Ras proteins in the GTP‐bound and constitutively active state, and such mutations are frequently found in human cancers (Pratilas and Solit, 2010).
The Myc family includes three mammalian proto‐oncoproteins (C‐Myc, L‐Myc and N‐Myc) (Patel et al., 2004). They are transcription factors of the helix‐loop‐helix/leucine zipper class of proteins that heterodimerize with a partner protein called Max and bind specific DNA sequences known as E‐boxes (Amati and Land, 1994). Induction of conditional alleles of Myc is sufficient to stimulate cell cycle re‐entry and proliferation in resting cells (Eilers et al., 1991). Firstly, Myc can stimulate growth of the cell size by activating transcription of genes that encode rate‐limiting metabolic enzymes (Schuhmacher et al., 1999). Secondly, Myc overexpression causes activation of Cdk2 (in complex with cyclins E or A) and promotes cell cycle progression (Campaner et al., 2010). Cdk2 inhibition results in senescence and Cdk1 inhibitory compounds trigger apoptosis in Myc‐expressing cells (Goga et al., 2007). The Myc oncogene was first implicated in Burkitt's lymphoma (Taub et al., 1982) and subsequent studies have shown that nearly all types of human cancers overexpress Myc in subsets of cases (Nesbit et al., 1999; Chrzan et al., 2001; Blancato et al., 2004).
Ras and Myc proteins represent important signaling hubs connected by major mitogenic pathways. The Ras proteins receive mitogenic signals from a myriad of extracellular molecules and their cognate receptors, whereas activation and stability of Myc are influenced by multiple upstream signaling pathways, including the RAF‐MEK‐ERK and PI3K‐AKT signaling pathways that are both controlled by Ras (Patel et al., 2004; Sears, 2004). Downstream of Ras, ERK phosphorylates Myc in the Ser62 and causes its activation. This phosphorylation also facilitates the immediate phosphorylation of neighboring Thr58 by GSK‐3beta and a series of events leading to PIN‐1 and PP2A‐dependent dephosphorylation of Ser62, FBW7‐dependent ubiquitination and proteasomal degradation (Yeh et al., 2004; Welcker and Clurman, 2008). On the other hand, Ras‐dependent activation of the PI3K‐AKT pathway tends to limit the phosphorylation of Myc at Thr58 by AKT‐mediated inhibition of GSK‐3beta (Sears et al., 2000). Testifying to the opposing, non‐linear signaling connecting Ras and Myc studies have shown that complete transformation of primary human fibroblasts in addition to Ras also requires Myc overexpression or introduction of viral oncoproteins such as the SV40 small T antigen or E1A, which stabilize Myc by inhibition of PP2A or FBW7, respectively (Land et al., 1983; Hahn et al., 2002; Seger et al., 2002; Yeh et al., 2004; Isobe et al., 2009).
To date, the molecular mechanisms of how oncogenes induce DNA replication stress are only partly understood. Three main possibilities have been proposed: i) Deregulated cell proliferation induces augmented DNA synthesis inducing collisions between replication and transcription machineries (Jones et al., 2013). ii) Deregulated cell proliferation driven by oncogenes induces reactive oxygen species that could induce DNA damage (Weyemi et al., 2012). iii) Deregulated cell proliferation could alter the balance of intracellular nucleotide pools impacting DNA replication (Bester et al., 2011). If there were common mechanisms for oncogene‐induced DNA replication stress, we would expect that different oncogenes induce the same temporary and qualitative changes in the replication fork speed or origin firing, ROS production or metabolism. Given a high degree of interconnection between the Ras and Myc signaling hubs, we have investigated whether Ras and Myc induce DNA replication stress with similar kinetics and ensuing consequences for the cells. Furthermore, considering the emerging rich cross‐talk between oncogenic signaling and cell metabolism pathways, we have assessed the impact of Ras and Myc oncogenes on bioenergetics and redox homeostasis, in both normal diploid and cancerous human cells. The results of above multifaceted analyses and the conceptual conclusions based on our dataset are presented in the following sections of this article.
2. Materials and methods
2.1. Cell culture and oncogenes induction
To prepare BJ fibroblasts stably expressing C‐Myc fused to the modified estrogen receptor ligand‐binding domain (MycER, (Littlewood et al., 1995)), pBabe puro‐MycER (provided by T. Littlewood) or pBabe puro plasmids were transfected into Phoenix packaging cells (from G. Nolan, Stanford). Obtained retroviral supernatants were filtered and used with 10 μg/ml of polybrene for 3 rounds of 24‐h infections. Transduced cells were selected using 1 μg/ml of puromycin for 3 days and then grown in Dulbecco's modified Eagle's medium without phenol red (DMEM/F‐12) (Gibco) supplemented with 10% fetal bovine serum (FBS), penicillin, streptomycin and 0.5 μg/ml of puromycin. MycER activation was induced by 100 nM of 4‐hydroxytamoxifen (4‐OHT) dissolved in ethanol. U2‐OS MycER cells were kindly provided by Martin Eilers lab (University of Wuerzburg).
BJ human fibroblasts with doxycycline (Dox) inducible expression of H‐RasV12 (Ras) (Lenti‐XTM Tet‐On Advanced Inducible Expression System, Clontech) were prepared by double lentivirus infection and subsequent selection as described previously (Evangelou et al., 2013). Cells (estimated population doubling time between 35 and 45 h) were cultured in DMEM with 10% FBS, penicillin, streptomycin, 0.5 μg/ml of puromycin and 100 μg/ml of G418. Ras overexpression was induced using 2 μg/ml of Dox.
2.2. Deoxynucleoside supplementation and immunofluorescence
For deoxynucleosides experiments, overexpression of Ras was induced by incubation with Dox for 8 days. Where indicated, cells were treated with the mix of deoxynucleosides (50 nM of dA, dU, dC and dG) for the whole course of the experiment (Bester et al., 2011) or with 50 μM of cordycepin for the last 2 h of the experiment (Jones et al., 2013). Cells were then fixed with 4% formaldehyde (15 min RT) and permeabilized with 0.1% Triton‐X‐100 (15 min RT). Samples were co‐immunostained with antibodies against 53BP1 (rabbit, sc‐22760, Santa Cruz, 1:1000) and cyclin A (mouse, NCL‐CYCLIN A, Leica‐Novocastra, 1:50), followed by secondary antibodies AlexaFluor568 goat anti‐rabbit and AlexaFluor488 goat anti‐mouse, respectively. To detect γH2AX we used the mouse anti‐γH2AX antibody (613402, Biolegend, 1:500). 250 non‐overlapping images were acquired for each cells‐containing coverslip using the Olympus Scan‐R microscope. At least 4000 cells were scored and images were processed using Scan‐R Analysis software. We scored the total intensity of the pan‐nuclear γH2AX signal in individual nuclei to avoid the variation within an asynchronous cell population (Mistrik et al., 2009; Toledo et al., 2013). For the 53BP1 foci analysis, only cyclin A negative cells were scored. Differences were analyzed using the Wilcoxon signed‐rank test.
2.3. Immunoblotting and apoptosis
Conditions for denaturing polyacrylamide gel electrophoresis (using a 10% separation gel) and Western blotting procedure were essentially as described before (Bartkova et al., 2008). Protein concentration was measured using the Bradford method and 15 μg of total proteins were resolved for each sample. The following antibodies were used for immunoblots, mouse anti‐beta‐Actin (A1978, Sigma, 1:1000), anti‐Ras (mouse anti‐HRas‐01, a gift from V. Horejsi, 1:100) and rabbit anti‐cMyc (5605, Cell Signaling, 1:1000).
Apoptotic cells were identified by propidium iodide exclusion from live cells stained with Hoechst 33342. Cells grown in 24‐well plates were stained for 10 min (RT) with each dye. Images were taken immediately for the red and blue channels respectively and processed using ImageJ software.
2.4. Cell cycle analysis
U2‐OS MycER cells were treated with 4‐OHT for 1–4 days. At each time point, cells were fixed with 70% ethanol at −20 °C and incubated for 30 min in ice. Cells were then incubated for 5 min (RT) with 10 μg/ml of propidium iodide and 5 μg/ml of ribonuclease A. Cells were immediately analyzed on the FACSCalibur (Becton Dickinson). Acquired data was analyzed using the Cell Cycle platform of FlowJo software and the Watson (pragmatic) model.
2.5. DNA fibers
Cell cultures expressing specific oncogenic proteins were pulse‐labeled with 25 μM of CldU for 20 min, followed by the change of media and a second pulse of 250 μM of IdU for 20 min. Labeled cells were harvested and DNA fiber spreads prepared as described in Maya‐Mendoza et al., 2012. To detect CldU a rat anti‐BrdU antibody (OBT0030, Serotec, 1:1000) was used and for IdU detection a mouse anti‐BrdU antibody (347580, Becton Dickinson, 1:1000). Antibodies for secondary detection were anti‐rat AlexaFluor564 and anti‐mouse AlexaFluor488, respectively. Images of well spread DNA fibers were taken using the LSM700 Zeiss microscope and the 63× objective. Double‐labeled replication forks were analyzed manually using ZEN software. Presented results are from triplicates of 2–4 independent experiments.
2.6. Analysis of the oxygen consumption rate (OCR) and the extracellular acidification rate (ECAR)
Measurements of OCR and ECAR were performed using the Seahorse XF96e analyzer (Seahorse Bioscience) as described previously (Hall et al., 2013). Briefly, BJ or U2‐OS cells (1.0 × 10⁴ cells/well) were seeded in XF96 V3 culture microplates (Seahorse Bioscience) one day before the experiment. OCR and ECAR were analyzed in the Seahorse assay buffer (containing 10 mM glucose, 10 mM pyruvate, pH 7.4).
2.7. Analysis of oxidative stress and reactive oxygen species
To detect 8‐oxoguanine, cells were fixed with 4% formaldehyde (15 min). Immunohistochemistry was performed using a mouse monoclonal anti‐8‐hydroxy Guanine (15A3, Rockland). The 40X objective was used to acquire images. Total superoxide was measured using dihydroethidium (DHE). Cells were loaded with 5 μM DHE in DMEM/F12 with 1% FBS for 30 min. FACS analysis was performed by gating viable cells and measuring mean intensity of oxyethidium fluorescence in the FL2 channel. A FACSCalibur flow cytometer was used. Mitochondrial superoxide was detected using MitoSOX Red™ according to instructions provided by the manufacturer. Cells seeded 24 h prior to analysis were loaded with 5 μM of MitoSOX in DMEM/F12 with 1% FBS for 30 min. FACS analysis was performed as described for DHE.
3. Results
3.1. Ras overexpression causes DNA replication stress
Oncogenic mutations in Ras can impair GTP hydrolysis and thus promote constitutively active GTP‐Ras. To investigate to which extent and with what kinetics does the activated H‐Ras affect cell cycle via DNA replication stress, we expressed a constitutively active version of H‐Ras, H‐RasV12 (referred to as Ras), using a Tet‐dependent promoter model system (see Materials and Methods section). We assessed the level of Ras protein induction in our assays and compared with previously described experiments (Supplemental Figure 1A and Evangelou et al., 2013). Ras overexpression accelerated the growth rate in BJ normal human fibroblasts (Figure 1A). From the onset of Ras induction, an increase of cells in the S phase was observed. The fraction of cells in the S phase started to decline 6–8 days post‐induction (Figure 1B), presumably reflecting initial phases of the Ras oncogene‐induced senescence (OIS) program (Bartkova et al., 2006). It is known that cellular senescence induced by Ras is accompanied by increased DNA damage response (Bartkova et al., 2006; Di Micco et al., 2006; Rai et al., 2011) and that such DNA damaging impact is preserved even in secondary/bystander senescence caused by Ras (Hubackova et al., 2012). Using a high‐throughput microscopy analysis, we found gradual accumulation of the DNA damage signaling marker γH2AX from the day 6 of Ras overexpression (Figure 1C). Noteworthy, from this time point the proportion of cells in the S phase started to decline. Another marker of DNA damage response, 53BP1, was also tested. We compared the number of 53BP1 foci in each nucleus in control and induced cells (Figure 1D). Strongly reminiscent of the γH2AX pattern, a significant increase in the 53BP1 foci number was seen from the day 6 of Ras induction.
Figure 1.
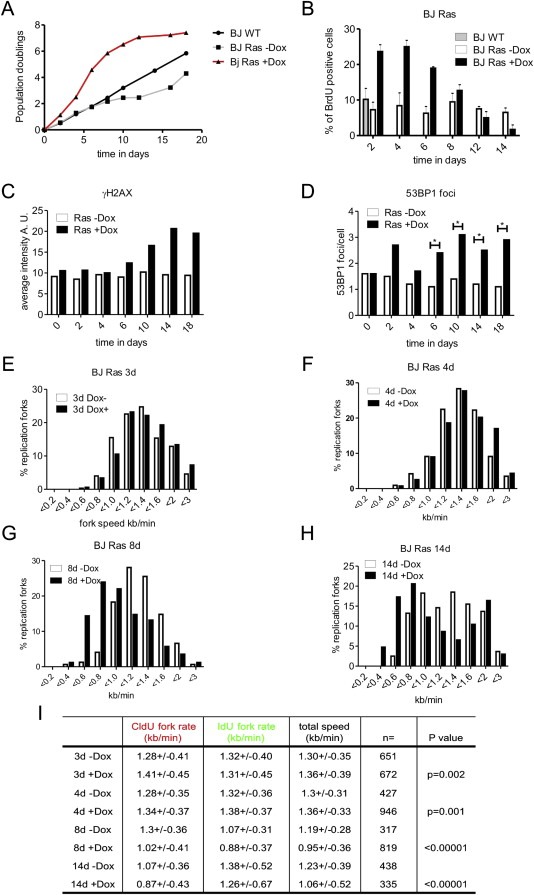
Ras overexpression induces cell hyperproliferation and DNA damage response in BJ cells (BJ Ras). (A) BJ cells expressing the active version of the Ras protein (H‐RasV12) under the control of the Tet‐on system were incubated with doxycycline (Dox) for different time intervals and cell viability was estimated by trypan blue exclusion. Ras overexpression stimulated cell proliferation from day 1 to day 10 in comparison with non‐treated cells. At later time points oncogene‐induced senescence was gradually established (data not shown and (Kosar et al., 2011)). (B) The fraction of cells in the S phase was augmented in Ras overexpressing cells. A 30 min pulse of BrdU was added at specific time points in BJ Ras cells. The highest number of cells in the S phase was observed at day 4 post‐induction and gradually decreased afterwards. (C) Quantification of total γH2AX after Ras overexpression. BJ Ras cells were treated with Dox at different time points and γH2AX was detected by immunofluorescence. The total intensity of γH2AX was measured in individual nuclei using high‐throughput microscopy and the average intensity in each cell was analyzed by ScanR software. The plot shows the average of >4000 cells for each time point. (D) Quantification of the average number of 53BP1 foci after Ras overexpression. BJ Ras cells were treated with Dox at different time points and 53BP1 was detected by immunofluorescence. The total number of 53BP1 foci in G1 cells was quantified in individual nuclei. The average number of foci was analyzed by ScanR software. (E–I) Ras overexpression modifies the speed of replication fork progression. Cells were pulse‐labeled for 20 min with CldU, washed and labeled with IdU for another 20 min. The length of each pulse in individual well spread forks was measured and converted into kb/min. (E–H) Distribution of the fork extension rates (kb/min) in non‐treated cells and cells treated with Dox for 3 (E), 4 (F), 8 (G) and 14 days (H), respectively. Empty bars represent data from control non‐treated cells and black bars from Dox‐treated cells. (I) Quantification of the mean extension rates (kb/min, 1 μm = 2.59 kb) during the first (CldU, 20 min) and the second (IdU, 20 min) pulses. The number of analyzed forks (n) is shown and the probabilities associated to the t‐test (p value) are presented in the last column of the table (t‐test: ‐Dox vs + Dox).
The cellular level of deoxyribonucleoside triphosphates (dNTPs) is critical during DNA replication and cell proliferation (Anglana et al., 2003). Altered nucleotide biosynthesis pathways in OIS have been described (Aird et al., 2013). We therefore reasoned that DDR triggered by Ras overexpression might be mitigated by exogenous deoxynucleosides. The presence of exogenous deoxynucleosides reduced significantly the average number of 53BP1 foci in Ras overexpressing cells (Supplemental Figure 1D). These results show that Ras overexpression in diploid human BJ fibroblasts induces an initial wave of enhanced cell proliferation, triggers DDR and finally leads to OIS (Supplemental Figure 1C and Evangelou et al., 2013).
Next, we focused on the role of Ras in DNA synthesis ‘deregulation’, hypothesizing that OIS triggered by Ras overexpression might be related to DNA replication stress. BJ Ras cells were pulse‐labeled using CldU and IdU for 20 min each pulse and examined for potential changes in the replication fork speed and stability. After 3–4 days of Ras induction, there was a small but reproducible and significant increase of the replication fork speed (Figure 1E, F and I). After 8 days of Ras induction, replication fork progression began to be compromised and significant reduction of the speed was observed (Figure 1G and I). Finally, after 14 days of continuous Ras overexpression, replication fork progression was strongly impaired (Figure 1H and I). Of note, after 14 days in culture non‐induced cells showed also somewhat slower fork progression for the first pulse followed by fast fork progression for the second pulse. This phenomenon could be related to a minor ‘leakiness’ of the Tet‐regulated Ras system, leading to a modest yet detectable Ras impact on cell proliferation, possibly complemented by altered cytokine secretion known to contribute to cellular senescence in human cell cultures (Hubackova et al., 2012). Overall, these results indicate that Ras overexpression induces DNA replication stress in BJ cells and notably, that observed replication stress becomes manifested later than the first signs of increased cell proliferation.
3.2. Excess of Myc induces DNA replication stress in human cells
To determine the function of the oncogene Myc in cell proliferation, we took advantage of the well‐established protein expression system where the coding sequence of c‐Myc is fused to the ligand‐binding domain of the modified estrogen receptor (MycER) (Eilers et al., 1991). Using this system MycER can be expressed at levels 5‐ to 10‐fold higher than endogenous Myc (an overexpression level commonly observed in tumors) but kept inactive until the addition of 4‐hydroxytamoxifen (4‐OHT), upon which MycER is activated and rapidly translocates to the nucleus. As for Ras, we chose normal BJ human fibroblasts to test whether excess of Myc in the nucleus impacts DNA replication. BJ cells were infected with virus containing either an empty vector pBabe or pBabe with the MycER sequence. After 2–3 weeks of drug selection, the bulk cultures of BJ cells were treated with 4‐OHT (Supplemental Figure 2). By the sixth day post‐induction the number of BJ cells started to decline, in comparison with untreated control cells (Figure 2A). At this time point we also noticed a reduction in the speed of replication forks.
Figure 2.
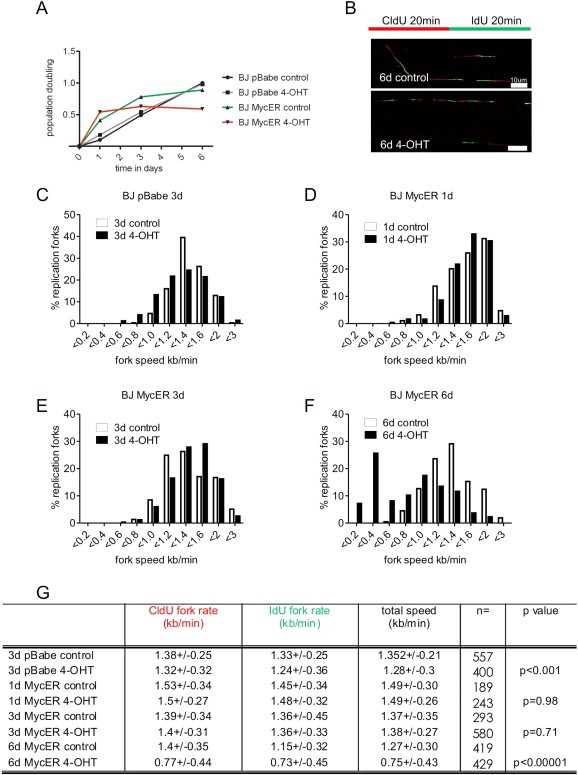
Myc overexpression slows down DNA replication fork progression in BJ cells. (A) BJ cells were infected to express the fusion protein MycER under the regulation of 4‐OHT. After 2 weeks of selection cells were incubated in the presence of 4‐OHT for different time points and cell viability was estimated by trypan blue exclusion. (B) BJ MycER cells were pulse‐labeled for 20 min with CldU, washed and pulse‐labeled with IdU for subsequent 20 min. The red color in DNA fibers is the signal from the first pulse and the green color from the second pulse. The length of each pulse in individual, well spread fibers was measured and converted into kb/min. Examples of DNA fibers from BJ MycER cells non‐treated (6d control) and treated with 4‐OHT (6d 4‐OHT) for 6 days are shown. (C) BJ cells infected with retrovirus containing an empty pBabe vector were treated or not (control) with 4‐OHT for 3 days and analyzed for the fork speed. (D–F) BJ MycER cells were induced for 1 (D), 3 (E) and 6 (F) days, respectively and the total fork speed was analyzed. Plots show the distribution of fork extension rates (kb/min) of the first and the second pulse in non‐treated (empty bars) and 4‐OHT‐treated (black bars) cells. (G) Quantification of the mean extension rates (kb/min) during the first (CldU, 20 min) and the second (IdU, 20 min) pulses. The number of analyzed forks (n) is shown and the probabilities estimated by the t‐test are presented in the last column of the table (t‐test: control vs 4‐OHT). Scale bars are 10 μm (25.9 kb).
Cells that overexpress Myc may have to complete the full cell cycle before experiencing DNA replication problems, thus the slow cell cycle might explain the delayed effect of Myc overexpression on fork progression. To evaluate whether multiple cell cycles are necessary for Myc to induce DNA damage and RS and to compare the impact of the same MycER expression system in a tumor cell background, we transduced the osteosarcoma cell line U2‐OS as described for BJ cells. U2‐OS cells proliferate faster than BJ fibroblasts. Upon activation with 4‐OHT we found that high levels of Myc in the nucleus led to defects in cell proliferation and enhanced cell death (Figure 3A and B and Supplemental Figure 3A and B). A detailed flow cytometry analysis showed accumulation of cells in the S phase and a reduction of the G1 population (Supplemental Figure 3C). Furthermore, activation of Myc resulted in progressive γH2AX accumulation (Figure 3C and D), yet no changes in the average number of 53BP1 bodies were observed (Supplemental Figure 3D).
Figure 3.
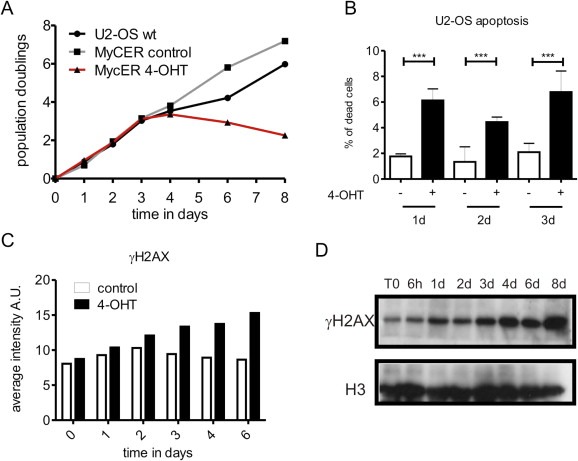
Myc overexpression induces DNA damage response and cell death in U2‐OS cells. (A) U2‐OS cells that express MycER were induced with 4‐OHT at different time points and cell viability was assessed by trypan blue exclusion. (B) Live cells non‐treated and 4‐OHT‐treated were stained with Hoechst 33342 and propidium iodide (PI). After 1, 2 and 3 days of 4‐OHT induction the percentage of apoptotic cells was quantified by PI exclusion and nuclear fragmentation. 1d: control n = 2080, 4‐OHT‐induced n = 1655, p associated to the t‐test analysis <0.0098; 2d: control n = 2374, 4‐OHT‐induced n = 2142, p < 0.001; 3d: control n = 1864, 4‐OHT‐induced n = 2080, p < 0.006. (C) U2‐OS MycER cells were treated with 4‐OHT at different time points and γH2AX was detected by immunofluorescence. The total amount of γH2AX was measured in individual cells using high‐throughput microscopy and the average intensity in each cell was analyzed using ScanR software. The plot shows an average of >4000 cells for each time point. (D) In a time course experiment, total proteins from non‐induced and induced U2‐OS MycER cells were extracted, resolved and γH2AX was immunoblotted. Loading control: histone H3.
In order to investigate whether excess of nuclear Myc also impacts global rates of replication fork progression in U2‐OS MycER cells, we pulse‐labeled cells with CldU for 20 min, followed by a second 20 min pulse of IdU (Figure 4A). After 24 h of incubation in the presence of 4‐OHT, the replication fork speed was reduced by 15% (Figure 4B and H); longer induction of Myc decreased the fork speed by 40% (Figure 4C, D and H). These experiments suggested that excess of nuclear Myc affected almost every replication fork after 3 days of induction and required actively cycling cells (Supplemental Figure 4). It is also noteworthy that Myc activation generated CldU/IdU ratios of >2 from the first day of induction (Figure 4E–G), suggesting a high degree of fork asymmetry and fork collapse, features consistent with enhanced replication stress. Normally, replication origins fire at the equivalent speed in both directions and such perfect symmetry yields a CldU/IdU value of 1 (Burrell et al., 2013a), which is different from our observations in Myc‐expressing cells. Together, above data show that excess of Myc affects both the fast‐cycling U2‐OS cells and, with a slight delay, the slow‐cycling diploid BJ fibroblasts.
Figure 4.
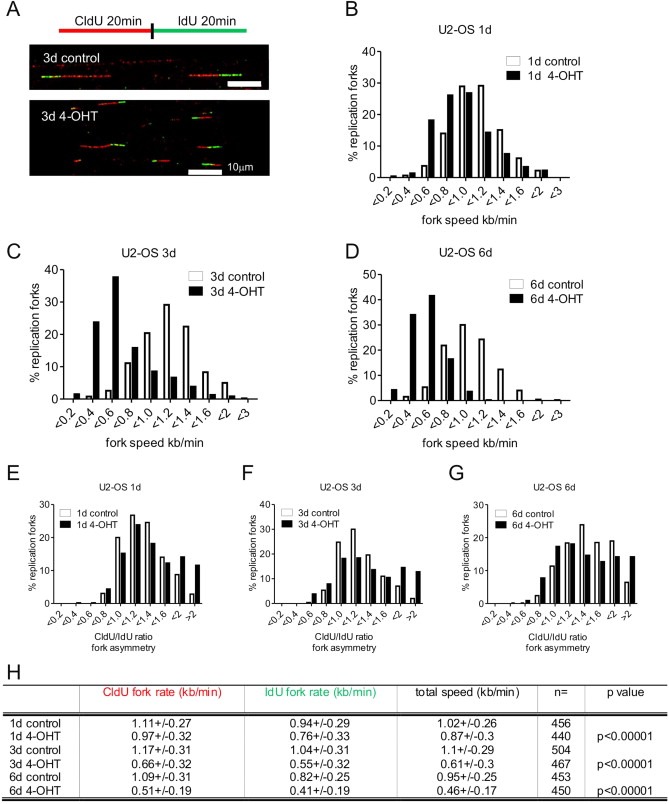
Myc overexpression slows down DNA replication fork progression and induces fork asymmetry in U2‐OS cells. (A) U2‐OS MycER cells were pulse‐labeled for 20 min with CldU, washed and pulse‐labeled with IdU for another 20 min. The red tracks in DNA fibers are signals from the first pulse and the green tracks from the second pulse. The length of each pulse in individual, well spread fibers was measured and converted into kb/min. Examples of DNA fibers from U2‐OS MycER cells non‐treated (3d control) and treated with 4‐OHT (3d 4‐OHT) for 3 days shown. (B–D) U2‐OS Myc cells were induced for 1 (B), 3 (C) and 6 (D) days, respectively and the total fork speed was analyzed. Plots show the distribution of fork extension rates (kb/min) of the first and the second pulse in non‐treated (empty bars) and 4‐OHT‐treated (black bars) cells. CldU/IdU values are shown in (E–G). When extension rates are similar during both pulses, perfect symmetry is equal 1. From day 1 (E) of Myc overexpression there was a significant increase of highly asymmetric replication forks (ratios above 1.6; control n = 56, 4‐OHT‐induced n = 113; p associated to the t‐test <0.0001). Distribution of the ratio of fork rates during the first and the second pulse after 3 days (F) of Myc activation (ratios above 1.6; control n = 45, 4‐OHT‐induced n = 128; p < 6E‐5) and after 6 days (G) of Myc activation (ratios above 1.6; control n = 115, 4‐OHT‐induced n = 128; p < 2E‐7). (H) Quantification of the mean extension rates (kb/min) during the first (CldU, 20 min) and the second (IdU, 20 min) pulses. The number of analyzed forks (n) is shown and the probabilities assessed by the t‐test are presented in the last column of the table (t‐test: control vs 4‐OHT). Scale bars are 10 μm (25.9 kb).
3.3. Changes in cell metabolism induced by Myc and Ras
Cell cycle regulation and proliferation can be affected under conditions of compromised metabolism. It is well‐established that cancer cells rewire their metabolic programs and oncoproteins, such as Ras and Myc are important regulators of cell metabolism (Barger and Plas, 2010). In particular, Myc upregulates expression of the lactate dehydrogenase A (LDHA), which diverges pyruvate to lactate, thus increases extracellular acidification (Lewis et al., 2000; Fan et al., 2010). Myc also increases glutaminolysis, which is a biochemical pathway that allows generation of citrate from glutamine under conditions of hypoxia and/or high LDHA activity. Notably, such conditions cause the citric acid cycle to run in reverse and bypass the succinate dehydrogenase complex, leading to the lower rate of the electron transport chain (ETC) and potentially a lower oxygen demand (Dang et al., 2006; Le et al., 2012). To relate the observed impact on DNA replication and RS with potential alterations in bioenergetic parameters, we examined whether Myc activation causes changes in the extracellular acidification rate (ECAR) and the oxygen consumption rate (OCR), using the Seahorse technology platform. In U2‐OS cells, Myc overexpression increased the level of ECAR and lowered the oxygen consumption rate (Figure 5A and B), which is consistent with the ability of cancer cells to adapt to Myc‐driven metabolism and efficiently run the TCA cycle in reverse. In contrast, in BJ MycER cells we did not observe any changes in either ECAR or OCR levels, regardless of the oncogene induction time (Figure 5C and D).
Figure 5.
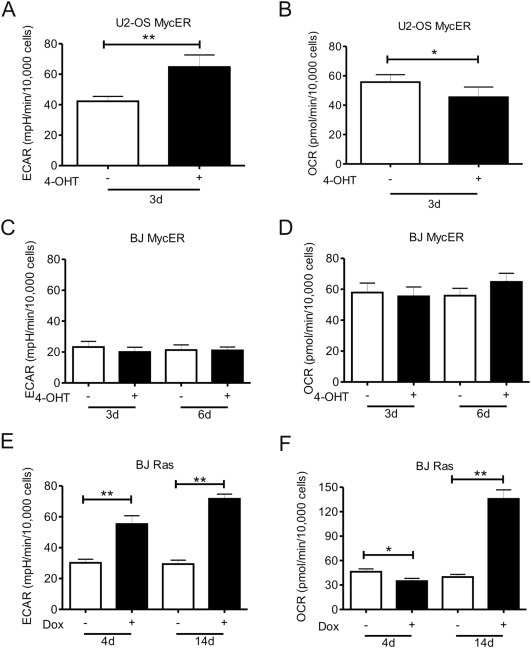
Myc and Ras overexpression induces changes in cell metabolism. The extracellular acidification rate (ECAR) and the oxygen consumption rate (OCR) were measured simultaneously in the Seahorse XF96e bioanalyzer. (A–D) U2‐OS MycER and BJ MycER cells were left untreated (−) or treated with 4‐OHT (+) and were investigated after 3 days or after 3 and 6 days, respectively. After 3 days of Myc activation in U2‐OS cells there was a significant increase of ECAR (A) and a decrease of OCR (B) levels, with no apparent changes in BJ MycER cells (C, D). (E) Ras overexpression by Dox incubation induced an increase of ECAR after 4 and 14 days in BJ cells. (F) OCR was initially (4d) decreased after Dox induction but was significantly elevated at later time points (14d).
Since Ras affects both activation and stability of Myc, Ras would be expected to be at least as potent as Myc, while simultaneously activating several other pathways of importance for cellular transformation. In this regard, it is interesting that Ras provoked a series of metabolic changes in BJ cells that were more similar to changes triggered by Myc, when superimposed on the already transformed background of U2‐OS cells, rather than those caused by Myc in BJ cells. Specifically, Ras efficiently increased the rate of glycolysis in BJ cells (Figure 5E), just as much as Myc did in U2‐OS cells (Figure 5). Furthermore, and similar to the effect of Myc in U2‐OS cells, the Ras‐induced increase in ECAR after 4 days and was accompanied by a significant reduction in OCR (Figure 5F). These data indicate that Ras, probably due to upstream activation of several pathways, achieves an analogous level of metabolic reprogramming in normal fibroblasts as Myc overexpression in cancer cells.
3.4. Induction of ‘non‐mitochondrial’ oxidative stress by Myc and Ras
Oncogene‐induced senescence triggered by Ras has been related to increased production of ROS (Irani et al., 1997), which induces DDR (Di Micco et al., 2006). It has been also reported that short induction of Myc triggers ROS and induces DNA damage in human fibroblasts (Vafa et al., 2002). Therefore, as a marker of oxidative damage of RNA/DNA we tested the level of 8‐oxoguanine (8‐oxoG) in Ras‐ and Myc‐expressing cells. We found an increase in the level of 8‐oxoG after 3 days of Myc induction in both U2‐OS and BJ cell types but no significant changes at early time points (Figure 6A and data not shown). Similarly, we observed the highest level of 8‐oxoG around day 6 of Ras induction, after which the staining signal became progressively less pronounced (Figure 6A top‐right). Oxidative stress can also be quantified by flow cytometry using the probe dihydroethidium (DHE), which reacts with superoxide anions to form the fluorescent molecule oxyethidium. Using this probe we found almost twice the amount of superoxide in BJ cells expressing either Ras or Myc compared to non‐induced cells (Figure 6B and C), which correlated with the 8‐oxoG immunostaining.
Figure 6.
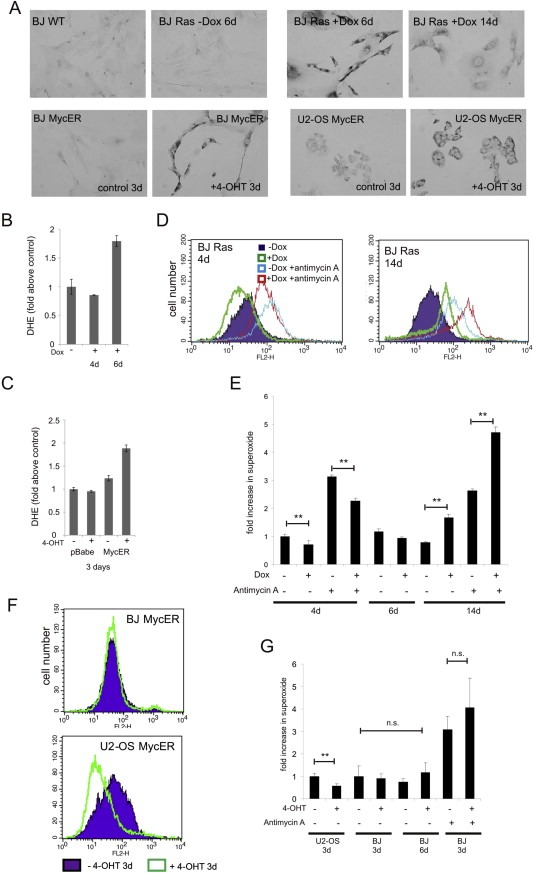
Oxidative RNA/DNA damage following oncogene activation. The 8‐oxoguanine (8‐oxoG/8‐oxo(d)G) levels were analyzed by immunocytochemistry from day 1–6 after Myc activation and from day 1–18 after Ras overexpression. (A) Representative images of U2‐OS MycER and BJ MycER cells after 3 days of 4‐OHT incubation (lower row) are shown. BJ wild‐type cells and BJ Ras cells Dox‐induced for different time points are shown in upper row. (B, C) Levels of total superoxide measured by FACS analysis of dihydroethidium staining of (B) non‐induced BJ Ras or BJ Ras cells after 4 and 6 days of Dox treatment, respectively and (C) BJ pBabe and BJ MycER cells after 3 days of 4‐OHT induction. Measurements of mitochondrial superoxide using MitoSOX Red™ are shown in (D–G). (D) Representative histograms showing the influence of doxycycline‐induced expression of Ras on production of mitochondrial superoxide after 4 and 14 days. (E) Fold increase in superoxide levels in induced compared with non‐induced BJ Ras cells. (F) Representative histograms showing the level of superoxide in U2‐OS MycER and BJ MycER cells after treatment with 4‐OHT for 3 days. (G) Fold increase in superoxide levels in activated MycER cells compared with non‐treated cells. In D‐G, treatment with the mitochondrial complex III inhibitor Antimycin A (5 μM) served as a control for mitochondrial superoxide production.
The superoxide anion is a type of reactive oxygen species that is formed by different sources within cells including the mitochondrial ETC complexes 1 and 3, and plasma‐membrane associated NADPH oxidase (NOX) enzymes (Balaban et al., 2005). However, the above analysis of metabolism showed that mitochondrial respiration was diminished at early time points after Ras or Myc induction, suggesting that mitochondria are not the source of ROS detected by either the 8‐oxoG staining or by detection of oxyethidium. This notion was subsequently confirmed using the fluorescent probe, MitoSOX Red™, which, unlike DHE, detects superoxide produced only by mitochondria. We consistently saw changes in mitochondrial superoxide production that closely mimicked changes observed in OCR (Figure 6D–G). This included an initial reduction of superoxide production in Myc‐expressing U2‐OS cells and Ras‐expressing BJ cells. On the other hand, increased superoxide production was apparent in Ras‐induced BJ cells around two weeks post‐induction, accompanied by an OCR increase, co‐incident with the developing state of oncogene‐induced cellular senescence.
Above data demonstrated that oxidative stress is increased following oncogene induction. However, mitochondrial ETC is not the source of the produced ROS, suggesting a different, non‐mitochondrial origin of such oncogene‐triggered oxidative stress. Our analysis of mitochondrial superoxide furthermore confirmed that the mitochondrial ETC complexes might be bypassed early after oncogene induction in Myc‐expressing U2‐OS cells and Ras‐expressing fibroblasts.
4. Discussion
DNA replication stress as a source of genome instability has been a subject of continuous research in the last few years (Bermejo et al., 2012; Burrell et al., 2013a; Toledo et al., 2013), further extending the concept of DNA damage response as an inducible biological barrier against activated oncogenes and tumor progression (Bartkova et al., 2005; Gorgoulis et al., 2005; Halazonetis et al., 2008; Bartek et al., 2012; Evangelou et al., 2013). Expression of several oncoproteins has been related to DNA replication stress but it is still unclear through which precise mechanism(s) oncoproteins induce RS and whether there are mechanistic and/or kinetic differences among oncogenes (Bartkova et al., 2006; Di Micco et al., 2006; Takacova et al., 2012; Jones et al., 2013). Under normal conditions mitogenic stimulation leads to physiological activation of endogenous wild‐type Ras and Myc. Moreover, Myc stability is regulated via Ras effector pathways (Lee et al., 2008). Thus, we analyzed the effect of Ras and Myc overexpression on RS. In contrast to Myc overexpression, Ras showed an initial hyperproliferative effect in BJ cells. Additionally, we found that Ras overexpression controlled the speed of fork progression. Augmented cell proliferation may increase the fork progression speed, then hyperproliferation can unbalance nucleotide pools and cell metabolism, causing eventually slower replication fork progression and DNA replication stress. Consistently with such a scenario, we found that the fork progression speed diminished over time in Ras‐expressing cells but also that exogenously added deoxynucleosides significantly reduced oncogene‐evoked DNA damage.
It has been reported that the excess of Myc initiates premature origin firing, increases origin density and leads to asymmetric fork progression and DNA damage in vitro (Dominguez‐Sola et al., 2007; Srinivasan et al., 2013). In our human model system excess of nuclear Myc did not impact initially fork progression and origin firing (Supplemental Figure 4 and data not shown; see values at 6 and 24 h after Myc induction). Nevertheless, we found that excess of Myc triggered DDR and DNA replication stress after cells have progressed through at least one cell cycle, pointing to a different mechanism than the one proposed for Ras.
Under the normal condition mammalian genomes contain regions that challenge the DNA replication process. These regions include repetitive sequences, common fragile sites (CFS), encounters between transcription and replication machineries and forks that need to cover long distances (Letessier et al., 2011; Bermejo et al., 2012). CFS are loci that recurrently exhibit breaks on mitotic chromosomes following a moderate reduction of the speed of replication forks (Durkin and Glover, 2007). Moreover, CFS are a source of genomic instability, promoting tumorigenesis from the early steps of the process (Debatisse et al., 2012; Georgakilas et al., 2014). Interestingly, DNA damage induced by overexpression of Myc and other oncogenes occurs in early human tumor lesions and can impact CSF (Bartkova et al., 2005; Gorgoulis et al., 2005; Barlow et al., 2013). In our Myc‐overexpressing cells encounters between transcription and replication machineries might be the main source of DNA replication stress. However, we intended to avoid clashes between transcription and replication machineries by inhibiting transcription with cordycepin added for 2 h after oncogene overexpression and noticed that normal turnover of important proteins was affected (Supplemental Figure 1E).
Furthermore, our data about energy metabolism in relation to oncogenes also show an interesting correlation between increased cell proliferation in normal and cancer cells and a high level of ECAR. Specifically, induction of Ras in BJ fibroblasts increased the cell proliferation rate as well as the level of ECAR. Overexpression of Myc did not elevate significantly cell proliferation, however, the ECAR level was always higher in fast‐cycling U2‐OS MycER cells than in slow‐cycling BJ MycER cells, with or without 4‐OHT‐induction. These data are in agreement with the proposed relationship between increased glycolytic flux and proliferation of cancer cells (Vander Heiden et al., 2009). In particular, increased glycolytic flux allows an adequate amount of the glucose‐6‐phosphate, which then becomes available for production of the ribose‐5‐phosphate in the pentose phosphate pathway and the downstream nucleotide synthesis demanded, under conditions of accelerated proliferation (Tong et al., 2009). It is well accepted that several metabolic programs exist the subversion of which can support proliferation of cancer cells (Vander Heiden et al., 2011). In breast cancer, BRCA1 mutant cells showed 50% more glycolysis when compared with wild‐type cells. Mutations in BRCA1 correlate with high AKT phosphorylation level, due to abolished AKT inhibition thereby up‐regulating glycolysis (Privat et al., 2014).
Correlating inversely with enhanced glycolysis, we found reduced oxygen consumption as well as reduced mitochondrial superoxide production in both U2‐OS MycER and BJ Ras cells early after oncogene activation. This observation is consistent with suppression of mitochondrial OXPHOS by high glycolytic activity observed in different cancer types and rapidly proliferating cells, a phenomenon commonly referred to as the Crabtree effect (Smolkova et al., 2011). Currently, the molecular mechanism behind the Crabtree effect remains unknown. However, the reduction in superoxide production was particularly striking in U2‐OS cells early after activation of Myc. This may suggest a significant contribution of Myc‐driven glutaminolysis to reduced OXPHOS activity in cancer cells already converting most of the pyruvate into lactate. When less pyruvate enters the mitochondria to feed the Krebs cycle with acetyl‐CoA in the forward direction, glutaminolysis leads to increased levels of alpha‐ketoglutarate, which then undergoes reductive carboxylation to citrate using the Krebs cycle in reverse (Smolkova et al., 2011; Dang, 2012; Filipp et al., 2012; Le et al., 2012). This would have two major implications in terms of oxidative stress. First, reverse use of the Krebs cycle means running independently of the succinate dehydrogenase, hence reduced use of the electron transport chain and finally less superoxide formation. Second, export of citrate to the cytosol could lead to increased NADPH production by the isocitrate dehydrogenases and malic enzyme, which would add to the recharging of glutathione and hence bolster the anti‐oxidant defense. A prerequisite is that the cell can efficiently meet the demands for ATP through glycolysis as well as cope with increased lactate production. This is commonly seen in cancer cells (Parks et al., 2013), which is probably why U2‐OS cells showed a different response to Myc compared to normal BJ fibroblasts, as revealed by our present results.
Interestingly, oncogene addiction to the V600EBRAF was demonstrated to have metabolic/bioenergetic foundation (Hall et al., 2013). Targeting bioenergetics has been shown to enhance the response to oncogene inhibition in BRAF‐mutated melanoma cells (Haq et al., 2013) and in K‐RAS‐mutated pancreatic cancer cells (Viale et al., 2014). Our present results that Ras and Myc engage different metabolic regulation could indicate that while targeting of bioenergetics may represent a promising avenue for cancer treatment, the precise mechanism and response to such targeting may depend, at least to some extent, on the specific oncogenic mutation(s) present in the tumor.
Alterations in ROS levels can cause DNA damage and constitutes a potential link between changes in metabolism and mutagenic genomic damage. ROS may also affect signaling of vital importance for oncogene‐driven transformation and proliferation (Suh et al., 1999; Alexandrova et al., 2006; Weyemi et al., 2012). Although our OCR and MitoSOX analyses exclude any direct role of mitochondrial ROS production, it is noteworthy, that we observed both increased 8‐oxoG staining and increased total superoxide in BJ cells expressing Myc or Ras at time points coinciding with increased proliferation and replication stress. NAPDH oxidase complexes situated at the plasma‐membrane are common sources of superoxide radicals within cells (Ueyama et al., 2006; Bedard and Krause, 2007). Several studies have demonstrated that oncogenes increase ROS production by activation of the small GTPase Rac1 that binds NOXA1 within NADPH oxidases (Qiu et al., 1995; Mitsushita et al., 2004; Ferraro et al., 2006; Gianni et al., 2008). Furthermore, induction of CCND1 (cyclin D1) mRNA expression by the AP‐1 transcription factor requires Rac1 and NADPH oxidase activity (Ranjan et al., 2006; Daugaard et al., 2013). These previous reports in combination with our present results favor a model by which oncogenes induce DNA replication stress, which may be associated with ROS‐induced signaling/damage but occurs independently of mitochondrial ROS production.
Collectively, our data indicate that oncogenic Ras and Myc operate differently to induce DNA replication stress, although Ras signaling pathways can regulate Myc. Myc overexpression induced DDR from the first cell cycle, reducing promptly the speed of fork progression. Ras‐induced RS needed approximately a week of enhanced proliferation before fork progression slowed down and DNA damage response was clearly detectable. Interestingly, overexpression of the two oncoproteins had also differential impact on cell energy metabolism. Moreover, it became apparent from our results that Myc and Ras act differently according to the cell type (cellular context) and the level of oncogene expression. Ras overexpression in normal BJ cells evoked similar changes to those caused by Myc in cancerous U2‐OS cells, yet distinct from those of Myc in BJ cells. These inter‐oncogene and cell‐context‐dependent effects add an extra level of complexity to the emerging understanding of oncogene‐induced DNA replication stress and its role in cancer progression. In this regard, future work should focus on the study of replication responses in cells from cancers that naturally overexpress either Myc or Ras, whose mode of action in tissues at the molecular level remains obscure. In particular, it would be interesting to know whether different ways of inducing DNA replication stress by Myc and Ras can be correlated with other genetic events needed to achieve full transformation in different cell types. Last but not least, this and analogous other studies provide novel insights into the potential vulnerabilities of cancer cells. Such knowledge is valuable not only to better understand tumorigenesis, but also due to the fact that both replication stress and metabolic alterations are exploitable in cancer treatment.
Conflict of interest
The authors declare no conflict of interest.
Supporting information
The following are the supplementary data related to this article:
Supplemental Figure 1. (A) BJ Ras cells were induced (Dox) and non‐induced (control) in a time course experiment and processed for the immunoblot analysis of Ras expression; β‐actin was used as a loading control. (B) Western blots were scanned and the relative amount of Ras was quantified using ImageJ software. (C) Ras overexpression induces OIS. Ras‐induced BJ cells showed positive staining for β‐Gal after 16 and 18 days of Dox treatment. (D) Exogenous deoxynucleosides reduced the number of 53BP1 foci in cyclin A negative cells. BJ Ras cells were treated for 8 days to express Ras in the continuous presence of 4 deoxynucleosides (dATGC). The total number of 53BP1 foci in G1 cells was quantified using high‐throughput microscopy and the pictures were analyzed by ScanR software. A significant reduction of the number of 53BP1 foci was seen. (E) Cordycepin inhibited normal protein turnover. BJ Ras cells were non‐induced or induced for 8 days with Dox and incubated for the last 2 h with the transcription inhibitor cordycepin. Cordycepin treatment significantly reduced the number of 53BP1 foci in Ras overexpressing BJ cells, suggesting that active transcription is required to form/preserve the 53BP1 bodies. Normal turnover of other proteins might be also affected by cordycepin.
Supplemental Figure 2. The level of Myc expression in BJ MycER cells. BJ MycER cells were grown either without (mid panel) or with (bottom panel) 4‐OHT for 24 h and the nuclear Myc protein was detected by immunofluorescence (right column). The left column shows DAPI stained nuclei. Top images present BJ cells with the empty vector. Scale bars are 20 μm.
Supplemental Figure 3. The level of Myc expression in the nucleus of U2‐OS MycER cells is shown in (A). Images show untreated control cells (left) and cells treated for 3 days with 4‐OHT (right). (B) Apoptotic cells were detected by nuclear fragmentation and propidium iodide exclusion in control (left) and 4‐OHT‐induced (right) U2‐OS MycER cells. (C) Representative flow cytometry histograms of the cell cycle analysis of non‐treated control and 4‐OHT‐treated U2‐OS MycER cells at different time points. Cells that progressed through the cell cycle accumulated in the S phase after Myc activation. (D) The average number of 53BP1 bodies in Cyclin A negative cells was counted. U2‐OS MycER cells were incubated or not in the presence of 4‐OHT. More than 4000 cells were counted at each time point.
Supplemental Figure 4. Replication fork progression in U2‐OS MycER cells. The speed of replication fork progression in time course experiments is shown. (A) Typical examples of double‐labeled DNA fibers. (B) The fork speed from the first (CldU) and the second (IdU) pulse is shown in the plot; each point represents a single fork. (C) The number of analyzed forks, the mean extension rates (kb/min) and the SD values at different time points post‐induction are shown in the table.
Acknowledgments
This work was supported by grants from the Danish Cancer Society, the Danish Council for Independent Research (DFF‐1331‐00262), the Lundbeck Foundation (R93‐A8990), the European Commission (project DDResponse), the Grant Agency of the Czech Republic (13.17555S)and NPUI LO1304 from the Czech Ministry of Education.
Supplementary data 1.
1.1.
Supplementary data related to this article can be found at http://dx.doi.org/10.1016/j.molonc.2014.11.001.
Maya-Mendoza Apolinar, Ostrakova Jitka, Kosar Martin, Hall Arnaldur, Duskova Pavlina, Mistrik Martin, Merchut-Maya Joanna Maria, Hodny Zdenek, Bartkova Jirina, Christensen Claus, Bartek Jiri, (2015), Myc and Ras oncogenes engage different energy metabolism programs and evoke distinct patterns of oxidative and DNA replication stress, Molecular Oncology, 9, doi: 10.1016/j.molonc.2014.11.001.
Contributor Information
Apolinar Maya-Mendoza, Email: apomm@cancer.dk.
Jiri Bartek, Email: jb@cancer.dk.
References
- Aird, K.M. , Zhang, G. , Li, H. , Tu, Z. , Bitler, B.G. , Garipov, A. , Wu, H. , Wei, Z. , Wagner, S.N. , Herlyn, M. , Zhang, R. , 2013. Suppression of nucleotide metabolism underlies the establishment and maintenance of oncogene-induced senescence. Cell Rep. 3, 1252–1265. [DOI] [PMC free article] [PubMed] [Google Scholar]
- Alexandrova, A.Y. , Kopnin, P.B. , Vasiliev, J.M. , Kopnin, B.P. , 2006. ROS up-regulation mediates Ras-induced changes of cell morphology and motility. Exp. Cell Res. 312, 2066–2073. [DOI] [PubMed] [Google Scholar]
- Amati, B. , Land, H. , 1994. Myc-Max-Mad: a transcription factor network controlling cell cycle progression, differentiation and death. Curr. Opin. Genet. Dev. 4, 102–108. [DOI] [PubMed] [Google Scholar]
- Anglana, M. , Apiou, F. , Bensimon, A. , Debatisse, M. , 2003. Dynamics of DNA replication in mammalian somatic cells: nucleotide pool modulates origin choice and interorigin spacing. Cell. 114, 385–394. [DOI] [PubMed] [Google Scholar]
- Balaban, R.S. , Nemoto, S. , Finkel, T. , 2005. Mitochondria, oxidants, and aging. Cell. 120, 483–495. [DOI] [PubMed] [Google Scholar]
- Barbacid, M. , 1987. ras genes. Annu. Rev. Biochem. 56, 779–827. [DOI] [PubMed] [Google Scholar]
- Barger, J.F. , Plas, D.R. , 2010. Balancing biosynthesis and bioenergetics: metabolic programs in oncogenesis. Endocr. Relat. Cancer. 17, R287–R304. [DOI] [PubMed] [Google Scholar]
- Barlow, J.H. , Faryabi, R.B. , Callen, E. , Wong, N. , Malhowski, A. , Chen, H.T. , Gutierrez-Cruz, G. , Sun, H.W. , McKinnon, P. , Wright, G. , Casellas, R. , Robbiani, D.F. , Staudt, L. , Fernandez-Capetillo, O. , Nussenzweig, A. , 2013. Identification of early replicating fragile sites that contribute to genome instability. Cell. 152, 620–632. [DOI] [PMC free article] [PubMed] [Google Scholar]
- Bartek, J. , Mistrik, M. , Bartkova, J. , 2012. Thresholds of replication stress signaling in cancer development and treatment. Nat. Struct. Mol. Biol. 19, 5–7. [DOI] [PubMed] [Google Scholar]
- Bartkova, J. , Horejsi, Z. , Koed, K. , Kramer, A. , Tort, F. , Zieger, K. , Guldberg, P. , Sehested, M. , Nesland, J.M. , Lukas, C. , Orntoft, T. , Lukas, J. , Bartek, J. , 2005. DNA damage response as a candidate anti-cancer barrier in early human tumorigenesis. Nature. 434, 864–870. [DOI] [PubMed] [Google Scholar]
- Bartkova, J. , Rezaei, N. , Liontos, M. , Karakaidos, P. , Kletsas, D. , Issaeva, N. , Vassiliou, L.V. , Kolettas, E. , Niforou, K. , Zoumpourlis, V.C. , Takaoka, M. , Nakagawa, H. , Tort, F. , Fugger, K. , Johansson, F. , Sehested, M. , Andersen, C.L. , Dyrskjot, L. , Orntoft, T. , Lukas, J. , Kittas, C. , Helleday, T. , Halazonetis, T.D. , Bartek, J. , Gorgoulis, V.G. , 2006. Oncogene-induced senescence is part of the tumorigenesis barrier imposed by DNA damage checkpoints. Nature. 444, 633–637. [DOI] [PubMed] [Google Scholar]
- Bartkova, J. , Tommiska, J. , Oplustilova, L. , Aaltonen, K. , Tamminen, A. , Heikkinen, T. , Mistrik, M. , Aittomaki, K. , Blomqvist, C. , Heikkila, P. , Lukas, J. , Nevanlinna, H. , Bartek, J. , 2008. Aberrations of the MRE11-RAD50-NBS1 DNA damage sensor complex in human breast cancer: MRE11 as a candidate familial cancer-predisposing gene. Mol. Oncol. 2, 296–316. [DOI] [PMC free article] [PubMed] [Google Scholar]
- Bedard, K. , Krause, K.H. , 2007. The NOX family of ROS-generating NADPH oxidases: physiology and pathophysiology. Physiol. Rev. 87, 245–313. [DOI] [PubMed] [Google Scholar]
- Bermejo, R. , Lai, M.S. , Foiani, M. , 2012. Preventing replication stress to maintain genome stability: resolving conflicts between replication and transcription. Mol. Cell. 45, 710–718. [DOI] [PubMed] [Google Scholar]
- Bester, A.C. , Roniger, M. , Oren, Y.S. , Im, M.M. , Sarni, D. , Chaoat, M. , Bensimon, A. , Zamir, G. , Shewach, D.S. , Kerem, B. , 2011. Nucleotide deficiency promotes genomic instability in early stages of cancer development. Cell. 145, 435–446. [DOI] [PMC free article] [PubMed] [Google Scholar]
- Blancato, J. , Singh, B. , Liu, A. , Liao, D.J. , Dickson, R.B. , 2004. Correlation of amplification and overexpression of the c-myc oncogene in high-grade breast cancer: FISH, in situ hybridisation and immunohistochemical analyses. Br. J. Cancer. 90, 1612–1619. [DOI] [PMC free article] [PubMed] [Google Scholar]
- Burrell, R.A. , McClelland, S.E. , Endesfelder, D. , Groth, P. , Weller, M.C. , Shaikh, N. , Domingo, E. , Kanu, N. , Dewhurst, S.M. , Gronroos, E. , Chew, S.K. , Rowan, A.J. , Schenk, A. , Sheffer, M. , Howell, M. , Kschischo, M. , Behrens, A. , Helleday, T. , Bartek, J. , Tomlinson, I.P. , Swanton, C. , 2013. Replication stress links structural and numerical cancer chromosomal instability. Nature. 494, 492–496. [DOI] [PMC free article] [PubMed] [Google Scholar]
- Burrell, R.A. , McGranahan, N. , Bartek, J. , Swanton, C. , 2013. The causes and consequences of genetic heterogeneity in cancer evolution. (Insight Review) Nature. 501, 338–345. [DOI] [PubMed] [Google Scholar]
- Campaner, S. , Doni, M. , Hydbring, P. , Verrecchia, A. , Bianchi, L. , Sardella, D. , Schleker, T. , Perna, D. , Tronnersjo, S. , Murga, M. , Fernandez-Capetillo, O. , Barbacid, M. , Larsson, L.G. , Amati, B. , 2010. Cdk2 suppresses cellular senescence induced by the c-myc oncogene. Nat. Cell Biol. 12, 54–59. [DOI] [PubMed] [Google Scholar]
- Chrzan, P. , Skokowski, J. , Karmolinski, A. , Pawelczyk, T. , 2001. Amplification of c-myc gene and overexpression of c-Myc protein in breast cancer and adjacent non-neoplastic tissue. Clin. Biochem. 34, 557–562. [DOI] [PubMed] [Google Scholar]
- Dang, C.V. , 2012. Links between metabolism and cancer. Genes Dev. 26, 877–890. [DOI] [PMC free article] [PubMed] [Google Scholar]
- Dang, C.V. , O'Donnell, K.A. , Zeller, K.I. , Nguyen, T. , Osthus, R.C. , Li, F. , 2006. The c-Myc target gene network. Semin. Cancer Biol. 16, 253–264. [DOI] [PubMed] [Google Scholar]
- Daugaard, M. , Nitsch, R. , Razaghi, B. , McDonald, L. , Jarrar, A. , Torrino, S. , Castillo-Lluva, S. , Rotblat, B. , Li, L. , Malliri, A. , Lemichez, E. , Mettouchi, A. , Berman, J.N. , Penninger, J.M. , Sorensen, P.H. , 2013. Hace1 controls ROS generation of vertebrate Rac1-dependent NADPH oxidase complexes. Nat. Commun. 4, 2180 [DOI] [PMC free article] [PubMed] [Google Scholar]
- Debatisse, M. , Le Tallec, B. , Letessier, A. , Dutrillaux, B. , Brison, O. , 2012. Common fragile sites: mechanisms of instability revisited. Trends Genet. 28, 22–32. [DOI] [PubMed] [Google Scholar]
- Di Micco, R. , Fumagalli, M. , Cicalese, A. , Piccinin, S. , Gasparini, P. , Luise, C. , Schurra, C. , Garre, M. , Nuciforo, P.G. , Bensimon, A. , Maestro, R. , Pelicci, P.G. , d'Adda di Fagagna, F. , 2006. Oncogene-induced senescence is a DNA damage response triggered by DNA hyper-replication. Nature. 444, 638–642. [DOI] [PubMed] [Google Scholar]
- Dominguez-Sola, D. , Ying, C.Y. , Grandori, C. , Ruggiero, L. , Chen, B. , Li, M. , Galloway, D.A. , Gu, W. , Gautier, J. , Dalla-Favera, R. , 2007. Non-transcriptional control of DNA replication by c-Myc. Nature. 448, 445–451. [DOI] [PubMed] [Google Scholar]
- Durkin, S.G. , Glover, T.W. , 2007. Chromosome fragile sites. Annu. Rev. Genet. 41, 169–192. [DOI] [PubMed] [Google Scholar]
- Eilers, M. , Schirm, S. , Bishop, J.M. , 1991. The MYC protein activates transcription of the alpha-prothymosin gene. EMBO J. 10, 133–141. [DOI] [PMC free article] [PubMed] [Google Scholar]
- Evangelou, K. , Bartkova, J. , Kotsinas, A. , Pateras, I.S. , Liontos, M. , Velimezi, G. , Kosar, M. , Liloglou, T. , Trougakos, I.P. , Dyrskjot, L. , Andersen, C.L. , Papaioannou, M. , Drosos, Y. , Papafotiou, G. , Hodny, Z. , Sosa-Pineda, B. , Wu, X.R. , Klinakis, A. , Orntoft, T. , Lukas, J. , Bartek, J. , Gorgoulis, V.G. , 2013. The DNA damage checkpoint precedes activation of ARF in response to escalating oncogenic stress during tumorigenesis. Cell Death Differ. 20, 1485–1497. [DOI] [PMC free article] [PubMed] [Google Scholar]
- Fan, Y. , Dickman, K.G. , Zong, W.X. , 2010. Akt and c-Myc differentially activate cellular metabolic programs and prime cells to bioenergetic inhibition. J. Biol. Chem. 285, 7324–7333. [DOI] [PMC free article] [PubMed] [Google Scholar]
- Ferraro, D. , Corso, S. , Fasano, E. , Panieri, E. , Santangelo, R. , Borrello, S. , Giordano, S. , Pani, G. , Galeotti, T. , 2006. Pro-metastatic signaling by c-Met through RAC-1 and reactive oxygen species (ROS). Oncogene. 25, 3689–3698. [DOI] [PubMed] [Google Scholar]
- Filipp, F.V. , Ratnikov, B. , De Ingeniis, J. , Smith, J.W. , Osterman, A.L. , Scott, D.A. , 2012. Glutamine-fueled mitochondrial metabolism is decoupled from glycolysis in melanoma. Pigment Cell Melanoma Res. 25, 732–739. [DOI] [PMC free article] [PubMed] [Google Scholar]
- Georgakilas, A.G. , Tsantoulis, P. , Kotsinas, A. , Michalopoulos, I. , Townsend, P. , Gorgoulis, V. , 2014. Are common fragile sites merely structural domains or highly organized “functional” units susceptible to oncogenic stress?. Cell. Mol. Life Sci. 71, 4519–4544. [DOI] [PMC free article] [PubMed] [Google Scholar]
- Gianni, D. , Bohl, B. , Courtneidge, S.A. , Bokoch, G.M. , 2008. The involvement of the tyrosine kinase c-Src in the regulation of reactive oxygen species generation mediated by NADPH oxidase-1. Mol. Biol. Cell. 19, 2984–2994. [DOI] [PMC free article] [PubMed] [Google Scholar]
- Goga, A. , Yang, D. , Tward, A.D. , Morgan, D.O. , Bishop, J.M. , 2007. Inhibition of CDK1 as a potential therapy for tumors over-expressing MYC. Nat. Med. 13, 820–827. [DOI] [PubMed] [Google Scholar]
- Gorgoulis, V.G. , Vassiliou, L.V. , Karakaidos, P. , Zacharatos, P. , Kotsinas, A. , Liloglou, T. , Venere, M. , Ditullio, R.A. , Kastrinakis, N.G. , Levy, B. , 2005. Activation of the DNA damage checkpoint and genomic instability in human precancerous lesions. Nature. 434, 907–913. [DOI] [PubMed] [Google Scholar]
- Hahn, W.C. , Dessain, S.K. , Brooks, M.W. , King, J.E. , Elenbaas, B. , Sabatini, D.M. , DeCaprio, J.A. , Weinberg, R.A. , 2002. Enumeration of the simian virus 40 early region elements necessary for human cell transformation. Mol. Cell Biol. 22, 2111–2123. [DOI] [PMC free article] [PubMed] [Google Scholar]
- Halazonetis, T.D. , Gorgoulis, V.G. , Bartek, J. , 2008. An oncogene-induced DNA damage model for cancer development. Science. 319, 1352–1355. [DOI] [PubMed] [Google Scholar]
- Haq, R. , Shoag, J. , Andreu-Perez, P. , Yokoyama, S. , Edelman, H. , Rowe, G.C. , Frederick, D.T. , Hurley, A.D. , Nellore, A. , Kung, A.L. , 2013. Oncogenic BRAF regulates oxidative metabolism via PGC1alpha and MITF. Cancer Cell. 23, 302–315. [DOI] [PMC free article] [PubMed] [Google Scholar]
- Hall, A. , Meyle, K.D. , Lange, M.K. , Klima, M. , Sanderhoff, M. , Dahl, C. , Abildgaard, C. , Thorup, K. , Moghimi, S.M. , Jensen, P.B. , Bartek, J. , Guldberg, P. , Christensen, C. , 2013. Dysfunctional oxidative phosphorylation makes malignant melanoma cells addicted to glycolysis driven by the (V600E)BRAF oncogene. Oncotarget. 4, 584–599. [DOI] [PMC free article] [PubMed] [Google Scholar]
- Henry-Mowatt, J. , Jackson, D. , Masson, J.Y. , Johnson, P.A. , Clements, P.M. , Benson, F.E. , Thompson, L.H. , Takeda, S. , West, S.C. , Caldecott, K.W. , 2003. XRCC3 and Rad51 modulate replication fork progression on damaged vertebrate chromosomes. Mol. Cell. 11, 1109–1117. [DOI] [PubMed] [Google Scholar]
- Hubackova, S. , Krejcikova, K. , Bartek, J. , Hodny, Z. , 2012. IL1- and TGFbeta-Nox4 signaling, oxidative stress and DNA damage response are shared features of replicative, oncogene-induced, and drug-induced paracrine 'bystander senescence'. Aging (Albany NY). 4, 932–951. [DOI] [PMC free article] [PubMed] [Google Scholar]
- Irani, K. , Xia, Y. , Zweier, J.L. , Sollott, S.J. , Der, C.J. , Fearon, E.R. , Sundaresan, M. , Finkel, T. , Goldschmidt-Clermont, P.J. , 1997. Mitogenic signaling mediated by oxidants in Ras-transformed fibroblasts. Science. 275, 1649–1652. [DOI] [PubMed] [Google Scholar]
- Isobe, T. , Hattori, T. , Kitagawa, K. , Uchida, C. , Kotake, Y. , Kosugi, I. , Oda, T. , Kitagawa, M. , 2009. Adenovirus E1A inhibits SCF(Fbw7) ubiquitin ligase. J. Biol. Chem. 284, 27766–27779. [DOI] [PMC free article] [PubMed] [Google Scholar]
- Jones, R.M. , Mortusewicz, O. , Afzal, I. , Lorvellec, M. , Garcia, P. , Helleday, T. , Petermann, E. , 2013. Increased replication initiation and conflicts with transcription underlie Cyclin E-induced replication stress. Oncogene. 32, 3744–3753. [DOI] [PubMed] [Google Scholar]
- Kosar, M. , Bartkova, J. , Hubackova, S. , Hodny, Z. , Lukas, J. , Bartek, J. , 2011. Senescence-associated heterochromatin foci are dispensable for cellular senescence, occur in a cell type- and insult-dependent manner and follow expression of p16(ink4a). Cell Cycle. 10, 457–468. [DOI] [PubMed] [Google Scholar]
- Land, H. , Parada, L.F. , Weinberg, R.A. , 1983. Tumorigenic conversion of primary embryo fibroblasts requires at least two cooperating oncogenes. Nature. 304, 596–602. [DOI] [PubMed] [Google Scholar]
- Le, A. , Lane, A.N. , Hamaker, M. , Bose, S. , Gouw, A. , Barbi, J. , Tsukamoto, T. , Rojas, C.J. , Slusher, B.S. , Zhang, H. , Zimmerman, L.J. , Liebler, D.C. , Slebos, R.J. , Lorkiewicz, P.K. , Higashi, R.M. , Fan, T.W. , Dang, C.V. , 2012. Glucose-independent glutamine metabolism via TCA cycling for proliferation and survival in B cells. Cell Metab. 15, 110–121. [DOI] [PMC free article] [PubMed] [Google Scholar]
- Lee, T. , Yao, G. , Nevins, J. , You, L. , 2008. Sensing and integration of Erk and PI3K signals by Myc. Plos Comput. Biol. 4, e1000013 [DOI] [PMC free article] [PubMed] [Google Scholar]
- Letessier, A. , Millot, G.A. , Koundrioukoff, S. , Lachages, A.M. , Vogt, N. , Hansen, R.S. , Malfoy, B. , Brison, O. , Debatisse, M. , 2011. Cell-type-specific replication initiation programs set fragility of the FRA3B fragile site. Nature. 470, 120–123. [DOI] [PubMed] [Google Scholar]
- Lewis, B.C. , Prescott, J.E. , Campbell, S.E. , Shim, H. , Orlowski, R.Z. , Dang, C.V. , 2000. Tumor induction by the c-Myc target genes rcl and lactate dehydrogenase A. Cancer Res. 60, 6178–6183. [PubMed] [Google Scholar]
- Littlewood, T.D. , Hancock, D.C. , Danielian, P.S. , Parker, M.G. , Evan, G.I. , 1995. A modified oestrogen receptor ligand-binding domain as an improved switch for the regulation of heterologous proteins. Nucleic Acids Res. 23, 1686–1690. [DOI] [PMC free article] [PubMed] [Google Scholar]
- Machida, Y.J. , Hamlin, J.L. , Dutta, A. , 2005. Right place, right time, and only once: replication initiation in metazoans. Cell. 123, 13–24. [DOI] [PubMed] [Google Scholar]
- Maya-Mendoza, A. , Olivares-Chauvet, P. , Kohlmeier, F. , Jackson, D.A. , 2012. Visualising chromosomal replication sites and replicons in mammalian cells. Methods. 57, 140–148. [DOI] [PubMed] [Google Scholar]
- Maya-Mendoza, A. , Petermann, E. , Gillespie, D.A. , Caldecott, K.W. , Jackson, D.A. , 2007. Chk1 regulates the density of active replication origins during the vertebrate S phase. EMBO J. 26, 2719–2731. [DOI] [PMC free article] [PubMed] [Google Scholar]
- Mistrik, M. , Oplustilova, L. , Lukas, J. , Bartek, 2009. Low-dose DNA damage and replication stress responses quantified by optimized automated single-cell image analysis. Cell Cycle. 8, 2592–2599. [DOI] [PubMed] [Google Scholar]
- Mitsushita, J. , Lambeth, J.D. , Kamata, T. , 2004. The superoxide-generating oxidase Nox1 is functionally required for Ras oncogene transformation. Cancer Res. 64, 3580–3585. [DOI] [PubMed] [Google Scholar]
- Nesbit, C.E. , Tersak, J.M. , Prochownik, E.V. , 1999. MYC oncogenes and human neoplastic disease. Oncogene. 18, 3004–3016. [DOI] [PubMed] [Google Scholar]
- Ohtsubo, M. , Roberts, J.M. , 1993. Cyclin-dependent regulation of G1 in mammalian fibroblasts. Science. 259, 1908–1912. [DOI] [PubMed] [Google Scholar]
- Parks, S.K. , Chiche, J. , Pouyssegur, J. , 2013. Disrupting proton dynamics and energy metabolism for cancer therapy. Nat. Rev. Cancer. 13, 611–623. [DOI] [PubMed] [Google Scholar]
- Patel, J.H. , Loboda, A.P. , Showe, M.K. , Showe, L.C. , McMahon, S.B. , 2004. Analysis of genomic targets reveals complex functions of MYC. Nat. Rev. Cancer. 4, 562–568. [DOI] [PubMed] [Google Scholar]
- Pratilas, C.A. , Solit, D.B. , 2010. Targeting the mitogen-activated protein kinase pathway: physiological feedback and drug response. Clin. Cancer Res. 16, 3329–3334. [DOI] [PMC free article] [PubMed] [Google Scholar]
- Privat, M. , Radosevic-Robin, N. , Aubel, C. , Cayre, A. , Penault-Llorca, F. , Marceau, G. , Sapin, V. , Bignon, Y. , Marvan, D. , 2014. BRCA1 induces major energetic metabolism reprogramming in breast cancer cells. PlosOne. 9, e102438 [DOI] [PMC free article] [PubMed] [Google Scholar]
- Qiu, R.G. , Chen, J. , Kirn, D. , McCormick, F. , Symons, M. , 1995. An essential role for Rac in Ras transformation. Nature. 374, 457–459. [DOI] [PubMed] [Google Scholar]
- Rai, P. , Young, J.J. , Burton, D.G. , Giribaldi, M.G. , Onder, T.T. , Weinberg, R.A. , 2011. Enhanced elimination of oxidized guanine nucleotides inhibits oncogenic RAS-induced DNA damage and premature senescence. Oncogene. 30, 1489–1496. [DOI] [PubMed] [Google Scholar]
- Ranjan, P. , Anathy, V. , Burch, P.M. , Weirather, K. , Lambeth, J.D. , Heintz, N.H. , 2006. Redox-dependent expression of cyclin D1 and cell proliferation by Nox1 in mouse lung epithelial cells. Antioxid. Redox Signal. 8, 1447–1459. [DOI] [PubMed] [Google Scholar]
- Schuhmacher, M. , Staege, M.S. , Pajic, A. , Polack, A. , Weidle, U.H. , Bornkamm, G.W. , Eick, D. , Kohlhuber, F. , 1999. Control of cell growth by c-Myc in the absence of cell division. Curr. Biol. 9, 1255–1258. [DOI] [PubMed] [Google Scholar]
- Sears, R. , Nuckolls, F. , Haura, E. , Taya, Y. , Tamai, K. , Nevins, J.R. , 2000. Multiple Ras-dependent phosphorylation pathways regulate Myc protein stability. Genes Dev. 14, 2501–2514. [DOI] [PMC free article] [PubMed] [Google Scholar]
- Sears, R.C. , 2004. The life cycle of C-myc: from synthesis to degradation. Cell Cycle. 3, 1133–1137. [PubMed] [Google Scholar]
- Seger, Y.R. , Garcia-Cao, M. , Piccinin, S. , Cunsolo, C.L. , Doglioni, C. , Blasco, M.A. , Hannon, G.J. , Maestro, R. , 2002. Transformation of normal human cells in the absence of telomerase activation. Cancer Cell. 2, 401–413. [DOI] [PubMed] [Google Scholar]
- Smolkova, K. , Plecita-Hlavata, L. , Bellance, N. , Benard, G. , Rossignol, R. , Jezek, P. , 2011. Waves of gene regulation suppress and then restore oxidative phosphorylation in cancer cells. Int. J. Biochem. Cell Biol. 43, 950–968. [DOI] [PubMed] [Google Scholar]
- Srinivasan, S.V. , Dominguez-Sola, D. , Wang, L.C. , Hyrien, O. , Gautier, J. , 2013. Cdc45 is a critical effector of myc-dependent DNA replication stress. Cell Rep. 3, 1629–1639. [DOI] [PMC free article] [PubMed] [Google Scholar]
- Suh, Y.A. , Arnold, R.S. , Lassegue, B. , Shi, J. , Xu, X. , Sorescu, D. , Chung, A.B. , Griendling, K.K. , Lambeth, J.D. , 1999. Cell transformation by the superoxide-generating oxidase Mox1. Nature. 401, 79–82. [DOI] [PubMed] [Google Scholar]
- Takacova, S. , Slany, R. , Bartkova, J. , Stranecky, V. , Dolezel, P. , Luzna, P. , Bartek, J. , Divoky, V. , 2012. DNA damage response and inflammatory signaling limit the MLL-ENL-induced leukemogenesis in vivo. Cancer Cell. 21, 517–531. [DOI] [PubMed] [Google Scholar]
- Taub, R. , Kirsch, I. , Morton, C. , Lenoir, G. , Swan, D. , Tronick, S. , Aaronson, S. , Leder, P. , 1982. Translocation of the c-myc gene into the immunoglobulin heavy chain locus in human Burkitt lymphoma and murine plasmacytoma cells. Proc. Natl. Acad. Sci. U S A. 79, 7837–7841. [DOI] [PMC free article] [PubMed] [Google Scholar]
- Toledo, L.I. , Altmeyer, M. , Rask, M.B. , Lukas, C. , Larsen, D.H. , Povlsen, L.K. , Bekker-Jensen, S. , Mailand, N. , Bartek, J. , Lukas, J. , 2013. ATR prohibits replication catastrophe by preventing global exhaustion of RPA. Cell. 155, 1088–1103. [DOI] [PubMed] [Google Scholar]
- Tong, X. , Zhao, F. , Thompson, C.B. , 2009. The molecular determinants of de novo nucleotide biosynthesis in cancer cells. Curr. Opin. Genet. Dev. 19, 32–37. [DOI] [PMC free article] [PubMed] [Google Scholar]
- Ueyama, T. , Geiszt, M. , Leto, T.L. , 2006. Involvement of Rac1 in activation of multicomponent Nox1- and Nox3-based NADPH oxidases. Mol. Cell Biol. 26, 2160–2174. [DOI] [PMC free article] [PubMed] [Google Scholar]
- Vafa, O. , Wade, M. , Kern, S. , Beeche, M. , Pandita, T.K. , Hampton, G.M. , Wahl, G.M. , 2002. c-Myc can induce DNA damage, increase reactive oxygen species, and mitigate p53 function: a mechanism for oncogene-induced genetic instability. Mol. Cell. 9, 1031–1044. [DOI] [PubMed] [Google Scholar]
- Vander Heiden, M.G. , Cantley, L.C. , Thompson, C.B. , 2009. Understanding the Warburg effect: the metabolic requirements of cell proliferation. Science. 324, 1029–1033. [DOI] [PMC free article] [PubMed] [Google Scholar]
- Vander Heiden, M.G. , 2011. Targeting cancer metabolism: a therapeutic window opens. Nat. Rev. Drug Disc. 10, 671–684. [DOI] [PubMed] [Google Scholar]
- Viale, A. , Pettazzoni, P. , Lyssiotis, C.A. , Ying, H. , Sanchez, N. , Marchesini, M. , Carugo, A. , Green, T. , Seth, S. , Giuliani, V. , 2014. Oncogene ablation-resistant pancreatic cancer cells depend on mitochondrial function. Nature. 514, 628–632. [DOI] [PMC free article] [PubMed] [Google Scholar]
- Welcker, M. , Clurman, B.E. , 2008. FBW7 ubiquitin ligase: a tumour suppressor at the crossroads of cell division, growth and differentiation. Nat. Rev. Cancer. 8, 83–93. [DOI] [PubMed] [Google Scholar]
- Weyemi, U. , Lagente-Chevallier, O. , Boufraqech, M. , Prenois, F. , Courtin, F. , Caillou, B. , Talbot, M. , Dardalhon, M. , Al Ghuzlan, A. , Bidart, J.M. , Schlumberger, M. , Dupuy, C. , 2012. ROS-generating NADPH oxidase NOX4 is a critical mediator in oncogenic H-Ras-induced DNA damage and subsequent senescence. Oncogene. 31, 1117–1129. [DOI] [PMC free article] [PubMed] [Google Scholar]
- Yeh, E. , Cunningham, M. , Arnold, H. , Chasse, D. , Monteith, T. , Ivaldi, G. , Hahn, W.C. , Stukenberg, P.T. , Shenolikar, S. , Uchida, T. , Counter, C.M. , Nevins, J.R. , Means, A.R. , Sears, R. , 2004. A signalling pathway controlling c-Myc degradation that impacts oncogenic transformation of human cells. Nat. Cell Biol. 6, 308–318. [DOI] [PubMed] [Google Scholar]
Associated Data
This section collects any data citations, data availability statements, or supplementary materials included in this article.
Supplementary Materials
The following are the supplementary data related to this article:
Supplemental Figure 1. (A) BJ Ras cells were induced (Dox) and non‐induced (control) in a time course experiment and processed for the immunoblot analysis of Ras expression; β‐actin was used as a loading control. (B) Western blots were scanned and the relative amount of Ras was quantified using ImageJ software. (C) Ras overexpression induces OIS. Ras‐induced BJ cells showed positive staining for β‐Gal after 16 and 18 days of Dox treatment. (D) Exogenous deoxynucleosides reduced the number of 53BP1 foci in cyclin A negative cells. BJ Ras cells were treated for 8 days to express Ras in the continuous presence of 4 deoxynucleosides (dATGC). The total number of 53BP1 foci in G1 cells was quantified using high‐throughput microscopy and the pictures were analyzed by ScanR software. A significant reduction of the number of 53BP1 foci was seen. (E) Cordycepin inhibited normal protein turnover. BJ Ras cells were non‐induced or induced for 8 days with Dox and incubated for the last 2 h with the transcription inhibitor cordycepin. Cordycepin treatment significantly reduced the number of 53BP1 foci in Ras overexpressing BJ cells, suggesting that active transcription is required to form/preserve the 53BP1 bodies. Normal turnover of other proteins might be also affected by cordycepin.
Supplemental Figure 2. The level of Myc expression in BJ MycER cells. BJ MycER cells were grown either without (mid panel) or with (bottom panel) 4‐OHT for 24 h and the nuclear Myc protein was detected by immunofluorescence (right column). The left column shows DAPI stained nuclei. Top images present BJ cells with the empty vector. Scale bars are 20 μm.
Supplemental Figure 3. The level of Myc expression in the nucleus of U2‐OS MycER cells is shown in (A). Images show untreated control cells (left) and cells treated for 3 days with 4‐OHT (right). (B) Apoptotic cells were detected by nuclear fragmentation and propidium iodide exclusion in control (left) and 4‐OHT‐induced (right) U2‐OS MycER cells. (C) Representative flow cytometry histograms of the cell cycle analysis of non‐treated control and 4‐OHT‐treated U2‐OS MycER cells at different time points. Cells that progressed through the cell cycle accumulated in the S phase after Myc activation. (D) The average number of 53BP1 bodies in Cyclin A negative cells was counted. U2‐OS MycER cells were incubated or not in the presence of 4‐OHT. More than 4000 cells were counted at each time point.
Supplemental Figure 4. Replication fork progression in U2‐OS MycER cells. The speed of replication fork progression in time course experiments is shown. (A) Typical examples of double‐labeled DNA fibers. (B) The fork speed from the first (CldU) and the second (IdU) pulse is shown in the plot; each point represents a single fork. (C) The number of analyzed forks, the mean extension rates (kb/min) and the SD values at different time points post‐induction are shown in the table.