

Abstract
Collaborator of ARF (CARF), initially identified as a binding partner of ARF (Alternate Reading Frame), has been shown to activate ARF–p53 pathway by multiple ways including stabilization of ARF and p53 tumor suppressor proteins, and transcriptional repression of a p53 antagonist, HDM2. Level of CARF expression was shown to determine fate of cells. Whereas its knockdown caused apoptosis, its over‐ and super‐expressions caused senescence and increase in malignant properties of cancer cells, respectively, and were closely linked to increase and decrease in p53 activity. Using p53‐compromised cancer cells, we demonstrate that CARF induces growth arrest when wild type p53 is present and in p53‐absence, it promotes carcinogenesis. Biochemical analyses on CARF‐induced molecular signaling revealed that in p53‐null cells, it caused transcriptional repression of p21WAF1 leading to increase in CDK4, CDK6, pRb and E2F1 resulting in continued cell cycle progression. Furthermore, it instigated increase in migration and invasion of cancer cells that was marked by upregulation of MMP2, MMP3, MMP9, uPA, several interleukins and VEGF expression. Consistent with these findings, we found that human clinical samples of epithelial and glial cancers (frequently marked by loss of p53 function) possessed high level of CARF expression showing a relationship with cancer aggressiveness. The data demonstrated that CARF could be considered as a diagnostic marker and a therapeutic target in p53‐compromised malignancies.
Keywords: CARF (Collaborator of ARF), Overexpression, p53-Deficient cancer cells, Proliferation, p53 reconstitution, Growth arrest
Highlights
Collaborator of ARF (CARF) has been shown to activate ARF‐p53 pathway.
It promotes carcinogenesis in p53‐deficient cells by repressing p21WAF1 and promoting cell cycle progression.
It also promotes migration and invasive potential by modulating expression of MMPs, uPA, several interleukins and VEGF.
Clinical high‐grade cancer tissues possess enriched CARF expression suggesting a relationship with cancer aggressiveness.
CARF could be a potential diagnostic marker and a therapeutic target in p53‐compromised malignancies.
1. Introduction
Cancer remains the foremost killer worldwide contributing to not only death, but also compromising the quality of life. Recent advances in cancer research have contributed to better treatment outcomes. However, therapeutic failures, serious side effects and recurrence are yet very common and underline the importance of deeper understanding of the mechanisms of carcinogenesis (Burrell and Swanton, 2014). Uncontrolled proliferation of cancer cells, an established hallmark of cancer, is facilitated by loss of tumor suppressor functions that normally halt the propagation of damaged cells through mechanisms such as cell cycle arrest, senescence and apoptosis (Campisi, 2005; Erol, 2011). The p53 tumor suppressor is considered as the master sensor of stress and primary guardian of the genome. It regulates cell proliferation through its role as a transcriptional activator and repressor, regulating a complex web of signal transduction pathways, and is frequently inactivated in a broad spectrum of cancers (Kracikova et al., 2013; Bieging et al., 2014).
DNA damage triggers the sensors, ATM (ataxia telangiectasia mutated) and ATR (ATM‐related) proteins that activate the DNA damage response (DDR) cascade through activation of their downstream effectors, checkpoint (CHK)1 and CHK2, ultimately culminating in p53 upregulation (Bartek et al., 2007). p21WAF1 protein is the main established downstream effector of p53 that functions by its inhibitory effect on cyclin dependent kinases (CDKs) and associated cyclins that are essential for cell cycle progression (Erol, 2011). p21WAF1 induces cell cycle arrest to allow crucial DNA repair, and if this fails due to prolonged stress or irreparable damage, senescence is initiated through further activation of other targets such as retinoblastoma (pRb) and PML (promyelocytic leukemia) (Vernier and Ferbeyre, 2014). On the other hand, apoptosis may be induced by activation of PUMA, Bax and caspases (Cheung et al., 2011; Hikisz and Kilianska, 2012). Cell fate decisions based on p53 are time‐ and cell type‐dependent, in addition to the source of the stress; the exact mechanisms of their regulation are yet to be clarified.
We have previously identified that CARF (collaborator of alternative reading frame) activates p53 functions by (i) direct interactions and stabilization of ARF as well as p53 proteins and (ii) transcriptional repression of a p53‐antagonist HDM2 (human homologue of mouse double minute 2) (Hasan et al., 2004, 2008). Overexpression of CARF in human normal and cancer cells with wild type p53 function caused their growth arrest, marked by upregulation of p21WAF1 protein (Singh et al., 2014). Inhibition of CARF, on the other hand, led to mitotic catastrophe and apoptosis by a p53‐independent pathway (Cheung et al., 2011). Furthermore, it was discovered that the expression level of CARF (moderate or extremely high) determined the fate of cells and promoted senescence or enhanced proliferation, respectively (Cheung et al., 2014). These phenomena were regulated by p53, ERK (extracellular signal‐regulated kinase) and CHK1/2 signalings (Cheung et al., 2014). We had earlier reported that whereas overexpression of CARF led to upregulation of p53 and triggered anti‐proliferative signaling, its super‐expression resulted in downregulation of p53 and elicited pro‐proliferative signaling (Cheung et al., 2014) suggesting that CARF may regulate cell proliferation differently in cancer cells with variable p53 status. Therefore, in the present study, we investigated the effect of CARF overexpression (COE) in p53‐deficient cancer cells. Using in vitro and in vivo assays, we found that the overexpression of CARF in p53 null cells promoted their proliferation, migration and invasion instead of senescence. It was mediated by transcriptional inactivation of p21WAF1, and activation of E2F1 and MMP proteins. Noticeably, restoration of functional p53 in CARF‐overexpressing cells caused growth arrest and senescence, suggesting that p53 is crucial for CARF‐induced growth arrest. In agreement with this data, we found that human clinical samples of epithelial and glial cancers (frequently marked by non‐functional p53 status) possessed high level of CARF, suggesting its use as a diagnostic marker and therapeutic target for cancer treatment.
2. Materials and methods
2.1. Cell culture
Cells compromised for p53 function (SKOV‐3, Saos‐2, MCF7 and C33A; Supplementary Table 1) were obtained from the American Type Culture Collection (Manassas, VA, USA) and cultured in Dulbecco's modified Eagle's Minimal Essential Medium (DMEM)‐supplemented with 10% fetal bovine serum (FBS) and 1% penicillin/streptomycin. Cultures were maintained at 37 °C with 95% O2 and 5% CO2 in a humidified chamber.
2.2. Retrovirus infection
Exogenous expression of CARF was carried out using a retroviral carrier of GFP‐tagged CARF that was cloned into a pCX4neo vector as previously described (Cheung et al., 2014). All the transfections were performed with FuGENE6 (Roche), following the manufacturer's protocol. Culture medium was replaced with fresh media 24 h after transfection. The viral stock was diluted 1/100, supplemented with 8 μg/ml polybrene and used to infect cells for the generation of CARF‐overexpressing (COE) cells. Selection of infected clones was performed with medium containing G418 (500–900 μg/ml) after 18–24 h to obtain stable GFP‐CARF expressing cell lines. The cells were tested for expression of recombinant CARF by immunoblotting as described below.
2.3. Plasmid transfections
The vectors containing cDNAs encoding GFP‐p53, pSGL5, pRb‐HA, pCDNA3, p53Val138 or a GFP protein were transiently transfected into control or COE cells using X‐tremeGENE 9 (Roche), following the manufacturer's protocol. In brief, cells were plated into a 6‐well plate, and 2 μg of each vector was transfected into cells at a ratio of 3:1 of transfection reagent to DNA in antibiotic‐free Opti‐MEM (Invitrogen) media. After 48–72 h, the transfected cells were subjected to the following in vitro assays.
2.4. Tetrazolium dye (MTT)‐based proliferation assay
Control and transfected derivative cells (3 × 10³) were seeded into 96‐well microtiter plates and grown for 48 h, followed by addition of MTT (MTT 3‐(4,5‐dimethylthiazol‐2‐yl)‐2,5‐diphenyltetrazolium bromide) (0.5 mg/ml) (Roche), incubation for 4 h and measurement with a microplate reader (Infinite 200 PRO, Tecan, Austria) at 570 nm.
2.5. Clonogenic assays
To evaluate the clonogenic capacity of the cells, 500 cells were plated in each well of 6‐well plates and allowed to grow for 6–12 days. Culture medium was replaced every 3rd day. For fixation, cells were washed with PBS, fixed with ice‐cold methanol and acetone (1:1) for 10 min at room temperature and stained with 0.1% crystal violet, followed by manual count of visible colonies.
2.6. Cell cycle analysis
Cell cycle analysis was performed by flow cytometry. Cells were harvested and fixed in 70% chilled ethanol for 15–30 min at 4 °C. Cells were incubated with 50 μl Ribonuclease A (5 mg/ml; Qiagen, Hilden, Germany) followed by washing for 30 min at 37 °C. Cells were then stained with 250 μl Guava Cell Cycle Reagent (50 μg/ml) for 1 h in dark and acquired using the Guava Cell Cycle Analyser (Millipore, Billerica, MA). The data was analyzed by ModFit software to evaluate the distribution of cells in different phases of the cell cycle.
2.7. Reverse transcriptase PCR (RT‐PCR)
RT‐PCR was performed as described earlier (Cheung et al., 2014). PCR amplifications were performed using equal amounts of synthesized cDNA with gene‐specific primer sets as described in Supplementary Table 2, and the Phusion high‐fidelity DNA polymerase system (New England Biolabs, Ipswich, MA). The PCR products were then run on a 1% agarose gel and stained with ethidium bromide for visualization.
2.8. Immunoblotting
Immunoblotting was performed as previously described (Cheung et al., 2014). Details of the antibodies are provided in Supplementary Table 3. Densitometric quantitation of three independent immunoblotting experiments was performed with the ImageJ software (National Institute of Health, Bethesda, MA). Expression data is represented as relative units post‐normalization with β‐actin.
2.9. Luciferase reporter assays
Cells were transfected with pWWP‐Luc (p21/WAF1 promoter; sequence −1 to −3000 bp) and control pRL‐TK (Renilla Luciferase control reporter) plasmids as described above. Lysates were prepared from cells in passive lysis buffer at 24 h post‐transfections (Promega). Luciferase activity was measured using Dual‐Luciferase® reporter assay system (Promega, WI, USA) on Infinite 200 PRO, luminescent plate reader. To determine luciferase activity in live cells, 35‐mm dishes were prepared post‐transfections and incubated with d‐luciferin (TOYOBO, Osaka, Japan; 0.2 mM) substrate into the culture medium. Luciferase activity was recorded at 37 °C with 5% CO2 using Kronos‐Dio Luminometer (Atto, Tokyo, Japan). The fold change of luciferase activity in COE cells was determined with control post‐normalization to the control vector.
2.10. Immunofluorescence staining
Immunostaining was performed as described earlier (Cheung et al., 2014). Details of antibodies are provided in Supplementary Table 3. The slides were viewed using a Zeiss Axioplan 2 microscope, and the images were captured using a Zeiss AxioCam HRc camera.
2.11. β‐galactosidase senescence assay
β‐galactosidase senescence assay was performed with the Senescence Cells Histochemical Staining Kit (Sigma–Aldrich). Briefly, mono‐layered cells in 6‐well plates were fixed with 2% paraformaldehyde in PBS for 10 min followed by 37 °C overnight incubation in staining solution (citric acid/phosphate buffer, pH 6.0, 5 mm K3Fe(CN)6, 5 mm K4Fe(CN)6, 2 mm MgCl2, 150 mm NaCl), supplemented with 1 mg/ml of 5‐bromo‐4‐chloro‐3‐indolyl‐β‐d‐galactopyranoside (X‐gal). Plates with staining solution were kept overnight at 37 °C. Stained cells were observed under a Zeiss Axioplan 2 microscope, and the images were taken using a Zeiss AxioCam HRc camera.
2.12. Immunohistochemical analysis
Slides containing tumor tissues and their matched controls were procured from BioChain Institute Inc. (San Leandro, CA). Tissue microarray slides containing a variety of normal and clinical tumors (of different grades, origin, histology and differentiation stages) were procured from SuperBioChips Laboratories (Seoul, South Korea). Immunohistochemical (IHC) staining for CARF was performed using Dako EnVision system (Glostrup, Denmark), following the manufacturer's guidelines. Endogenous peroxidase activity was inhibited with 3% H2O2 followed by incubation with 10% BSA to block the non‐specific target binding. Tissue specimens were incubated overnight at 4 °C with anti‐CARF antibody followed by HRP‐conjugated secondary anti‐rabbit antibody. The antigen–antibody immunoreaction was visualized by incubation with DAB (3,3′‐diaminobenzidine) for 8 min at room temperature. These sections were counterstained with hematoxylin and mounted. In parallel, the sections incubated without the anti‐CARF antibody were used as negative control.
2.13. Wound healing assay
Cells grown in monolayer were scratched straight through the cell layer using a 200 μl pipette tip followed by washing with PBS to remove cell debris and then fed with fresh medium. The time of wound creation was designated as 0 h. Cells were allowed to proliferate and migrate into the wound for at least 36 h, the process of which was recorded under a phase contrast microscope with a 10× phase objective lens.
2.14. Cell invasion assay
Matrigel in vitro invasion assay was performed by seeding 5 × 10⁴ cells into the upper chamber (specially designed 16‐well CIM plates with 8 μm pores), which was coated on the surface with 1/10 dilution of Matrigel (BD BioSciences, Franklin Lakes, NJ), and allowed to migrate to the lower chamber. Migrated cells were fixed, stained with crystal violet and counted under phase contrast microscopy.
2.15. Multiplex immunoassay
Multiplex immunoassay profiling was performed with the BioPlex array system (Bio‐Rad, Hercules, CA). Conditioned medium was collected from control, COE alone and COE + p53V138‐transfected SKOV‐3 cells grown at 32 °C. Concentrations of the growth factors and cytokines in the medium were measured with respect to the standards prepared for each of the factors. Data analysis was performed with the Bio‐Plex Manager software (Bio‐Rad), normalized to the control SKOV‐3 cells and represented as a fold change over control and denoted as 1.
2.16. In vivo xenograft study
Nude mice (5–6 weeks of age) were obtained from Charles River Laboratories (Wilmington, MA), and Saos‐2 (1 × 10⁶) cells were injected subcutaneously into the abdomen. The mice were monitored for the presence or absence of tumors until 20 days post‐infection, and tumor size was measured every day.
2.17. TCGA and HPA analysis
Relevance of CARF (CDKN2AIP) expression and genetic alterations with tumor progression was examined through the Human Protein Atlas (HPA) and The Cancer Genome Atlas (TCGA) public databases, respectively.
2.18. Statistical analysis
All the experiments were carried out in triplicate. Data are expressed as mean ± SEM of three individual experiments. Two‐tailed Student's t‐test or nonparametric Mann–Whitney U‐test, whichever was applicable, was used to determine the degree of significance between the control and experimental sample. Statistical significance was defined as p‐value ≤0.05. The p‐values are represented by *<0.05, **<0.01, ***<0.001, while NS denotes insignificant correlation.
3. Results
3.1. CARF over‐expression is pro‐proliferative in p53‐deficient cells
GFP‐tagged CARF was overexpressed in three cell lines (Saos‐2, SKOV‐3 and MCF7) that were either deficient or compromised in wild type p53 function. The level of exogenously expressed CARF was verified by immunoblotting with anti‐GFP antibody (Figure 1A). Morphological observations of control and CARF‐overexpressing (COE) cells showed distinct phenotype. COE cells had more extensions and less inter‐cellular/substratum contact in comparison to flat control cells with adherent phenotype (Figure 1B). We performed quantitative proliferation and colony formation assays to investigate the effect of CARF overexpression on growth of these cells (Figure 1C and D). COE cells demonstrated higher growth rate compared to control in all the three cell lines examined; Saos‐2 (p53−/− and pRb−/−) cells showed highest increase in proliferation (Figure 1C). Clonogenicity assay demonstrated higher colony forming efficiency (larger size and number of colonies at 12 days) in CARF‐overexpressing (COE) derivatives of all the three cell lines (Figure 1D). Furthermore, we found that the overexpression of CARF in p53−/− cells did not result in formation of HP1γ heterochromatin foci, a senescence marker as reported earlier for p53‐active cells (Cheung et al., 2014). Induction of senescence by adriamycin (0.02 μM) was used as a positive control, and HP1γ foci were observed in treated SKOV‐3 as well as Saos‐2 cells (Figure 1E and data not shown). These data revealed that COE/p53‐deficient cells were highly proliferative. Of note, the cell lines compromised for wild type p53 functions due to either genomic deletion (SKOV3 and Saos‐2) or its inactivation either by mutations (C33A) or by cytoplasmic factors (MCF7) showed similar results. On the other hand, pRb was variable in three cell lines; SKOV3 and MCF7 harbored low level of pRB expression, Saos‐2 was pRb null. These data suggested that the overexpression of CARF in p53‐null cells promotes their proliferation. We further examined whether COE derivatives of p53‐deficient cancer cells that with substantial growth and clonogenic capabilities could promote tumorigenesis in vivo, using a subcutaneous xenograft model in nude mice. COE derivatives of Saos‐2 (p53−/−) cells formed large subcutaneous tumors within 20 days, while control cells failed to produce any lesions (Figure 1F). These data demonstrated that the overexpression of CARF in p53−/− cells failed to induce growth arrest, instead led to higher proliferation in both in vitro and in vivo models.
Figure 1.
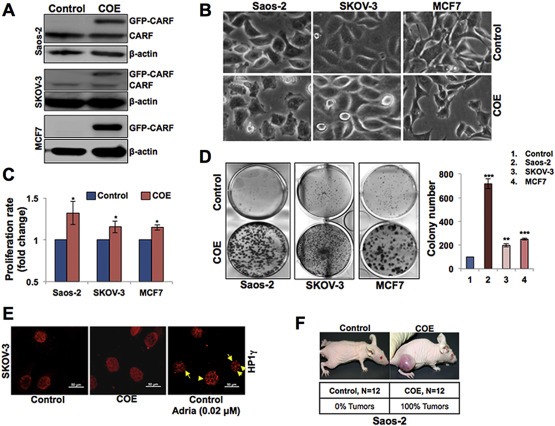
CARF overexpression promotes proliferation in p53‐compromised cancer cells. A, Immunoblotting with anti‐GFP antibody for GFP‐CARF (110‐kDa) in Saos‐2, SKOV‐3 and MCF7 cells. β‐actin was used as a loading control. B, Bright field phase contrast images showing morphology of control (pCX4neo vector) and CARF‐transfected Saos‐2, SKOV‐3 and MCF7 cells. C, Quantitation of cell proliferation of control and COE Saos‐2, SKOV‐3 and MCF7 cells. D, Images of crystal violet‐stained colonies of control and CARF‐transfected Saos‐2, SKOV‐3 and MCF7 cells on 12 day. Quantitation of colony number from three independent experiments is shown on the right. E, Immunostaining for HP1γ (red) in control, COE and adriamycin‐treated (0.025 μM) COE cells, yellow arrows indicate nuclear HP1γ foci. F, Nude mice showing tumor formation following injection of COE Saos‐2 cells. Control cells did not form tumors in any of the 12 mice in three independent experiments. Injection of COE Saos‐2 cells showed large tumors in all the mice.
3.2. CARF overexpression initiated DDR in p53‐deficient cells
We had earlier shown that whereas a moderate level of CARF overexpression induces senescence, its very high level resulted in an increased cell proliferation in wild type p53‐harboring cancer cells (Cheung et al., 2014). Such contrasting proliferative outcomes were demonstrated to be mediated by the effects of CARF over‐ and super‐expression on DNA damage regulators; ATM, CHK1 and CHK2. For elucidation, we first determined the effect of CARF on these proteins in p53‐deficient cells. As shown in Figure 2A and B, SKOV‐3 COE cells exhibited increase in phosphorylated H2AX (H2AXγ), ATM (pATM) and pCHK2 demonstrating that CARF overexpression initiated DNA damage signaling. However, phosphorylated ERK1 (pERK1) and ERK2 (pERK2) did not show any change (Figure 2C). We had previously reported that the CARF‐superexpressing (CSE) cells that were more proliferative and aggressive showed activation of ERK signaling (Cheung et al., 2014). These data confirmed the initiation of DNA damage signaling, characteristic of CARF overexpression. However, it failed to cause growth arrest and instead resulted in enhanced proliferation (Figure 1).
Figure 2.
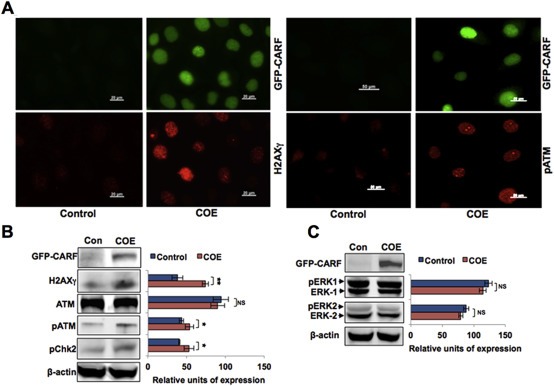
DNA‐damage response is activated in p53‐compromised COE cells. A, Immunostaining of control (pCX4neo vector) and GFP‐CARF‐transfected SKOV‐3 cells for H2AXγ and pATM (both red) show nuclear foci in the latter. B, Immunoblotting for GFP, H2AXγ, ATM, pATM, pChk2 and β‐actin in control and COE cells. Quantitation, after normalization with β‐actin, is shown in the right C, Immunoblotting for GFP, ERK‐1, ERK‐2, pERK1 and pERK2 levels. β‐actin was used as a loading control. Quantitation after normalization with β‐actin is shown on the right.
3.3. CARF overexpression induced proliferation in p53−/− cells through transcriptional repression of p21WAF1
p21WAF1 is an inhibitor of cyclin and CDK activities, a key effector protein of p53, and has been shown to mediate CARF‐induced growth arrest in p53‐active cells (Hasan et al., 2014, 2004, 2009). It was shown to be involved in growth suppression activities in SKOV‐3 cells (Li et al., 2004). In the present study, we examined the level of p21WAF1 in SKOV‐3 COE cells and found its decrease at both protein and transcript levels (Figure 3A and B). As expected from our earlier reports (Hasan et al., 2004, 2008), the level of HDM2 (both at the protein and transcript levels) decreased in COE cells. CARF‐compromised cells were earlier shown to undergo mitotic catastrophe and apoptosis that involved downregulation of p21WAF1 and upregulation of apoptotic proteins (Cheung et al., 2014; Hasan et al., 2009). We examined similar axis in p53‐deficient COE cells and failed to see any change in BAX and PARP with respect to the control cells (Figure 3C). In contrast, we detected increased levels of p21WAF1‐inhibited proteins, Cyclin D1, CDK4 and CDK6 that are associated with increased cell cycle progression (Figure 3D). Furthermore, higher levels of phospho‐Rb (pRb) and E2F1 in COE cells signified cell cycle progression and proliferation, in line with reports stating that increased pRb is associated with tumor progression in several malignancies (Sherr, 1996; Cote et al., 1998; Plath et al., 2002). On the other hand, hypo‐phosphorylation of Rb and its complex with E2F1 is associated with growth arrest and senescence (Ezhevsky et al., 1997; Krtolica et al., 1998). Our above data suggested that the increased proliferation in p53‐compromised COE cells was mediated by abrogation of p21WAF1‐mediated inhibition of Cyclin/CDK activity, resulting in an increase in pRb and activation of E2F1, required for cell cycle progression. However, CARF‐overexpressing pRb−/− (Saos‐2 and C33A) cells also showed increase in proliferation (Figure 1D and data not shown) implying that this pathway, although involved, was not essential for pro‐proliferative activity of COE. In order to investigate it further, we overexpressed Rb in SKOV‐3 COE cells. Exogenous Rb expression was validated by immunoblotting (Figure 3E). Cell growth and proliferation assays (Figure 3F and data not shown) revealed no significant difference in the vector and Rb‐transfected COE cells. Taken together, these data demonstrated that the overexpression of CARF, in the absence of p53, induced a pro‐proliferation effect, mediated by transcriptional repression of p21WAF1 and was associated with increased phosphorylation of Rb, although the latter was not essential for the observed phenotypes. Since the total Rb remained unchanged in both control and COE cells, the effect may have been driven by activation of cyclin‐CDK mediated phosphorylation signaling that in turn was regulated by COE‐induced p21WAF1 repression. Similarly, exogenous expression of Rb in COE cells did not cause further increase in proliferation, as it was limited for phosphorylation under the constant level of expression of CARF. In order to get direct proof to the transcriptional repression of p21WAF1 by CARF, we used quantitative reporter assays using p21WAF1 promoter‐luciferase reporter system. As shown in Figure 3G, CARF overexpression in p53 deficient cells caused downregulation of p21WAF1 promoter driven luciferase reporter (∼2 fold in SKOV‐3 and ∼4 fold in Saos‐2). Furthermore, the downregulation of p21WAF1 promoter‐luciferase reporter was endorsed by live cell assay in both the cell lines (Figure 3G). These data demonstrated that CARF caused transcriptional repression of p21WAF1 in p53‐deficient cells.
Figure 3.
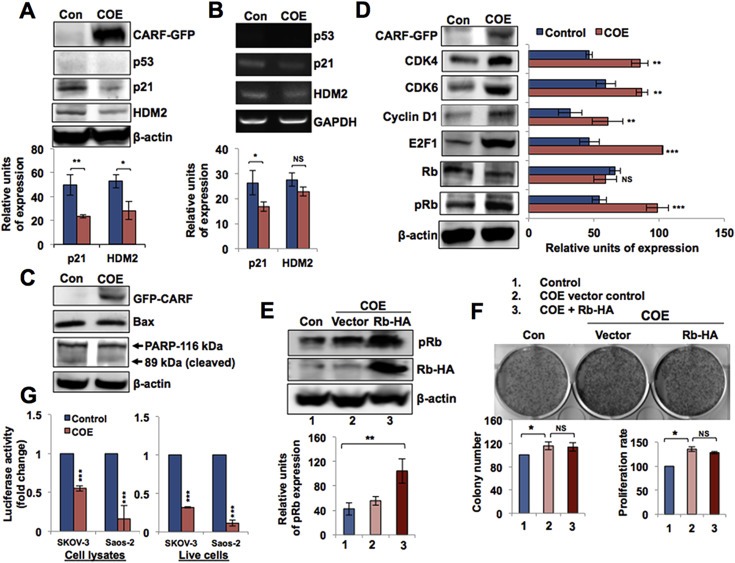
Transcriptional repression of p21WAF1 and activation of the pRb/E2F1 proliferative pathway in p53‐compromised COE cells. A, Immunoblotting with anti‐GFP, ‐p53, ‐p21, ‐HDM2 and ‐β‐actin antibodies in control (pCX4neo‐transfected) and COE cells. Quantitation (below) after normalization with β‐actin from three independent experiments shows reduced p21 and HDM2 protein levels. B, RT‐PCR analysis of p53, p21, HDM2 and GAPDH mRNA levels in control and COE cells. Quantitation (below) after normalization with GAPDH shows decrease in p21 and HDM2 transcripts. C, Immunoblotting for GFP‐CARF, Bax, PARP1 and β‐actin. D, Immunoblotting for GFP, CDK4, CDK6, Cyclin D1, E2F1, Rb, pRb and β‐actin in control and COE cells. Quantitation on the right shows their relative level of expression after normalization with β‐actin. E, Immunoblotting with anti‐pRb, ‐HA tag, and ‐β‐actin antibodies in pCX4neo (Con), COE + pSGL5 control (vector), and COE + pRb cells. Quantitation of pRb expression level is shown below after normalization with β‐actin. F, Images showing crystal violet‐stained colonies of SKOV‐3 cells transfected with pCX4neo control, COE + pSGL5 control (vector) and COE + pRb. Quantitation of number of colonies and results of the MTT proliferation assay in these cells are shown below. G, p21WAF‐1 promoter driven reporter assay in p53‐deficient control and COE cells showing its repression in the latter.
3.4. Restoration of p53 reverted from pro‐proliferation to senescence in COE p53‐deficient cells
In order to address whether p53 was the critical factor in CARF‐induced proliferation and that its absence was sufficient to revert the phenotype, we reconstituted p53 in SKOV‐3 cells by transfecting an expression plasmid encoding GFP‐p53. Transfection was detected by fluorescence signal of GFP protein and immunostaining for p53 (Figure 4A). In spite of the low transfection efficacy of GFP‐p53 plasmid in SKOV‐3 cells, as observed by GFP fluorescence and Western blotting (Figure 4A and data not shown), proliferation and clonogenicity assays exhibited p53‐induced growth arrest in these cells (Figure 4B–D). Furthermore, whereas SKOV‐3/COE cells showed higher growth rate as compared to the control, reconstitution of p53 caused a strong growth arrest (Figure 4B–D). The data suggested that the restoration of p53 reverts the pro‐proliferative effect of CARF overexpression to growth arrest. Furthermore, senescence associated β‐galactosidase staining showed induction of senescence in p53‐transfected control (pCX4neo) and COE cells wherein the effect was much stronger in the latter (Figure 4E and F). Cell cycle profiling in p53‐restored cells showed increase in number of cells in G0/G1 and decreased population in G2/M phase as compared to their controls (GFP and COE), respectively (Figure 4G). In COE cells, p53‐restoration caused significant G0/G1 enrichment and reduction in cell numbers in G2/M and S phases (Figure 4G) suggesting that p53‐reconstitution caused growth arrest in G0/G1 phases in control (pCX4neo) as well as COE cells; the latter was much stronger. Consistent with these findings, nuclear Ki‐67 (proliferation marker) decreased in p53‐transfected control (pCX4neo) cells; p53‐restored COE cells showed stronger decrease (Figure 4H).
Figure 4.
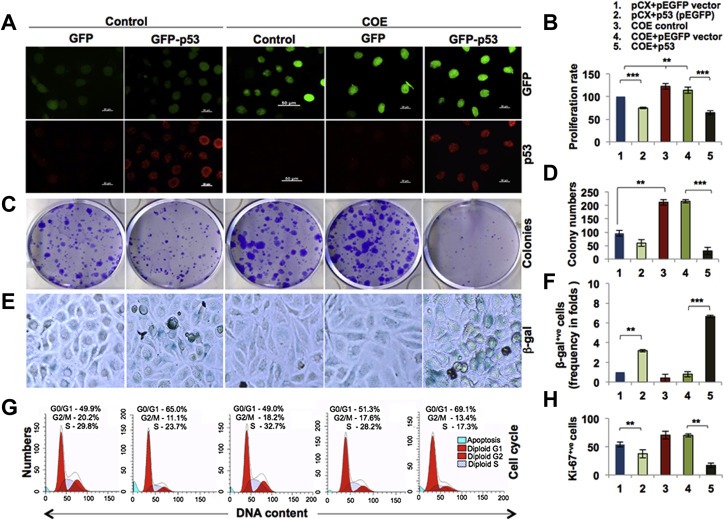
Restoration of p53 caused growth arrest and led to senescence in COE cells. A, GFP fluorescence and p53 staining (red) is shown in control (GFP), GFP‐p53, and COE (GFP‐tagged CARF overexpressing)‐with and without GFP‐p53 SKOV‐3 cells. B, Quantitation of cell proliferation by MTT assay in control and COE cells with/without GFP‐p53 at 48 h post‐transfections. C, Images showing crystal violet‐stained colonies of control and COE cells with/without GFP‐p53 (12 days post‐transfection). D, Quantitation of colony number from three independent experiments. E, Senescence associated β‐galactosidase staining (blue) in control and COE cells with/without GFP‐p53 at 48 h post‐transfections. F, Quantitation of β‐galactosidase staining from three independent experiments in the respective cells. G, Mod‐Fit based analysis of cell cycle profiles of control and COE cells with/without GFP‐p53. H, Quantitation of Ki‐67 positive cells as assessed by immunostaining in pCX4neo (control) and COE cells with/without GFP‐p53.
In order to rule out the effect of GFP and to substantiate the above experiments, we next used a temperature‐sensitive point mutant of p53 (Ala 138 Val; Ala > Val at the 138 amino acid residue of p53) that exhibits wild type phenotype at 32 °C but remains inactivate at 37 °C. Bright‐field microscopic images of COE alone, COE + vector and COE + p53 (V138) SKOV‐3 cells at 32 °C and 37 °C showed growth arrest in COE + p53 (V138) at 32 °C only (Figure 5A). MTT‐based analysis of cell growth at 48 h time point revealed lower proliferation in COE + p53 (V138) cells at 32 °C compared to the COE control, while it remained unchanged in untransfected and transfected COE cells at 37 °C (Figure 5B). Analysis of clonogenic capacity demonstrated that the transfection of p53 (V138) to SKOV‐3 COE cells resulted in smaller and fewer number of colonies (Figure 5C and D). Quantitative analysis revealed significantly reduced colony number in p53 (V138)‐transfected SKOV‐3 COE cells at 32 °C only. Induction of growth arrest by p53 restoration could lead to senescence in these cells. To verify further, we examined HP1γ nuclear heterochromatin foci in p53 (V138)‐transfected COE Saos‐2 (Figure 5E) and SKOV‐3 cells (data not shown) at 32 °C and 37 °C. HP1γ foci were observed only at 32 °C in both the cell lines. Concordantly, we observed β‐galactosidase positive senescence in p53 (V138)‐transfected COE cells at 32 °C (Figure 5E, lower images). Whereas a significant increase in β‐galactosidase positive cells (Figure 5F) was seen in p53 (V138)‐transfected cells cultured at 32 °C, the number of Ki‐67 positive cells was low (Figure 5G). The above data revealed that the restoration of p53 in COE cells reverted their pro‐proliferation phenotype, implying that p53 deficiency is essential for CARF overexpression‐induced increase in proliferation.
Figure 5.
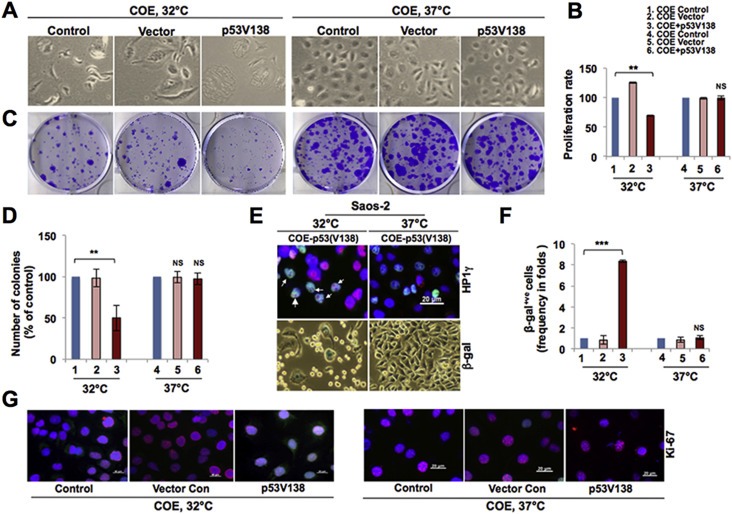
Restoration with temperature‐dependent variant of p53 affirmed its essential regulation of cell growth and proliferation. A, Bright field phase contrast images showing morphology of untransfected SKOV‐3 COE cells (control) and transfected with control vector or p53V138 at 32 °C or 37 °C. B, Quantitation of cell proliferation by MTT assay of SKOV‐3 COE cells transfected with the temperature‐dependent p53 variant cultured at 32 °C or 37 °C. C, Images showing crystal violet‐stained colonies of the transfected cells grown at 32 °C or 37 °C. D, Quantitation of the colony number from three independent experiments of the transfected cells grown at 32 °C and 37 °C. E, Immunostaining showing HP1γ nuclear foci (top panels; merged images, purple, indicated by arrows) and senescence associated β‐galactosidase staining (lower panels; blue) in Saos‐2 COE cells transfected with p53V138 grown at 32 °C or 37 °C. F, Quantitation of β‐galactosidase staining in cells cultured at 32 °C or 37 °C. G, Ki‐67 immunostaining in untransfected Saos‐2 COE cells (control) or those transfected with control vector or p53V138, grown at 32 °C and 37 °C.
3.5. CARF is enriched in human epithelial and glial tumors
High prevalence of p53 mutations in epithelial carcinomas has been broadly reported (Hollstein et al., 1991). Frequency of p53‐mutation in these cells varies from 46 to 80% at precursor stage (Hollstein et al., 1991), while high‐grade epithelial carcinomas were characterized by having inactivation of p53 function in almost 96% tumors (Ahmed et al., 2010; Bell et al., 2011). Based on our above data that the overexpression of CARF induces increase in proliferation in p53‐deficient cells, we hypothesized that it may contribute to tumor progression in human epithelial tissues. Thus, we examined the expression of CARF in matched normal and tumor kidney, lung and liver clinical samples by immunohistochemistry. As shown in Figure 6A, low levels of CARF expression were observed in all the normal tissues while abundant expression was found in their respective tumor tissues. Quantitation of CARF in normal and tumor tissues revealed its significant enrichment in the latter (Figure 6B). Increase in the level of CARF expression was based on aggressiveness of the cancer as seen from Grade I to III, whereas normal brain sections had basal level (Figure 6C). In order to strengthen our observations, we examined CARF expression in commercially available tissue microarrays containing a variety of normal and clinical tumors (different grades, origin, differentiation state and types) (Figure 6D and E; Supplementary Figure 1). Expression levels of CARF were consistently higher in a variety of tumor tissues compared to their normal controls (Supplementary Figure 1). Furthermore, among the tumors, more expression was noticed in higher grade than in low grade ones (Figure 6E; Supplementary Figure 1). Public Human Protein Atlas (HPA) database also revealed significant enrichment of CARF in tumors as compared to normal tissue controls (data not shown). Furthermore, The Cancer Genome Atlas (TCGA) database, revealed occurrence of CARF amplification in metastatic human tumors that harbored mutations in p53 (Supplementary Table 4).
Figure 6.
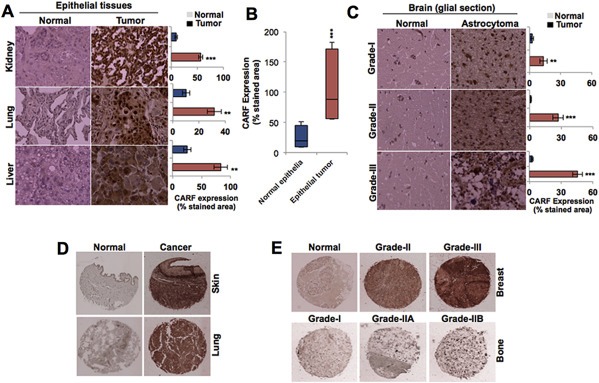
CARF level is enriched in human epithelial and glial tumors. A, Immunohistochemical staining showing the expression of CARF in normal and tumor sections of kidney, lung and liver tissues. On the right is ImageJ‐based quantitation of the percentage of CARF‐stained area in the respective tissues, derived from three independent sets. B, Box plot representing cumulative expression of CARF as assessed by immunohistochemical staining in all the three sets. C, Immunohistochemical staining showing expression of CARF in normal and grade‐I, ‐II, and ‐III astrocytoma sections. On the right side is ImageJ‐based quantitation of the percentage of stained area as determined in three independent sets. D, Immunohistochemical staining showing expression of CARF in tissue microarray sections of skin and lung tumors in comparison to the matched normal tissues. E, Immunohistochemical staining of tissue microarray sections showing a gradual increase in the expression of CARF in successive grades in comparison to their normal or early grade tumors in breast and bone cancer samples.
3.6. CARF overexpression in p53‐compromised cells promoted metastasis
We next investigated whether the overexpression of CARF plays an additional role in tumor characteristics such as invasion and metastasis. We performed cell scratch (Figure 7A) and Matrigel invasion (Figure 7B) assays. CARF overexpression in all the three p53‐deficient cell lines indeed induced higher mobility and invasion as compared to their respective controls suggesting its involvement in promotion of cancer cell migration, invasion and metastasis. Consistent with the higher metastasis capacity of COE cells, there was an upregulation of matrix metalloproteinases (MMPs; MMP2, MMP3 and MMP9) and urokinase‐type plasminogen activator (uPA) (Figure 7C). Furthermore, examination of conditional medium from control, COE and COE + wild type p53 (Val138)‐reconstituted cells revealed upregulation of secreted cytokines and growth factors in only COE cells, suggesting their contribution in increased growth and malignant characteristics. Multiplex immunoassay (Waterboer et al., 2005) (as shown in Figure 7D) revealed upregulation (∼1.4 to 3.5 fold) in 22 of the 28 analyzed cytokines and growth factors in COE cells as compared to the control SKOV‐3 cells. Of note, the anti‐proliferative cytokine and interleukin‐6 (IL‐6) decreased in COE cells as compared to the control. In addition, restoration of wild type p53 in COE cells was marked by downregulation of cytokines and growth factors to levels similar to, or even lower than, the basal level in control cells. These data signified that CARF overexpression induced pro‐proliferation and metastatic signaling in p53‐deficient cells, and also involved cell surface and secreted factors.
Figure 7.
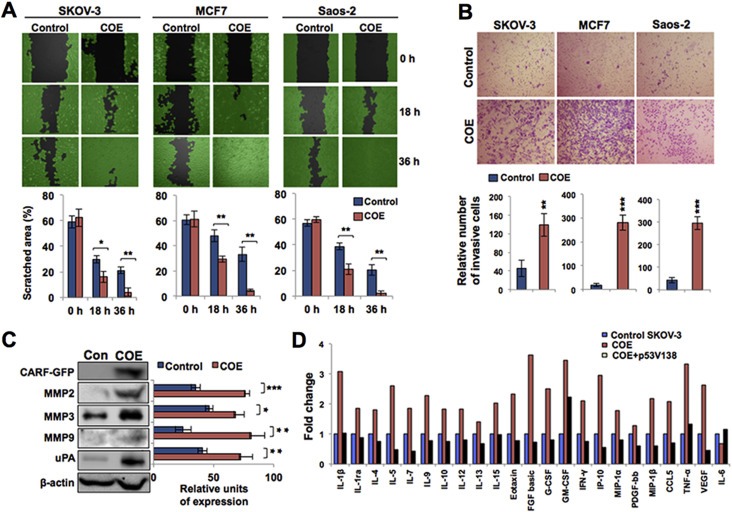
CARF overexpression promoted cell migration and invasive characteristics in p53‐compromised cancer cells. A, Scratch assay showing wound healing at 0 h, 18 h and 36 h time points in control and COE derivatives of SKOV‐3, MCF7 and Saos‐2 cells. Quantitation of percent filled scratch area from three independent experiments is shown below. B, Images of Matrigel invasion assay showing number of invasive cells in control and CARF‐transfected Saos‐2, SKOV‐3 and MCF7 cells. Quantitation of the number of invaded cells is shown below. C, Immunoblotting for GFP, MMP2, MMP3, MMP9 and uPA. β‐actin was used as a loading control. Quantitation of their expression levels in control and COE SKOV‐3 cells after normalization to β‐actin is shower on the right. D, Bar diagram showing secreted levels of cytokines and growth factors in SKOV‐3 control, COE, and COE reconstituted with wild type p53 (p53V138), normalized with SKOV‐3 cells. The data are shown as fold change over control, denoted as 1.
4. Discussion
Tumor suppression pathways are enormously important in order to understand the malignant progression, but the regulatory mechanisms that govern them are not straightforward, and may depend on the cell type and background. We had previously discovered that CARF is a positive regulator of the p53 pathway (Hasan et al., 2004). Its overexpression activated wild type p53 and induced senescence in a p53‐dependent manner (Singh et al., 2014). In the present study, we delved further into the role of CARF in cell growth and proliferation in p53‐deficient cells and found that the overexpression of CARF led to an increase in proliferation as well as invasive properties. These cells showed decreased p21WAF1 and activated pRb/E2F1 signaling, leading to increased cell cycle progression (Figure 2). Ectopic expression of E2F1 has been shown to promote DNA synthesis (Johnson et al., 1993) and neoplastic transformation when p53 is non‐functional (Dimri et al., 2000). Its knockdown causes senescence in pRb‐ and p53‐independent manner (Maehara et al., 2005), and its upregulation is correlated with aggressive metastatic tumors and therapeutic failure (Putzer and Engelmann, 2013). Inhibition of E2F1 was shown to abrogate tumor invasion and metastasis via a p73‐dependent pathway (Alla et al., 2010). As shown in Figures 1D, 3E and 3F, CARF overexpression was pro‐proliferative in p53−/− and pRb−/− cells. However, ectopic Rb expression in COE cells induced no further growth effect suggesting that pRb was dispensable for the observed phenotypes. Of note, the total amount of Rb did not change in control and COE cells, suggesting that the effect was driven by activation of cyclin‐CDK mediated phosphorylation signaling, in turn regulated by COE‐induced p21WAF1 repression. Similarly, exogenous Rb expression in COE cells did not cause further increase in proliferation, as it was limited for phosphorylation under the constant level of CARF expression (Figure 2). On the other hand, an activation of ERK/MAPK signaling pathway, a characteristic of CARF superexpression that led to enhanced cell proliferation in p53 positive cells, as reported earlier (Cheung et al., 2014) was not observed (Figure 2), suggesting a distinctive proliferative signaling in functional p53 and p53‐deficient cells. Noticeably, when p53 was restored in COE cells, the proliferative phenotype was abolished. p53 restoration caused growth arrest in COE cells and led to senescence as characterized by increased senescence‐associated β‐gal staining (Figure 4E and F) and G0/G1 arrest (Figure 4G and H). We have earlier demonstrated that CARF is upregulated during replicative and DNA damage stresses (Cheung et al., 2014; Singh et al., 2014). These may account for its upregulation in cancer cells that represent a physiologically a highly stressed condition.
We have demonstrated that p53‐compromised cells with CARF overexpression possess activated DNA damage response (DDR), but downstream effectors could not be activated due to the lack of p53, and instead of cell growth arrest/senescence, this resulted in an increase in proliferation. A higher expression level of CARF in human epithelial and glial tumors (show a high prevalence of p53‐inactivation) provided physiological evidence for our findings that the overexpression of CARF induces increased cell proliferation. We also showed here a relationship of CARF with tumor aggressiveness such as metastasis; CARF overexpression led to increased migration and invasion capacity of cancer cells (Figure 7C).
Furthermore, COE cells showed upregulation of several cell surface and secreted molecules, including MMPs, growth factors and cytokines, involved in invasion and metastasis (Grivennikov et al., 2010). Consistent with the increased proliferation, migration and invasion characteristics of COE cells, they possessed elevated expression of VEGF, basic FGF and CCL5, and were supported by other studies (Sauter et al., 1999; Kamura et al., 2010; Long et al., 2012). Concordantly, levels of several secreted interleukins and growth factors were found enriched in COE cells (Figure 7D). These markers have been shown to be involved in pro‐proliferative signaling in carcinogenesis (Grivennikov et al., 2010), and underlined the role of CARF in the process; the molecular insights into these remain to be clarified in further studies. Of note, in wild type p53‐reconstituted cells, levels of these markers reverted to basal level, found in control cells. Consistent with anti‐proliferative and anti‐metastasis functions of IL‐6 (Okugawa et al., 2010), its level was found to be decreased in COE cells and reverted in wild type p53‐restored cells.
The function of CARF in cancer cells has earlier been demonstrated to be pertinent to cell fate decision (Cheung et al., 2014) and is, as shown in the present study, further regulated by the status of p53. In a non‐functional p53 background, cell proliferation is augmented that in turn may lead to increased genomic instability, malignant characteristics and aggressiveness of cancer cells. Altogether, our findings suggested that the functional p53 is essential for CARF‐induced growth arrest in cancer cells. In tumors, with non‐functional p53, CARF overexpression promotes tumorigenesis and malignant transformation through transcriptional repression of p21WAF1 resulting in phosphorylation of pRb and activation of E2F1. We had previously shown that the depletion of CARF results in mitotic catastrophe and apoptotic death of cancer cells (Cheung et al., 2011), suggesting its therapeutic value, and along with our new findings, clinical studies are clearly warranted to validate its effects in p53‐compromised tumors. Therefore, CARF may serve as a diagnostic biomarker and therapeutic target for developing and implementing new chemotherapeutic regimes for tumors that lack wild type p53 function.
Conflicts of interest
The authors have no conflicts of interest to declare.
Supporting information
The following is the Supplementary material related to this article:
Supplementary data
Acknowledgments
RSK and CTC were supported by post‐doctoral fellowships from the Japan Society for the Promotion of Science.
Supplementary material 1.
Supplementary material related to this article can be found online at http://dx.doi.org/10.1016/j.molonc.2015.07.003.
Kalra Rajkumar S., Cheung Caroline T., Chaudhary Anupama, Prakash Jay, Kaul Sunil C., Wadhwa Renu, (2015), CARF (Collaborator of ARF) overexpression in p53‐deficient cells promotes carcinogenesis, Molecular Oncology, 9, doi: 10.1016/j.molonc.2015.07.003.
Contributor Information
Sunil C. Kaul, Email: s-kaul@aist.go.jp
Renu Wadhwa, Email: renu-wadhwa@aist.go.jp.
References
- Ahmed, A.A. , Etemadmoghadam, D. , Temple, J. , Lynch, A.G. , Riad, M. , Sharma, R. , Stewart, C. , Fereday, S. , Caldas, C. , Defazio, A. , Bowtell, D. , Brenton, J.D. , 2010. Driver mutations in TP53 are ubiquitous in high grade serous carcinoma of the ovary. J. Pathol. 221, 49–56. [DOI] [PMC free article] [PubMed] [Google Scholar]
- Alla, V. , Engelmann, D. , Niemetz, A. , Pahnke, J. , Schmidt, A. , Kunz, M. , Emmrich, S. , Steder, M. , Koczan, D. , Putzer, B.M. , 2010. E2F1 in melanoma progression and metastasis. J. Natl. Cancer Inst. 102, 127–133. [DOI] [PubMed] [Google Scholar]
- Bartek, J. , Bartkova, J. , Lukas, J. , 2007. DNA damage signalling guards against activated oncogenes and tumour progression. Oncogene. 26, 7773–7779. [DOI] [PubMed] [Google Scholar]
- Bell, D. , Berchuck, A. , Birrer, M. , Chien, J. , Cramer, D. , Dao, F. , Dhir, R. , 2011. Integrated genomic analyses of ovarian carcinoma. Nature. 474, 609–615. [DOI] [PMC free article] [PubMed] [Google Scholar]
- Bieging, K.T. , Mello, S.S. , Attardi, L.D. , 2014. Unravelling mechanisms of p53-mediated tumour suppression. Nat. Rev. Cancer. 14, 359–370. [DOI] [PMC free article] [PubMed] [Google Scholar]
- Burrell, R.A. , Swanton, C. , 2014. Tumour heterogeneity and the evolution of polyclonal drug resistance. Mol. Oncol. 8, 1095–1111. [DOI] [PMC free article] [PubMed] [Google Scholar]
- Campisi, J. , 2005. Senescent cells, tumor suppression, and organismal aging: good citizens, bad neighbors. Cell. 120, 513–522. [DOI] [PubMed] [Google Scholar]
- Cheung, C.T. , Singh, R. , Yoon, A.R. , Hasan, M.K. , Yaguchi, T. , Kaul, S.C. , Yun, C.O. , Wadhwa, R. , 2011. Molecular characterization of apoptosis induced by CARF silencing in human cancer cells. Cell Death Differ. 18, 589–601. [DOI] [PMC free article] [PubMed] [Google Scholar]
- Cheung, C.T. , Singh, R. , Kalra, R.S. , Kaul, S.C. , Wadhwa, R. , 2014. Collaborator of ARF (CARF) regulates proliferative fate of human cells by dose-dependent regulation of DNA damage signaling. J. Biol. Chem. 289, 18258–18269. [DOI] [PMC free article] [PubMed] [Google Scholar]
- Cote, R.J. , Dunn, M.D. , Chatterjee, S.J. , Stein, J.P. , Shi, S.R. , Tran, Q.C. , Hu, S.X. , Xu, H.J. , Groshen, S. , Taylor, C.R. , Skinner, D.G. , Benedict, W.F. , 1998. Elevated and absent pRb expression is associated with bladder cancer progression and has cooperative effects with p53. Cancer Res. 58, 1090–1094. [PubMed] [Google Scholar]
- Dimri, G.P. , Itahana, K. , Acosta, M. , Campisi, J. , 2000. Regulation of a senescence checkpoint response by the E2F1 transcription factor and p14Arf tumor suppressor. Mol. Cell. Biol. 20, 273–285. [DOI] [PMC free article] [PubMed] [Google Scholar]
- Erol, A. , 2011. Deciphering the intricate regulatory mechanisms for the cellular choice between cell repair, apoptosis or senescence in response to damaging signals. Cell. Signal. 23, 1076–1081. [DOI] [PubMed] [Google Scholar]
- Ezhevsky, S.A. , Nagahara, H. , Vocero-Akbani, A.M. , Gius, D.R. , Wei, M.C. , Dowdy, S.F. , 1997. Hypo-phosphorylation of the retinoblastoma protein (pRb) by cyclin D: Cdk4/6 complexes results in active pRb. Proc. Natl. Acad. Sci. U. S. A. 94, 10699–10704. [DOI] [PMC free article] [PubMed] [Google Scholar]
- Grivennikov, S.I. , Greten, F.R. , Karin, M. , 2010. Immunity, inflammation, and cancer. Cell. 140, 883–899. [DOI] [PMC free article] [PubMed] [Google Scholar]
- Hasan, M.K. , Yaguchi, T. , Minoda, Y. , Hirano, T. , Taira, K. , Wadhwa, R. , Kaul, S.C. , 2004. Alternative reading frame protein (ARF)-independent function of CARF (collaborator of ARF) involves its interactions with p53: evidence for a novel p53-activation pathway and its negative feedback control. Biochem. J. 380, 605–610. [DOI] [PMC free article] [PubMed] [Google Scholar]
- Hasan, M.K. , Yaguchi, T. , Harada, J.I. , Hirano, T. , Wadhwa, R. , Kaul, S.C. , 2008. CARF (collaborator of ARF) interacts with HDM2: evidence for a novel regulatory feedback regulation of CARF-p53-HDM2-p21WAF1 pathway. Int. J. Oncol. 32, 663–671. [PubMed] [Google Scholar]
- Hasan, K. , Cheung, C. , Kaul, Z. , Shah, N. , Sakaushi, S. , Sugimoto, K. , Oka, S. , Kaul, S.C. , Wadhwa, R. , 2009. CARF is a vital dual regulator of cellular senescence and apoptosis. J. Biol. Chem. 284, 1664–1672. [DOI] [PubMed] [Google Scholar]
- Hikisz, P. , Kilianska, Z.M. , 2012. PUMA, a critical mediator of cell death – one decade on from its discovery. Cell. Mol. Biol. Lett. 17, 646–669. [DOI] [PMC free article] [PubMed] [Google Scholar]
- Hollstein, M. , Sidransky, D. , Vogelstein, B. , Harris, C.C. , 1991. p53 mutations in human cancers. Science. 253, 49–53. [DOI] [PubMed] [Google Scholar]
- Johnson, D.G. , Schwarz, J.K. , Cress, W.D. , Nevins, J.R. , 1993. Expression of transcription factor E2F1 induces quiescent cells to enter S phase. Nature. 365, 349–352. [DOI] [PubMed] [Google Scholar]
- Kamura, S. , Matsumoto, Y. , Fukushi, J.I. , Fujiwara, T. , Iida, K. , Okada, Y. , Iwamoto, Y. , 2010. Basic fibroblast growth factor in the bone microenvironment enhances cell motility and invasion of Ewing's sarcoma family of tumours by activating the FGFR1-PI3K-Rac1 pathway. Br. J. Cancer. 103, 370–381. [DOI] [PMC free article] [PubMed] [Google Scholar]
- Kracikova, M. , Akiri, G. , George, A. , Sachidanandam, R. , Aaronson, S.A. , 2013. A threshold mechanism mediates p53 cell fate decision between growth arrest and apoptosis. Cell Death Differ. 20, 576–588. [DOI] [PMC free article] [PubMed] [Google Scholar]
- Krtolica, A. , Krucher, N.A. , Ludlow, J.W. , 1998. Hypoxia-induced pRB hypophosphorylation results from downregulation of CDK and upregulation of PP1 activities. Oncogene. 17, 2295–2304. [DOI] [PubMed] [Google Scholar]
- Li, D. , Tian, Y. , Ma, Y. , Benjamin, T. , 2004. p150 (Sal2) is a p53-independent regulator of p21(WAF1/CIP). Mol. Cell. Biol. 24, 3885–3893. [DOI] [PMC free article] [PubMed] [Google Scholar]
- Long, H. , Xie, R. , Xiang, T. , Zhao, Z. , Lin, S. , Liang, Z. , Chen, Z. , Zhu, B. , 2012. Autocrine CCL5 signaling promotes invasion and migration of CD133+ ovarian cancer stem-like cells via NF-κB-mediated MMP-9 upregulation. Stem Cells. 30, 2309–2319. [DOI] [PubMed] [Google Scholar]
- Maehara, K. , Yamakoshi, K. , Ohtani, N. , Kubo, Y. , Takahashi, A. , Arase, S. , Jones, S. , Hara, E. , 2005. Reduction of total E2F/DP activity induces senescence-like cell cycle arrest in cancer cells lacking functional pRB and p53. J. Cell Biol. 168, 553–560. [DOI] [PMC free article] [PubMed] [Google Scholar]
- Okugawa, Y. , Miki, C. , Toiyama, Y. , Yasuda, H. , Yokoe, T. , Saigusa, S. , Hiro, J. , Tanaka, K. , Inoue, Y. , Kusunoki, M. , 2010. Loss of tumoral expression of soluble IL-6 receptor is associated with disease progression in colorectal cancer. Br. J. Cancer. 103, 787–795. [DOI] [PMC free article] [PubMed] [Google Scholar]
- Plath, T. , Peters, M. , Detjen, K. , Welzel, M. , von Marschall, Z. , Radke, C. , Wiedenmann, B. , Rosewicz, S. , 2002. Overexpression of pRB in human pancreatic carcinoma cells: function in chemotherapy-induced apoptosis. J. Natl. Cancer Inst. 94, 129–142. [DOI] [PubMed] [Google Scholar]
- Putzer, B.M. , Engelmann, D. , 2013. E2f1 apoptosis counterattacked: evil strikes back. Trends Mol. Med. 19, 89–98. [DOI] [PubMed] [Google Scholar]
- Sauter, E.R. , Nesbit, M. , Watson, J.C. , Klein-Szanto, A. , Litwin, S. , Herlyn, M. , 1999. Vascular endothelial growth factor is a marker of tumor invasion and metastasis in squamous cell carcinomas of the head and neck. Clin. Cancer Res. 5, 775–782. [PubMed] [Google Scholar]
- Sherr, C.J. , 1996. Cancer cell cycles. Science. 274, 1672–1677. [DOI] [PubMed] [Google Scholar]
- Singh, R. , Kalra, R.S. , Hasan, K. , Kaul, Z. , Cheung, C.T. , Huschtscha, L. , Reddel, R.R. , Kaul, S.C. , Wadhwa, R. , 2014. Molecular characterization of collaborator of ARF (CARF) as a DNA damage response and cell cycle checkpoint regulatory protein. Exp. Cell Res. 322, 324–334. [DOI] [PubMed] [Google Scholar]
- Vernier, M. , Ferbeyre, G. , 2014. Complete senescence: RB and PML share the task. Cell Cycle. 13, 696 [DOI] [PMC free article] [PubMed] [Google Scholar]
- Waterboer, T. , Sehr, P. , Michael, K. , Franceschi, S. , 2005. Multiplex human papillomavirus serology based on in situ-purified glutathione s-transferase fusion proteins. Clin. Chem. 51, 1845–1853. [DOI] [PubMed] [Google Scholar]
Associated Data
This section collects any data citations, data availability statements, or supplementary materials included in this article.
Supplementary Materials
The following is the Supplementary material related to this article:
Supplementary data