

Abstract
The let‐7 microRNA (miRNA) family has been implicated in the regulation of diverse cellular processes and disease pathogenesis. In cancer, loss‐of‐function of let‐7 miRNAs has been linked to tumorigenesis via increased expression of target oncogenes. Excessive proliferation rate of tumor cells is often associated with deregulation of mitotic proteins. Here, we show that let‐7b contributes to the maintenance of genomic balance via targeting Aurora B kinase, a key regulator of the spindle assembly checkpoint (SAC). Our results indicate that let‐7b binds to Aurora B kinase 3′UTR reducing mRNA and protein expression of the kinase. In cells, excess let‐7b induced mitotic defects characteristic to Aurora B perturbation including increased rate of polyploidy and multipolarity, and premature SAC inactivation that leads to forced exit from chemically induced mitotic arrest. Moreover, the frequency of aneuploid HCT‐116 cells was significantly increased upon let‐7b overexpression compared to controls. Interestingly, together with a chemical Aurora B inhibitor, let‐7b had an additive effect on polyploidy induction in HeLa cells. In breast cancer patients, reduced let‐7b expression was found to be associated with increased Aurora B expression in grade 3 tumors. Furthermore, let‐7b was found downregulated in the most aggressive forms of breast cancer determined by clinicopathological parameters. Together, our findings suggest that let‐7b contributes to the fidelity of cell division via regulation of Aurora B. Moreover, the loss of let‐7b in aggressive tumors may drive tumorigenesis by up‐regulation of Aurora B and other targets of the miRNA, which further supports the role of let‐7b in tumor suppression.
Keywords: Let-7b, Mitosis, MicroRNA, Aurora B, Aneuploidy
Highlights
Let‐7b directly targets the Aurora B kinase 3′UTR.
Excess let‐7b suppresses the Aurora B mRNA and protein levels.
Overexpression of let‐7b induces mitotic anomalies in cells.
Excess let‐7b has an additive effect on polyploidy with an Aurora B inhibitor.
In patients, let‐7b expression inversely correlates with Aurora B expression.
Abbreviations
- CIN
chromosomal instability
- CPC
chromosomal passenger complex
- ER
estrogen receptor
- HER2
human epidermal growth factor receptor 2
- HTS
high-throughput screen
- miRNA
microRNA
- SAC
spindle assembly checkpoint
- TSB
target site blocker
- UTR
untranslated region
1. Introduction
MicroRNAs (miRNAs) are small 18–25 nucleotide‐long non‐coding RNA molecules that regulate a wide range of physiological and pathological processes (He and Hannon, 2004). A miRNA generally binds to the 3′UTR of the target messenger RNA (mRNA) and either represses its translation or directs the mRNA for degradation (He and Hannon, 2004). Some miRNAs have also been reported to bind the coding region or 5′UTR of the target mRNA (Forman et al., 2008; Lytle et al., 2007). In addition to regulation of animal development and tissue differentiation, several miRNAs are implicated in cell transforming processes that can contribute to cancer initiation, progression and metastasis (Farazi et al., 2011). MiRNAs that promote tumorigenesis are termed onco‐miRNAs whereas tumor suppressor miRNAs are associated with anti‐cancer pathways. Even though cancer is characterized by excessive rate of cell division very little is known about the miRNA‐mediated regulation of mitosis. However, recently a few miRNAs have been reported to influence cell division through the regulation of mitosis‐associated genes (Bhattacharjya et al., 2013; He et al., 2013) and many more miRNAs are anticipated to control mitosis.
In mitosis, faithful chromosome segregation is essential for the maintenance of genomic balance and normal growth. Therefore, mitosis is under the control of a signalling network termed the spindle assembly checkpoint (SAC) (Musacchio, 2011). In the presence of unstable kinetochore‐microtubule attachments or erroneous spindle structure, the SAC halts mitosis progression allowing more time for correction of mistakes that could lead to increased genomic instability. In case of severe mitotic defects, cells typically arrest to M phase for several hours before they either exit mitosis normally upon successful error correction, or alternatively die or slip out of mitosis with chromosomal errors. The cell fate depends on the balance between the SAC, cell cycle, and cell death signalling (Gascoigne and Taylor, 2008). Loss or gain of chromosomes, which is the cause of aneuploidy, and induction of polyploidy by cytokinesis failure are associated with numerical chromosomal instability (CIN), one of the hallmarks of cancer (Li et al., 2009; Musacchio, 2011). Earlier studies have shown that altered expression of certain mitotic proteins, for example Cenp‐E and Mad2, contributes to induction of aneuploidy (Sotillo et al., 2007; Weaver et al., 2007). Interestingly, aneuploidy has a dual role in tumorigenesis; tolerable low levels of aneuploidy can provide cancer cells with a growth advantage whereas high levels of aneuploidy usually induce cell death (Weaver et al., 2007).
Also, altered Aurora B expression and kinase activity can lead to perturbation of mitosis causing aneuploidy and polyploidy (Hauf et al., 2003; Ota et al., 2002; Terada et al., 1998). In vivo, Aurora B is often highly expressed in cancer, which is linked to poor patient prognosis (Carter et al., 2006). The kinase is an essential component of the SAC and the catalytic subunit of the chromosomal passenger complex (CPC) composed of three other main subunits, INCENP, Survivin and Borealin (Ditchfield et al., 2003; Gassmann et al., 2004; Hauf et al., 2003). At the centromeres, Aurora B destabilizes erroneous kinetochore‐microtubule attachments by phosphorylating outer kinetochore protein Hec1 that mediates the connections between microtubules and chromosomes (DeLuca et al., 2006, 2011). Besides the SAC signalling, Aurora B contributes to other mitotic events including chromatin organization and cytokinesis through its action on substrates such as centralspindlin (Guse et al., 2005), condensin I (Lipp et al., 2007) and histone H3 (Hirota et al., 2005).
The let‐7 miRNA family is widely studied for its regulatory effects on cell differentiation, proliferation, and developmental timing (Johnson et al., 2007; Roush and Slack, 2008). Altered expression of the family members can however lead to reprogramming of these normal processes and stimulate malignant cell proliferation and cancer metastasis (Johnson et al., 2007; Yu et al., 2007). In the majority of human cancers, let‐7 is considered to function as a tumor suppressor miRNA inhibiting cancer cell proliferation and tumor growth (He et al., 2010; Johnson et al., 2007; Yu et al., 2007). However, in certain cancers, like in certain lymphomas (Lawrie et al., 2009), let‐7 is linked to enhanced cancer progression. Here, we have investigated the impact of excess let‐7b on mitotic signalling and genomic stability. We report that let‐7b directly targets the mRNA of Aurora B kinase and consequently reduces Aurora B protein levels and kinase activity leading to chromosomal and spindle errors. In cells, excess let‐7b induced polyploidy, aneuploidy, and premature exit from mitosis, which are phenotypes previously associated with Aurora B loss‐of‐function (Hauf et al., 2003; Marxer et al., 2014). Furthermore, let‐7b overexpression had an additive effect on polyploidy induction together with chemical Aurora B inhibition in HeLa cells. In breast cancer patient samples, we found that let‐7b expression negatively correlates with tumor grade and Aurora B expression. Also, let‐7b expression was lower in estrogen receptor (ER) negative, human epidermal growth factor receptor 2 (HER2) positive and TP53 mutated cancers. Together, our results indicate that altered let‐7b expression can modulate Aurora B expression and thereby have an impact on mitotic fidelity and tumorigenesis.
2. Materials and methods
2.1. Cell culture
HeLa cells (ATCC CCL‐2, obtained in 2006) were cultured in Dulbecco's Modified Eagle's medium (DMEM) supplemented with 10% fetal bovine serum (Gibco, Life Technologies), l‐glutamine (2 mM), sodium pyruvate (1 mM), HEPES buffer (20 mM), non‐essential amino acids (0.1 mM), and penicillin‐streptomycin (0.1 mg/ml). Blasticidin (2 μg/ml) was added to the culture medium of HeLa H2B‐GFP cells, which were a kind gift from Geoffrey Wahl (Salk Institute for Biological Studies, La Jolla, USA), obtained in 2005. HCT‐116 cells were a kind gift from Lauri Aaltonen's laboratory (University of Helsinki, Helsinki, Finland), obtained in 2009, and were grown in McCoy's 5A medium supplemented with 10% fetal bovine serum, l‐glutamine (2 mM), and penicillin‐streptomycin (0.1 mg/ml). MDA‐MB‐231 (ATCC HTB‐26, obtained in 2004) and MDA‐MB‐231 SA (from Theresa A. Guise, University of Virginia, Charlottesville, USA, obtained in 2004) breast adenocarcinoma cells were grown in DMEM supplemented with 10% FBS, non‐essential amino acids (0.1 mM), and l‐glutamine (2 mM). All cell culture reagents were from Sigma–Aldrich if not stated otherwise. Cells were cultured at 37 °C with 5% CO2. All cell lines used in the study were negative for mycoplasma.
2.2. Chemicals
Nocodazole (M1404; Sigma–Aldrich, St. Louis, MO, USA) was used at 150 nM, taxol (Paclitaxel; T7191; Sigma–Aldrich) at 100 nM, ZM447439 (2458; Tocris Bioscience) at 20 μM, MG132 (C2211; Sigma–Aldrich) at 20 μM, barasertib (AZD1152‐HQPA; S1147; Selleckchem) at 3.125–50 nM, and thymidine (T9250; Sigma–Aldrich) at 2 mM concentration.
2.3. High‐throughput screen
20 nM Human Pre‐miR miRNA Precursor library v2 (Ambion; 319 molecules) or 20 nM miRIDIAN microRNA mimic library v10.1 (Dharmacon; 810 molecules) were screened for anti‐mitotic miRNAs. Hamilton Microlab Star robotics (Hamilton) was used to print pre‐miRNAs to 384‐well plates. Transfection reagent siLentFect (Bio‐Rad) and OptiMEM were added to plates using Multidrop Combi (Thermo Fisher Scientific). After 1 h incubation at room temperature (RT), HeLa H2B‐GFP cells were added to plates and incubated for 60 h after which 150 nM nocodazole or 100 nM taxol was introduced for 12 h. For end‐point analysis, cells were imaged with Zeiss inverted 200 M microscope (Zeiss GmbH) and Metamorph software version 6.2r6 (Molecular Devices) or ScanR imaging software (Olympus Corporation).
2.4. MicroRNAs, target site blockers and transfections
The pre‐miRNAs (Pre‐miR™ miRNA Precursors hsa‐let‐7b‐5p and negative controls #1 and #2) used in cell based target validation were purchased from Ambion. Target site blockers (TSBs) were from EXIQON. The non‐targeting control TSB was EXIQON's miRCURY LNA Inhibitor Control (5′‐AGAGCTCCCTTCAATCCAAA‐3′). The miRNAs and TSBs were used at 40 nM concentration and reverse transfected if not stated otherwise. In reverse transfection, pre‐miRNAs were introduced to cells in parallel with cell plating. For luciferase assays, miRNAs and plasmids were transfected 24 h after cell plating in forward transfection. Hiperfect (Qiagen) or siLentFect (Bio‐Rad) was used as a transfecting lipid. Hiperfect and pre‐miRNA were incubated in Opti‐MEM (Gibco, Life Technologies) for 10–30 min at RT before cells were added in culture medium. SiLentFect was mixed with Opti‐MEM and incubated for 10 min at RT prior to mixing transfection reagent and miRNA. The mixture was incubated for 1 h prior to adding cells. For luciferase assays, Lipofectamine 2000 (Life Technologies) was used as a transfection reagent.
2.5. Cell cycle synchronization
Cells were synchronized with double thymidine block. Briefly, 2 mM thymidine was added to cells for 19 h, after which thymidine was removed by washing the cells 4 times for 15 min with culture medium. After 9 h incubation, the second thymidine block was introduced for 17 h. After second release, cells were incubated for 3 h after which 100 nM taxol or 150 nM nocodazole or DMSO were added. Cell cycle progression was recorded with IncuCyte live‐cell imager (Essen Instruments Ltd.).
2.6. Flow cytometry
For flow cytometric cell cycle analysis, cells were harvested by trypsinization and washed with phosphate buffered saline (PBS). Cells were resuspended in citrate buffer (40 mM Na‐citrate, 0.3% Triton X‐100) containing propidium iodide (50 μg/ml; P3566; Invitrogen, Life Technologies) and incubated for 15 min at RT protected from light. Flow cytometric data were obtained using BD FACSCalibur (BD Biosciences) and CellQuest Pro software (BD Biosciences) and analyzed with the Flowing Software ver. 2.5.1 (Mr. Perttu Terho, Turku Centre for Biotechnology, Turku, Finland, www.flowingsoftware.com).
2.7. Immunoblotting
For Western blotting, cells were centrifuged and washed with cold PBS prior to freezing the pellets in liquid nitrogen. Cells were thawed and lysed in 20 mM Tris–HCl (pH 7.7), 100 mM KCl, 50 mM sucrose, 1 mM MgCl2, 0.1 mM CaCl2, 0.5% Triton X‐100 (APC‐buffer) containing protease inhibitor cocktail (04693132001; Roche) and phosphatase inhibitor PhosSTOP (4906837001; Roche) for 7–10 min on ice followed by centrifugation. Samples were run on 4–20% gradient gels (Bio‐Rad). Protein was transferred to nitrocellulose membranes, which were incubated in blocking solution (5% milk in TBS or 1:1 Odyssey blocking buffer (LI‐COR Biosciences) in TBS) for 45 min, in primary antibody dilution for 0.5–2 h, and in secondary antibody dilution for 1 h at RT. Alternatively, membranes were incubated with primary antibody over night at +4 °C. Primary antibodies were rabbit anti‐Aurora B (ab2254; Abcam; 1:800), mouse anti‐AIM1 (611083; BD Biosciences; 1:1000), and mouse anti‐GAPDH (mAb 6C5; Advanced ImmunoChemical Inc.; 1:30 000‐1:50 000). Secondary antibodies (1:5000) included IR Dye® conjugated anti‐mouse 800 (Rockland Immunochemicals Inc.) and Alexa Fluor® anti‐mouse 680, and anti‐rabbit 680 (Invitrogen, Life Technologies). The signal intensity measurement and the quantitative analysis were conducted using a two channel Odyssey Infrared Imaging System (LI‐COR Biosciences).
2.8. Immunofluorescence
Cells on 384‐well plates, 24‐well plates or coverslips were fixed for 15 min with 2% paraformaldehyde in 60 mM Pipes, 25 mM Hepes, 10 mM EGTA, 4 mM MgSO4 (PHEM) containing 0.5% Triton‐X‐100. For microtubule imaging, 0.2% glutaraldehyde was included in the fixative. Cells were washed by rinsing coverslips in 10 mM MOPS, 150 mM NaCl and 0.05% Tween 20 (MBST) and blocked in MBST containing 20% boiled normal goat serum (bngs) for 1 h at RT. Cells were incubated with primary antibodies for 1 h at RT. Primary antibodies were mouse anti‐AIM1 (611083; BD Biosciences; 1:1000), rabbit anti‐pCenp‐A Ser7 (05‐792; Upstate; 1:1000), human autoimmune serum (CREST; Antibodies Incorporated; 1:200), rabbit anti‐pericentrin (ab4448; Abcam; 1:500), and mouse anti‐α‐tubulin (ab7291; Abcam; 1:200). Coverslips were rinsed in MBST prior to secondary antibody incubation. Secondary antibodies included Alexa Fluor 488, 555 and 647 dyes against mouse, rabbit, and human antigens (Invitrogen; 1:400). Fixed cells were incubated with secondary antibodies for 1 h at RT. All antibody dilutions were made in MBST containing 5% bngs. After rinsing with MBST, DNA was stained with 4′,6‐diamidino‐2‐phenylindole (DAPI). Coverslips were washed with H2O prior to mounting on microscope slides with Vectashield mounting medium (H‐1000; Vector Laboratories).
2.9. Microscopy
A Zeiss inverted 200 M microscope (Zeiss GmbH) equipped with Hamamatsu ORCA‐ER camera (Hamamatsu Photonics), and Metamorph software version 6.2r6 (Molecular Devices) were used to image fixed cells on coverslips. Kinetochore intensities were quantified with Metamorph from maximum projections created from a Z‐stack of images acquired every 0.3 μm. For FISH analysis, ScanR imaging software (Olympus Corporation) was used. IncuCyte live‐cell imager (Essen Instruments Ltd.) or a Zeiss inverted 200 M microscope (Zeiss GmbH) equipped with AxioCam MRm camera, AxioVision software (Zeiss GmbH), and an environment chamber were used for live cell imaging.
2.10. RNA isolation and qRT‐PCR
RNA isolation was performed using RNeasy Mini Kit (Qiagen). Synthesis of cDNA was conducted with iScript™ cDNA synthesis kit (Cat# 170‐8891; Bio‐Rad) according to the manufacturer's instructions. Taqman qRT‐PCR was done using Taqman Universal Master Mix II, no PNG (Applied Biosystems), gene specific primers (Sigma–Aldrich) and probes (Roche Universal Probe Library; Roche). Primers for Aurora B kinase were as follows: forward 5′‐ATTGCTGACTTCGGCTGGT‐3′ and reverse 5′‐GTCCAGGGTGCCACACAT‐3’. Primers for GAPDH were as follows: forward 5′‐AGCCACATCGCTCAGACAC‐3′ and reverse 5′‐GCCCAATACGACCAAATCC‐3′ or forward 5′‐ ACGACCAAATCCGTTGACTC‐3′ and reverse 5′‐ CTCTGCTCCTCCTGTTCGAC‐3’. Gene expression levels were normalized by comparison to GAPDH. MirVana™ miRNA Isolation Kit (Ambion) was used to isolate the total RNA for miRNA PCR. Taqman MicroRNA Reverse Transcription Kit (Applied Biosystems) and miRNA specific Taqman MicroRNA Assay (#4427975; ID 002619; Applied Biosystems) were used to measure let‐7b‐5p expression. MiRNA expression levels were normalized by comparison to RNU6B. The assay readout for gene expression and miRNA qRT‐PCRs was done by the Finnish Microarray and Sequencing Centre (Turku Centre for Biotechnology) with the 7900HT Fast Real‐Time PCR System (Applied Biosystems). Results were analyzed with the comparative Ct method using SDS 2.4 and RQ manager 1.2.1 software (Applied Biosystems).
2.11. Reporter constructs and luciferase assays
The Aurora B 3′UTR region (140 bp) was amplified from the genomic DNA of HeLa cells using following primers: forward 5′‐ATCGACTAGTTGATGGTCCCTGTCATTCACT‐3′ and reverse 5′‐ATCGACGCGTTGAGTACAAAAAGCTTCAGCC‐3’. A fragment covering the full length Aurora B gene (1224 bp) without introns was amplified from the cDNA of HeLa cells using specific primers: forward 5′‐ATCGACTAGTGGAGAGTAGCAGTGCCTTGGA‐3′ and reverse 5′‐ATCGACGCGTTGAGTACAAAAAGCTTCAGCC‐3’. The Aurora B 3′UTR or the full length Aurora B gene were cloned into SpeI/MluI sites of a pMir‐REPORT Luciferase vector (Ambion) downstream of a luciferase gene. For luciferase assays, HeLa cells were seeded onto white clear‐bottom 96‐well plates 24 h prior to transfection. The cells were co‐transfected with 50 ng of the reporter plasmid, 50 ng of Renilla luciferase plasmid and 50 nM of pre‐miR construct using Lipofectamine 2000 (Invitrogen, Life Technologies) according to the manufacturer's instructions. 25 nM Silencer® Firefly Luciferase (GL2 + GL3) siRNA (Ambion) was used to control the reaction conditions. 24 h after transfection, luciferase activity was determined with a Dual‐Glo Luciferase Assay System (Promega Corporation) and measured with an Envision Plate‐reader (Perkin Elmer Inc.).
2.12. Site‐directed mutagenesis
Site‐directed mutagenesis was conducted using QuickChange® Lightning Site‐Directed Mutagenesis Kit (#210518, Agilent Technologies) according to manufacturer's instructions. The following primers were used to create a four base pair mutation to the predicted binding site of let‐7b on Aurora B 3′UTR and the full length Aurora B: forward 5′‐ GGATCCCTAACTGTTCCCTTATCTGTTTTCGCATTCCTCCTTTGTTTAATAAAGGCTGAAG‐3′ and reverse 5′‐CTTCAGCCTTTATTAAACAAAGGAGGAATGCGAAAACAGATAAGGGAACAGTTAGGGATCC‐3’. The mutations were verified by sequencing at the Finnish Microarray and Sequencing Centre (Turku Centre for Biotechnology).
2.13. Fluorescence in situ hybridization (FISH)
HCT‐116 cells were trypsinized and incubated in 0.075 M KCl hypotonic solution for 15 min at 37 °C. Then the cells were fixed using methanol:acetic acid (3:1) for 1 h at 4 °C. The cells were pelleted and resuspended in fresh fixative, and dropped on a clean glass slide (Superfrost from Thermo Fisher Scientific). The glass slide was incubated for minimum 10 min at RT. Vysis LSI ETV6(TEL)/RUNX1(AML1) ES Dual color probe and Vysis LSI 13(13q14) SpectrunGreen probe (Abbott Inc.) were used. The slides were prepared according to the manufacturer's instructions. The Image acquisition and analysis was done using ScanR Imaging system (Olympus Corporation).
2.14. Clinical data analyses
Primary breast carcinoma samples from 101 patients part of the MicMa cohort (Naume et al., 2001) were profiled for miRNA expression using the 8 × 15 k “Human miRNA Microarray Kit (V2)” with design id 019118 from Agilent (Agilent Technologies). In brief, 100 ng total RNA was dephosphorylated, labeled and hybridized for 20 h, following the manufacturer's protocol. Scanning was performed on Agilent Scanner G2565A, signals were extracted using Feature Extraction v9.5 and the subsequent data processing was performed using the GeneSpring software v12.0 (Agilent Technologies). MiRNA signal intensities were log2‐transformed and for each sample normalized to the 90th percentile. MiRNAs that were detected in less than 10% of the samples were excluded. The miRNA expression data was published (Enerly et al., 2011) and has been submitted to the Gene Expression Omnibus (GEO) with accession number GSE19536. The mRNA expression data were measured using Agilent 4 × 44 K one‐color oligonucleotide arrays (Agilent Technologies), published earlier (Enerly et al., 2011) and submitted to GEO with accession number GSE19783. The patient clinical information is described earlier (Naume et al., 2007) and the molecular subtype classification based on mRNA expression was derived using the PAM50 gene list (Parker et al., 2009).
2.15. Statistical analysis
The Student's T‐test was used for performing statistical analysis if not stated otherwise. For analysis of FISH results, Chi‐square test was used. Values are presented as mean ± standard deviation (SD). For analyzing miRNA expression in clinical data groups, The Student's t‐test was applied to evaluate differences in miRNA expression among two groups, and the ANOVA test was applied to evaluate differences between three or more groups. The log‐rank test was used to determine differences between survival curves. Statistical significance was denoted as p < 0.05 (*), p < 0.01 (**) and p < 0.001 (***).
3. Results
3.1. Excess let‐7b induces mitotic defects and affects cell cycle progression
Let‐7b‐5p (Supplementary Figure A.1A), henceforth called let‐7b, was identified as a potential mitosis and cell cycle regulating miRNA in a high‐throughput screen (HTS) for anti‐mitotic miRNAs performed earlier. In total, the HTS yielded seven strong hit miRNAs that are all under further investigations. As the third strongest hit miRNA, let‐7b induced pleiotropic mitotic phenotype including formation of multilobed nuclei after override of chemically induced mitotic block as well as induction of polyploidy in drug‐free culture conditions (data not shown). The transient transfection of pre‐miRNA let‐7b into HeLa cells induced a significant elevation in the let‐7b expression compared to controls (Supplementary Figure A.1B). To confirm the HTS results, we used time‐lapse microscopy to determine cell fates in let‐7b or control miRNA overexpressing HeLa cells treated with the microtubule drug nocodazole (Figure 1A and Supplementary Movies S1‐2). The analysis of the films indicated that HeLa cells with excess let‐7b exhibited significantly increased frequency of forced mitotic exit (47.5%) from nocodazole block in comparison to control (18.8%) (Figure 1A–B). In drug‐free culture conditions, overexpression of let‐7b led to mitotic delay in comparison to controls. The average duration of mitosis in the let‐7b transfected HeLa cell population was 3.7 ± 4.6 h compared to 1.3 ± 1.3 h observed in the control population (Figure 1B). Moreover, the analysis of cell fates indicated that excess let‐7b lowered cell viability compared to controls. In drug‐free culture conditions, 31.3% of the let‐7b overexpressing cells underwent cell death after prolonged mitosis of 9.1 ± 4.9 h whereas 5.0% of control cells died in mitosis with mitotic duration of 5.3 ± 4.8 h (Figure 1B).
Figure 1.
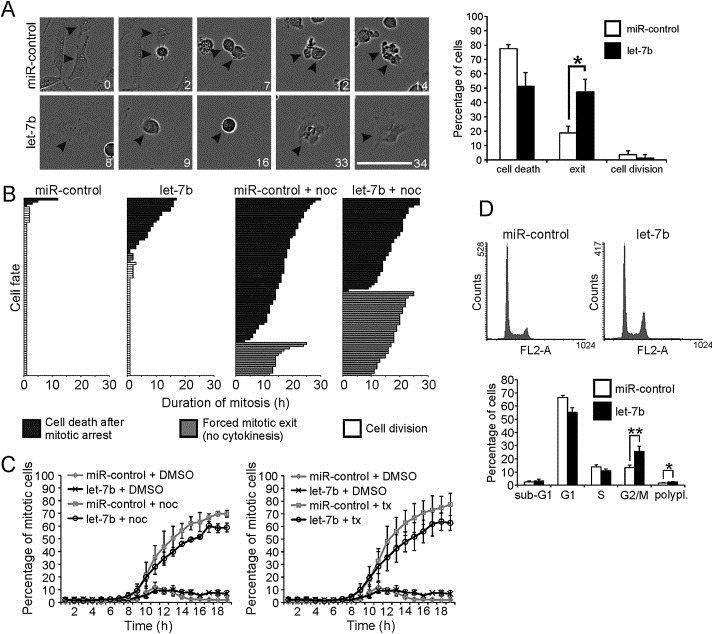
Excess let‐7b perturbs normal mitosis. A, Micrographs of time‐lapse filmed HeLa cells transfected with 40 nM let‐7b or miR‐control and treated with nocodazole (arrowheads point to mitotic cells). Nocodazole (150 nM) was added 48 h post‐transfection. The numbers indicate hours from the drug addition. Scale bar equals 100 μm. The histogram shows quantification of phenotypes observed in nocodazole treated mitotic cells. The data are from four films (mean ± SD), and a total of 80 cells were analyzed for both miR‐control and let‐7b. B, The graphs show fates of 80 mitotic cells in let‐7b and miR‐control transfected cell populations cultured in non‐perturbed conditions or in the presence of nocodazole (noc). C, Mitotic indices of HeLa cell populations transfected with miR‐control or let‐7b, synchronized with double thymidine block and time‐lapse filmed after thymidine washout. Nocodazole (150 nM) or taxol (tx; 100 nM) were added 3 h after thymidine washout. The data are from three separate experiments (mean ± SD). D, Flow cytometric analysis of HeLa cells harvested 48 h post‐transfection. The histogram shows quantification of cell cycle phases. The data are from three separate experiments (mean ± SD). The asterisks denote statistical significance (*p < 0.05, **p < 0.01).
Supplementary video related to this article can be found at http://dx.doi.org/10.1016/j.molonc.2015.01.005.
To confirm the M phase effects and identify any pre‐mitotic cell cycle delays, HeLa cells transfected with let‐7b or control miRNA were synchronized with double thymidine block and time‐lapse filmed for 18 h after thymidine washout (Figure 1C). In the drug‐free culture conditions, no significant difference was observed in timing of M phase entry between let‐7b and control miRNA overexpressing cells. However, the mitotic index (MI) was slightly higher in the let‐7b transfected cell population (6.7 ± 2.7% at 18 h after thymidine washout) compared to controls (2.0 ± 0.6% at 18 h after thymidine washout). In the synchronized and microtubule drug treated cell populations, the MI was higher over time after thymidine washout in the control miRNA transfected cells (in the presence of nocodazole and taxol 69.6 ± 2.6% and 77.4 ± 8.8%, respectively, at 18 h after thymidine washout) in comparison to the let‐7b overexpressing cells (in the presence of nocodazole and taxol 58.9 ± 3.5% and 62.7 ± 5.9%, respectively, at 18 h after thymidine washout). To further characterize the cell cycle effects, let‐7b and control miRNA overexpressing HeLa cells were subjected to flow cytometric analysis. In the control cell population, 13.3 ± 2.0% of the cells were at G2/M (4n) phase whereas in the let‐7b overexpressing cell population significantly more cells (25.7 ± 4.0%) exhibited 4n DNA content (Figure 1D). In flow cytometric analysis, 4n DNA content can refer to G2 and M phase cells but also to cells that have exited from mitosis without cytokinesis. In addition, the frequency of polyploid 8n cells was significantly increased in the let‐7b transfected cell population (2.5 ± 0.1%) compared to control (1.6 ± 0.3%). We conclude that the excess of let‐7b causes disturbances in mitosis that are associated with increased frequency of forced exit from microtubule drug imposed M phase block, elevated induction of polyploidy and lowered cell viability.
3.2. Let‐7b diminishes Aurora B mRNA and protein levels by targeting the 3′UTR of the kinase
The mitosis perturbing phenotype of let‐7b overexpression prompted us to search for mitotic target genes of the miRNA. According to TargetScan target prediction software (TargetScanHuman 6.2; Garcia et al., 2011) Aurora B is one of the possible targets of let‐7b. Earlier studies have associated Aurora B inhibition with forced mitotic exit and override of microtubule drug induced M phase arrest (Kallio et al., 2002), which led us to investigate the impact of let‐7b on the kinase expression. Both the mRNA and protein levels of Aurora B were found to be significantly (p < 0.05) decreased, by 42.3% and 34.6% respectively, in the let‐7b overexpressing HeLa cells compared to controls (Figure 2A–B). Moreover, analysis of immunostained cells indicated that excess of let‐7b caused a significant (p < 0.001) reduction in the amount of centromeric Aurora B and phosphorylated Cenp‐A (Ser7), a well‐established marker for Aurora B activity at the centromere (Zeitlin et al., 2001) (Figure 2C). The mRNA and protein levels of Aurora B were also diminished (p < 0.05 and p < 0.01) in let‐7b transfected breast cancer cell lines MDA‐MB‐231 and highly bone metastatic MDA‐MB‐231 SA compared to controls (Supplementary Figure A.2A‐B). Furthermore, the signal intensity of phosphorylated Cenp‐A was significantly (p < 0.001) reduced in let‐7b transfected MDA‐MB‐231 SA cells (Supplementary Figure A.2C). Excess let‐7b also induced an increase in the amount of cells with multilobed nuclei detected in taxol treated and fixed MDA‐MB‐231 SA cells (Supplementary Figure A.2D). The phenotype suggests that the breast cancer cells undergo forced exit from taxol block. To determine whether let‐7b binds to Aurora B mRNA directly, Aurora B 3′UTR and the full length Aurora B gene were cloned into luciferase reporter vectors. In the let‐7b overexpressing HeLa cells, luciferase activity was diminished by 24.0% (p < 0.05) and 21.1% (p < 0.01) compared to controls determined with Aurora B 3′UTR plasmid and the full length Aurora B plasmid, respectively (Figure 3A). To verify the binding, the predicted binding site of let‐7b on Aurora B was mutated with site‐directed mutagenesis. When either of the mutant plasmids were transfected into let‐7b overexpressing cells, the luciferase activity remained at the basal control level indicating that let‐7b binds to the predicted site in Aurora B mRNA (Figure 3B). Next, we attempted to functionally rescue the suppression of Aurora B protein induced by let‐7b. TSB was designed to bind to Aurora B mRNA and compete for binding with let‐7b. In cells transfected with both let‐7b and TSB, Aurora B protein levels were restored back to the control level (Figure 3C). Our results suggest that let‐7b directly binds to a specific site in the Aurora B 3′UTR causing reduction of Aurora B mRNA and protein levels as well as perturbation of mitotic events dependent on normal Aurora B kinase activity.
Figure 2.
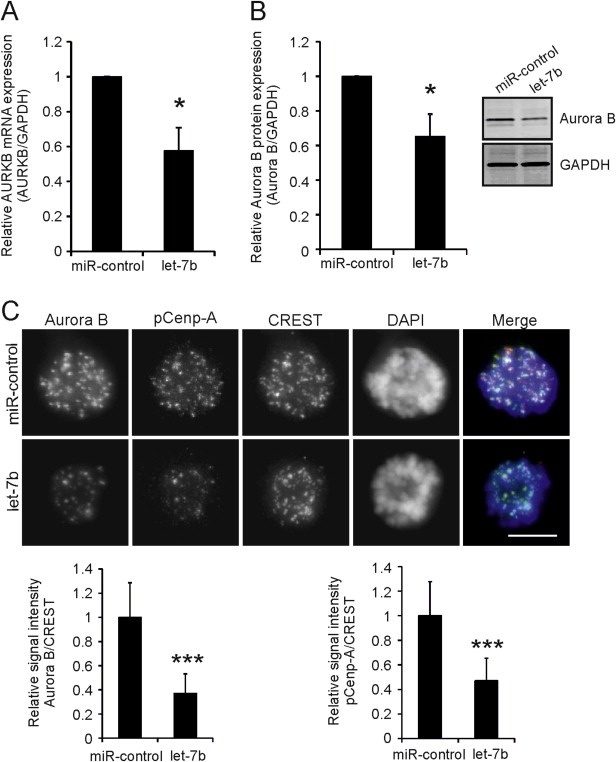
Excess let‐7b reduces Aurora B mRNA (A) and protein (B) levels. A–B, HeLa cells were transfected with 20 nM let‐7b or miR‐control and incubated for 48 h before harvesting for qRT‐PCR and Western blotting. Data are from three separate experiments (mean ± SD). C, Representative micrographs of 40 nM let‐7b or miR‐control transfected HeLa cells treated with 100 nM taxol 52 h post‐transfection for 12 h. Cells were fixed and immunostained with antibodies against Aurora B, phosphorylated Cenp‐A (pCenp‐A) (Ser7), and centromere marker CREST. DNA was stained with DAPI. In merge, Aurora B (red), CREST (green) and DNA (blue) staining are combined. The graphs show quantification of centromeric pCenp‐A and Aurora B signal intensities in mitotic cells normalized against CREST. Data are mean ± SD from 30 cells, 20 centromeres quantified per each cell. Scale bars equal 10 μm. The asterisks denote statistical significance (*p < 0.05, ***p < 0.001).
Figure 3.
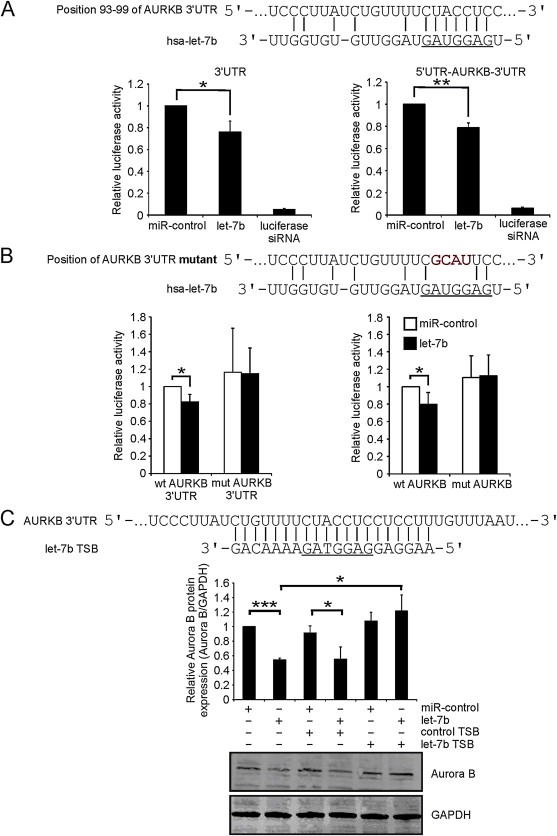
Let‐7b binds to 3′UTR of Aurora B mRNA. A, Reduced luciferase activity in let‐7b overexpressing HeLa cells in comparison to controls determined using reporter plasmids encoding for Aurora B 3′UTR or full length Aurora B sequence. The predicted binding site of let‐7b on Aurora B (AURKB) is shown, and the binding sequence of let‐7b is underlined. Data are from four separate experiments (mean ± SD). B, Site‐directed mutagenesis of Aurora B 3′UTR prevents let‐7b binding determined by luciferase reporter assays. Indicated bases (red) were mutated on Aurora B. Data are from five separate experiments (mean ± SD). C, Let‐7b target site blocker (TSB) rescues Aurora B protein levels in cells with excess let‐7b. HeLa cells transfected with 40 nM miR‐control, let‐7b, control TSB or let‐7b TSB in different combinations as indicated were extracted for Western blotting to detect Aurora B protein levels 48 h post‐transfection. GAPDH was used as a loading reference. TSB sequence and a part of Aurora B mRNA 3′UTR are shown. The region of TSB corresponding let‐7b binding sequence is underlined. Data are from three separate experiments (mean ± SD). The asterisks denote statistical significance (*p < 0.05, **p < 0.01, ***p < 0.001).
3.3. Excess of let‐7b induces aneuploidy and multipolarity
Altered Aurora B expression and activity have been linked to genomic instability (Kallio et al., 2002; Ota et al., 2002). To investigate the impact of let‐7b on induction of aneuploidy, we measured numerical chromosome changes using a near‐diploid colon cancer HCT‐116 cell line. First, we determined Aurora B mRNA and protein levels in HCT‐116 cells transfected with let‐7b or control miRNA. The excess of let‐7b was found to reduce the kinase levels in comparison to controls (Figure 4A–B). Next, using fluorescence in situ hybridization (FISH) we determined possible copy number changes of the chromosomes 12, 13 and 21. Analysis revealed significant elevation in the frequency of monosomy, trisomy, and tetrasomy by excess of let‐7b in comparison to controls (Figure 4C). For example, let‐7b overexpression increased monosomy to 12.8 ± 1.3% and trisomy to 12.5 ± 2.0% compared to control's 6.4 ± 1.5% and 6.6 ± 1.9%, respectively, determined with a probe for chromosome 12.
Figure 4.
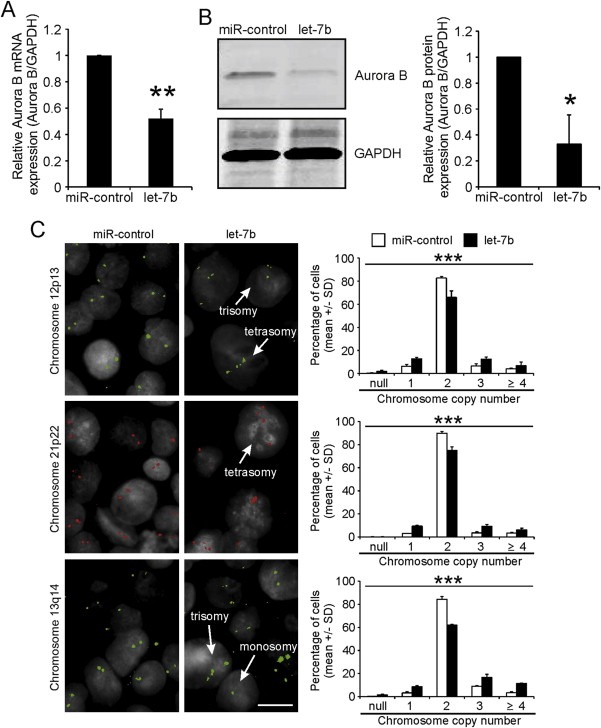
Excess let‐7b alters chromosome copy number in HCT‐116 cells. A–B, HCT‐116 cells were transfected with 50 nM miR‐control or let‐7b and harvested 48 h post‐transfection for qRT‐PCR (A) and Western blot (B) analysis. Data are from three separate experiments (mean ± SD). C, 50 nM let‐7b and miR‐control transfected HCT‐116 cells were fixed 66 h post‐transfection and processed for chromosome specific FISH. The arrows in the micrographs denote individual cells with abnormal chromosome copy number. The scale bar equals to 10 μm. The graphs show quantification of copy numbers in a pool of 800–1 200 cells for both miR‐control and let‐7b transfected cell populations. Data are from 2 to 3 separate assays per a probe (mean ± SD). The asterisks denote statistical significance (*p < 0.05, **p < 0.01, ***p < 0.001).
In addition to the numerical chromosome changes, let‐7b transfected HeLa cells manifested multipolar spindles, which is in line with earlier work reporting induction of polyploidy upon Aurora B inhibition (Kallio et al., 2002). The structure of mitotic spindle was visualized in let‐7b and control miRNA transfected HeLa cells using immunofluorescence with antibodies against α‐tubulin and pericentrin. Let‐7b transfected HeLa cell populations showed significant increase in the number of mitotic cells with more than two poles as 57.7 ± 12.7% of let‐7b transfected cells were multipolar compared to 8.9 ± 5.0% of control population (Figure 5). This resembled closely the impact of chemical inhibition of Aurora B as HeLa cells treated with a chemical Aurora B inhibitor ZM447439 in the presence of a proteasome inhibitor MG132 exhibited high rate of multipolarity (68.9 ± 8.6%) (Supplementary Figure A.3). These results indicate that let‐7b induces multipolarity and aneuploidy, which are both phenotypes associated with Aurora B inhibition.
Figure 5.
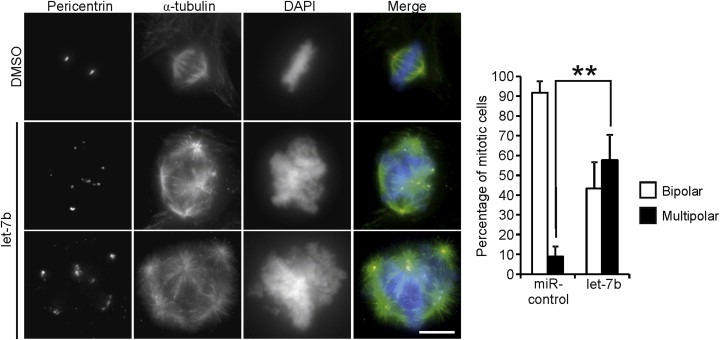
Let‐7b overexpression induces multipolarity in HeLa cells. Cells were transfected with 40 nM let‐7b or miR‐control, fixed 48 h post‐transfection and immunostained with antibodies against pericentrin (red) and α‐tubulin (green). DNA was stained with DAPI (blue). Scale bar equals 10 μm. The graph shows quantification of mitotic cells with either bipolar or multipolar spindles in let‐7b and miR‐control transfected cell populations (n = 75–105). Data are from three separate experiments (mean ± SD). The asterisks denote statistical significance (**p < 0.01).
3.4. Let‐7b overexpression has an additive effect on induction of polyploidy in the presence of the Aurora B inhibitor barasertib
Barasertib (AZD1152) is a specific Aurora B inhibitor in phase II clinical trials for treatment of acute myeloid leukemia (Kantarjian et al., 2013). Since the drug induces mitotic slippage and polyploidy in cells (Marxer et al., 2014), we investigated its possible synergistic or additive effects on the cellular phenotype observed in the let‐7b overexpressing cells. HeLa cell populations overexpressing let‐7b or control miRNA were subjected to treatments with different concentrations of barasertib. The range of concentrations (3.125–50 nM) was chosen based on an earlier study reporting that 12.5 nM barasertib increases the frequency of polyploid cells (Marxer et al., 2014). After 24 h drug incubation, the DNA content of the cell populations was profiled using flow cytometry. The analysis showed that control miRNA transfected Hela cells exhibited increase in 4n and 8n populations when treated with 12.5 nM barasertib as expected (Figure 6). Interestingly, excess let‐7b in combination with barasertib induced more polyploidy compared to barasertib with control miRNA. The difference in polyploidy between control miRNA and let‐7b transfected cells was restored throughout the used concentration range but in cells treated with higher barasertib concentrations the differences became smaller. Together, our data suggest that let‐7b has an additive effect on induction of polyploidy in combination with the Aurora B inhibitor barasertib.
Figure 6.
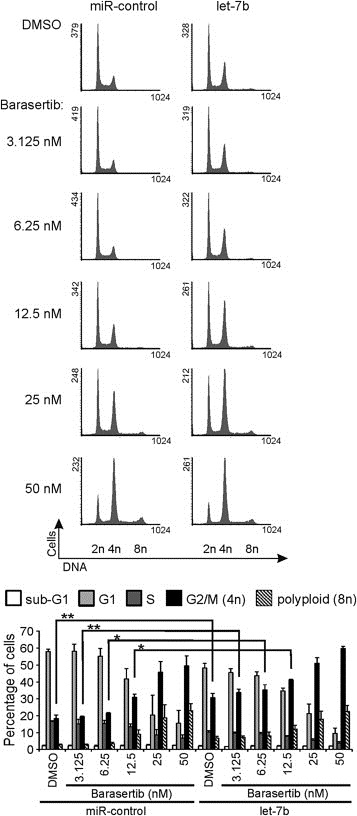
Excess let‐7b has an additive effect on the induction of polyploidy in combination with the Aurora B inhibitor barasertib. HeLa cells transfected with 40 nM miR‐control or let‐7b were subjected to flow cytometric cell cycle analysis 48 h post‐transfection. Barasertib was added to cells at indicated concentrations 24 h before cell harvesting. Representative flow cytometric profiles are shown. The histogram depicts the data from three separate experiments (mean ± SD). The asterisks denote statistical significance (*p < 0.05, **p < 0.01).
3.5. Low let‐7b expression correlates with high tumor grade, positive HER2 status, negative ER status and mutated TP53 in breast cancer patients
Earlier in vitro and xenograft studies have suggested tumor suppressor functions for the let‐7 family (Esquela‐Kerscher et al., 2008; Johnson et al., 2005; Kumar et al., 2008). Moreover, in patients with lung and ovarian cancer, reduced expression of let‐7 family members has been found to correlate with poor prognosis (Nam et al., 2008; Takamizawa et al., 2004). Here, we retrospectively analyzed let‐7b expression in a breast cancer patient cohort composed of 101 patients whose tumors were profiled for expression of 799 miRNAs (Enerly et al., 2011). We found that let‐7b expression inversely correlated with increasing tumor grade (p < 0.001) and was significantly reduced in the HER2 and basal‐like tumor subtypes compared to the normal‐like and luminal A and B cancer subtypes (Figure 7A–B). These previously established molecular subtypes of breast cancer are based on gene expression (Perou et al., 2000; Sorlie et al., 2001) and are associated with survival of which the basal‐like subtype has the worst prognosis. Relapse‐free survival records were available for 96 patients of the Micma cohort. When the patients were divided into high and low let‐7b expression groups (above or below median expression), low let‐7b expression was associated with poorer survival compared to high let‐7b expression (p < 0.05; Figure 7C). Furthermore, let‐7b expression was significantly lower in HER2 positive tumors, ER negative tumors and TP53 mutated tumors compared to the opposite statuses (Figure 7D–F). In accordance with our data showing that let‐7b targets Aurora B mRNA, let‐7b expression was found to inversely correlate with Aurora B expression in different tumor grades (Pearson correlation −0.41, p < 0.001). For example, in the grade 3 tumors let‐7b was markedly reduced while expression of Aurora B was notably elevated (Figure 7G). Next, we investigated The Cancer Genome Atlas Network database to see if our observations can be reproduced using another dataset (Cancer Genome Atlas Network, 2012). The let‐7b expression was available for 395 breast cancer patients. The analysis indicated high similarity in comparison to the results from the Micma cohort. Let‐7b had the lowest expression in the HER2 and basal‐like subtypes of breast cancer (p < 0.001; Supplementary Figure A.4A), and was lower expressed in HER2 positive (p < 0.001; Supplementary Figure A.4B) and in ER negative (p < 0.001; Supplementary Figure A.4C) tumors compared to the opposite statuses. Moreover, a negative correlation between Aurora B and let‐7b expressions (Pearson correlation = −0.367) was observed (p < 0.001; Supplementary Figure A.4D).
Figure 7.
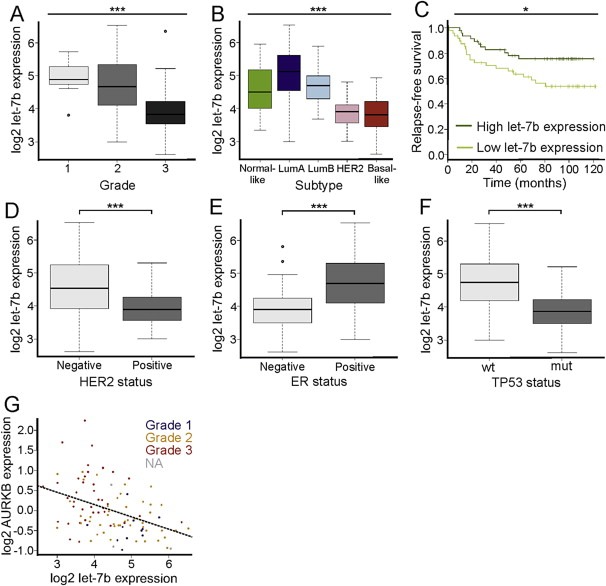
Let‐7b expression and association to clinical parameters. A, Let‐7b expression in breast tumors of different grade (1, 2 and 3). B, Let‐7b expression in the five molecular subtypes of breast cancer (LumA: Luminal A; LumB: Luminal B). C, Let‐7b expression and association to survival. Relapse‐free survival (disease‐free survival) was available for 96 patients of the Micma cohort. The Kaplan–Meier plots show patients divided into high and low expression groups (above or below median expression). D, Let‐7b expression inHER2 negative and positive breast tumors. E, Let‐7b expression in ER negative and positive breast tumors. F, Let‐7b expression in breast tumors of wild‐type (wt) or mutated (mut) TP53. G, Aurora B (AURKB) mRNA expression versus let‐7b expression (Pearson correlation = −0.41). The regression line is shown. Each dot represents an individual breast tumor and the color coding indicates tumor grade. The asterisks denote statistical significance (*p < 0.05, ***p < 0.001). Round dots in panels A and E represent outliers.
Finally, analysis of let‐7 family members' expression patterns in the Micma cohort's breast tumors of different grade and against various clinicopathological markers (Supplementary Figure A.5 and Supplementary Table A.1) revealed that let‐7a, let‐7b, let‐7c, let‐7e and let‐7f all are downregulated in tumors of higher grade. Interestingly, this was a more evident trend for the ‐5p forms of miRNAs compared to the ‐3p forms originating from the same hairpin loops of these individual miRNAs. Importantly, of all the let‐7 family miRNAs we analyzed, let‐7b‐5p was the most significantly downregulated family member in ER negative, HER2 positive and TP53 mutated tumors, and showed the strongest negative correlation with increasing tumor grade (Supplementary Table A.1). In conclusion, our data indicate loss of let‐7b expression in more aggressive forms of breast cancer, which correlates with increased expression of the Aurora B kinase.
4. Discussion
Let‐7b is a member of the let‐7 family of miRNAs that are implicated in oncogenesis as tumor suppressors (He et al., 2010; Johnson et al., 2007). Let‐7 miRNAs control the expression of a number of oncogenes, such as RAS and MYC, and thereby reduce cancer cell proliferation and tumor development (Johnson et al., 2007, 2005, 2008, 2007). Also, it has been suggested based on an mRNA array study that let‐7b indirectly or directly affects the Aurora B kinase levels (Johnson et al., 2007). The effects of let‐7 miRNAs on mitosis have, however, remained largely unknown. Here, we show that let‐7b binds to the 3′UTR of the Aurora B kinase, a mitotic kinase essential for the proper function of the SAC and normal chromosome segregation. Let‐7b overexpression decreased the mRNA and protein levels of Aurora B in cells, which was associated with mitotic defects and induction of aneuploidy and polyploidy. The luciferase reporter assays and TSB rescue experiments confirmed that let‐7b directly targeted Aurora B mRNA for decay. High Aurora B expression and low let‐7b expression have both been separately reported to correlate with a poor patient prognosis (Kurai et al., 2005; Nam et al., 2008). Our results extend the earlier findings showing significant correlation between low let‐7b expression and high Aurora B expression in high grade breast tumors. Together with the observed anti‐mitotic effects of excess let‐7b these results provide a mechanistic explanation of how altered let‐7b expression may drive tumorigenesis via perturbation of Aurora B dependent cellular processes.
Since each miRNA can have several target genes, it is possible that other cell cycle regulators, in addition to Aurora B, become abnormally suppressed by excess let‐7b and thereby contribute to the observed cellular phenotype. However, most, if not all, mitotic anomalies observed in let‐7b overexpressing cells can be associated with Aurora B malfunction. Induction of polyploidy and multipolarity are prominent consequences of Aurora B inhibition as the kinase affects central spindle localization and the completion of cytokinesis by e.g. phosphorylating the centralspindlin complex (Guse et al., 2005). Also, syntelic chromosome attachments and lagging chromosomes leading to aneuploidy have been reported to be consequences of Aurora B inhibition (Hauf et al., 2003; Honda et al., 2003; Tanaka et al., 2002). Furthermore, in non‐perturbed growth conditions the duration of mitosis was prolonged in cells with excess let‐7b. This is possibly caused by cells' initial response to improper kinetochore‐microtubule interactions that are not efficiently corrected due to reduced Aurora B activity. This notion is further supported by our observations that low concentrations of the Aurora B inhibitor barasertib induced transient mitotic arrest (data not shown). Moreover, let‐7b overexpression caused exit from microtubule drug induced M phase arrest, which indicates impaired Aurora B dependent SAC signalling. This closely resembles the outcome of chemical Aurora B inhibition, which causes cancer cells treated with microtubule poisons to undergo forced mitotic exit (Ditchfield et al., 2003; Hauf et al., 2003).
The let‐7 family members share the same seed sequence, the nucleotides 2‐8 at their 5′ ends (Farazi et al., 2011), and often have similar functional consequences (Roush and Slack, 2008). This may explain why many family members, such as let‐7a, let‐7c, let‐7e and let‐7f, showed a similar trend of expression as let‐7b in different clinical groups of breast cancer. Also, let‐7c, let‐7e and let‐7f came up as hit miRNAs in our original HTS (data not shown). It is, however, noteworthy that let‐7b exhibited the most significant expression decrease associated with increasing tumor grade compared to other family members. Let‐7a had very similar expression profile as let‐7b, which could result from the nearby genomic localization of let‐7a‐3 and let‐7b on chromosome 22 enabling common promoter regulation e.g. via NF‐κB (Wang et al., 2012). Interestingly, in endometrial carcinoma also let‐7a has been reported to target Aurora B kinase (Liu et al., 2013) but the impact of this miRNA on mitotic phenotype has not been characterized.
From a clinical perspective our findings can have diagnostic and therapeutic value. First, our findings reveal the association between low let‐7b expression and poorer survival compared to patients with high let‐7b expression. Also, the observation that let‐7b is lower expressed in HER2 positive, TP53 mutated and ER negative breast cancers may have prognostic significance as these forms of breast cancer are generally associated with reduced patient survival. Moreover, restoration of let‐7b expression in such tumors could potentially have beneficial effects on prognosis. Secondly, let‐7b overexpression was found to cause forced exit from microtubule drug induced M phase arrest and may antagonize microtubule drug effects via premature inactivation of the SAC. Since taxanes and epothilones are the first line chemotherapeutics in the treatment of breast cancer (Dumontet and Jordan, 2010), analysis of tumors' let‐7b expression may assist in prediction of drug efficacy in the future. Lastly, excess let‐7b had an additive effect on the induction of polyploidy in the presence of low concentrations of barasertib. This observation may allow the use of let‐7b expression profiling in stratification of patients for future Aurora B therapies. However, we cannot exclude the possibility that the effects of barasertib and let‐7b overexpression are independent.
In summary, based on our in silico findings and experiments in cells, we hypothesize that let‐7b functions as one of the molecular switches that control Aurora B expression post‐transcriptionally. Altered expression of let‐7b could contribute both to cancer initiation and progression by regulating Aurora B dependent mitotic processes. For example, in the later stages of tumorigenesis low let‐7b expression may not be able to suppress Aurora B and target oncogenes, which can provide cells with a growth and survival advantage. The potency of let‐7b as a biomarker for tumor grade and drug efficacy should be addressed in more detail in the future.
Conflict of interest
The authors declare no conflict of interest.
Supporting information
The following are the supplementary material related to this article:
Supplementary data
Supplementary data
Supplementary Movie A.1 HeLa H2B‐GFP cells were transfected with miR‐control and treated with 150 nM nocodazole 48 h post‐transfection. Cells arrest in mitosis and die without exit from M phase. Cells were filmed with 10 min frame capture intervals after addition of the drug. Numbers denote hours and minutes (h:min).
Supplementary Movie A.2 HeLa H2B‐GFP cells were transfected with let‐7b and treated with 150 nM nocodazole 48 h post‐transfection. Cells exhibit mitotic arrest followed by forced exit from M phase and cell death. Cells were filmed with 10 min frame capture intervals after addition of the drug. Numbers denote hours and minutes (h:min).
Acknowledgments
Pauliina Toivonen and Pirjo Käpylä are acknowledged for technical assistance. Elli Narvi and Suvi‐Katri Leivonen are acknowledged for their advice and comments. The authors thank Jouko Sandholm for the assistance with flow cytometry that was performed at the Cell Imaging Core, Turku Centre for Biotechnology. The authors also thank Lauri Aaltonen, Geoffrey Wahl and Theresa A. Guise for providing cell lines. This study was supported by Academy of Finland grants 120804 and 268360 to M.J. Kallio, VTT Technical Research Centre of Finland funding for M.J. Kallio, J.H.E. Mäki‐Jouppila, S. Pruikkonen and M. Tambe, the Finnish Cancer Organisations grants to M.J. Kallio and J.H.E. Mäki‐Jouppila, FinPharma Doctoral Program funding for J.H.E. Mäki‐Jouppila and M. Tambe, Finnish Cultural Foundation grants to J.H.E. Mäki‐Jouppila and S. Pruikkonen, and Turku Doctoral Program of Molecular Medicine funding for S. Pruikkonen. The K. G. Jebsen Centre for Breast Cancer Research and the Norwegian Cancer Society (grant 138296‐PR2008 018) provided funding to A‐L. Børresen‐Dale and the South‐Eastern Norway Regional Health Authority (grant 2014021) provided funding to M.R. Aure.
Supplementary material 1.
1.1.
Supplementary material related to this article can be found at http://dx.doi.org/10.1016/j.molonc.2015.01.005.
References
- Bhattacharjya, S. , Nath, S. , Ghose, J. , Maiti, G.P. , Biswas, N. , Bandyopadhyay, S. , Panda, C.K. , Bhattacharyya, N.P. , Roychoudhury, S. , 2013. miR-125b promotes cell death by targeting spindle assembly checkpoint gene MAD1 and modulating mitotic progression. Cell Death Differ. 20, 430–442. [DOI] [PMC free article] [PubMed] [Google Scholar]
- Cancer Genome Atlas Network, 2012. Comprehensive molecular portraits of human breast tumours. Nature 490, 61–70. [DOI] [PMC free article] [PubMed] [Google Scholar]
- Carter, S.L. , Eklund, A.C. , Kohane, I.S. , Harris, L.N. , Szallasi, Z. , 2006. A signature of chromosomal instability inferred from gene expression profiles predicts clinical outcome in multiple human cancers. Nat. Genet. 38, 1043–1048. [DOI] [PubMed] [Google Scholar]
- DeLuca, J.G. , Gall, W.E. , Ciferri, C. , Cimini, D. , Musacchio, A. , Salmon, E.D. , 2006. Kinetochore microtubule dynamics and attachment stability are regulated by Hec1. Cell 127, 969–982. [DOI] [PubMed] [Google Scholar]
- DeLuca, K.F. , Lens, S.M. , DeLuca, J.G. , 2011. Temporal changes in Hec1 phosphorylation control kinetochore-microtubule attachment stability during mitosis. J. Cell Sci. 124, 622–634. [DOI] [PMC free article] [PubMed] [Google Scholar]
- Ditchfield, C. , Johnson, V.L. , Tighe, A. , Ellston, R. , Haworth, C. , Johnson, T. , Mortlock, A. , Keen, N. , Taylor, S.S. , 2003. Aurora B couples chromosome alignment with anaphase by targeting BubR1, Mad2, and Cenp-E to kinetochores. J. Cell Biol. 161, 267–280. [DOI] [PMC free article] [PubMed] [Google Scholar]
- Dumontet, C. , Jordan, M.A. , 2010. Microtubule-binding agents: a dynamic field of cancer therapeutics. Nat. Rev. Drug Discov. 9, 790–803. [DOI] [PMC free article] [PubMed] [Google Scholar]
- Enerly, E. , Steinfeld, I. , Kleivi, K. , 2011. miRNA-mRNA integrated analysis reveals roles for miRNAs in primary breast tumors. PLoS One 6, e16915 [DOI] [PMC free article] [PubMed] [Google Scholar]
- Esquela-Kerscher, A. , Trang, P. , Wiggins, J.F. , Patrawala, L. , Cheng, A. , Ford, L. , Weidhaas, J.B. , Brown, D. , Bader, A.G. , Slack, F.J. , 2008. The let-7 microRNA reduces tumor growth in mouse models of lung cancer. Cell Cycle 7, 759–764. [DOI] [PubMed] [Google Scholar]
- Farazi, T.A. , Spitzer, J.I. , Morozov, P. , Tuschl, T. , 2011. miRNAs in human cancer. J. Pathol. 223, 102–115. [DOI] [PMC free article] [PubMed] [Google Scholar]
- Forman, J.J. , Legesse-Miller, A. , Coller, H.A. , 2008. A search for conserved sequences in coding regions reveals that the let-7 microRNA targets Dicer within its coding sequence. Proc. Natl. Acad. Sci. U S A 105, 14879–14884. [DOI] [PMC free article] [PubMed] [Google Scholar]
- Garcia, D.M. , Baek, D. , Shin, C. , Bell, G.W. , Grimson, A. , Bartel, D.P. , 2011. Weak seed-pairing stability and high target-site abundance decrease the proficiency of lsy-6 and other microRNAs. Nat. Struct. Mol. Biol. 18, 1139–1146. [DOI] [PMC free article] [PubMed] [Google Scholar]
- Gascoigne, K.E. , Taylor, S.S. , 2008. Cancer cells display profound intra- and interline variation following prolonged exposure to antimitotic drugs. Cancer Cell 14, 111–122. [DOI] [PubMed] [Google Scholar]
- Gassmann, R. , Carvalho, A. , Henzing, A.J. , Ruchaud, S. , Hudson, D.F. , Honda, R. , Nigg, E.A. , Gerloff, D.L. , Earnshaw, W.C. , 2004. Borealin: a novel chromosomal passenger required for stability of the bipolar mitotic spindle. J. Cell Biol. 166, 179–191. [DOI] [PMC free article] [PubMed] [Google Scholar]
- Guse, A. , Mishima, M. , Glotzer, M. , 2005. Phosphorylation of ZEN-4/MKLP1 by aurora B regulates completion of cytokinesis. Curr. Biol. 15, 778–786. [DOI] [PubMed] [Google Scholar]
- Hauf, S. , Cole, R.W. , LaTerra, S. , Zimmer, C. , Schnapp, G. , Walter, R. , Heckel, A. , van Meel, J. , Rieder, C.L. , Peters, J.M. , 2003. The small molecule Hesperadin reveals a role for Aurora B in correcting kinetochore-microtubule attachment and in maintaining the spindle assembly checkpoint. J. Cell Biol. 161, 281–294. [DOI] [PMC free article] [PubMed] [Google Scholar]
- He, J. , Wu, J. , Xu, N. , Xie, W. , Li, M. , Li, J. , Jiang, Y. , Yang, B.B. , Zhang, Y. , 2013. MiR-210 disturbs mitotic progression through regulating a group of mitosis-related genes. Nucleic Acids Res. 41, 498–508. [DOI] [PMC free article] [PubMed] [Google Scholar]
- He, L. , Hannon, G.J. , 2004. MicroRNAs: small RNAs with a big role in gene regulation. Nat. Rev. Genet. 5, 522–531. [DOI] [PubMed] [Google Scholar]
- He, X.Y. , Chen, J.X. , Zhang, Z. , Li, C.L. , Peng, Q.L. , Peng, H.M. , 2010. The let-7a microRNA protects from growth of lung carcinoma by suppression of k-Ras and c-Myc in nude mice. J. Cancer Res. Clin. Oncol. 136, 1023–1028. [DOI] [PubMed] [Google Scholar]
- Hirota, T. , Lipp, J.J. , Toh, B.H. , Peters, J.M. , 2005. Histone H3 serine 10 phosphorylation by Aurora B causes HP1 dissociation from heterochromatin. Nature 438, 1176–1180. [DOI] [PubMed] [Google Scholar]
- Honda, R. , Korner, R. , Nigg, E.A. , 2003. Exploring the functional interactions between Aurora B, INCENP, and survivin in mitosis. Mol. Biol. Cell 14, 3325–3341. [DOI] [PMC free article] [PubMed] [Google Scholar]
- Johnson, C.D. , Esquela-Kerscher, A. , Stefani, G. , 2007. The let-7 microRNA represses cell proliferation pathways in human cells. Cancer Res. 67, 7713–7722. [DOI] [PubMed] [Google Scholar]
- Johnson, S.M. , Grosshans, H. , Shingara, J. , Byrom, M. , Jarvis, R. , Cheng, A. , Labourier, E. , Reinert, K.L. , Brown, D. , Slack, F.J. , 2005. RAS is regulated by the let-7 microRNA family. Cell 120, 635–647. [DOI] [PubMed] [Google Scholar]
- Kallio, M.J. , McCleland, M.L. , Stukenberg, P.T. , Gorbsky, G.J. , 2002. Inhibition of aurora B kinase blocks chromosome segregation, overrides the spindle checkpoint, and perturbs microtubule dynamics in mitosis. Curr. Biol. 12, 900–905. [DOI] [PubMed] [Google Scholar]
- Kantarjian, H.M. , Martinelli, G. , Jabbour, E.J. , 2013. Stage I of a phase 2 study assessing the efficacy, safety, and tolerability of barasertib (AZD1152) versus low-dose cytosine arabinoside in elderly patients with acute myeloid leukemia. Cancer 119, 2611–2619. [DOI] [PMC free article] [PubMed] [Google Scholar]
- Kumar, M.S. , Erkeland, S.J. , Pester, R.E. , Chen, C.Y. , Ebert, M.S. , Sharp, P.A. , Jacks, T. , 2008. Suppression of non-small cell lung tumor development by the let-7 microRNA family. Proc. Natl. Acad. Sci. U S A 105, 3903–3908. [DOI] [PMC free article] [PubMed] [Google Scholar]
- Kurai, M. , Shiozawa, T. , Shih, H.C. , Miyamoto, T. , Feng, Y.Z. , Kashima, H. , Suzuki, A. , Konishi, I. , 2005. Expression of Aurora kinases A and B in normal, hyperplastic, and malignant human endometrium: Aurora B as a predictor for poor prognosis in endometrial carcinoma. Hum. Pathol. 36, 1281–1288. [DOI] [PubMed] [Google Scholar]
- Lawrie, C.H. , Chi, J. , Taylor, S. , 2009. Expression of microRNAs in diffuse large B cell lymphoma is associated with immunophenotype, survival and transformation from follicular lymphoma. J. Cell. Mol. Med. 13, 1248–1260. [DOI] [PMC free article] [PubMed] [Google Scholar]
- Li, M. , Fang, X. , Wei, Z. , York, J.P. , Zhang, P. , 2009. Loss of spindle assembly checkpoint-mediated inhibition of Cdc20 promotes tumorigenesis in mice. J. Cell Biol. 185, 983–994. [DOI] [PMC free article] [PubMed] [Google Scholar]
- Lipp, J.J. , Hirota, T. , Poser, I. , Peters, J.M. , 2007. Aurora B controls the association of condensin I but not condensin II with mitotic chromosomes. J. Cell. Sci. 120, 1245–1255. [DOI] [PubMed] [Google Scholar]
- Liu, P. , Qi, M. , Ma, C. , Lao, G. , Liu, Y. , Liu, Y. , Liu, Y. , 2013. Let7a inhibits the growth of endometrial carcinoma cells by targeting Aurora-B. FEBS Lett. 587, 2523–2529. [DOI] [PubMed] [Google Scholar]
- Lytle, J.R. , Yario, T.A. , Steitz, J.A. , 2007. Target mRNAs are repressed as efficiently by microRNA-binding sites in the 5′ UTR as in the 3′ UTR. Proc. Natl. Acad. Sci. U S A 104, 9667–9672. [DOI] [PMC free article] [PubMed] [Google Scholar]
- Marxer, M. , Ma, H.T. , Man, W.Y. , Poon, R.Y. , 2014. p53 deficiency enhances mitotic arrest and slippage induced by pharmacological inhibition of Aurora kinases. Oncogene 33, 3550–3560. [DOI] [PubMed] [Google Scholar]
- Musacchio, A. , 2011. Spindle assembly checkpoint: the third decade. Philos. Trans. R. Soc. Lond. B. Biol. Sci. 366, 3595–3604. [DOI] [PMC free article] [PubMed] [Google Scholar]
- Nam, E.J. , Yoon, H. , Kim, S.W. , Kim, H. , Kim, Y.T. , Kim, J.H. , Kim, J.W. , Kim, S. , 2008. MicroRNA expression profiles in serous ovarian carcinoma. Clin. Cancer Res. 14, 2690–2695. [DOI] [PubMed] [Google Scholar]
- Naume, B. , Borgen, E. , Kvalheim, G. , Karesen, R. , Qvist, H. , Sauer, T. , Kumar, T. , Nesland, J.M. , 2001. Detection of isolated tumor cells in bone marrow in early-stage breast carcinoma patients: comparison with preoperative clinical parameters and primary tumor characteristics. Clin. Cancer Res. 7, 4122–4129. [PubMed] [Google Scholar]
- Naume, B. , Zhao, X. , Synnestvedt, M. , 2007. Presence of bone marrow micrometastasis is associated with different recurrence risk within molecular subtypes of breast cancer. Mol. Oncol. 1, 160–171. [DOI] [PMC free article] [PubMed] [Google Scholar]
- Ota, T. , Suto, S. , Katayama, H. , Han, Z.B. , Suzuki, F. , Maeda, M. , Tanino, M. , Terada, Y. , Tatsuka, M. , 2002. Increased mitotic phosphorylation of histone H3 attributable to AIM-1/Aurora-B overexpression contributes to chromosome number instability. Cancer Res. 62, 5168–5177. [PubMed] [Google Scholar]
- Parker, J.S. , Mullins, M. , Cheang, M.C. , 2009. Supervised risk predictor of breast cancer based on intrinsic subtypes. J. Clin. Oncol. 27, 1160–1167. [DOI] [PMC free article] [PubMed] [Google Scholar]
- Perou, C.M. , Sorlie, T. , Eisen, M.B. , 2000. Molecular portraits of human breast tumours. Nature 406, 747–752. [DOI] [PubMed] [Google Scholar]
- Roush, S. , Slack, F.J. , 2008. The let-7 family of microRNAs. Trends Cell Biol. 18, 505–516. [DOI] [PubMed] [Google Scholar]
- Sampson, V.B. , Rong, N.H. , Han, J. , Yang, Q. , Aris, V. , Soteropoulos, P. , Petrelli, N.J. , Dunn, S.P. , Krueger, L.J. , 2007. MicroRNA let-7a down-regulates MYC and reverts MYC-induced growth in Burkitt lymphoma cells. Cancer Res. 67, 9762–9770. [DOI] [PubMed] [Google Scholar]
- Sorlie, T. , Perou, C.M. , Tibshirani, R. , 2001. Gene expression patterns of breast carcinomas distinguish tumor subclasses with clinical implications. Proc. Natl. Acad. Sci. U S A 98, 10869–10874. [DOI] [PMC free article] [PubMed] [Google Scholar]
- Sotillo, R. , Hernando, E. , Diaz-Rodriguez, E. , Teruya-Feldstein, J. , Cordon-Cardo, C. , Lowe, S.W. , Benezra, R. , 2007. Mad2 overexpression promotes aneuploidy and tumorigenesis in mice. Cancer Cell 11, 9–23. [DOI] [PMC free article] [PubMed] [Google Scholar]
- Takamizawa, J. , Konishi, H. , Yanagisawa, K. , 2004. Reduced expression of the let-7 microRNAs in human lung cancers in association with shortened postoperative survival. Cancer Res. 64, 3753–3756. [DOI] [PubMed] [Google Scholar]
- Tanaka, T.U. , Rachidi, N. , Janke, C. , Pereira, G. , Galova, M. , Schiebel, E. , Stark, M.J. , Nasmyth, K. , 2002. Evidence that the Ipl1-Sli15 (Aurora kinase-INCENP) complex promotes chromosome bi-orientation by altering kinetochore-spindle pole connections. Cell 108, 317–329. [DOI] [PubMed] [Google Scholar]
- Terada, Y. , Tatsuka, M. , Suzuki, F. , Yasuda, Y. , Fujita, S. , Otsu, M. , 1998. AIM-1: a mammalian midbody-associated protein required for cytokinesis. EMBO J. 17, 667–676. [DOI] [PMC free article] [PubMed] [Google Scholar]
- Wang, D.J. , Legesse-Miller, A. , Johnson, E.L. , Coller, H.A. , 2012. Regulation of the let-7a-3 promoter by NF-kappaB. PLoS One 7, e31240 [DOI] [PMC free article] [PubMed] [Google Scholar]
- Weaver, B.A. , Silk, A.D. , Montagna, C. , Verdier-Pinard, P. , Cleveland, D.W. , 2007. Aneuploidy acts both oncogenically and as a tumor suppressor. Cancer Cell 11, 25–36. [DOI] [PubMed] [Google Scholar]
- Yu, F. , Yao, H. , Zhu, P. , 2007. Let-7 regulates self renewal and tumorigenicity of breast cancer cells. Cell 131, 1109–1123. [DOI] [PubMed] [Google Scholar]
- Zeitlin, S.G. , Shelby, R.D. , Sullivan, K.F. , 2001. CENP-A is phosphorylated by Aurora B kinase and plays an unexpected role in completion of cytokinesis. J. Cell Biol. 155, 1147–1157. [DOI] [PMC free article] [PubMed] [Google Scholar]
Associated Data
This section collects any data citations, data availability statements, or supplementary materials included in this article.
Supplementary Materials
The following are the supplementary material related to this article:
Supplementary data
Supplementary data
Supplementary Movie A.1 HeLa H2B‐GFP cells were transfected with miR‐control and treated with 150 nM nocodazole 48 h post‐transfection. Cells arrest in mitosis and die without exit from M phase. Cells were filmed with 10 min frame capture intervals after addition of the drug. Numbers denote hours and minutes (h:min).
Supplementary Movie A.2 HeLa H2B‐GFP cells were transfected with let‐7b and treated with 150 nM nocodazole 48 h post‐transfection. Cells exhibit mitotic arrest followed by forced exit from M phase and cell death. Cells were filmed with 10 min frame capture intervals after addition of the drug. Numbers denote hours and minutes (h:min).