

Abstract
No consensus treatment regime exists beyond surgery for malignant peripheral nerve sheath tumours (MPNST), and the purpose of the present study was to find new approaches to stratify patients with good and poor prognosis and to better guide therapeutic intervention for this aggressive soft tissue cancer.
From a total of 67 MPNSTs from Scandinavian patients with and without neurofibromatosis type 1, 30 MPNSTs were investigated by genome‐wide RNA expression profiling and 63 MPNSTs by immunohistochemical (IHC) analysis, and selected genes were submitted to analyses of disease‐specific survival.
The potential drug target genes survivin (BIRC5), thymidine kinase 1 (TK1), and topoisomerase 2‐alpha (TOP2A), all encoded on chromosome arm 17q, were up‐regulated in MPNST as compared to benign neurofibromas. Each of them was found to be independent prognostic markers on the gene expression level, as well as on the protein level. A prognostic profile was identified by combining the nuclear expression scores of the three proteins. For patients with completely resected tumours only 15% in the high risk group were alive after two years, as compared to 78% in the low risk group.
In conclusion, we found a novel protein expression profile which identifies MPNST patients with inferior prognosis even after assumed curative surgery. The tested proteins are drug targets; therefore the expression profile may provide predictive information guiding the design of future clinical trials. Importantly, as the effect is seen on the protein level using IHC, the biomarker panel can be readily implemented in routine clinical testing.
Keywords: BIRC5, Immunohistochemistry, MPNST, Prognosis, Survivin, TK1, TOP2A
1. Introduction
Malignant peripheral nerve sheath tumour (MPNST) is a rare and aggressive soft tissue cancer of neuroectodermal origin (Nielsen et al., 2013; Zhu and Parada, 2002). The disease typically strikes patients in early adulthood, and nearly half of the patients are diagnosed with the hereditary genetic disorder of von Recklinghausen, neurofibromatosis type 1 (NF1). NF1 is caused by germline mutations in the tumour suppressor gene NF1 which leads to increased signalling through the RAS/ERK pathway, and inactivating mutations in the NF1 gene is found in both sporadic and NF1‐associated MPNST (Bottillo et al., 2009; Lee et al., 2014). The 5‐year overall survival after an MPNST diagnosis lies in the range between 20 and 50% (Kolberg et al., 2013), and there are currently no standardized treatment protocols other than surgery. Due to the rareness of the disease, systematic clinical trials to obtain robust and statistically significant information about treatment response among MPNST patients are difficult to perform, and so far, no conventional chemotherapeutic drugs have shown consistent improvement of disease outcome (Katz et al., 2009).
In addition to NF1 inactivation, alterations of several other genes and their encoded products have been implicated in the tumourigenesis of MPNST (Carroll, 2012). Concurrent inactivation of the genes TP53 and NF1 in mouse models results in the formation of tumours similar to the MPNSTs seen in humans (Cichowski et al., 1999; Vogel et al., 1999). The frequency of TP53 point mutations in human MPNSTs is debated (Nigro et al., 1989; Lothe et al., 2001; Verdijk et al., 2010), but genomic loss from chromosome arm 17p, including TP53, is common (Brekke et al., 2010). Cell cycle genes have been found implicated in MPNST, in particular frequent deletions and rearrangements of CDKN2A (Berner et al., 1999; Nielsen et al., 1999). Two recent high throughput seqencing studies of human MPNSTs verified the findings on NF1, TP53, and CDKN2A, but in general they showed that there were very few recurrent mutations in MPNST (Lee et al., 2014; Zhang et al., 2014). A striking exception was reported for the two genes SUZ12 and EED, whose gene products are part of the polycomb repressor complex 2 (PRC2). These were found to be frequently lost or mutated in both sporadic and NF1 associated MPNST (Lee et al., 2014; Zhang et al., 2014). Inactivation of PRC2 was shown to drive differential gene expression, especially for Ras target genes (De Raedt et al., 2014).
Microarray based studies of MPNSTs have reported characteristic genome and transcriptome patterns, altered activity of molecular pathways and single gene changes (Holtkamp et al., 2004; Miller et al., 2006; Rahrmann et al., 2013; Watson et al., 2004; Yang et al., 2011; Yu et al., 2011). A number of miRNAs have also been found to be differentially expressed (Sedani et al., 2012). Typical of the referred studies is the limitation of sample size, and thus, the frequencies of the aberrations identified vary among the studies, and conclusive data often remain unknown. A number of previous studies using FFPE material have analysed protein expression in MPNST, including studies on EGFR and ERBB2 expression (Holtkamp et al., 2008; Keizman et al., 2009; Rahrmann et al., 2014; Tabone‐Eglinger et al., 2008; Zou et al., 2009), TP53 (Brekke et al., 2009; Yu et al., 2011; Zou et al., 2009), BIRC5 (Ghadimi et al., 2012; Tabone‐Eglinger et al., 2008), TOP2A (Skotheim et al., 2003), as well as FOXM1, MYC and SOX5 (Yu et al., 2011). In several of these studies, an association was found between protein expression and prognosis. However, the number of patients included is still a challenge, the end‐points used varies among studies and the stage of the disease at sampling is not always referred, and therefore, the clinical use of these prognostic data remain absent.
MPNSTs often show complex karyotypes, with chromosome 17 as one of the most frequently altered chromosomes (Brekke et al., 2010; Lothe et al., 1996; Mertens et al., 2000; Schmidt et al., 1999; Yu et al., 2011). Deletions of chromosome arm 17p and the proximal part of 17q, containing the TP53 and NF1 genes, respectively, are frequently observed in both sporadic and NF1‐associated MPNST (Fletcher et al., 1999, 2002, 2002, 1993, 1995, 1990), whereas gain or amplification at the distal part of 17q is even more common, found in 40–70% of all MPNSTs (Brekke et al., 2010; Schmidt et al., 2000; Yu et al., 2011).
Here, we aimed to identify clinically useful prognostic biomarkers, which may contribute to improved treatment design and outcome for MPNST patients, by performing genome‐wide RNA expression analysis followed by investigating up‐regulated genes at 17q that encode proteins representing putative treatment targets.
2. Material and methods
2.1. Patients and samples
Fresh frozen tumour tissue from eight neurofibromas and 30 MPNSTs (17 with NF1 and 13 with sporadic disease), and formalin‐fixed paraffin‐embedded (FFPE) tissue material from 63 MPNST patients (28 NF1 and 35 sporadic; 25 overlapping with the fresh frozen samples) was obtained from patients who were diagnosed during 1980–2002 at reference sarcoma centres at Skåne University Hospital, Lund, Sweden, and the Norwegian Radium Hospital, Oslo University Hospital, Oslo, Norway (Brekke et al., 2009) according to the guidelines given by the Scandinavian Sarcoma Group (Nielsen et al., 2013). A part of the samples were also evaluated by the CHAMP study group of pathologists (Mertens et al., 2000). Clinical data are summarized in Table 1. The study was approved by the South‐Eastern Norway Regional Health Authority and the Regional Ethics Committee at Lund University according to national legislation.
Table 1.
Clinical characteristics of the MPNST patients.
| Sample type: | Fresh frozen | FFPA |
| Analysis: | Gene expression | IHC on TMA |
| Number of patients: | 30 | 63 |
| NF1/non‐NF1 | 17/13 | 28/35 |
| Median age (range) | 32 (14–79) | 33 (13–85) |
| Gender (female/male) | 16/14 | 31/32 |
| Country of origin (Norway/Sweden) | 12/18 | 40/23 |
| Tumour grade (high/low/ND) | 23/4/3 | 50/8/5 |
| Complete surgical resection (yes/no/ND) | 22/6/2 | 41/17/5 |
| Primary tumour site (extremities/non‐extremities/ND) | 20/10/– | 34/28/1 |
| Median tumour size (range) | 10 (4–25) cm | 8 (2–40) cm |
| Follow up data available | 29 | 62 |
| Median follow up time | 125 (±6) months | 133 (±6) months |
ND: no data.
2.2. RNA isolation
RNA was isolated from fresh frozen tissue samples by standard Trizol methodology. Samples were grinded in a mortar with liquid nitrogen and further dissolved and homogenized with a pellet pestle mortar in 1 ml Trizol (Invitrogen, Carlsbad, CA, USA), followed by phase separation by chloroform and precipitation using 2‐propanol. The RNA pellets were dissolved in RNase free water at 55 °C. The RNA concentration was measured by UV spectroscopy (NanoDrop 1000, Thermo Fisher Scientific, Waltham, MA, USA) and quality was determined by using the Agilent 2100 BioAnalyzer (Agilent Technologies, Santa Clara, CA, USA). 32 of 38 samples had a RIN‐value of 7 or better. Three samples had RIN‐values 3–5, however these were still included based on the final evaluation of the quality parameters from the gene expression array data and the clustering of these samples with the other MPNST samples (see Figure 1A).
Figure 1.
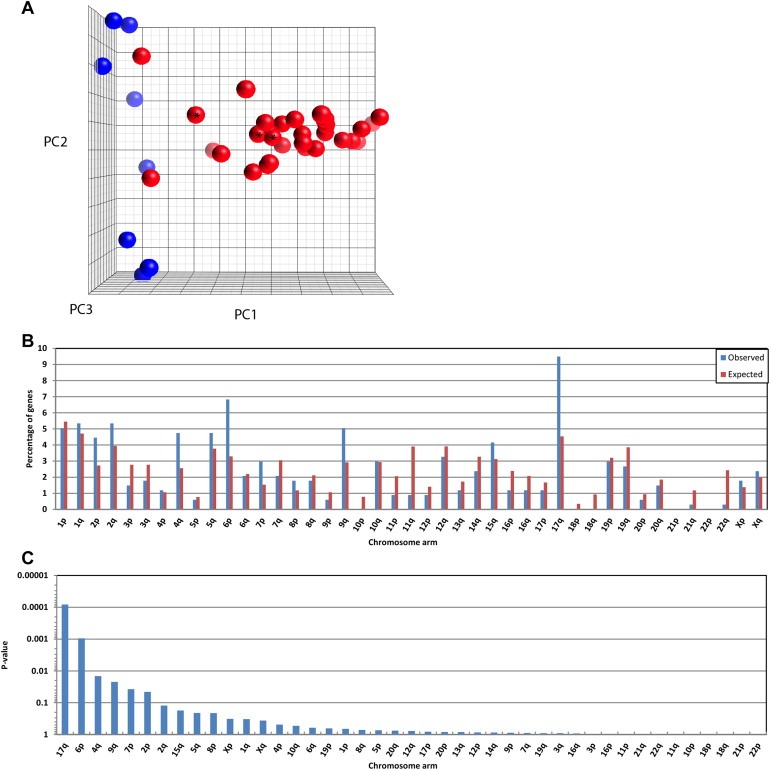
Three‐dimensional principal components plot based expression of the 1000 gene probes with highest variance across eight neurofibromas (blue spheres) and 30 MPNST samples (red) (A). *Samples with RIN values between 3 and 5. Percentagewise distribution over 43 chromosome arms of Entrez annotated gene probes on the AB1700 microarray (N = 11,596 genes) (expected distribution; red bars) compared to the distribution of the significantly upregulated genes (N = 337) in MPNST vs neurofibroma (observed distribution; blue bars) (B). Statistical significance of the deviation between observed and expected distribution of the N = 337 upregulated genes in MPNST vs neurofibroma as sorted by the P‐value from a binomial distribution test, cumulative probability, P (X ≥ x) (C).
2.3. Gene expression analysis
Gene expression analysis was performed using the Applied Biosystems 1700 microarray platform and the Human Genome Survey Microarray V2.0 containing 32,878 unique 60‐mer oligonucleotide probes (Applied Biosystems by Life Technologies, Foster City, CA). From each sample, 2 μg RNA was amplified, labelled and hybridized as described in the manufacturer's protocol. For the initial data analysis we used the ABarray software package (http://bioconductor.org/packages/1.9/bioc/html/ABarray.html) to run quality check and basic statistical analysis. Quantile normalized and log2 transformed expression data were used in our downstream statistical analysis. Flag values were replaced by using the Significance Analysis of Microarrays Excel Add‐in application (version 3.02; http://www‐stat.stanford.edu/∼tibs/SAM/) and the k nearest neighbours algorithm (k = 10). Probes with signal‐to‐noise ratios less than three in half of the samples and probes with flagged intensity values in more than 20% of the samples were removed, leaving us with a dataset containing measurements from 18,796 probes available at the Gene Expression Omnibus (GEO, http://www.ncbi.nlm.nih.gov/geo/, Series GSE66743). Gene expression intensity values were centred over the median value across all samples. We used the ABI Human Genome Survey Microarray Version 2 annotation file from GEO (platform GPL2986) for downstream analysis, and the 12,484 probes annotated by Entrez Gene ID's were included. SAM application and t‐test statistics with a two class unpaired response format were used to test for the significance of differentially expressed genes between defined groups. Principal component analysis was performed in Partek Genomics Suite 6.6 (Partek Inc., St. Louis, MO, USA). Gene set enrichment analyses were performed using the internet tools provided on the DAVID website (Huang et al., 2009).
2.4. Immunohistochemistry
In situ protein expression analysis performed on 4 μm sections of the TMA was done according to the DAKO Envision protocol (DAKO, Glostrup, Denmark) as described (Brekke et al., 2009), with the following adjustments: for the TOP2A antibody (NCL‐TOPOIIA, Novocastra, USA, 1:5 dilution), heat induced epitope retrieval was performed in a pressure cooker for 1 min at 120 °C in citrate buffer (pH 6.0) according to the manufacturer's recommendation; for the BIRC5 antibody (ab469, Abcam, Cambridge, UK, 1:400) and the TK1 antibody (ab57757, Abcam, 1:100) epitope retrieval was performed by heating in a microwave oven for 5 min at 850 W followed by 15 min at 100 W. Citrate buffer (pH 6·0) was used for BIRC5, and Tris–EDTA buffer (pH 9.0) was used for TK1.
The stained TMA sections were scanned at ×400 magnification using the Nano‐Zoomer Digital Pathology scanner (Hamamatsu Photonics K.K., Hamamatsu, Japan). Scoring was done by two of the authors independently (MK and MH) and quality controlled by a reference pathologist (BD). Nuclear and cytoplasmic staining was scored from 0 to 5 according to the distribution of positive cells (0 = 0%, 1 = <1%, 2 = 1–10%, 3 = 11–33%, 4 = 34–66%, and 5 = 67–100%), and from 0 to 2 according to staining intensity (0 = negative, 1 = weak, and 2 = strong). The group sizes and survival properties for the patients in each of these staining categories were analysed individually, and two final categories were assigned before downstream analyses (see Supplementary Figure 4).
The target specificity of the antibodies was tested on Western blots as previously described (Brekke et al., 2009) in two MPNST cell lines (ST88‐14 and STS26T) and a panel of cell lines from several other cancer types (Supplementary Figure S1). The MPNST cell lines were kindly provided by Dr. Nancy Ratner. The identity of the cell lines was validated by genotyping in our lab according to the protocol of the AmpFLSTR Identifiler PCR Amplification Kit (Applied Biosystems), and the genotypes are available upon request.
2.5. Statistical analysis
Comparison of gene expression among patients with high or low protein expression was done using Mann–Whitney U test. Disease‐specific survival curves were analysed using the Kaplan–Meier method and the Breslow test was used to compare the equality of the survival functions. For ordinal parameters with more than two categories, the P‐value for linear trend is presented. Finally, we used Cox proportional hazards regression modelling with Wald test to provide univariate and multivariate hazard‐ratios (HR) and confidence intervals (CI), and we defined distinct clinical subgroups of MPNST based on these results. All statistical analyses were performed using the SPSS software version PASW 18.0 (IBM Corporation, Armonk, NY, USA).
3. Results
3.1. Differentially expressed genes in MPNST vs neurofibromas
Gene expression values were included for 12,484 probes in 30 MPNSTs and eight neurofibromas. The overall gene expression in the neurofibromas was clearly different from that in the majority of the MPNSTs (Figure 1A). A two‐class unpaired SAM analysis of the gene expression profiles identified 437 of the 12,484 genes as down‐regulated in MPNST compared with neurofibromas, and 345 genes as up‐regulated, using a false discovery threshold of 1% (Q ≤ 0.01). The top 100 up‐ and down‐regulated genes are listed in Supplementary Table S1A and S1B, respectively.
Functional annotation clustering of the significantly differentially expressed genes between MPNST and neurofibromas showed the strongest enrichment of genesets containing cell cycle, cell division and kinetocore/chromosome‐condensation associated genes (Supplementary Table S2A). The most significantly enriched pathway genesets (KEGG pathways) included extracellular matrix (ECM)‐receptor interaction, complement/coagulation cascade, cell cycle, and DNA replication (Supplementary Table S2B).
Since MPNSTs typically have a high degree of DNA copy number alterations, we also investigated genesets according to the chromosomal distribution, and we found that up‐regulated genes in MPNST were overrepresented on chromosome arms 17q, 6p, 4q, and 9q, while they were underrepresented on 11q, 22q, 21q, and 11p (Figure 1B). 17q was the region with the strongest enrichment of up‐regulated genes, harbouring 9.5% of these genes as compared to the expected 4.5% (Binominal distribution test, cumulative probability: P (X ≥ 9.5%) = 8·10− 5 (Figure 1C)). Among the 100 most up‐regulated genes, eight were encoded on 17q: TOP2A (rank 2), BIRC5 (rank 3), COL1A1 (rank 32), NME1 (rank 64), CACNA1G (rank 66), TK1 (rank 75), CDC6 (rank 80), and PRR11 (rank97) (Supplementary Table S1A). BIRC5 and TK1 are represented by two different probes on the AB1700 oligonucleotide array that recognize alternative transcript variants, where Probe#1 represents the reference transcript in both cases.
We were not able to identify any significant differences in gene expression between MPNSTs from patients with NF1 and from non‐NF1 patients; all genes had a Q‐value above 0.25 (data not shown).
3.2. Clinical outcome by gene expression levels
In Kaplan‐Meyer analyses including 29 MPNST patients, five of the eight genes on chromosome arm 17q identified in the previous section, BIRC5, CDC6, NME1, TK1, and TOP2A, showed a significant association with disease outcome when the patients were dichotomized above or below median expression across all samples (Supplementary Figure S2). We also performed an unbiased genome wide Cox regression analysis for 10 years survival including 3340 genes on the AB1700 array that had a standard deviation across all MPNST samples of more than 1. The 43 genes that obtained an absolute d‐score ≥2 are listed in the Supplementary Tables S3A and S3B, in addition to the eight 17q genes identified in the previous section. The three genes BIRC5, TK1, and TOP2A were the only 17q genes that obtained a Q‐value below 0.25, and these were selected for further validation on the protein level.
3.3. Differential expression of proteins BIRC5, TK1, and TOP2A in MPNST tissue
Nuclear and cytoplasmic protein expression of BIRC5, TK1, and TOP2A was analysed by IHC on TMA sections containing tissue samples from 63 MPNSTs (representative samples are shown in Figure 2). Grouping of tumour samples into two final categories with high and low staining is explained in section 3.4. below.
Figure 2.
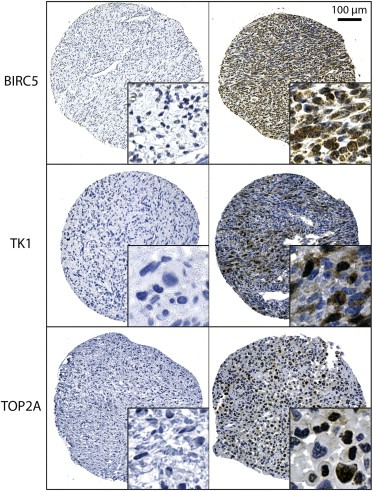
Representative MPNST tissue sections showing in situ IHC staining for BIRC5 (survivin), TK1, and TOP2A. Left column: negative staining, right column: positive staining. Enlarged insets are magnified 5×.
We analysed the association between gene expression and protein expression (Mann–Whitney U test) and found that samples with high levels of nuclear TOP2A and nuclear BIRC5 had significantly higher gene expression levels of the corresponding genes, while nuclear TK1 was weakly associated with TK1 gene expression (Supplementary Figure S3). No significant associations were found between gene expression and cytoplasmic staining (data not shown). For this reason, and because nuclear staining is easier to score in a routine clinical setting, cytoplasmic staining was not included in subsequent analysis. The staining distribution and intensity scores for nuclear staining are summarized in Supplementary Table S4. There were no statistically significant differences in protein expression between tumours from NF1 and non‐NF1 patients for any of the three proteins.
3.4. Clinical outcome predicted by BIRC5, TK1, and TOP2A protein expression
For BIRC5 and TK1 both increasing number of positive nuclei (staining distribution) and increasing staining intensity were associated with worse prognosis, and two final IHC categories of tumour samples with high or low staining were defined by the sum of the distribution and intensity score (Supplementary Figure S4A and B). For TOP2A, only staining distribution was associated with prognosis, therefore the two final IHC categories were defined by the percentage of positive nuclei only (Supplementary Figure S4C). High staining for BIRC5, TK1, and TOP2A showed significant association to poor disease‐specific survival in univariate Kaplan Meier and Cox regression analyses (Figure 3, Table 2). Multivariate Cox regression analysis showed that there was redundancy among the different proteins, as none of the individual proteins remained significant (Table 2), although the overall Cox model of the three proteins was significant (P = 0.02). However, we found that when the patients were stratified by high or low nuclear staining of BIRC5, TOP2A added significant prognostic information to substratify the patients with low BIRC5, whereas TK1 added significant prognostic information to the patients with high BIRC5 expression in their tumours (Figure 4A). Thus, the two combinations low BIRC5/low TOP2A and high BIRC5/low TK1 predicted good outcome, while the combinations low BIRC5/high TOP2A and high BIRC5/high TK1 predicted poor outcome (HR: 3.92; 95% CI: 1.79–8.57; Table 3; Figure 4B). This profile, referred to as an IHC risk profile, was independently significant when adjusted for patient age, gender, tumour size, site, grade, NF1‐status, and surgical remission (HR: 4.60; 95% CI: 1.47–14.4; Table 3). Among the 35 patients with complete surgical resection, only 15% in the high risk group were alive two years after MPNST diagnosis, as compared to 78% in the low risk group. Even after ten years, 70% were still alive in the low risk group (Figure 4C). All other combinations of the three proteins were also tested, but these combinations did not separate the patients into equally distinct prognostic groups.
Figure 3.

Association between BIRC5, TK1 and TOP2A protein expression and patient survival. The Kaplan Meier plots show disease‐specific survival as a function of high (red lines) and low (blue lines) IHC staining levels of nuclear BIRC5 (A), nuclear TK1 (B), nuclear TOP2A (C). P‐values for five‐year survival are shown (Breslow test).
Table 2.
Association between IHC score and five‐year MPNST specific survival.
| Univariate | Multivariate | |||||||
|---|---|---|---|---|---|---|---|---|
| Parameter | n | HR | 95% CI | P‐valuea | n | HRb | 95% CI | P‐valuea |
| Nuclear BIRC5 | ||||||||
| ‐ High | 26 | 2.27 | 1.06–4.87 | 0.04 | 25 | 1.46 | 0.62–3.41 | 0.63 |
| ‐ Low | 33 | Ref | 31 | Ref | ||||
| ‐ ND | 3 | |||||||
| Nuclear TK1 | ||||||||
| ‐ High | 15 | 2.44 | 1.11–5.36 | 0.03 | 15 | 2.08 | 0.90–4.81 | 0.09 |
| ‐ Low | 42 | Ref | 41 | Ref | ||||
| ‐ Missing | 5 | |||||||
| Nuclear TOP2A | ||||||||
| ‐ High | 17 | 2.20 | 1.001–4.85 | 0.05 | 17 | 1.82 | 0.79–4.23 | 0.16 |
| ‐ Low | 40 | Ref | 39 | Ref | ||||
| ‐ Missing | 5 | |||||||
n: number of cases; HR: hazard ratio; Ref: reference category; CI: confidence interval; ND: no data.
P‐value from Wald test.
Multivariate HR (all variables included in the Cox model).
Figure 4.
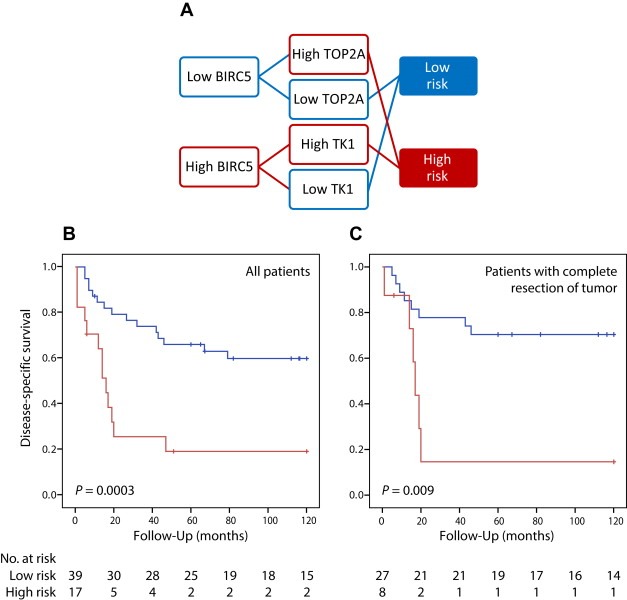
Stratification of MPNST patients based on the IHC risk profile defined by nuclear staining against BIRC5, TK1, and TOP2A, and comparison of survival curves for the high risk (red) and low risk (blue) groups (A). The Kaplan Meyer curves show disease‐specific survival for all MPNST patients (N = 56) (B) and MPNST patients with complete resection of tumour (N = 35) (C). P‐values for five‐year survival are shown (Breslow test).
Table 3.
Association between IHC risk profile and five‐year MPNST specific survival.
| Parameter | Univariate | Multivariate | ||||||
|---|---|---|---|---|---|---|---|---|
| n | HR | 95% CI | P‐valuea | n | HRb | 95% CI | P‐valuea | |
| IHC risk profilec | ||||||||
| ‐ High risk | 17 | 3.92 | 1.79–8.57 | 0.0006 | 12 | 4.60 | 1.47–14.4 | 0.009 |
| ‐ Low risk | 39 | Ref | 32 | Ref | ||||
| ‐ ND | 6 | |||||||
| NF1 status | ||||||||
| ‐ Non‐NF1 | 34 | Ref | 19 | Ref | ||||
| ‐ NF1 | 28 | 0.98 | 0.48–2.02 | 0.96 | 25 | 2.49 | 0.71–8.74 | 0.15 |
| Gender | ||||||||
| ‐ Female | 31 | Ref | 20 | Ref | ||||
| ‐ Male | 31 | 0.72 | 0.35–1.48 | 0.37 | 24 | 0.94 | 0.31–2.81 | 0.91 |
| Completely resected tumour | ||||||||
| ‐ Yes | 40 | Ref | 30 | Ref | ||||
| ‐ No | 17 | 1.44 | 0.63–3.22 | 0.38 | 14 | 1.15 | 0.39–3.46 | 0.80 |
| ‐ ND | 5 | |||||||
| Tumour location | ||||||||
| ‐ Extremities | 34 | Ref | 23 | Ref | ||||
| ‐ Non‐extremities | 27 | 2.47 | 1.16–5.26 | 0.02 | 21 | 1.72 | 0.56–5.31 | 0.34 |
| ‐ ND | 1 | |||||||
| Age | 62 | 1.008 | 0.99–1.03 | 0.34 | 44 | 0.99 | 0.95–1.03 | 0.65 |
| Tumour size | ||||||||
| ‐ ≤8 cm | 31 | Ref | 25 | Ref | ||||
| ‐ >8 cm | 27 | 2.25 | 1.04–4.86 | 0.04 | 19 | 1.39 | 0.52–3.71 | 0.51 |
| ‐ ND | 4 | |||||||
| Grade | ||||||||
| ‐ Low | 8 | Ref | 6 | Ref | ||||
| ‐ High | 49 | 6.95 | 0.94–51.2 | 0.06 | 38 | NC | 0.98 | |
| ‐ ND | 5 | |||||||
n: number of cases; HR: hazard ratio; Ref: reference category; CI: confidence interval; ND: no data; NC: nonconvergent.
P‐value from Wald test.
Multivariate HR (all variables included in the Cox model).
IHC high risk group: Positive BIRC5/Positive TK1 or Negative BIRC5/Positive TOP2A; IHC low risk group: Positive BIRC5/Negative TK1 or Negative BIRC5/Negative TOP2A.
For 24 patients with matching IHC and CNV data, the percentage of patients with copy number gain on chromosome arm 17q was slightly, but not significantly, higher in the high risk group as compared to the low risk group (86 vs 65%, P = 0.6).
4. Discussion and conclusions
4.1. Discussion
MPNSTs are highly aggressive neoplasms with no recommended treatment options beside surgery. In a recent review and meta‐analysis (Kolberg et al., 2013), we found that the outcome from NF1‐associated MPNST has improved slightly over the last decades, whereas no improvement was seen for sporadic cases; the five‐year overall survival is now close to 50% for both patient groups. In order to improve MPNST outcome, biomarkers that identify high risk patients are needed, as well as novel drug targets in order to offer these patients targeted treatment. A handful of studies have described potential drug targets in MPNST (Ghadimi et al., 2012; Holtkamp et al., 2008; Patel et al., 2012; Peacock et al., 2013; Wu et al., 2014; Yang et al., 2011), but very few have been validated in independent series, and none has so far been implemented in clinical use.
The gene expression data presented in this study reveal many potential markers for MPNST beyond the 17q genes we have focused on here; some of them have been suggested by earlier studies. Miller and colleagues highlighted CNP, PMP22, and NGFR as down‐regulated, and SOX9 and TWIST1 as up‐regulated in MPNST as compared to benign Schwann cells (Miller et al., 2006). These findings could be verified in our data, with the exception of SOX9, and PMP22 was found among our top 100 down‐regulated hits. Levy and co‐workers found that Tenascin XB (TNXB) was down‐regulated in MPNST vs plexiform and dermal neurofibromas, while Tenascin C (TNC) was up‐regulated (Levy et al., 2007). Our data confirm these findings, and interestingly TNXB was the 28th gene on our top 100 down‐regulated list. TNC was also identified as up‐regulated in MPNST by Karube and colleagues (Karube et al., 2006), along with keratin 18 (KRT18), survivin (BIRC5), and the collagen VIa3 (COL6A3), while IGFBP6 was reported to be down‐regulated, all these findings are in agreement with our data and IGFBP6 was even found on our top 100 down‐regulated list. In a recent study, AURKA was identified as overexpressed in MPNST (Patel et al., 2012), and a moderate overexpression was also seen in our samples. EGFR has been found to be up‐regulated in MPNST in several previous studies (Holtkamp et al., 2008; Rahrmann et al., 2014; Tabone‐Eglinger et al., 2008), but this was not confirmed in our samples. However, a high percentage of MPNSTs have previously been shown to lack expression of EGFR (Watson et al., 2004), and it is possible that EGFR is important for tumourigenesis in only a subset of these tumours, supported by the finding that only about 35% of MPNSTs have increased gene dosage of EGFR (Brekke et al., 2010; Du et al., 2013; Holtkamp et al., 2008), therefore we need a higher number of tumour samples than included in the present study to determine the role of EGFR in MPNSTs. On our top 100 list of up‐regulated genes in MPNST only one gene has a higher ranking than BIRC5 and TOP2A, KIAA0101, the importance of this gene is not further validated in this study, and to our knowledge it has not been described in MPNST previously. However, KIAA0101 has been identified as upregulated and a potential prognostic marker in several studies on other cancer types (Xie et al., 2014), and might also prove to be important in tumorigenesis of MPNST in the future.
From the current transcriptome data we found that chromosome arm 17q has the highest relative amount of up‐regulated genes, and several of these genes carried prognostic information. We have previously found that chromosome arm 17q was one of the most frequently gained genomic regions in MPNST (Brekke et al., 2010; Lothe et al., 1996), and we and others have suggested that increased tumour mRNA levels of the two genes TOP2A and BIRC5 have the potential to be markers for poor prognosis in MPNST (Ghadimi et al., 2012; Karube et al., 2006; Kresse et al., 2008; Levy et al., 2004; Peacock et al., 2013; Skotheim et al., 2003; Storlazzi et al., 2006). A high level of TOP2A protein has also been shown to be associated with poor outcome (Skotheim et al., 2003). Although prognostic gene expression profiles and PCR based tests have been suggested for many cancers, very few have found their way into clinical practice. We therefore aimed to develop an IHC test that can immediately be used in routine labs.
Nuclear staining is best suited for reproducible visual scoring, and we identified a prognostic profile defined by nuclear expression of the three 17q encoded proteins BIRC5, TOP2A and TK1, all of which are also potential drug targets. Topoisomerases are essential components of the DNA replication machinery where they are responsible for controlling and altering the topology of the DNA. Clinical trials with etoposide for MPNST have shown promising results (Kinebuchi et al., 2005; Steins et al., 2002), and primary data collection for a phase II study using this drug in combination with ifosfamide, doxorubicin, and radiation therapy was recently completed, but the final results are still pending (www.clinicaltrials.gov; NCT00304083). Single agent topoisomerase inhibitors are unlikely to have a strong effect on survival, given the experience from use of these drugs in soft‐tissue sarcomas including MPNST for decades. However, therapy using TK1 or BIRC5 inhibitors in treatment of MPNST has not been explored to our knowledge, and combination therapy including such inhibitors might prove successful.
The antiapoptotic protein BIRC5, also known as survivin, has previously been proposed as a potential drug target in MPNST (Karube et al., 2006), and a series of strategies directed against BIRC5 are currently in clinical trials in other cancer types, including antisense oligonucleotides, immunotherapy, and small molecule inhibitors (Ryan et al., 2009; Sioud et al., 2013). In addition, MPNST cell lines treated with the survivin inhibitor sepantronium bromide (YM155) showed reduced proliferation (Ghadimi et al., 2012). In support of our finding, a recent study found that high mRNA levels of BIRC5 was associated with poor outcome in paediatric MPNST (Alaggio et al., 2013). It should be noted that in one previous study, high levels of BIRC5 were also observed in benign tumours of the peripheral nervous system, schwannomas and neurofibromas (Sasaki et al., 2002), in contrast to our results.
For some time, viral TK1 has served as a target in treatment of a number of virus‐induced diseases using drugs such as zidovudine (AZT), acyclovir, and ganciclovir. TK1‐directed treatment has proven so effective that attempts have also been made to introduce viral TK1 into cancer cells by gene therapy followed by exposure to the antiviral drugs (Oliveira et al., 2012; Packer et al., 2000). TK1 is also an important activator of the prodrug intermediate 5'‐fluorodeoxyuridine (5‐FdU) to the cytotoxic 5'‐fluorodeoxyuridine monophosphate (5‐FdUMP), which is a suicide substrate for thymidylate synthetase (TYMS). A high serum level of TK1 has been demonstrated to be a marker of poor prognosis for several cancers (Aufderklamm et al., 2012), including breast cancer, colorectal cancer, lung cancer, and non‐Hodgkin lymphoma. The finding of high levels of TK1 in MPNSTs from patients with poor prognosis suggests that drugs directed towards TK1, or that are activated by TK1, may be useful for treatment of these patients.
4.2. Conclusions
In this study, we identified three molecular markers, BIRC5, TK1 and TOP2A that significantly stratify patients into a good and poor prognostic group both on the mRNA and protein level. Furthermore, as BIRC5, TK1 and TOP2A are drug targets, future clinical trials for MPNST patients could be designed to explore the benefit of targeting these markers using their combined protein expression to predict treatment response.
Supporting information
The following are the supplementary data related to this article:
Supplementary data
Supplementary Figure S1 Validation of antibodies. The specificity of each antibody was tested by Western blots of protein extracts from different cancer cell lines, including two MPNST cell lines (left lanes). β‐Actin was used as positive control (Antibody A5316 Sigma–Aldrich, St. Louis, MO, USA).
Supplementary Figure S2 Association between gene expression and survival for five genes encoded on chromosomal arm 17q. The Kaplan Meier plots show disease‐specific survival for MPNST patients as a function of gene expression levels above (red lines) or below (blue lines) the median for BIRC5 (A), CDC6 (B), NME1 (C), PRR11 (D), TK1 (E), and TOP2A (F). BIRC5 and TK1 are represented by two different oligonucleotide probes, indicated by solid lines Probe#1 and dashed lines for Probe#2. P‐values for five‐year survival are shown (Breslow test).
Supplementary Figure S3 Correlation between gene expression and protein expression. Comparison of the IHC staining for TOP2A (A), BIRC5 (B), and TK1 (C) expression levels of the corresponding genes. For BIRC5 and TK1, two different oligonucleotide probes were present on the gene expression array (Probe#1 in blue, Probe#2 in green). P‐values from Mann–Whitney U test.
Supplementary Figure S4 The Kaplan Meier plots show disease‐specific survival as a function of distribution score (A, B, C) and intensity score (D, E, F), as well as combined score (sum of the above) (G,H,I) for the three proteins BIRC5, TK1 and TOP2A, respectively. The red and blue arrows indicate dichotomizing of tumour samples into two final IHC categories with high and low staining. For BIRC5 combined score: low = 0–2, high = 3–6; for TK combined score: low = 0–3, high = 4–6, for TOP2A distribution score: low = 0–2, high = 3–5.
Supplementary Figure S5 Association between cytoplasmic BIRC5, TK1 and TOP2A protein expression and patient survival. The Kaplan Meier plots show disease‐specific survival as a function of high (red lines) and low (blue lines) IHC staining levels. P‐values for five‐year survival are shown (Breslow test).
Acknowledgement
We are grateful for the financial support by the Faculty of Medicine, University of Oslo [to R.A.L. financing M.H. as PhD student]; the Norwegian Cancer Society [to R.A.L.]; and the Swedish Childhood Cancer Foundation [to F.M.].
Supplementary data 1.
1.1.
Supplementary data related to this article can be found at http://dx.doi.org/10.1016/j.molonc.2015.02.005.
Kolberg Matthias, Høland Maren, Lind Guro E., Ågesen Trude H., Skotheim Rolf I., Sundby Hall Kirsten, Mandahl Nils, Smeland Sigbjørn, Mertens Fredrik, Davidson Ben, Lothe Ragnhild A., (2015), Protein expression of BIRC5, TK1, and TOP2A in malignant peripheral nerve sheath tumours – A prognostic test after surgical resection, Molecular Oncology, 9, doi: 10.1016/j.molonc.2015.02.005.
References
- Alaggio, R. , Turrini, R. , Boldrin, D. , Merlo, A. , Gambini, C. , Ferrari, A. , Dall'Igna, P. , Coffin, C.M. , Martines, A. , Bonaldi, L. , De Salvo, G.L. , Zanovello, P. , Rosato, A. , 2013. Survivin expression and prognostic significance in pediatric malignant peripheral nerve sheath tumors (MPNST). Plos. One 8, e80456 [DOI] [PMC free article] [PubMed] [Google Scholar]
- Aufderklamm, S. , Todenhofer, T. , Gakis, G. , Kruck, S. , Hennenlotter, J. , Stenzl, A. , Schwentner, C. , 2012. Thymidine kinase and cancer monitoring. Cancer Lett. 316, 6–10. [DOI] [PubMed] [Google Scholar]
- Berner, J.M. , Sørlie, T. , Mertens, F. , Henriksen, J. , Sæter, G. , Mandahl, N. , Brogger, A. , Myklebost, O. , Lothe, R.A. , 1999. Chromosome band 9p21 is frequently altered in malignant peripheral nerve sheath tumors: studies of CDKN2A and other genes of the pRB pathway. Genes Chromosomes Cancer 26, 151–160. [PubMed] [Google Scholar]
- Bottillo, I. , Ahlquist, T. , Brekke, H. , Danielsen, S.A. , van den Berg, E. , Mertens, F. , Lothe, R.A. , Dallapiccola, B. , 2009. Germline and somatic NF1 mutations in sporadic and NF1-associated malignant peripheral nerve sheath tumours. J. Pathol. 217, 693–701. [DOI] [PubMed] [Google Scholar]
- Brekke, H.R. , Kolberg, M. , Skotheim, R.I. , Hall, K.S. , Bjerkehagen, B. , Risberg, B. , Domanski, H.A. , Mandahl, N. , Liestol, K. , Smeland, S. , Danielsen, H.E. , Mertens, F. , Lothe, R.A. , 2009. Identification of p53 as a strong predictor of survival for patients with malignant peripheral nerve sheath tumors. Neuro. Oncol. 11, 514–528. [DOI] [PMC free article] [PubMed] [Google Scholar]
- Brekke, H.R. , Ribeiro, F.R. , Kolberg, M. , Agesen, T.H. , Lind, G.E. , Eknaes, M. , Hall, K.S. , Bjerkehagen, B. , van den Berg, E. , Teixeira, M.R. , Mandahl, N. , Smeland, S. , Mertens, F. , Skotheim, R.I. , Lothe, R.A. , 2010. Genomic changes in chromosomes 10, 16, and X in malignant peripheral nerve sheath tumors identify a high-risk patient group. J. Clin. Oncol. 28, 1573–1582. [DOI] [PubMed] [Google Scholar]
- Carroll, S.L. , 2012. Molecular mechanisms promoting the pathogenesis of Schwann cell neoplasms. Acta Neuropathol. 123, 321–348. [DOI] [PMC free article] [PubMed] [Google Scholar]
- Cichowski, K. , Shih, T.S. , Schmitt, E. , Santiago, S. , Reilly, K. , McLaughlin, M.E. , Bronson, R.T. , Jacks, T. , 1999. Mouse models of tumor development in neurofibromatosis type 1. Science 286, 2172–2176. [DOI] [PubMed] [Google Scholar]
- De Raedt, T. , Beert, E. , Pasmant, E. , Luscan, A. , Brems, H. , Ortonne, N. , Helin, K. , Hornick, J.L. , Mautner, V. , Kehrer-Sawatzki, H. , Clapp, W. , Bradner, J. , Vidaud, M. , Upadhyaya, M. , Legius, E. , Cichowski, K. , 2014. PRC2 loss amplifies Ras-driven transcription and confers sensitivity to BRD4-based therapies. Nature 514, 247–251. [DOI] [PubMed] [Google Scholar]
- Du, X. , Yang, J. , Ylipaa, A. , Zhu, Z. , 2013. Genomic amplification and high expression of EGFR are key targetable oncogenic events in malignant peripheral nerve sheath tumor. J. Hematol. Oncol. 6, 93 [DOI] [PMC free article] [PubMed] [Google Scholar] [Retracted]
- Fletcher, C.D. , Dal Cin, P. , De Wever, I. , Mandahl, N. , Mertens, F. , Mitelman, F. , Rosai, J. , Rydholm, A. , Sciot, R. , Tallini, G. , van den Berghe, H. , Vanni, R. , Willen, H. , 1999. Correlation between clinicopathological features and karyotype in spindle cell sarcomas. A report of 130 cases from the CHAMP study group. Am. J. Pathol. 154, 1841–1847. [DOI] [PMC free article] [PubMed] [Google Scholar]
- Ghadimi, M.P. , Young, E.D. , Belousov, R. , Zhang, Y. , Lopez, G. , Lusby, K. , Kivlin, C. , Demicco, E.G. , Creighton, C.J. , Lazar, A.J. , Pollock, R.E. , Lev, D. , 2012. Survivin is a viable target for the treatment of malignant peripheral nerve sheath tumors. Clin. Cancer Res. 18, 2545–2557. [DOI] [PMC free article] [PubMed] [Google Scholar]
- Holtkamp, N. , Malzer, E. , Zietsch, J. , Okuducu, A.F. , Mucha, J. , Mawrin, C. , Mautner, V.F. , Schildhaus, H.U. , von Deimling, A. , 2008. EGFR and erbB2 in malignant peripheral nerve sheath tumors and implications for targeted therapy. Neuro Oncol. 10, 946–957. [DOI] [PMC free article] [PubMed] [Google Scholar]
- Holtkamp, N. , Reuss, D.E. , Atallah, I. , Kuban, R.J. , Hartmann, C. , Mautner, V.F. , Frahm, S. , Friedrich, R.E. , Algermissen, B. , Pham, V.A. , Prietz, S. , Rosenbaum, T. , Estevez-Schwarz, L. , von Deimling, A. , 2004. Subclassification of nerve sheath tumors by gene expression profiling. Brain Pathol. 14, 258–264. [DOI] [PMC free article] [PubMed] [Google Scholar]
- Huang, d.W. , Sherman, B.T. , Lempicki, R.A. , 2009. Bioinformatics enrichment tools: paths toward the comprehensive functional analysis of large gene lists. Nucleic Acids Res. 37, 1–13. [DOI] [PMC free article] [PubMed] [Google Scholar]
- Karube, K. , Nabeshima, K. , Ishiguro, M. , Harada, M. , Iwasaki, H. , 2006. cDNA microarray analysis of cancer associated gene expression profiles in malignant peripheral nerve sheath tumours. J. Clin. Pathol. 59, 160–165. [DOI] [PMC free article] [PubMed] [Google Scholar]
- Katz, D. , Lazar, A. , Lev, D. , 2009. Malignant peripheral nerve sheath tumour (MPNST): the clinical implications of cellular signalling pathways. Expert Rev. Mol. Med. 11, e30 [DOI] [PubMed] [Google Scholar]
- Keizman, D. , Issakov, J. , Meller, I. , Meimon, N. , Ish-Shalom, M. , Sher, O. , Merimsky, O. , 2009. Expression and significance of EGFR in malignant peripheral nerve sheath tumor. J. Neurooncol. 94, 383–388. [DOI] [PubMed] [Google Scholar]
- Kinebuchi, Y. , Noguchi, W. , Igawa, Y. , Nishizawa, O. , 2005. Recurrent retroperitoneal malignant nerve sheath tumor associated with neurofibromatosis type 1 responding to carboplatin and etoposide combined chemotherapy. Int. J. Clin. Oncol. 10, 353–356. [DOI] [PubMed] [Google Scholar]
- Koga, T. , Iwasaki, H. , Ishiguro, M. , Matsuzaki, A. , Kikuchi, M. , 2002. Frequent genomic imbalances in chromosomes 17, 19, and 22q in peripheral nerve sheath tumours detected by comparative genomic hybridization analysis. J. Pathol. 197, 98–107. [DOI] [PubMed] [Google Scholar]
- Koga, T. , Iwasaki, H. , Ishiguro, M. , Matsuzaki, A. , Kikuchi, M. , 2002. Losses in chromosomes 17, 19, and 22q in neurofibromatosis type 1 and sporadic neurofibromas: a comparative genomic hybridization analysis. Cancer Genet. Cytogenet. 136, 113–120. [DOI] [PubMed] [Google Scholar]
- Kolberg, M. , Høland, M. , Ågesen, T.H. , Brekke, H.R. , Liestøl, K. , Hall, K.S. , Mertens, F. , Picci, P. , Smeland, S. , Lothe, R.A. , 2013. Survival meta-analyses for >1800 malignant peripheral nerve sheath tumor patients with and without neurofibromatosis type 1. Neuro. Oncol. 15, 135–147. [DOI] [PMC free article] [PubMed] [Google Scholar]
- Kresse, S.H. , Skarn, M. , Ohnstad, H.O. , Namlos, H.M. , Bjerkehagen, B. , Myklebost, O. , Meza-Zepeda, L.A. , 2008. DNA copy number changes in high-grade malignant peripheral nerve sheath tumors by array CGH. Mol. Cancer 7, 48 [DOI] [PMC free article] [PubMed] [Google Scholar]
- Lee, W. , Teckie, S. , Wiesner, T. , Ran, L.L. , Granada, C.N.P. , Lin, M.Y. , Zhu, S.N. , Cao, Z. , Liang, Y.P. , Sboner, A. , Tap, W.D. , Fletcher, J.A. , Huberman, K.H. , Qin, L.X. , Viale, A. , Singer, S. , Zheng, D.Y. , Berger, M.F. , Chen, Y. , Antonescu, C.R. , Chi, P. , 2014. PRC2 is recurrently inactivated through EED or SUZ12 loss in malignant peripheral nerve sheath tumors. Nat. Genet. 46, 1227–1232. [DOI] [PMC free article] [PubMed] [Google Scholar]
- Legius, E. , Marchuk, D.A. , Collins, F.S. , Glover, T.W. , 1993. Somatic deletion of the neurofibromatosis type 1 gene in a neurofibrosarcoma supports a tumour suppressor gene hypothesis. Nat. Genet. 3, 122–126. [DOI] [PubMed] [Google Scholar]
- Levy, P. , Ripoche, H. , Laurendeau, I. , Lazar, V. , Ortonne, N. , Parfait, B. , Leroy, K. , Wechsler, J. , Salmon, I. , Wolkenstein, P. , Dessen, P. , Vidaud, M. , Vidaud, D. , Bieche, I. , 2007. Microarray-based identification of tenascin C and tenascin XB, genes possibly involved in tumorigenesis associated with neurofibromatosis type 1. Clin. Cancer Res. 13, 398–407. [DOI] [PubMed] [Google Scholar]
- Levy, P. , Vidaud, D. , Leroy, K. , Laurendeau, I. , Wechsler, J. , Bolasco, G. , Parfait, B. , Wolkenstein, P. , Vidaud, M. , Bieche, I. , 2004. Molecular profiling of malignant peripheral nerve sheath tumors associated with neurofibromatosis type 1, based on large-scale real-time RT-PCR. Mol. Cancer 3, 20 [DOI] [PMC free article] [PubMed] [Google Scholar]
- Lothe, R.A. , Karhu, R. , Mandahl, N. , Mertens, F. , Sæter, G. , Heim, S. , Børresen-Dale, A.L. , Kallioniemi, O.P. , 1996. Gain of 17q24-qter detected by comparative genomic hybridization in malignant tumors from patients with von Recklinghausen's neurofibromatosis. Cancer Res. 56, 4778–4781. [PubMed] [Google Scholar]
- Lothe, R.A. , Smith-Sørensen, B. , Hektoen, M. , Stenwig, A.E. , Mandahl, N. , Saeter, G. , Mertens, F. , 2001. Biallelic inactivation of TP53 rarely contributes to the development of malignant peripheral nerve sheath tumors. Genes Chromosomes Cancer 30, 202–206. [PubMed] [Google Scholar]
- Lothe, R.A. , Slettan, A. , Saeter, G. , Brogger, A. , Børresen, A.L. , Nesland, J.M. , 1995. Alterations at chromosome 17 loci in peripheral nerve sheath tumors. J. Neuropathol. Exp. Neurol. 54, 65–73. [DOI] [PubMed] [Google Scholar]
- Menon, A.G. , Anderson, K.M. , Riccardi, V.M. , Chung, R.Y. , Whaley, J.M. , Yandell, D.W. , Farmer, G.E. , Freiman, R.N. , Lee, J.K. , Li, F.P. , 1990. Chromosome 17p deletions and p53 gene mutations associated with the formation of malignant neurofibrosarcomas in von Recklinghausen neurofibromatosis. Proc. Natl. Acad. Sci. U. S. A 87, 5435–5439. [DOI] [PMC free article] [PubMed] [Google Scholar]
- Mertens, F. , Dal Cin, P. , De Wever, I. , Fletcher, C.D. , Mandahl, N. , Mitelman, F. , Rosai, J. , Rydholm, A. , Sciot, R. , Tallini, G. , van den Berghe, H. , Vanni, R. , Willen, H. , 2000. Cytogenetic characterization of peripheral nerve sheath tumours: a report of the CHAMP study group. J. Pathol. 190, 31–38. [DOI] [PubMed] [Google Scholar]
- Miller, S.J. , Rangwala, F. , Williams, J. , Ackerman, P. , Kong, S. , Jegga, A.G. , Kaiser, S. , Aronow, B.J. , Frahm, S. , Kluwe, L. , Mautner, V. , Upadhyaya, M. , Muir, D. , Wallace, M. , Hagen, J. , Quelle, D.E. , Watson, M.A. , Perry, A. , Gutmann, D.H. , Ratner, N. , 2006. Large-scale molecular comparison of human schwann cells to malignant peripheral nerve sheath tumor cell lines and tissues. Cancer Res. 66, 2584–2591. [DOI] [PubMed] [Google Scholar]
- Nielsen, G.P. , Stemmer-Rachamimov, A.O. , Ino, Y. , Moller, M.B. , Rosenberg, A.E. , Louis, D.N. , 1999. Malignant transformation of neurofibromas in neurofibromatosis 1 is associated with CDKN2A/p16 inactivation. Am. J. Pathol. 155, 1879–1884. [DOI] [PMC free article] [PubMed] [Google Scholar]
- Nielsen, G. , Antonescu, C.R. , Lothe, R.A. , 2013. Malignant peripheral nerve sheath tumour. In Fletcher C.D.M., Bridge J.A., Hogendoorn P.C.W., Mertens F.(Eds.), WHO Classification of Tumours of Soft Tissue and Bone International Agency for Research on Cancer; Lyon, France: 187–189. [Google Scholar]
- Nigro, J.M. , Baker, S.J. , Preisinger, A.C. , Jessup, J.M. , Hostetter, R. , Cleary, K. , Bigner, S.H. , Davidson, N. , Baylin, S. , Devilee, P. , 1989. Mutations in the p53 gene occur in diverse human tumour types. Nature 342, 705–708. [DOI] [PubMed] [Google Scholar]
- Oliveira, G. , Greco, R. , Lupo-Stanghellini, M.T. , Vago, L. , Bonini, C. , 2012. Use of TK-cells in haploidentical hematopoietic stem cell transplantation. Curr. Opin. Hematol. 19, 427–433. [DOI] [PubMed] [Google Scholar]
- Packer, R.J. , Raffel, C. , Villablanca, J.G. , Tonn, J.C. , Burdach, S.E. , Burger, K. , LaFond, D. , McComb, J.G. , Cogen, P.H. , Vezina, G. , Kapcala, L.P. , 2000. Treatment of progressive or recurrent pediatric malignant supratentorial brain tumors with herpes simplex virus thymidine kinase gene vector-producer cells followed by intravenous ganciclovir administration. J. Neurosurg. 92, 249–254. [DOI] [PubMed] [Google Scholar]
- Patel, A.V. , Eaves, D. , Jessen, W.J. , Rizvi, T.A. , Ecsedy, J.A. , Qian, M.G. , Aronow, B.J. , Perentesis, J.P. , Serra, E. , Cripe, T.P. , Miller, S.J. , Ratner, N. , 2012. Ras-driven transcriptome analysis identifies aurora kinase A as a potential malignant peripheral nerve sheath tumor therapeutic target. Clin. Cancer Res. 18, 5020–5030. [DOI] [PMC free article] [PubMed] [Google Scholar]
- Peacock, J.D. , Cherba, D. , Kampfschulte, K. , Smith, M.K. , Monks, N.R. , Webb, C.P. , Steensma, M. , 2013. Molecular-guided therapy predictions reveal drug resistance phenotypes and treatment alternatives in malignant peripheral nerve sheath tumors. J. Transl. Med. 11, 213 [DOI] [PMC free article] [PubMed] [Google Scholar]
- Rahrmann, E.P. , Moriarity, B.S. , Otto, G.M. , Watson, A.L. , Choi, K. , Collins, M.H. , Wallace, M. , Webber, B.R. , Forster, C.L. , Rizzardi, A.E. , Schmechel, S.C. , Ratner, N. , Largaespada, D.A. , 2014. Trp53 haploinsufficiency modifies EGFR-driven peripheral nerve sheath tumorigenesis. Am. J. Pathol. 184, 2082–2098. [DOI] [PMC free article] [PubMed] [Google Scholar]
- Rahrmann, E.P. , Watson, A.L. , Keng, V.W. , Choi, K. , Moriarity, B.S. , Beckmann, D.A. , Wolf, N.K. , Sarver, A. , Collins, M.H. , Moertel, C.L. , Wallace, M.R. , Gel, B. , Serra, E. , Ratner, N. , Largaespada, D.A. , 2013. Forward genetic screen for malignant peripheral nerve sheath tumor formation identifies new genes and pathways driving tumorigenesis. Nat. Genet. 45, 756–766. [DOI] [PMC free article] [PubMed] [Google Scholar]
- Ryan, B.M. , O'Donovan, N. , Duffy, M.J. , 2009. Survivin: a new target for anti-cancer therapy. Cancer Treat. Rev. 35, 553–562. [DOI] [PubMed] [Google Scholar]
- Sasaki, T. , Lopes, M.B. , Hankins, G.R. , Helm, G.A. , 2002. Expression of survivin, an inhibitor of apoptosis protein, in tumors of the nervous system. Acta Neuropathol. 104, 105–109. [DOI] [PubMed] [Google Scholar]
- Schmidt, H. , Taubert, H. , Meye, A. , Wurl, P. , Bache, M. , Bartel, F. , Holzhausen, H.J. , Hinze, R. , 2000. Gains in chromosomes 7, 8q, 15q and 17q are characteristic changes in malignant but not in benign peripheral nerve sheath tumors from patients with Recklinghausen's disease. Cancer Lett. 155, 181–190. [DOI] [PubMed] [Google Scholar]
- Schmidt, H. , Wurl, P. , Taubert, H. , Meye, A. , Bache, M. , Holzhausen, H.J. , Hinze, R. , 1999. Genomic imbalances of 7p and 17q in malignant peripheral nerve sheath tumors are clinically relevant. Genes Chromosomes Cancer 25, 205–211. [PubMed] [Google Scholar]
- Sedani, A. , Cooper, D.N. , Upadhyaya, M. , 2012. An emerging role for microRNAs in NF1 tumorigenesis. Hum. Genomics 6, 23 [DOI] [PMC free article] [PubMed] [Google Scholar]
- Sioud, M. , Sæbøe-Larssen, S. , Hetland, T.E. , Kærn, J. , Mobergslien, A. , Kvalheim, G. , 2013. Silencing of indoleamine 2,3-dioxygenase enhances dendritic cell immunogenicity and antitumour immunity in cancer patients. Int. J. Oncol. 43, 280–288. [DOI] [PubMed] [Google Scholar]
- Skotheim, R.I. , Kallioniemi, A. , Bjerkhagen, B. , Mertens, F. , Brekke, H.R. , Monni, O. , Mousses, S. , Mandahl, N. , Soeter, G. , Nesland, J.M. , Smeland, S. , Kallioniemi, O.P. , Lothe, R.A. , 2003. Topoisomerase-II alpha is upregulated in malignant peripheral nerve sheath tumors and associated with clinical outcome. J. Clin. Oncol. 21, 4586–4591. [DOI] [PubMed] [Google Scholar]
- Steins, M.B. , Serve, H. , Zuhlsdorf, M. , Senninger, N. , Semik, M. , Berdel, W.E. , 2002. Carboplatin/etoposide induces remission of metastasised malignant peripheral nerve tumours (malignant schwannoma) refractory to first-line therapy. Oncol. Rep. 9, 627–630. [PubMed] [Google Scholar]
- Storlazzi, C.T. , Brekke, H.R. , Mandahl, N. , Brosjo, O. , Smeland, S. , Lothe, R.A. , Mertens, F. , 2006. Identification of a novel amplicon at distal 17q containing the BIRC5/SURVIVIN gene in malignant peripheral nerve sheath tumours. J. Pathol. 209, 492–500. [DOI] [PubMed] [Google Scholar]
- Tabone-Eglinger, S. , Bahleda, R. , Cote, J.F. , Terrier, P. , Vidaud, D. , Cayre, A. , Beauchet, A. , Theou-Anton, N. , Terrier-Lacombe, M.J. , Lemoine, A. , Penault-Llorca, F. , Le Cesne, A. , Emile, J.F. , 2008. Frequent EGFR positivity and overexpression in high-grade areas of human MPNSTs. Sarcoma 2008, (849156) 849156 [DOI] [PMC free article] [PubMed] [Google Scholar]
- Verdijk, R.M. , den Bakker, M.A. , Dubbink, H.J. , Hop, W.C. , Dinjens, W.N. , Kros, J.M. , 2010. TP53 mutation analysis of malignant peripheral nerve sheath tumors. J. Neuropathol. Exp. Neurol. 69, 16–26. [DOI] [PubMed] [Google Scholar]
- Vogel, K.S. , Klesse, L.J. , Velasco-Miguel, S. , Meyers, K. , Rushing, E.J. , Parada, L.F. , 1999. Mouse tumor model for neurofibromatosis type 1. Science 286, 2176–2179. [DOI] [PMC free article] [PubMed] [Google Scholar]
- Watson, M.A. , Perry, A. , Tihan, T. , Prayson, R.A. , Guha, A. , Bridge, J. , Ferner, R. , Gutmann, D.H. , 2004. Gene expression profiling reveals unique molecular subtypes of neurofibromatosis type I-associated and sporadic malignant peripheral nerve sheath tumors. Brain Pathol. 14, 297–303. [DOI] [PMC free article] [PubMed] [Google Scholar]
- Wu, J. , Patmore, D.M. , Jousma, E. , Eaves, D.W. , Breving, K. , Patel, A.V. , Schwartz, E.B. , Fuchs, J.R. , Cripe, T.P. , Stemmer-Rachamimov, A.O. , Ratner, N. , 2014. EGFR-STAT3 signaling promotes formation of malignant peripheral nerve sheath tumors. Oncogene 33, 173–180. [DOI] [PMC free article] [PubMed] [Google Scholar]
- Xie, C. , Yao, M. , Dong, Q. , 2014. Proliferating cell unclear antigen-associated factor (PAF15): a novel oncogene. Int. J. Biochem. Cell. Biol. 50, 127–131. [DOI] [PubMed] [Google Scholar]
- Yang, J. , Ylipaa, A. , Sun, Y. , Zheng, H. , Chen, K. , Nykter, M. , Trent, J. , Ratner, N. , Lev, D.C. , Zhang, W. , 2011. Genomic and molecular characterization of malignant peripheral nerve sheath tumor identifies the IGF1R pathway as a primary target for treatment. Clin. Cancer Res. 17, 7563–7573. [DOI] [PMC free article] [PubMed] [Google Scholar]
- Yu, J. , Deshmukh, H. , Payton, J.E. , Dunham, C. , Scheithauer, B.W. , Tihan, T. , Prayson, R.A. , Guha, A. , Bridge, J.A. , Ferner, R.E. , Lindberg, G.M. , Gutmann, R.J. , Emnett, R.J. , Salavaggione, L. , Gutmann, D.H. , Nagarajan, R. , Watson, M.A. , Perry, A. , 2011. Array-based comparative genomic hybridization identifies CDK4 and FOXM1 alterations as independent predictors of survival in malignant peripheral nerve sheath tumor. Clin. Cancer Res. 17, 1924–1934. [DOI] [PubMed] [Google Scholar]
- Zhang, M. , Wang, Y.X. , Jones, S. , Sausen, M. , McMahon, K. , Sharma, R. , Wang, Q. , Belzberg, A.J. , Chaichana, K. , Gallia, G.L. , Gokaslan, Z.L. , Riggins, G.J. , Wolinksy, J.P. , Wood, L.D. , Montgomery, E.A. , Hruban, R.H. , Kinzler, K.W. , Papadopoulos, N. , Vogelstein, B. , Bettegowda, C. , 2014. Somatic mutations of SUZ12 in malignant peripheral nerve sheath tumors. Nat. Genet. 46, 1170–1172. [DOI] [PMC free article] [PubMed] [Google Scholar]
- Zhu, Y. , Parada, L.F. , 2002. The molecular and genetic basis of neurological tumours. Nat. Rev. Cancer 2, 616–626. [DOI] [PubMed] [Google Scholar]
- Zou, C. , Smith, K.D. , Liu, J. , Lahat, G. , Myers, S. , Wang, W.L. , Zhang, W. , McCutcheon, I.E. , Slopis, J.M. , Lazar, A.J. , Pollock, R.E. , Lev, D. , 2009. Clinical, pathological, and molecular variables predictive of malignant peripheral nerve sheath tumor outcome. Ann. Surg. 249, 1014–1022. [DOI] [PubMed] [Google Scholar]
Associated Data
This section collects any data citations, data availability statements, or supplementary materials included in this article.
Supplementary Materials
The following are the supplementary data related to this article:
Supplementary data
Supplementary Figure S1 Validation of antibodies. The specificity of each antibody was tested by Western blots of protein extracts from different cancer cell lines, including two MPNST cell lines (left lanes). β‐Actin was used as positive control (Antibody A5316 Sigma–Aldrich, St. Louis, MO, USA).
Supplementary Figure S2 Association between gene expression and survival for five genes encoded on chromosomal arm 17q. The Kaplan Meier plots show disease‐specific survival for MPNST patients as a function of gene expression levels above (red lines) or below (blue lines) the median for BIRC5 (A), CDC6 (B), NME1 (C), PRR11 (D), TK1 (E), and TOP2A (F). BIRC5 and TK1 are represented by two different oligonucleotide probes, indicated by solid lines Probe#1 and dashed lines for Probe#2. P‐values for five‐year survival are shown (Breslow test).
Supplementary Figure S3 Correlation between gene expression and protein expression. Comparison of the IHC staining for TOP2A (A), BIRC5 (B), and TK1 (C) expression levels of the corresponding genes. For BIRC5 and TK1, two different oligonucleotide probes were present on the gene expression array (Probe#1 in blue, Probe#2 in green). P‐values from Mann–Whitney U test.
Supplementary Figure S4 The Kaplan Meier plots show disease‐specific survival as a function of distribution score (A, B, C) and intensity score (D, E, F), as well as combined score (sum of the above) (G,H,I) for the three proteins BIRC5, TK1 and TOP2A, respectively. The red and blue arrows indicate dichotomizing of tumour samples into two final IHC categories with high and low staining. For BIRC5 combined score: low = 0–2, high = 3–6; for TK combined score: low = 0–3, high = 4–6, for TOP2A distribution score: low = 0–2, high = 3–5.
Supplementary Figure S5 Association between cytoplasmic BIRC5, TK1 and TOP2A protein expression and patient survival. The Kaplan Meier plots show disease‐specific survival as a function of high (red lines) and low (blue lines) IHC staining levels. P‐values for five‐year survival are shown (Breslow test).