

Abstract
Current standard treatments for metastatic colorectal cancer (CRC) are based on combination regimens with one of the two chemotherapeutic drugs, irinotecan or oxaliplatin. However, drug resistance frequently limits the clinical efficacy of these therapies. In order to gain new insights into mechanisms associated with chemoresistance, and departing from three distinct CRC cell models, we generated a panel of human colorectal cancer cell lines with acquired resistance to either oxaliplatin or irinotecan. We characterized the resistant cell line variants with regards to their drug resistance profile and transcriptome, and matched our results with datasets generated from relevant clinical material to derive putative resistance biomarkers. We found that the chemoresistant cell line variants had distinctive irinotecan‐ or oxaliplatin‐specific resistance profiles, with non‐reciprocal cross‐resistance. Furthermore, we could identify several new, as well as some previously described, drug resistance‐associated genes for each resistant cell line variant. Each chemoresistant cell line variant acquired a unique set of changes that may represent distinct functional subtypes of chemotherapy resistance. In addition, and given the potential implications for selection of subsequent treatment, we also performed an exploratory analysis, in relevant patient cohorts, of the predictive value of each of the specific genes identified in our cellular models.
Keywords: Colorectal cancer, Oxaliplatin, Irinotecan, Resistance, Cell line models
Highlights
We generated CRC cell lines with acquired resistance to either oxaliplatin or irinotecan.
We characterized the drug resistance profile of these lines.
We performed a transcriptome‐level analysis of these lines.
Identified putative markers were investigated in clinical cohorts.
Abbreviations
- CR
complete response
- CRC
colorectal cancer
- ECM
extracellular matrix
- EMT
epithelial–mesenchymal transition
- FC
fold-change
- 5FU
5-fluorouracil
- OS
overall survival
- PR
partial response
- RFS
relapse free survival
- RR
relative resistance
- MSI
microsatellite instability
- MSS
microsatellite stable
1. Introduction
Chemotherapeutic treatment of metastatic colorectal cancer (CRC) is generally based on the anti‐metabolite drug 5‐fluorouracil (5FU) combined with either the DNA‐binding agent oxaliplatin (e.g. FOLFOX regimen) or the topoisomerase I inhibitor irinotecan (e.g. FOLFIRI regimen). Notwithstanding the efficacy of these combination regimens, which have significantly increased the response rate and survival of metastatic CRC patients (Cunningham et al., 2010; Gallagher and Kemeny, 2010), only 30–50% of patients show an objective response to either of the combination therapies and progression of the cancer is a common outcome (Gallagher and Kemeny, 2010; Goldberg et al., 2004). Thus, resistance to chemotherapeutic drugs is a major clinical problem in the treatment of mCRC. In this regard, it is noteworthy that there is a partial, but clinically significant, lack of cross‐resistance between the oxaliplatin‐ and irinotecan‐based treatment regimens (Tournigand et al., 2004), meaning that mCRC patients may benefit from an oxaliplatin‐based regimen after progression from an irinotecan‐based treatment regimen, and conversely. Together, these observations indicate that the two regimens are not equivalent, but rather that their efficacy differs for each individual patient. Accordingly, biomarkers that can identify those patients that will (or not) gain benefit from oxaliplatin‐based, or from irinotecan‐based, regimens, respectively, will be expected to make a substantial impact on clinical management of CRC. Drug resistance may be either pre‐existent (intrinsic resistance), or induced by drug exposure (acquired resistance); profiling of intrinsic resistance biomarkers in combination with early identification of acquired resistance biomarkers is expected to allow for better selection of cancer therapy for the individual patient, and thereby improved clinical management of the disease. To optimize existent, as well as develop new therapeutic regimens, a deeper understanding of the underlying resistance mechanisms to chemotherapeutic drugs is needed. Oxaliplatin works by formation of DNA adducts, causing DNA lesions and interfering with DNA replication (Koopman et al., 2009; Walther et al., 2009). Resistance mechanisms reported for oxaliplatin and other platinum‐based compounds include increased nucleotide excision repair of the DNA lesions (mediated by e.g. ERCC1) and altered levels of detoxifying anti‐oxidants such as glutathione and metallothioneins (Jensen et al., 2012; Rabik and Dolan, 2007). Irinotecan, a camptothecin analog, is converted in the liver or in tumor cells by carboxylesterases to its active metabolite, SN‐38, which acts by binding to and stabilizing the DNA‐topoisomerase I complexes formed to unwind the DNA during replication, leading to DNA damage and apoptosis (Hsiang and Liu, 1988; Koopman et al., 2009; Pommier, 2009). Resistance mechanisms reported for the camptothecins include increased SN‐38‐glucuronidation (inactivation) mediated by UDP‐glucuronosyltransferases (i.e. UGT1As), increased repair of SN‐38‐induced DNA damage (e.g. TDP1), as well as increased cellular drug efflux mediated by ATP‐binding cassette transporters (i.e. ABCB1, ‐C1, ‐C2, ‐C4 and ‐G2) (Beretta et al., 2006; Jensen et al., 2012; Rasheed and Rubin, 2003). With this plethora of potential molecular resistance mechanisms, it is not surprising that no single gene or gene product aberration has been demonstrated to be solely responsible for resistance to a particular chemotherapeutic drug. On the other hand, we would anticipate that cancer cells, by any means, only have a limited number of ways to counteract the deleterious effect(s) of chemotherapeutic drugs. If our anticipation is correct, one major corollary of it would be that recurrent cancers, such as recurrent mCRC, will consist of a defined number of resistance subtypes each utilizing a particular resistance mechanism against a given drug.
In addition to the common clinicopathological variables: TNM stage, differentiation, and nerve/vessel invasion, primary CRC tumors are often further subclassified according to the three molecular pathways that are known to be associated with this disease: chromosomal instability (CIN), microsatellite instability (MSI) and the CpG island methylator phenotype (CIMP) (Lao and Grady, 2011; Simons et al., 2013). More recently, based on mRNA expression patterns, primary CRC tumors have been divided into additional subclasses, with each subclass presenting a distinct prognostic profile (Budinska et al., 2013; Perez‐Villamil et al., 2012; Sadanandam et al., 2013). However, no attempts have been made so far to sub‐classify recurrent, drug‐resistant, CRC into subtypes representing different resistance mechanisms with implications for choice of subsequent therapy. In order to gain more insight into the mechanisms of drug resistance, and work towards the identification of recurrent mCRC functional subtypes based on their specific, intrinsic or acquired, drug resistance mechanism(s), we generated, and characterized, six different colon cancer cell lines with acquired resistance to chemotherapeutic drugs that are currently used for the treatment of mCRC, specifically, oxaliplatin or irinotecan (represented by the active metabolite SN‐38). We describe here the analysis of these resistant cell lines, and our preliminary validation of some of the findings in a clinical setting.
2. Materials and methods
2.1. Cell culturing and assays, and generation of resistant variants
The cell lines HCT116 and HT29 were obtained from the NCI/Development Therapeutics Program, while LoVo was obtained from the American Tissue Culture Collection. Oxaliplatin (Eloxatin, 5 mg/ml, Sanofi‐Aventis, Paris, France) was stored at 4 °C protected from light. Ko143 (3‐((3S,6S,12aS)‐6‐Isobutyl‐9‐methoxy‐1,4‐dioxo‐1,2,3,4,6,7,12,12a‐octahydro‐pyrazino[19,29:1,6]pyrido[3,4‐b]indol‐3‐yl)‐propionic acid tert‐butyl ester) and SN‐38 (Sigma–Aldrich, Copenhagen, Denmark) were dissolved in dimethyl sulfoxide (DMSO) and stored at −20 °C. Drugs were diluted in growth medium at appropriate concentrations immediately prior to use. Cell culturing procedures and assays followed standard methods and are detailed in the appropriate methods section.
Oxaliplatin or SN‐38 resistant cell line variants were generated in our laboratory by continuous exposure to gradually increasing drug concentrations over a period of 8–10 months (details are shown in Table 1). The cell lines were passaged three times at each drug concentration and cell vials were frozen at each increase in drug concentration. Prior to subsequent experiments, the cells were maintained in drug‐free growth medium for at least one week. The cell line identities of parental and resistant cell lines were confirmed using short tandem repeat DNA analysis (IdentiCell – Cell Line Authentication Service, Aarhus University Hospital, Aarhus, Denmark). In addition, all cell lines were recurrently tested, and determined to be mycoplasma‐free (Mycoplasma PCR Detection Kit, Minerva Biolabs, Berlin, Germany).
Table 1.
Generation of cell lines with acquired resistance to oxaliplatin or SN‐38.
| Cell line | Druga | Initial drug concentration | Final drug concentration | Drug exposure (passages) | Drug exposure (days) |
|---|---|---|---|---|---|
| HCT116‐OxPt | Oxaliplatin | 0.01 μM | 20 μM | 41 | 241 |
| HT29‐OxPt | Oxaliplatin | 0.1 μM | 10 μM | 47 | 289 |
| LoVo‐OxPt | Oxaliplatin | 0.01 μM | 10 μM | 47 | 265 |
| HCT116‐SN38 | SN‐38 | 0.1 nM | 80 nM | 57 | 284 |
| HT29‐SN38 | SN‐38 | 1 nM | 50 nM | 46 | 289 |
| LoVo‐SN38 | SN‐38 | 0.1 nM | 50 nM | 44 | 267 |
SN‐38 is the active metabolite of irinotecan.
For growth analysis, cells were seeded in 6‐well plates (no drugs added), and manually counted at 24 h intervals for six days. Growth medium was changed three days after seeding. Doubling time (in hours) in the exponential growth phase was calculated using the formula: Doubling time = h * ln(2)/ln(c2/c1), where c1 and c2 are the cell numbers at the beginning and end of the exponential growth phase, and h is the time (in hours) between c1 and c2. The experiment was performed three times and the mean doubling time ± standard deviation was determined. Doubling time comparison between cell lines was done using unpaired Student's t‐test (p < 0.05 considered significant).
2.2. Drug sensitivity analysis and MTT assay
In vitro drug sensitivity was determined using a standard MTT (methylthiazolyldiphenyl‐tetrazolium bromide) assay (Sigma–Aldrich) according to manufacturer's instructions. Briefly, cells were seeded in 96‐well plates, and a range of drug concentrations was added the following day. In the case of Ko143 inhibition assays, cells were cultured in the presence of inhibitor and/or SN‐38. Following 48 h of drug exposure, the medium was discarded and the plates were incubated with medium containing MTT (0.5 mg/ml, Sigma–Aldrich) for 3 h. Acidified (0.02 M HCl) sodium dodecyl sulphate (20%, Sigma–Aldrich) was added to dissolve the formed formazan. Optical density at 570 nm (and 670 nm for background) was measured, and the cell viability was calculated in percent compared to untreated cells. Experiments were repeated at least three times and the mean IC50‐value ± standard deviation was determined using Graphpad Prism. Relative resistance for each resistant cell line was calculated by dividing the mean IC50‐value of the resistant cell line by the mean IC50‐value of the corresponding parental cell line.
2.3. RNA purification and labeling
To ensure that only persistent changes would be detected cells were cultured in drug‐free medium for two weeks prior to RNA isolation. RNA was purified from each cell line in independent triplicates (three different passages). Following a wash with cold PBS, TRIzol Reagent (Invitrogen) was added and the cells were lysed on ice. The lysate was frozen at −80 °C for later purification of RNA. RNA was purified according to the manufacturer's instructions with minor modifications (centrifugation for 4500 × g, with centrifugation times of 20 min for the phase separation and 15 min for the RNA precipitation). RNA concentration was determined using a Nano‐Drop ND‐1000 (Thermo Scientific, Waltham, USA), and quality of the RNA was assessed (and found to be of high quality) using a Bioanalyzer 2100 (Agilent Technologies, Santa Clara, USA). Total RNA was separately converted into cDNA through reverse transcription, and thereafter transcribed with T7 RNA Polymerase. Labeled cRNA was coupled to a Cyanine 3‐CTP fluorescent dye using the One‐Color Microarray‐Based Gene Expression Analysis, Low Input Quick Amp Labeling (version 6.5 protocol) (Agilent Technologies) according to manufacturer's instructions. Cy3‐labeled cRNA was hybridized to Agilent Human Gene Expression Microarrays (G4112F) and scanned using an Agilent DNA Microarray scanner (Agilent Technologies).
2.4. mRNA microarray analysis, data processing and statistical analysis
All microarray data processing and analysis was done according to standard methods and publicly available software. Thus, mRNA microarray data processing was performed in R (www.r‐project.org) using the Bioconductor bioinformatics software package (www.bioconductor.org). Data (gProcessedSignals) were loaded into R using the Limma package (Smyth, 2005) and normalized between arrays using quantile normalization (Bolstad et al., 2003). Probes were collapsed taking the median and expression values were log2 transformed. Alterations in expression of each mRNA between parental and resistant cell lines were analyzed using unpaired Student's t‐tests. P‐values were adjusted for multiple testing using the Benjamini–Hochberg method (Benjamini and Hochberg, 1995). Transcripts were considered significantly deregulated if the adjusted p‐value was <0.05 and the fold‐change was >2 or <−2 (log2 fold change >1 or <−1). Venn‐diagrams were constructed based on output from the online VENNY tool (Oliveros, 2007).
2.5. Gene enrichment analysis
Selected deregulated genes were classified manually to gene ontology classes (Ashburner et al., 2000) (biological process, molecular function or protein class) using information from the DAVID Bioinformatics Database (Huang et al., 2009, 2009) and the PANTHER Classification System (Thomas et al., 2003). Enriched gene ontology clusters and pathways in the lists of significantly deregulated (Benjamini‐Hochberg adjusted p‐values < 0.05) transcripts were identified using the DAVID Functional Annotation Clustering tool (Huang et al., 2009, 2009). Highly redundant, tissue specific or very broad (e.g. “cellular process”) functional annotations clusters or pathways were excluded. A heatmap was made, using the MultiExperiment Viewer v4.8 software (Saeed et al., 2006), showing the relative expression (log2 fold change) of significantly deregulated transcripts belonging to selected gene ontology classes. The transcripts displayed either belonged to a specific gene ontology class according to the PANTHER Classification System (Thomas et al., 2003) or to a previously published epithelial–mesenchymal transition (EMT) signature (Huang et al., 2012).
2.6. Clinical validation in two patient cohorts
For assessment of the putative markers identified for irinotecan and oxaliplatin resistance, we used gene expression data from two independent cohorts. One dataset was from samples collected from a small cohort of 26 metastatic CRC patients treated with oxaliplatin and 5FU (Qvortrup et al., 2010; Rasmussen et al., 2013). The second dataset was from stage II and III colon cancer patients who were enrolled in the PETACC‐3 (Pan‐European Trails in Alimentary Tract Cancers) prospective randomized study (NLM Identifier NCT00026273) (Popovici et al., 2013; Roth et al., 2010; van Cutsem et al., 2009). Both cohorts are described in detail below.
2.6.1. Cohort I
For substantiation of putative markers for oxaliplatin resistance, we examined our gene list from the oxaliplatin resistant cell lines with gene expression profiles of samples collected from a cohort of 26 un‐protocolled patients who responded, or not, to oxaliplatin and 5FU (XELOX or FOLFOX regimens) as first‐line treatment of metastatic CRC (Qvortrup et al., 2010; Rasmussen et al., 2013). Patients were divided into two groups according to the RECIST 1.1 criteria, responders (n = 17), which included ‘Complete Response’ (CR; n = 7) or ‘Partial Response’ (PR; n = 10) as best response, and non‐responders (n = 9), with best response being ‘Stable Disease’ (SD; n = 7) or ‘Progressive Disease’ (PD; n = 2). The cohort was biased since the responder group was specifically enriched for CR cases and the non‐responder group only included patients showing progression‐free survival (PFS) below 8 months, but since we were evaluating the potential value of predictive factors to oxaliplatin this was deemed reasonable. Written informed consent was obtained from all patients, according to local ethical regulations.
2.6.2. Cohort II
Gene expression data was obtained from colon cancer patients who were previously enrolled in the PETACC‐3 prospective randomized study (van Cutsem et al., 2009). This study enrolled 3278 patients and was designed to assess if the addition of irinotecan to standard 5FU/leucovorin treatment in the adjuvant setting of stage II and III colon cancer patients would improve disease free survival (DFS), relapse free survival (RFS) and overall survival (OS). The study failed to demonstrate any significant benefit of the addition of irinotecan, and contributed to the decision to not recommend this drug for adjuvant therapy of stage II and III colon cancer, which only leaves 5FU/leucovorin and oxaliplatin as recommended options for this indication (National Comprehensive Cancer, 2013). All patients in the PETACC‐3 study signed a written informed consent that included permission for future translational research on routinely collected biological samples. RNA was successfully extracted from 895 formalin fixed paraffin embedded tumor samples and gene expression profiles were established using the Almac Colorectal Cancer DSA platform (Almac, Craigavon, United Kingdom) (Popovici et al., 2012). For the final analyses, ABCG2 gene expression data were available from a total of 688 stage II and III samples (gene expression data are available from ArrayExpress database, under the accession number E‐MTAB‐990). Data pre‐processing and normalization is described elsewhere (Popovici et al., 2012). For the present statistical analyses only data from patients with stage III disease was included which reduced the sample size to 580. For the statistical survival analysis only RFS and OS were used as end‐points and the definition followed the original study. RFS was defined as time from randomization until the occurrence of local, regional, or distant relapse; a second primary colon cancer; or death, and OS was defined as time from randomization until death by any cause. In all cases, the statistical significance level was set at 0.05.
3. Results
3.1. Generation and phenotypic characterization of parental and drug resistant cells
Three human colon cancer cell lines (HCT116, HT29 and LoVo), each representing a different presentation of CRC ‐ HCT116 (MSI, TP53 proficient, K‐Ras mutated), LoVo (derived from metastatic site; MSI, TP53 proficient, K‐Ras mutated), and HT29 (MSS, TP53 mutated, K‐Ras wild‐type) ‐ were subjected to gradually increasing drug concentrations for a period of 8–10 months (Table 1 and Materials and Methods section). To assess the acquired drug resistant phenotype of the emergent cell line variants, drug sensitivities towards oxaliplatin and SN‐38 were measured for each of the parental and drug resistant cell lines (Figure 1A), and IC50‐values and relative resistances were determined for each case (Table 2). For oxaliplatin, resistant cell line variants were between 13 and 107 times more resistant to the drug, depending on cell line of origin (Table 2, Oxaliplatin RR). Similarly, for SN‐38, resistant cell line variants were between 20 and 67 times more resistant to the drug, depending on cell line of origin (Table 2, SN‐38 RR). Cross‐resistance between oxaliplatin and SN‐38 was limited or non‐existing (Figure 1A and Table 2). The resistant phenotype appeared to be stable, as resistant cells displayed comparable IC50 and relative resistance values when cultured in drug‐free medium for up to five weeks (data not shown).
Figure 1.
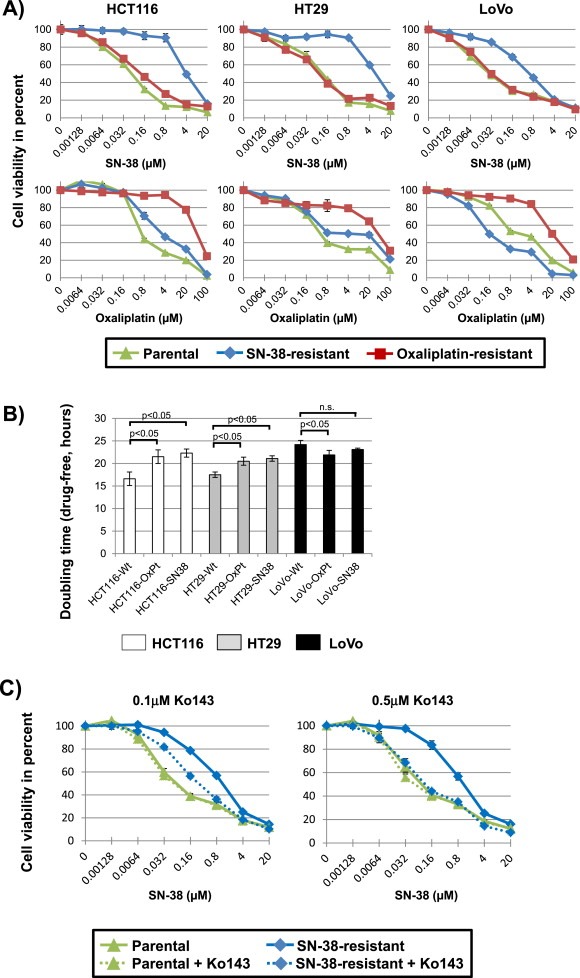
(A) Drug sensitivity towards SN‐38 and oxaliplatin for the parental and drug resistant cell lines. Cells were exposed to a range of drug concentrations for 48 h and cell viability was assessed by an endpoint MTT assay. Results of representative experiments are shown. Green (triangle) is the parental cell line, blue (diamond) the SN‐38 resistant cell line, and red (square) the oxaliplatin resistant cell line. (B) Cell growth doubling times for cell lines. White is HCT116, grey is HT29 and black is LoVo. The doubling time experiments were performed in drug‐free growth medium. The mean doubling time ± standard deviation of three independent experiments is shown. P‐values stating significant differences in doubling times are shown. (C) Drug sensitivity towards SN‐38 for the LoVo parental and SN‐38‐drug resistant cell lines cultured in the presence, or not, of 0.1 μM or 0.5 μM, respectively, of the ABCG2 inhibitor, Ko143. Cells were exposed to a range of SN‐38 drug concentrations for 48 h and cell viability was assessed by an endpoint MTT assay. Green (triangle) is the parental cell line, blue (diamond) the SN‐38 resistant cell line, with solid lines depicting the results from cells cultured in the absence of Ko143 and stippled lines the results from cells exposed to Ko143.
Table 2.
Drug sensitivity IC50‐values and relative resistances for drug resistant cell lines.
| Cell line | SN‐38, IC50‐value (μM) | SN‐38, RR | Oxaliplatin, IC50‐value (μM) | Oxaliplatin, RR |
|---|---|---|---|---|
| HCT116‐Wt | 0.050 ± 0.01 | 1 | 0.60 ± 0.05 | 1 |
| HCT116‐OxPt | 0.096 ± 0.02 | 1.9 | 46 ± 4.5 | 76 |
| HCT116‐SN38 | 3.4 ± 0.55 | 67 | 2.9 ± 0.32 | 5 |
| HT29‐Wt | 0.13 ± 0.06 | 1 | 0.46 ± 0.06 | 1 |
| HT29‐OxPt | 0.099 ± 0.02 | 0.7 | 50 ± 17 | 107 |
| HT29‐SN38 | 7.3 ± 1.7 | 55 | 9.6 ± 11 | 21 |
| LoVo‐Wt | 0.022 ± 0.004 | 1 | 1.1 ± 0.8 | 1 |
| LoVo‐OxPt | 0.022 ± 0.01 | 1.0 | 15 ± 4.4 | 13 |
| LoVo‐SN38 | 0.44 ± 0.16 | 20 | 0.16 ± 0.01 | 0.1 |
Mean IC50‐value ± standard deviation of at least three independent experiments. RR; relative resistance is the IC50‐value of the resistant cell line divided by the IC50‐value of the parental (wild‐type, Wt) cell line.
Given that previous studies have shown that acquired drug resistance, particularly in the case of prolonged drug exposure, can be due to increased doubling time, which in turn could have a profound impact on cancer cell sensitivity to antitumor agents (Petitprez et al., 2013), we compared the growth rates of our parental and drug resistant cell line variants in drug‐free growth medium (Figure 1B). We found changes in doubling time that were cell line dependent, but drug‐independent. Oxaliplatin and SN‐38 resistant HCT116‐derived cell lines (hereafter referred to as HCT116‐OxPt and HCT116‐SN38, respectively) and oxaliplatin and SN‐38 resistant HT29‐derived cell lines (hereafter referred to as HT29‐OxPt and HT29‐SN38, respectively) all grew at a significantly slower rate than their respective parental cells (p < 0.05). Oxaliplatin resistant LoVo‐derived cells (hereafter referred to as LoVo‐OxPt) grew slightly faster (p < 0.05) than the parental LoVo, while there was no significant difference between SN‐38 resistant LoVo‐derived cells (hereafter referred to as LoVo‐SN38) and the corresponding parental cells.
3.2. mRNA profiling of drug resistant cells and identification of the most highly deregulated transcripts
To identify the alterations underlying the drug resistance phenotype for each of the chemoresistant cell lines variants, we performed genome‐wide mRNA expression profiling of the parental and resistant cell lines using microarray analysis (full gene expression dataset provided as Supplementary Data; Supplementary Data File 1). Given the stability of the resistance phenotype, we did genome‐wide gene expression analysis on cells cultured in the absence of drug. Principal component analysis (Supplementary Figure S1) showed that parental and corresponding resistant cell lines clustered together, which indicates that the changes associated with acquisition of the drug resistance phenotype did not alter the global gene expression profile of cells to such an extent that they could be considered as a singular entity in its own right, rather than an isogenic cell line variant. The mRNA profiles were compared, and significantly deregulated transcripts were identified for each resistant cell line variant relative to matched parental cell line dataset (full results provided as Supplementary Data; Supplementary Data File 2). The ten most highly up‐ or down‐regulated transcripts in each of the resistant cell lines were identified and are presented in Supplementary Tables S1 and S2.
To determine if the mechanism(s) of resistance developed by each cell line to SN‐38 or oxaliplatin, respectively, were common to all cell lines or varied from cell line to cell line and with a particular drug, we compared the identity of the deregulated transcripts across the resistant cell lines (Figure 2A), using the mRNA profiles shown in Supplementary Data File 2. Most deregulated transcripts were only identified in one of the resistant cell lines. However, 18 transcripts were common in two of the SN‐38 resistant cell lines, while this was the case for five transcripts in two of the oxaliplatin resistant cell lines (Table 3).
Figure 2.
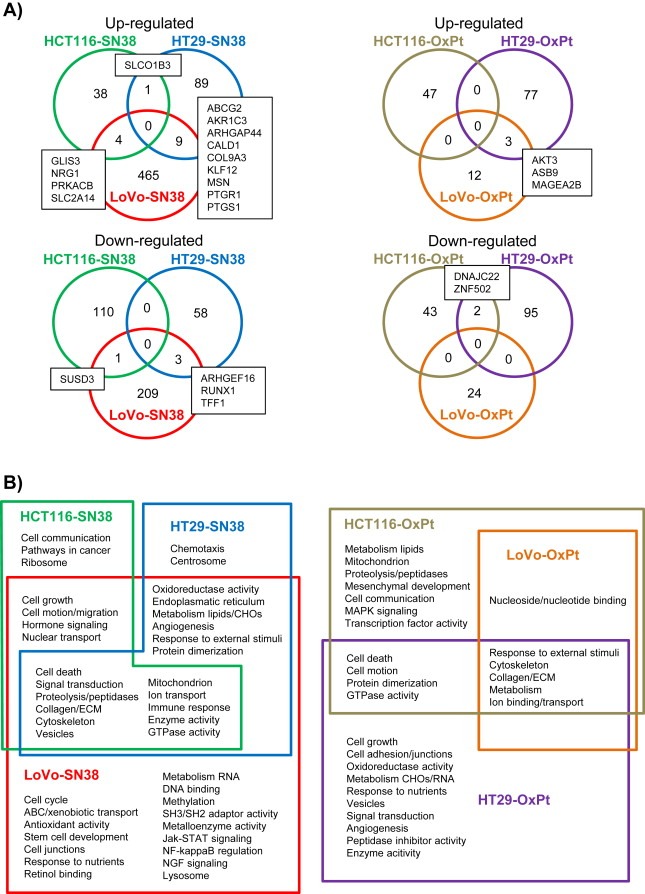
Comparison of deregulated transcripts and gene enrichment analysis in SN‐38 and oxaliplatin resistant cell lines. (A) Venn‐diagram comparison of either up‐ or down‐regulated transcripts across the three SN‐38 resistant and three oxaliplatin resistant cell lines. The numbers are the numbers of significantly deregulated (log2 fold change >1 or <−1, adjusted p‐value <0.05) transcripts, while the gene symbols in boxes are the transcripts overlapping in the Venn‐diagram. (B) Gene enrichment analysis of deregulated transcripts in the drug resistant cell lines. Shown are significant functional annotation clusters and pathways significantly enriched in the SN‐38 or oxaliplatin resistant cell lines. Some clusters and pathways are shared between cell lines as shown by the Venn diagrams.
Table 3.
List of transcripts which are deregulated in more than one SN‐38 or oxaliplatin resistant cell lines.
| Gene symbol | Entrez gene ID | Gene name | FC | Gene ontology | HCT116 | HT29 | LoVo |
|---|---|---|---|---|---|---|---|
| SN‐38 resistant cell lines, upregulated: | |||||||
| AKR1C3 | 8644 | aldo‐keto reductase family 1, member C3 | 44 | oxidoreductase | x | x | |
| ABCG2 | 9429 | ATP‐binding cassette, sub‐family G (WHITE), member 2 | 43 | transporter | x | x | |
| KLF12 | 11278 | Kruppel‐like factor 12 | 6 | transcription factor | x | x | |
| CALD1 | 800 | caldesmon 1 | 6 | mitosis/cytoskeleton | x | x | |
| PTGR1 | 22949 | prostaglandin reductase 1 | 6 | metabolism | x | x | |
| ARHGAP44 | 9912 | Rho GTPase activating protein 44 | 6 | signaling | x | x | |
| MSN | 4478 | Moesin | 4 | cytoskeleton | x | x | |
| GLIS3 | 169792 | GLIS family zinc finger 3 | 4 | transcription factor | x | x | |
| PTGS1 | 5742 | prostaglandin‐endoperoxide synthase 1 (prostaglandin G/H synthase and cyclooxygenase) | 3 | immune system | x | x | |
| NRG1 | 3084 | neuregulin 1 | 3 | growth factor | x | x | |
| COL9A3 | 1299 | collagen, type IX, alpha 3 | 3 | ECM structure | x | x | |
| PRKACB | 5567 | protein kinase, cAMP‐dependent, catalytic, beta | 3 | mitosis/protein phosphorylation | x | x | |
| SLC2A14 | 144195 | solute carrier family 2 (facilitated glucose transporter), member 14 | 3 | transporter | x | x | |
| SLCO1B3 | 28234 | solute carrier organic anion transporter family, member 1B3 | 2 | transporter | x | x | |
| SN‐38 resistant cell lines, downregulated: | |||||||
| TFF1 | 7031 | trefoil factor 1 | −5 | immune system | x | x | |
| SUSD3 | 203328 | sushi domain containing 3 | −5 | complement activation | x | x | |
| RUNX1 | 861 | runt‐related transcription factor 1 | −2 | transcription factor | x | x | |
| ARHGEF16 | 27237 | Rho guanine nucleotide exchange factor (GEF) 16 | −2 | unclassified | x | x | |
| Oxaliplatin resistant cell lines, upregulated: | |||||||
| MAGEA2B | 266740 | melanoma antigen family A, 2B | 5 | apoptosis | x | x | |
| AKT3 | 10000 | v‐akt murine thymoma viral oncogene homolog 3 (protein kinase B, gamma) | 4 | cell cycle/apoptosis | x | x | |
| ASB9 | 140462 | ankyrin repeat and SOCS box containing 9 | 3 | unclassified | x | x | |
| Oxaliplatin resistant cell lines, downregulated: | |||||||
| ZNF502 | 91392 | zinc finger protein 502 | −3 | transcription factor | x | x | |
| DNAJC22 | 79962 | DnaJ (Hsp40) homolog, subfamily C, member 22 | −3 | immune system | x | x | |
The fold‐change (FC) of each transcript is the average fold‐change in the cell lines where it was significantly deregulated (marked with crosses). Transcripts without Entrez Gene ID annotation are not included. ECM; extracellular matrix.
3.3. Gene ontology and pathway enrichment analysis of drug resistant cells
Having assessed the expression changes that took place at the single transcript level, we performed a gene enrichment analysis, including gene ontology and pathways, to identify the overall biological changes that occurred in the resistant cell lines. A number of significantly enriched gene clusters were identified, and identified clusters were compared between cell lines and are presented using Venn‐diagrams (Figure 2B). Common for HCT116‐SN38, HT29‐SN38 and LoVo‐SN38 cells were clusters related to cell death, signal transduction, cytoskeleton, and proteolysis, while clusters such as cell growth, cell motion and oxidoreductase activity were enriched in two of the cell lines, HCT116‐SN38 and LoVo‐SN38. Other clusters, for example ABC transporters, cell cycle, pathways in cancer, and stem cell development were only enriched in one of the cell line variants, HCT116‐SN38, HT29‐SN38 or LoVo‐SN38, respectively (Figure 2B). Common for HCT116‐OxPt, HT29‐OxPt and LoVo‐OxPt cells were clusters related to cytoskeleton and metabolism, while clusters such as cell death and cell motion were enriched in two cell lines, HCT116‐OxPt and HT29‐OxPt. Many clusters, such as cell growth, cell adhesion and MAPK signaling were only enriched in one of the three oxaliplatin resistant cell lines, HCT116‐OxPt, HT29‐OxPt or LoVo‐OxPt, respectively.
To compare and visualize the expression profiles of the different cell lines, several of the identified gene clusters were selected, based on their identification in several resistant cell lines or the likelihood of their involvement in drug resistance (e.g. ABC‐transporters, cell cycle), and a heatmap showing the expression of the significantly deregulated transcripts belonging to each cluster was made (Figure 3). In addition, significantly deregulated transcripts belonging to a published signature of genes known to be either up‐ or downregulated during EMT (Huang et al., 2012), a process previously reported to be associated with chemoresistance (Fan et al., 2012; Hoshino et al., 2009; Hwang et al., 2011; Yang et al., 2006), was seen.
Figure 3.
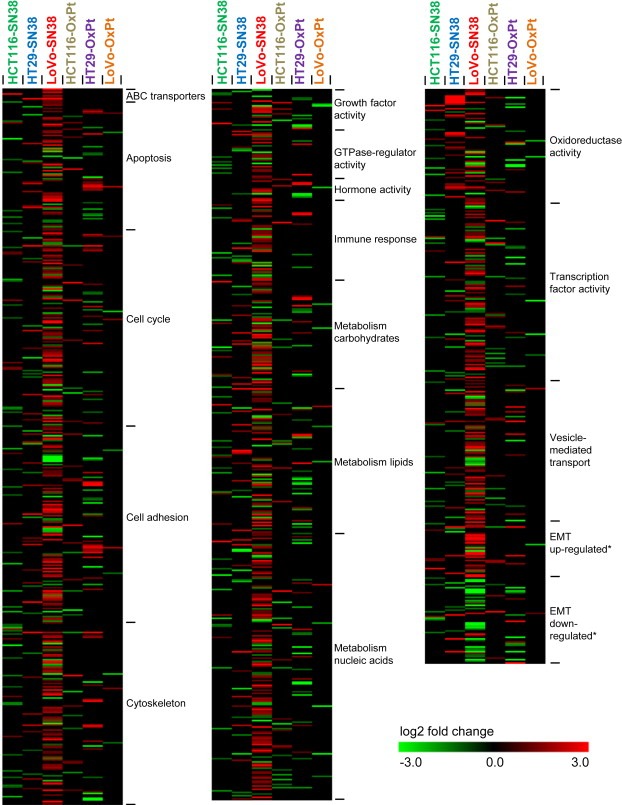
Heatmap showing the relative expression of genes in the SN‐38 and oxaliplatin resistant cell lines. The expression values are log2 fold changes comparing corresponding resistant and parental cell lines. The groups (e.g. “ABC transporters”) were selected based on the gene ontology analysis, and includes all genes, belonging to that particular group, which were significantly deregulated (log2 fold change >1 or <−1, adjusted p‐value <0.05) in one or more resistant cell lines. Black represents no change in expression. Within each gene class, the genes are listed alphabetically. *The epithelial–mesenchymal transition (EMT)” signature was obtained from (Huang et al., 2012).
3.4. Clinical validation
To gage the clinical relevance of the putative resistance‐associated genes we identified, we did a preliminary evaluation in patient samples of the predictive value of the hits we found in our model systems. Accordingly, we investigated if the top ten most up‐ and down‐regulated genes we found in each of the three oxaliplatin‐resistant cell line variants (Supplementary Table S2), were significantly deregulated in a cohort of 26 patients who responded (responder group; R), or not (non‐responder group; NR), to oxaliplatin and 5FU (XELOX or FOLFOX regimens) as first‐line treatment of metastatic CRC. Four‐KRT23, QPRT, KRT6B, and TGFB2‐ out of the 60 genes examined in this manner, were significantly differentially expressed (p < 0.05) in the non‐responder group compared to the responder group (Table 4). We mirrored this analysis this time looking at the deregulated genes we found in each of the three irinotecan‐resistant cell line variants (Supplementary Table S2), using gene expression data obtained from the PETACC‐3 study. A set of 580 stage III colon cancer samples from the PETACC‐3 clinical trial, for which gene expression data was available, were used to assess differential gene expression for the top ten most up‐ and down‐regulated genes in the irinotecan‐resistant cell line variants. Patients were dichotomized according to the median RFS, and expression of each of the genes was compared between the two groups, low RFS (RFS < median RFS), and high RFS (RFS > median RFS). We found that expression of 12 out of the 60 genes examined, was significantly different between the low RFS group compared to high RFS group, respectively (Table 5).
Table 4.
Significantly differentially expressed genes in oxaliplatin non‐responder group compared to responder group.
| Gene symbol | Gene name | log2 FC (NR‐R) | P‐value |
|---|---|---|---|
| KRT23 | keratin 23 (histone deacetylase inducible) | −1.15 | 0.014 |
| QPRT | quinolinate phosphoribosyltransferase | −0.23 | 0.009 |
| KRT6B | keratin 6B | 0.51 | 0.019 |
| TGFB2 | transforming growth factor, beta 2 | 0.86 | 0.032 |
NR; non‐responders, R; responders.
Table 5.
Significantly differentially expressed genes in the low RFS group (<median RFS) compared to high RFS group (>median RFS) in the irinotecan containing‐ (FOLFIRI) arm of the PETACC‐3 study.
| Gene symbol | Gene name | log2 FC FOLFIRI | P‐value |
|---|---|---|---|
| SPARC | secreted protein, acidic, cysteine‐rich | ||
| probe ADXCRAD_BX381534_at | −0.35 | 0.014 | |
| probe ADXCRPD.7277.C1_s_at | −0.42 | 0.0057 | |
| INPP4B | inositol polyphosphate‐4‐phosphatase, type II | ||
| probe ADXCRPD.12698.C1_x_at | −0.16 | 0.0094 | |
| probe ADXCRSS.Hs#S3748650_at | −0.086 | 0.038 | |
| KLK10 | kallikrein‐related peptidase 10 | ||
| probe ADXCRPD.7217.C1_at | −0.21 | 0.023 | |
| WWC3 | WWC family member 3 | ||
| probe ADXCRAD_BP196630_s_at | −0.14 | 0.024 | |
| AKR1C1 | aldo‐keto reductase family 1, member C1 | ||
| probe ADXCRAD_CA453634_x_at | −0.34 | 0.0022 | |
| AKR1C3 | aldo‐keto reductase family 1, member C3 | ||
| probe ADXCRIH.3171.C1_x_at | −0.25 | 0.032 | |
| CST6 | cystatin E/M | ||
| probe ADXCRPD.16022.C1_at | −0.14 | 0.037 | |
| CMTM3 | CKLF‐like MARVEL transmembrane domain | ||
| containing 3 | |||
| probe ADXCRAG_BC036042_at | −0.32 | 0.018 | |
| SULF1 | sulfatase 1 | ||
| probe ADXCRPD.3036.C1_s_at | −0.20 | 0.032 | |
| probe ADXCRPD.7431.C1_at | −0.20 | 0.025 | |
| VIM | Vimentin | ||
| probe ADXCRAD_CX873552_s_at | −0.22 | 0.032 | |
| ADXCRIH.436.C1_at | −0.20 | 0.012 | |
| BTLN3 | butyrophilin‐like 3 | ||
| probe ADXCRSS.Hs#S4457662_at | 0.089 | 0.043 | |
| DLC1 | deleted in liver cancer 1 | ||
| probe ADXCRAG_NM_182643_s_at | −0.24 | 0.0064 |
Given that we had access to gene expression data from the PETACC‐3 study, a prospective randomized study with a irinotecan added to standard therapy vs standard therapy alone design, and, therefore, an excellent study to address the predictive value of any given biomarker for irinotecan treatment, we decided to perform a standard biomarker validation analysis for one selected hit from our set of deregulated genes. We elected to look at the ATP‐dependent drug efflux transporter ABCG2 (Table 3 and Supplementary Table S1), as we found expression of ABCG2 to be markedly up‐regulated in two out of the three SN‐38‐resistant cell lines (HT29 and Lovo SN‐38 resistant variants), and there are a number of lines of evidence linking expression of this gene to efficacy of irinotecan in CRC (Candeil et al., 2004; Silvestris et al., 2014; Zhou et al., 2005). In order to confirm the involvement of ABCG2 in the resistance phenotype, we performed inhibition experiments using the fumitremorgin‐type indolyl diketopiperazine Ko143, a highly potent and specific Abcg2 inhibitor (Allen et al., 2002; van Loevezijn et al., 2001). Addition of Ko143 dramatically lowered the resistance to SN38 in the ABCG2‐overexpressing Lovo SN‐38 resistant clone, whereas it had no effect on the parental cell line (Figure 1C). This effect was dose dependent, as inhibition of Abcg2 with 0.1 μM Ko143 showed only partial reversion of the resistance phenotype, whereas exposure of cells to 0.5 μM Ko143 completely reverted the resistance phenotype of the LoVo SN‐38 resistant cells (Figure 1C, compare panel 0.1 μM Ko143 with 0.5 μM Ko143).
To visualize a potential association between ABCG2 and irinotecan treatment, ABCG2 levels were measured in the PETACC‐3 patient study samples, dichotomized by the median value and Kaplan–Meier survival plots were generated. For the subgroup of patients treated with 5‐FU/leucovorin alone, no separation of the curves were demonstrated in relation to RFS (Figure 4A) and OS (Figure 4B) with p‐values of the log‐rank test of 0.69 and 0.76, respectively. In contrast, for the subgroup of patients treated with 5FU/leucovorin and irinotecan, the curves visually separated in relation to both RFS (Figure 4C) and OS (Figure 4D). The separation of the curves was not statistically significant with p‐values of the log‐rank test of 0.14 and 0.16, respectively. Although the analysis did not reach significance, these data suggest that ABCG2 levels below the median value might be associated with longer OS and RFS in patients treated with adjuvant irinotecan, as compared to ABCG2 levels above the median value. This trend could also be demonstrated in univariate Cox regression analysis with hazard ratios of 0.76 (95% CI: 0.52–1.10) and 0.74 (95% CI: 0.47–1.14) in relation to RFS and OS, respectively. For the subgroup of patients treated with 5FU/leucovorin and irinotecan the 5‐year RFS rate was 0.61 (95% CI: 0.53–0.69) for ABCG2 > the median and 0.67 (95% CI: 0.60–0.75) for ABCG2 ≤ the median, which translated into a relative increase of 10.3%. Likewise, the 5‐year OS rates were 0.71 (95% CI: 0.64–0.79) for ABCG2 > the median and 0.77 (95% CI: 0.71–0.87) for ABCG2 ≤ the median value translating into a relative increase of 8.6%. When analyzing results in subgroups defined by the ABCG2 status, the relative survival gain of additional irinotecan could be calculated. For all patients with tumors expressing ABCG2 ≤ the median, the relative gain in 5‐year RFS and OS of additional irinotecan was 5.6% and 5.7%, respectively. In contrast, for all patients with tumors expressing ABCG2 > the median value, the relative gain in 5‐year RFS of additional irinotecan was only 0.03% with a relative reduction in 5‐year OS of 4.7%, further strengthening the observation that benefit from additional irinotecan was mainly seen among patients with low ABCG2 levels. In short, although we saw a trend towards benefit of irinotecan being correlated with low ABCG2 expression levels, the analysis did not reach statistical significance.
Figure 4.
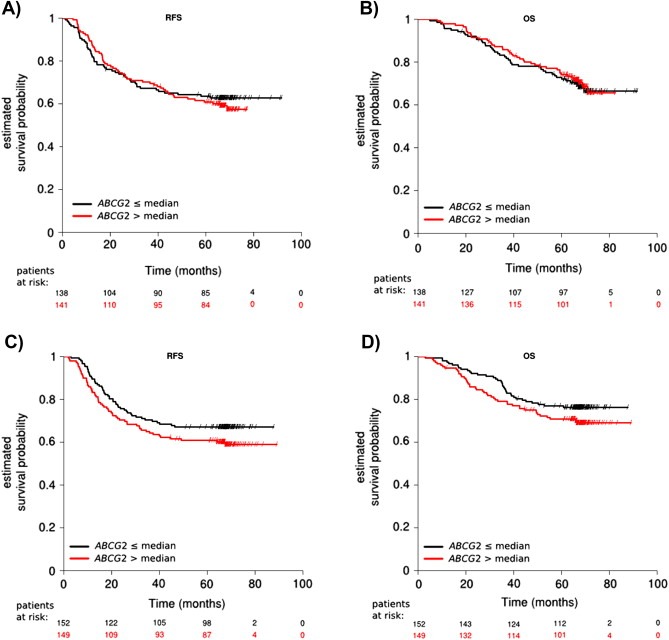
Survival differences for patients stratified by the intratumoral ABCG2 expression levels were assessed independently in the two treatment arms, i.e. 5FU/leucovorin (A and B) and 5FU/leucovorin + irinotecan (C and D). The ABCG2 expression levels where dichotomized by the median value and results were presented visually by Kaplan–Meier survival plots. P‐values were calculated using log‐rank statistics. No difference in RFS (p = 0.69) and OS (p = 0.76) was demonstrated for the 5FU/leucovorin treated patients, when stratifying by the median ABCG2 expression value (A and B). Although not significant, the curves separated for the 5FU/leucovorin + irinotecan treated patients in relation to both RFS (p = 0.14) and OS (p = 0.16) (C and D). This indicated that patients with low expression levels of ABCG2 showed a survival benefit when treated with additional irinotecan.
4. Discussion
In two seminal publications (Hanahan and Weinberg, 2000, 2011), Hanahan and Weinberg presented a conceptual framework to understand cellular malignancy. The hallmarks of cancer, proposed by these authors, presented an organizing principle to understand the complexity and variability reported in a myriad of research publications on multiple aspects of cancer. Conceptualizations such as the hallmarks of cancer provide principles that allow one to rationalize this otherwise excessively complex, detailed molecular information. A parallel can be drawn to the process of chemotherapy resistance. Although a very large number of molecular aberrations, and resistance associated mechanisms have been identified, we would expect that cancer cells by any means only have a limited number of ways to escape each particular class of chemotherapeutic drugs. Therefore, we hypothesized that, in a similar way to the hallmarks of cancer, organizing principles underlying chemotherapy resistance can be identified. To begin to address this, we generated three oxaliplatin resistant and three SN‐38 resistant colon cancer cell lines and characterized them. Importantly, cross‐resistance between oxaliplatin and SN‐38 was either non‐existing or limited, which should allow for identification of drug‐specific changes.
4.1. Gene expression changes of previously known resistance‐associated genes
The direct target of SN‐38 and other camptothecin drugs is the topoisomerase I protein (Pommier, 2009), the tumor cell level of which has been implicated in sensitivity to irinotecan in both preclinical in vitro studies (Burgess et al., 2008; Pfister et al., 2009) and in the large clinical randomized UK FOCUS study (Braun et al., 2008). However, our gene expression analysis of the three SN‐38 resistant cell lines did not identify any change in the TOP1 expression level. Drug efflux pumps ABCG2, ABCB1, and ABCC2 and ‐4 have previously been associated with camptothecin resistance (Beretta et al., 2006), and our study reiterated this effect, as we observed their up‐regulation in our SN‐38 resistant cell lines. In addition, we found several other ABC transporters to be up‐regulated (mostly in the LoVo‐SN38 cell line), while none was down‐regulated. Significant enrichment of the gene ontology cluster “ABC transporters” in LoVo‐SN38 supported this finding. Of the altered ABC transporters, ABCB4, ‐C8, and ‐G4 have not previously been associated to camptothecin resistance.
Oxaliplatin works by forming DNA lesions and interfering with replication (Rabik and Dolan, 2007). These lesions can be repaired by the nucleotide excision repair system (Zamble et al., 1996), however, we did not see any changes in expression of components of this system. Anti‐oxidants such as glutathione and the metallothioneins have been shown to detoxify platinum‐based compounds in cells (Rabik and Dolan, 2007), and several glutathione S‐transferase genes GSTA1, ‐M1, ‐P1 and ‐T1 have all recently been studied in relation to oxaliplatin resistance or toxicity (Funke et al., 2010; Lecomte et al., 2006; Mathieu et al., 2004). However, we found GSTT2 to be down‐regulated in the LoVo‐OxPt cell line, showing detoxification by anti‐oxidants is unlikely to a role in our system.
4.2. Identification of new resistance‐associated genes
To identify new drug resistance‐associated genes, we applied three strategies: Identifying the most highly deregulated transcripts in each cell line, identifying enriched gene ontology clusters or pathways in each cell line, and identifying transcripts or clusters/pathways deregulated in more than one resistant cell line. It should be noted that very few common alterations were identified in more than one cell line (18 for SN‐38, 5 for oxaliplatin), underscoring the notion that resistance mechanisms are complex and individualized. Gene ontology analysis showed that the identified genes belonged to classes (e.g. cell cycle, metabolism, transport and transcription factors) likely to play a role in drug resistance. The most striking finding among these genes might be the association between up‐regulation of the aldo‐keto reductase 1 family member AKR1C3 and resistance to SN‐38. This gene and members of the same family was strongly up‐regulated (up to 520 fold) in the HT29‐SN38 cell line, and the gene ontology class to which they belong (“oxidoreductase activity”) was strongly enriched in the same cell line. The members of this family are involved in steroid hormone processing and play a role in xenobiotic metabolism (Brozic et al., 2011; Penning and Byrns, 2009), and their up‐regulation has previously been associated with resistance to anthracyclines in vitro (Novotna et al., 2008; Veitch et al., 2009; Zhong et al., 2011), however, this is the first time they are associated with resistance to camptothecins. Other SN‐38 resistance‐associated genes were moesin (MSN), which has previously been implicated in cell survival (Fais et al., 2005; Wu et al., 2004), as well as two SLC transporters (SLC2A14 and SLCO1B3), however, none of these have previously been associated with camptothecin resistance. Another interesting finding is the association between MAGEA2B (melanoma antigen family A, 2B) and oxaliplatin resistance. The MAGE‐A family has previously been shown to promote cell survival and chemotherapy (etoposide, anthracycline) resistance through modulation of p53 (Monte et al., 2006; Suzuki et al., 2007), however, this is the first time it has been associated with oxaliplatin resistance. Furthermore, we identified ASB9 (ankyrin repeat and SOCS box containing 9) to be associated with oxaliplatin resistance. Several ankyrin‐related genes have previously been associated with chemotherapy resistance or apoptosis (Santoni and Farfariello, 2011; Scurr et al., 2008). AKT3 was also among our identified genes and has previously been implicated in cisplatin resistance (Gagnon et al., 2004).
4.3. Epithelial–mesenchymal transition in SN‐38 resistant cell line
EMT, a cellular process where epithelial features (e.g. E‐cadherin, encoded by CDH1) are lost and mesenchymal features (e.g. vimentin, VIM) are gained, has long been implicated in cancer metastasis and more recently in drug resistance (Singh and Settleman, 2010; Voulgari and Pintzas, 2009). In this study, we found that one SN‐38 resistant cell line, LoVo‐SN38, presented a broad gene expression profile alteration, resembling a previously published EMT signature (Huang et al., 2012). The mesenchymal marker vimentin was among the most up‐regulated (71 fold) transcripts in this cell line. At the same time, this cell line displayed up‐regulation of a number of drug efflux pumps, and a recent study indeed suggested that there might be a link between EMT and up‐regulation of ABC transporters (Saxena et al., 2011), thus warranting further investigation. Interestingly, even though they arise from the same parental LoVo cell line, the LoVo‐SN38 cell line displayed more than 10 times as many alterations as the LoVo‐OxPt cell line. This might be explained by the multitude of alterations associated with the EMT process.
4.4. Categorization of drug resistant CRC cell lines
From the results of this study it seems clear that each cell line appears to rely on an individual set of changes to become resistant. Even at the gene ontology analysis level the changes vary among cell lines. A good example of this is the class of “ABC drug transporters”. Enhanced drug export from cells due to the overexpression of ABC transporters is a well‐known mechanism that cancer cells use to counteract the cytotoxic effects of chemotherapeutic agents (Redmond et al., 2008). Although ABC transporters can counteract the effects of mechanistically unrelated chemotherapeutic agents, we found them to be deregulated in all three SN‐38 resistant cell lines, but not in the oxaliplatin resistant cell lines.
Based on our cell line results, we propose that resistant mCRC can be classified into functional resistance subtypes based on their gene expression aberrations. In this study these subtypes are represented by the individual resistant cell lines: HCT116‐SN38‐Drug efflux pump ABCC4, cell growth changes; HT29‐SN38‐Oxidoreductases (e.g. AKR1C1 and ‐3), drug efflux pump ABCG2; LoVo‐SN38‐Multiple drug efflux pumps, cell cycle, cell growth, stem cell‐like/EMT; HCT116‐OxPt‐Altered MAPK signaling, cell death‐related changes; HT29‐OxPt‐Cell growth and cell death‐related changes, cell adhesion; LoVo‐OxPt‐Few changes, nucleotide‐binding genes. We cannot determine if the subtypes we identified are simply a reflection of the differences in the cell models used ‐HCT116, HT29 and LoVo‐each representing a different presentation of CRC‐HCT116 (near diploid, MSI, TP53 proficient, K‐Ras mutated), HT29 (hypertriploid, MSS, TP53 mutated, K‐Ras wild‐type) and LoVo (derived from metastatic site; near diploid, MSI, TP53 proficient, K‐Ras mutated). In other words each cell line would model a patient, and a specific disease presentation, and that particular tumor would have only one resistance mechanism at its disposal. Several lines of evidence suggest this is not the case: Candeil and colleagues (Candeil et al., 2004) isolated two resistant clones from the HCT116 CRC cell line by progressive exposure to increasing concentrations of SN38. These clones were 6‐ and 53‐fold more resistant to SN38 than the HCT116‐derived sensitive clone, an effect directly mediated by overexpression of ABCG2. In addition, Johnston and colleagues (Boyer et al., 2004) reported an association between ABCG2 overexpression and resistance to oxaliplatin or CPT‐11 in a HCT116‐based model of resistance. We identified overexpression of ABCG2 in the HT29 and LoVo derived SN38‐resistant cell line variants but not in the HCT116‐derived cell line, or in any of the oxaliplatin‐resistant lines, arguing against the hypothesis that each cell line will be primed for one specific mechanism of resistance. One corollary of this observation is that one may infer multiple, non‐redundant, resistance mechanisms from a single cellular model. Another corollary is that development of model systems could be reiterative as multiple models can be developed from the same cellular system, necessitating the establishment of repositories of resistant cell clones to allow future comparative studies.
4.5. Validation in clinical material
To evaluate the potential clinical validity and utility of the putative resistance‐associated genes identified, we did a preliminary evaluation in patient samples. We found that four genes, KRT23, QPRT, KRT6B, and TGFB2, were significantly differentially expressed in groups of oxaliplatin non‐responders compared to responders (Table 4). Of note, KRT23 was previously shown to affect the DNA damage response of colon cancer cells (Birkenkamp‐Demtroder et al., 2013), and TGF‐β2 suppression is significantly associated with tumor recurrence and short DFS periods in CRC patients receiving adjuvant chemotherapy (Kim et al., 2009). Both observations are coherent with our findings, providing reasonable rational for further studies into the role of these genes with respect to resistance to oxaliplatin. An analogous analysis of the potential clinical validity and utility of the putative SN‐38 resistance‐associated genes that we identified, yielded 12 candidate genes of potential value (Table 5). Again, we found a number of deregulated genes, such as SPARC, a protein able to potentiate the effects of chemotherapy to promote tumor regression in colon cells (Tai et al., 2005), or KLK10, a protein associated with worse prognosis in CRC (Alexopoulou et al., 2013), which provide reasonable rational for further studies into the role of these genes with respect to resistance to irinotecan.
We also performed a targeted biomarker validation analysis, looking at ABCG2 gene expression in the PETACC‐3 clinical study. We chose this gene for a number of reasons: first, ABCG2 was considerably up‐regulated (second largest FC) in two out of the three SN‐38 resistant cell line variants we generated (Table 3). Second, ABCG2 protects cells from potentially toxic xenobiotics by effluxing these drugs out of the cell, thus lowering the intracellular concentration of substrate drugs, such as camptothecin‐derived topoisomerase inhibitors (e.g., topotecan and SN‐38), and anthracyclines (daunorubicin and doxorubicin) (Robey et al., 2010; Wu et al., 2011), thus providing a rationale for a causal role in resistance to SN‐38. Finally, although several studies have demonstrated that many human solid tumors express ABCG2, and frequently, this expression is correlated with adverse outcome [(Ross and Nakanishi, 2010) and references therein], a potential association between ABCG2 expression and predictive potential for substrate drugs has not been properly investigated; many studies have included drugs, such as cisplatin and paclitaxel, which are not known substrates for ABCG2, others could not address the true predictive value of ABCG2 due to study design issues. It should be noted in this respect that irinotecan and its active metabolite SN‐38 are known substrates for ABCG2 and its overexpression is directly involved in acquired resistance to SN‐38 in colon cancer cells (Candeil et al., 2004). Although our analysis showed only modest relative survival gains of adding irinotecan in patients expressing ABCG2 at levels lower than the median (relative gain in 5‐year RFS and OS of additional irinotecan was 5.6% and 5.7%, respectively), this was actually a rather encouraging trend. First, because we used a conservative cut‐point for our biomarker analysis, choosing the median ABCG2 expression level. Future exploratory analyses might reveal more significant cut‐points to be validated in independent studies. Second, our cell line data are based on expression data obtained from resistant cells whereas our preliminary clinical validation is based on data obtained from untreated primary tumors. A study of clinical CRC biopsy samples demonstrated almost a ten‐fold increase in ABCG2 expression in metastases obtained post‐irinotecan treatment compared to metastases obtained pre‐treatment (Candeil et al., 2004), indicating that ABCG2 expression in CRC is low prior to treatment, but increases following treatment with substrate drugs, such as irinotecan. As a result, we almost certainly underestimated the predictive value of ABCG2 in response to irinotecan. Analysis of data from The Cancer Genome Atlas project (TCGA), showed that ABCG2 was overexpressed in 13 out of the 195 CRC analyzed (Cancer Genome Atlas, 2012), corresponding to 7% of cases, which a priori may benefit from an oxaliplatin‐based regimen rather than from an irinotecan‐based treatment regimen. Third, based on our cell line findings, we anticipate that any predictive test will include an algorithm based on a panel of genes representing the different resistance subclasses, rather than depend on a single gene, and we are now actively pursuing this approach. Overall, by performing a preliminary validation in selected clinical material, we were able to achieve the first indication of a clinical relevance of our cellular model‐derived findings. However, it should be emphasized that the presented validation data should be interpreted with caution as it represents only the very first attempt at studying the clinical relevance of the cell line data. In fact, in spite of these observations of apparent clinical validity, at least for some of the deregulated genes we identified, in our cellular model systems, this type of analysis suffers from a number of limitations, such as cohort bias, or the classification of responsive patients, to mention a few, that limits its usefulness to being an exploratory, hypothesis‐generating analysis rather than an endpoint analysis.
In conclusion, the finding that each cell line seemingly displayed its own set of resistance‐related gene expression changes suggests that development of chemotherapy resistance may be dependent on acquisition of a set of discrete, functionally interconnected, molecular changes, by which a specific resistance profile would come about. This finding highlights the complexity of chemotherapy resistance in CRC, and led us to propose that drug‐resistant CRC can be categorized into discrete functional classes, with implications for the development and clinical validation of predictive biomarkers, which should be further addressed in appropriate clinical studies.
Disclosures
The authors have nothing to disclose.
Transcript profiling
Expression microarray data have been uploaded to GEO (Gene Expression Omnibus, NCBI) and are available under accession number GSE42387.
Supporting information
The following are the supplementary data related to this article:
Supplementary data
Supplementary data
Supplementary data
Supplementary data
Acknowledgements
This work was supported by the Danish Council for Strategic Research (09‐065177/DSF), the Danish Cancer Society (R72‐A‐4566‐B214 and R20‐A‐1087‐B214), the Willumsen Foundation, the Vigo and Kathrine Skovgaard Foundation, Sawmill‐owner Jeppe Juul and Wife Foundation, Director Ib Henriksens Foundation, the John and Birthe Meyer Foundation, and the IMK Foundation.
Supplementary data 1.
1.1.
Supplementary data related to this article can be found online at http://dx.doi.org/10.1016/j.molonc.2015.02.008.
Jensen Niels F., Stenvang Jan, Beck Mette K., Hanáková Barbora, Belling Kirstine C., Do Khoa N., Viuff Birgitte, Nygård Sune B., Gupta Ramneek, Rasmussen Mads H., Tarpgaard Line S., Hansen Tine P., Budinská Eva, Pfeiffer Per, Bosman Fred, Tejpar Sabine, Roth Arnaud, Delorenzi Mauro, Andersen Claus L., Rømer Maria U., Brünner Nils, Moreira José M.A., (2015), Establishment and characterization of models of chemotherapy resistance in colorectal cancer: Towards a predictive signature of chemoresistance, Molecular Oncology, 9, doi: 10.1016/j.molonc.2015.02.008.
References
- Alexopoulou, D.K. , Papadopoulos, I.N. , Scorilas, A. , 2013. Clinical significance of kallikrein-related peptidase (KLK10) mRNA expression in colorectal cancer. Clin. Biochem. 46, 1453–1461. [DOI] [PubMed] [Google Scholar]
- Allen, J.D. , van Loevezijn, A. , Lakhai, J.M. , van der Valk, M. , van Tellingen, O. , Reid, G. , Schellens, J.H. , Koomen, G.J. , Schinkel, A.H. , 2002. Potent and specific inhibition of the breast cancer resistance protein multidrug transporter in vitro and in mouse intestine by a novel analogue of fumitremorgin C. Mol. Cancer Ther. 1, 417–425. [PubMed] [Google Scholar]
- Ashburner, M. , Ball, C.A. , Blake, J.A. , Botstein, D. , Butler, H. , Cherry, J.M. , Davis, A.P. , Dolinski, K. , Dwight, S.S. , Eppig, J.T. , Harris, M.A. , Hill, D.P. , Issel-Tarver, L. , Kasarskis, A. , Lewis, S. , Matese, J.C. , Richardson, J.E. , Ringwald, M. , Rubin, G.M. , Sherlock, G. , Gene Ontology Consortium2000. Gene ontology: tool for the unification of biology. Nat. Genet. 25, 25–29. [DOI] [PMC free article] [PubMed] [Google Scholar]
- Benjamini, Y. , Hochberg, Y. , 1995. Controlling the false discovery rate: a practical and powerful approach to multiple testing. J. R. Statist. Soc. B 57, 289–300. [Google Scholar]
- Beretta, G.L. , Perego, P. , Zunino, F. , 2006. Mechanisms of cellular resistance to camptothecins. Curr. Med. Chem. 13, 3291–3305. [DOI] [PubMed] [Google Scholar]
- Birkenkamp-Demtroder, K. , Hahn, S.A. , Mansilla, F. , Thorsen, K. , Maghnouj, A. , Christensen, R. , Oster, B. , Orntoft, T.F. , 2013. Keratin23 (KRT23) knockdown decreases proliferation and affects the DNA damage response of colon cancer cells. PloS One 8, e73593 [DOI] [PMC free article] [PubMed] [Google Scholar]
- Bolstad, B.M. , Irizarry, R.A. , Astrand, M. , Speed, T.P. , 2003. A comparison of normalization methods for high density oligonucleotide array data based on variance and bias. Bioinformatics 19, 185–193. [DOI] [PubMed] [Google Scholar]
- Boyer, J. , McLean, E.G. , Aroori, S. , Wilson, P. , McCulla, A. , Carey, P.D. , Longley, D.B. , Johnston, P.G. , 2004. Characterization of p53 wild-type and null isogenic colorectal cancer cell lines resistant to 5-fluorouracil, oxaliplatin, and irinotecan. Clin. Cancer Res. Off. J. Am. Assoc. Cancer Res. 10, 2158–2167. [DOI] [PubMed] [Google Scholar]
- Braun, M.S. , Richman, S.D. , Quirke, P. , Daly, C. , Adlard, J.W. , Elliott, F. , Barrett, J.H. , Selby, P. , Meade, A.M. , Stephens, R.J. , Parmar, M.K. , Seymour, M.T. , 2008. Predictive biomarkers of chemotherapy efficacy in colorectal cancer: results from the UK MRC FOCUS trial. J. Clin. Oncol. 26, 2690–2698. [DOI] [PubMed] [Google Scholar]
- Brozic, P. , Turk, S. , Rizner, T.L. , Gobec, S. , 2011. Inhibitors of aldo-keto reductases AKR1C1-AKR1C4. Curr. Med. Chem. 18, 2554–2565. [DOI] [PubMed] [Google Scholar]
- Budinska, E. , Popovici, V. , Tejpar, S. , D'Ario, G. , Lapique, N. , Sikora, K.O. , Di Narzo, A.F. , Yan, P. , Hodgson, J.G. , Weinrich, S. , Bosman, F. , Roth, A. , Delorenzi, M. , 2013. Gene expression patterns unveil a new level of molecular heterogeneity in colorectal cancer. J. Pathol. 231, 63–76. [DOI] [PMC free article] [PubMed] [Google Scholar]
- Burgess, D.J. , Doles, J. , Zender, L. , Xue, W. , Ma, B. , McCombie, W.R. , Hannon, G.J. , Lowe, S.W. , Hemann, M.T. , 2008. Topoisomerase levels determine chemotherapy response in vitro and in vivo. Proc. Natl. Acad. Sci. U. S. A. 105, 9053–9058. [DOI] [PMC free article] [PubMed] [Google Scholar]
- Cancer Genome Atlas, N, 2012. Comprehensive molecular characterization of human colon and rectal cancer. Nature 487, 330–337. [DOI] [PMC free article] [PubMed] [Google Scholar]
- Candeil, L. , Gourdier, I. , Peyron, D. , Vezzio, N. , Copois, V. , Bibeau, F. , Orsetti, B. , Scheffer, G.L. , Ychou, M. , Khan, Q.A. , Pommier, Y. , Pau, B. , Martineau, P. , Del Rio, M. , 2004. ABCG2 overexpression in colon cancer cells resistant to SN38 and in irinotecan-treated metastases. International journal of cancer. J. Int. Du Cancer 109, 848–854. [DOI] [PubMed] [Google Scholar]
- Cunningham, D. , Atkin, W. , Lenz, H.J. , Lynch, H.T. , Minsky, B. , Nordlinger, B. , Starling, N. , 2010. Colorectal cancer. Lancet 375, 1030–1047. [DOI] [PubMed] [Google Scholar]
- Fais, S. , De, M.A. , Lozupone, F. , 2005. The role of FAS to ezrin association in FAS-mediated apoptosis. Apoptosis 10, 941–947. [DOI] [PubMed] [Google Scholar]
- Fan, F. , Samuel, S. , Evans, K.W. , Lu, J. , Xia, L. , Zhou, Y. , Sceusi, E. , Tozzi, F. , Ye, X.C. , Mani, S.A. , Ellis, L.M. , 2012. Overexpression of snail induces epithelial-mesenchymal transition and a cancer stem cell-like phenotype in human colorectal cancer cells. Cancer Med. 1, 5–16. [DOI] [PMC free article] [PubMed] [Google Scholar]
- Funke, S. , Timofeeva, M. , Risch, A. , Hoffmeister, M. , Stegmaier, C. , Seiler, C.M. , Brenner, H. , Chang-Claude, J. , 2010. Genetic polymorphisms in GST genes and survival of colorectal cancer patients treated with chemotherapy. Pharmacogenomics 11, 33–41. [DOI] [PubMed] [Google Scholar]
- Gagnon, V. , Mathieu, I. , Sexton, E. , Leblanc, K. , Asselin, E. , 2004. AKT involvement in cisplatin chemoresistance of human uterine cancer cells. Gynecol. Oncol 94, 785–795. [DOI] [PubMed] [Google Scholar]
- Gallagher, D.J. , Kemeny, N. , 2010. Metastatic colorectal cancer: from improved survival to potential cure. Oncology 78, 237–248. [DOI] [PubMed] [Google Scholar]
- Goldberg, R.M. , Sargent, D.J. , Morton, R.F. , Fuchs, C.S. , Ramanathan, R.K. , Williamson, S.K. , Findlay, B.P. , Pitot, H.C. , Alberts, S.R. , 2004. A randomized controlled trial of fluorouracil plus leucovorin, irinotecan, and oxaliplatin combinations in patients with previously untreated metastatic colorectal cancer. J. Clin. Oncol. 22, 23–30. [DOI] [PubMed] [Google Scholar]
- Hanahan, D. , Weinberg, R.A. , 2000. The hallmarks of cancer. Cell 100, 57–70. [DOI] [PubMed] [Google Scholar]
- Hanahan, D. , Weinberg, R.A. , 2011. Hallmarks of cancer: the next generation. Cell 144, 646–674. [DOI] [PubMed] [Google Scholar]
- Hoshino, H. , Miyoshi, N. , Nagai, K. , Tomimaru, Y. , Nagano, H. , Sekimoto, M. , Doki, Y. , Mori, M. , Ishii, H. , 2009. Epithelial-mesenchymal transition with expression of SNAI1-induced chemoresistance in colorectal cancer. Biochem. Biophys. Res. Commun. 390, 1061–1065. [DOI] [PubMed] [Google Scholar]
- Hsiang, Y.H. , Liu, L.F. , 1988. Identification of mammalian DNA topoisomerase I as an intracellular target of the anticancer drug camptothecin. Cancer Res. 48, 1722–1726. [PubMed] [Google Scholar]
- Huang, d.W. , Sherman, B.T. , Lempicki, R.A. , 2009. Bioinformatics enrichment tools: paths toward the comprehensive functional analysis of large gene lists. Nucleic Acids Res. 37, 1–13. [DOI] [PMC free article] [PubMed] [Google Scholar]
- Huang, d.W. , Sherman, B.T. , Lempicki, R.A. , 2009. Systematic and integrative analysis of large gene lists using DAVID bioinformatics resources. Nat. Protoc. 4, 44–57. [DOI] [PubMed] [Google Scholar]
- Huang, S. , Holzel, M. , Knijnenburg, T. , Schlicker, A. , Roepman, P. , McDermott, U. , Garnett, M. , Grernrum, W. , Sun, C. , Prahallad, A. , Groenendijk, F.H. , Mittempergher, L. , Nijkamp, W. , Neefjes, J. , Salazar, R. , Ten, D.P. , Uramoto, H. , Tanaka, F. , Beijersbergen, R.L. , Wessels, L.F. , Bernards, R. , 2012. MED12 controls the response to multiple cancer drugs through regulation of TGF-beta receptor signaling. Cell 151, 937–950. [DOI] [PMC free article] [PubMed] [Google Scholar]
- Hwang, W.L. , Yang, M.H. , Tsai, M.L. , Lan, H.Y. , Su, S.H. , Chang, S.C. , Teng, H.W. , Yang, S.H. , Lan, Y.T. , Chiou, S.H. , Wang, H.W. , 2011. SNAIL regulates interleukin-8 expression, stem cell-like activity, and tumorigenicity of human colorectal carcinoma cells. Gastroenterology 141, 279–291. [DOI] [PubMed] [Google Scholar]
- Jensen, N.F. , Smith, D.H. , Nygard, S.B. , Romer, M.U. , Nielsen, K.V. , Brunner, N. , 2012. Predictive biomarkers with potential of converting conventional chemotherapy to targeted therapy in patients with metastatic colorectal cancer. Scand. J. Gastroenterol. 47, 340–355. [DOI] [PubMed] [Google Scholar]
- Kim, J.C. , Roh, S.A. , Cho, D.H. , Kim, T.W. , Yoon, S.N. , Kim, C.W. , Yu, C.S. , Kim, S.Y. , Kim, Y.S. , 2009. Chemoresponsiveness associated with canonical molecular changes in colorectal adenocarcinomas. Anticancer Res. 29, 3115–3123. [PubMed] [Google Scholar]
- Koopman, M. , Venderbosch, S. , Nagtegaal, I.D. , van Krieken, J.H. , Punt, C.J. , 2009. A review on the use of molecular markers of cytotoxic therapy for colorectal cancer, what have we learned?. Eur. J. Cancer 45, 1935–1949. [DOI] [PubMed] [Google Scholar]
- Lao, V.V. , Grady, W.M. , 2011. Epigenetics and colorectal cancer. Nat. Rev. Gastroenterol. Hepatol. 8, 686–700. [DOI] [PMC free article] [PubMed] [Google Scholar]
- Lecomte, T. , Landi, B. , Beaune, P. , Laurent-Puig, P. , Loriot, M.A. , 2006. Glutathione S-transferase P1 polymorphism (Ile105Val) predicts cumulative neuropathy in patients receiving oxaliplatin-based chemotherapy. Clin. Cancer Res. 12, 3050–3056. [DOI] [PubMed] [Google Scholar]
- Mathieu, A. , Remmelink, M. , D'Haene, N. , Penant, S. , Gaussin, J.F. , Van, G.R. , Darro, F. , Kiss, R. , Salmon, I. , 2004. Development of a chemoresistant orthotopic human nonsmall cell lung carcinoma model in nude mice: analyses of tumor heterogenity in relation to the immunohistochemical levels of expression of cyclooxygenase-2, ornithine decarboxylase, lung-related resistance protein, prostaglandin E synthetase, and glutathione-S-transferase-alpha (GST)-alpha, GST-mu, and GST-pi. Cancer 101, 1908–1918. [DOI] [PubMed] [Google Scholar]
- Monte, M. , Simonatto, M. , Peche, L.Y. , Bublik, D.R. , Gobessi, S. , Pierotti, M.A. , Rodolfo, M. , Schneider, C. , 2006. MAGE-A tumor antigens target p53 transactivation function through histone deacetylase recruitment and confer resistance to chemotherapeutic agents. Proc. Natl. Acad. Sci. U. S. A. 103, 11160–11165. [DOI] [PMC free article] [PubMed] [Google Scholar]
- National Comprehensive Cancer, N, 2013. NCCN Guidelines Version 3.2013 Colon Cancer (cited 2013 June 10) National Comprehensive Cancer Network; Available from: http://nccn.org/professionals/physician_gls/f_guidelines.asp [Google Scholar]
- Novotna, R. , Wsol, V. , Xiong, G. , Maser, E. , 2008. Inactivation of the anticancer drugs doxorubicin and oracin by aldo-keto reductase (AKR) 1C3. Toxicol. Lett. 181, 1–6. [DOI] [PubMed] [Google Scholar]
- Oliveros, J.C. , 2007. VENNY. An Interactive Tool for Comparing lists with Venn Diagrams http://bioinfogp.cnb.csic.es/tools/venny/index.html [Google Scholar]
- Penning, T.M. , Byrns, M.C. , 2009. Steroid hormone transforming aldo-keto reductases and cancer. Ann. N. Y. Acad. Sci. 1155, 33–42. [DOI] [PMC free article] [PubMed] [Google Scholar]
- Perez-Villamil, B. , Romera-Lopez, A. , Hernandez-Prieto, S. , Lopez-Campos, G. , Calles, A. , Lopez-Asenjo, J.A. , Sanz-Ortega, J. , Fernandez-Perez, C. , Sastre, J. , Alfonso, R. , Caldes, T. , Martin-Sanchez, F. , Diaz-Rubio, E. , 2012. Colon cancer molecular subtypes identified by expression profiling and associated to stroma, mucinous type and different clinical behavior. BMC Cancer 12, 260 [DOI] [PMC free article] [PubMed] [Google Scholar]
- Petitprez, A. , Poindessous, V. , Ouaret, D. , Regairaz, M. , Bastian, G. , Guerin, E. , Escargueil, A.E. , Larsen, A.K. , 2013. Acquired irinotecan resistance is accompanied by stable modifications of cell cycle dynamics independent of MSI status. Int. J. Oncol [DOI] [PubMed] [Google Scholar]
- Pfister, T.D. , Reinhold, W.C. , Agama, K. , Gupta, S. , Khin, S.A. , Kinders, R.J. , Parchment, R.E. , Tomaszewski, J.E. , Doroshow, J.H. , Pommier, Y. , 2009. Topoisomerase I levels in the NCI-60 cancer cell line panel determined by validated ELISA and microarray analysis and correlation with indenoisoquinoline sensitivity. Mol. Cancer Ther. 8, 1878–1884. [DOI] [PMC free article] [PubMed] [Google Scholar]
- Pommier, Y. , 2009. DNA topoisomerase I inhibitors: chemistry, biology, and interfacial inhibition. Chem. Rev. 109, 2894–2902. [DOI] [PMC free article] [PubMed] [Google Scholar]
- Popovici, V. , Budinska, E. , Bosman, F.T. , Tejpar, S. , Roth, A.D. , Delorenzi, M. , 2013. Context-dependent interpretation of the prognostic value of BRAF and KRAS mutations in colorectal cancer. BMC Cancer 13, 439 [DOI] [PMC free article] [PubMed] [Google Scholar]
- Popovici, V. , Budinska, E. , Tejpar, S. , Weinrich, S. , Estrella, H. , Hodgson, G. , van, C.E. , Xie, T. , Bosman, F.T. , Roth, A.D. , Delorenzi, M. , 2012. Identification of a poor-prognosis BRAF-mutant-like population of patients with colon cancer. J. Clin. Oncol 30, 1288–1295. [DOI] [PubMed] [Google Scholar]
- Qvortrup, C. , Jensen, B.V. , Fokstuen, T. , Nielsen, S.E. , Keldsen, N. , Glimelius, B. , Bjerregaard, B. , Mejer, J. , Larsen, F.O. , Pfeiffer, P. , 2010. A randomized study comparing short-time infusion of oxaliplatin in combination with capecitabine XELOX(30) and chronomodulated XELOX(30) as first-line therapy in patients with advanced colorectal cancer. Ann. Oncol. 21, 87–91. [DOI] [PubMed] [Google Scholar]
- Rabik, C.A. , Dolan, M.E. , 2007. Molecular mechanisms of resistance and toxicity associated with platinating agents. Cancer Treat. Rev. 33, 9–23. [DOI] [PMC free article] [PubMed] [Google Scholar]
- Rasheed, Z.A. , Rubin, E.H. , 2003. Mechanisms of resistance to topoisomerase I-targeting drugs. Oncogene 22, 7296–7304. [DOI] [PubMed] [Google Scholar]
- Rasmussen, M.H. , Jensen, N.F. , Tarpgaard, L.S. , Qvortrup, C. , Romer, M.U. , Stenvang, J. , Hansen, T.P. , Christensen, L.L. , Lindebjerg, J. , Hansen, F. , Jensen, B.V. , Hansen, T.F. , Pfeiffer, P. , Brunner, N. , Orntoft, T.F. , Andersen, C.L. , 2013. High expression of microRNA-625-3p is associated with poor response to first-line oxaliplatin based treatment of metastatic colorectal cancer. Mol. Oncol. 7, 637–646. [DOI] [PMC free article] [PubMed] [Google Scholar]
- Redmond, K.M. , Wilson, T.R. , Johnston, P.G. , Longley, D.B. , 2008. Resistance mechanisms to cancer chemotherapy. Front Biosci. 13, 5138–5154. [DOI] [PubMed] [Google Scholar]
- Robey, R.W. , Massey, P.R. , Amiri-Kordestani, L. , Bates, S.E. , 2010. ABC transporters: unvalidated therapeutic targets in cancer and the CNS. Anticancer Agents Med. Chem. 10, 625–633. [DOI] [PMC free article] [PubMed] [Google Scholar]
- Ross, D. , Nakanishi, T. , 2010. Impact of breast Cancer resistance protein on Cancer treatment outcomes. In Zhou J., Multi-drug Resistance in Cancer Humana Press; 251–290. [DOI] [PubMed] [Google Scholar]
- Roth, A.D. , Tejpar, S. , Delorenzi, M. , Yan, P. , Fiocca, R. , Klingbiel, D. , Dietrich, D. , Biesmans, B. , Bodoky, G. , Barone, C. , Aranda, E. , Nordlinger, B. , Cisar, L. , Labianca, R. , Cunningham, D. , Van Cutsem, E. , Bosman, F. , 2010. Prognostic role of KRAS and BRAF in stage II and III resected colon cancer: results of the translational study on the PETACC-3, EORTC 40993, SAKK 60-00 trial. J. Clin. Oncol. Off. J. Am. Soc. Clin. Oncol. 28, 466–474. [DOI] [PubMed] [Google Scholar]
- Sadanandam, A. , Lyssiotis, C.A. , Homicsko, K. , Collisson, E.A. , Gibb, W.J. , Wullschleger, S. , Ostos, L.C. , Lannon, W.A. , Grotzinger, C. , Del Rio, M. , Lhermitte, B. , Olshen, A.B. , Wiedenmann, B. , Cantley, L.C. , Gray, J.W. , Hanahan, D. , 2013. A colorectal cancer classification system that associates cellular phenotype and responses to therapy. Nat. Med. 19, 619–625. [DOI] [PMC free article] [PubMed] [Google Scholar]
- Saeed, A.I. , Bhagabati, N.K. , Braisted, J.C. , Liang, W. , Sharov, V. , Howe, E.A. , Li, J. , Thiagarajan, M. , White, J.A. , Quackenbush, J. , 2006. TM4 microarray software suite. Methods Enzymol. 411, 134–193. [DOI] [PubMed] [Google Scholar]
- Santoni, G. , Farfariello, V. , 2011. TRP channels and cancer: new targets for diagnosis and chemotherapy. Endocr. Metab. Immune. Disord. Drug Targets 11, 54–67. [DOI] [PubMed] [Google Scholar]
- Saxena, M. , Stephens, M.A. , Pathak, H. , Rangarajan, A. , 2011. Transcription factors that mediate epithelial-mesenchymal transition lead to multidrug resistance by upregulating ABC transporters. Cell Death. Dis. 2, e179 [DOI] [PMC free article] [PubMed] [Google Scholar]
- Scurr, L.L. , Guminski, A.D. , Chiew, Y.E. , Balleine, R.L. , Sharma, R. , Lei, Y. , Pryor, K. , Wain, G.V. , Brand, A. , Byth, K. , Kennedy, C. , Rizos, H. , Harnett, P.R. , deFazio, A. , 2008. Ankyrin repeat domain 1, ANKRD1, a novel determinant of cisplatin sensitivity expressed in ovarian cancer. Clin. Cancer Res. 14, 6924–6932. [DOI] [PubMed] [Google Scholar]
- Silvestris, N. , Simone, G. , Partipilo, G. , Scarpi, E. , Lorusso, V. , Brunetti, A.E. , Maiello, E. , Paradiso, A. , Mangia, A. , 2014. CES2, ABCG2, TS and Topo-I primary and synchronous metastasis expression and clinical outcome in metastatic colorectal cancer patients treated with first-line FOLFIRI regimen. Int. J. Mol. Sci. 15, 15767–15777. [DOI] [PMC free article] [PubMed] [Google Scholar]
- Simons, C.C. , Hughes, L.A. , Smits, K.M. , Khalid-de Bakker, C.A. , de Bruine, A.P. , Carvalho, B. , Meijer, G.A. , Schouten, L.J. , van den Brandt, P.A. , Weijenberg, M.P. , van Engeland, M. , 2013. A novel classification of colorectal tumors based on microsatellite instability, the CpG island methylator phenotype and chromosomal instability: implications for prognosis. Ann. Oncol. Off. J. Eur. Soc. Med. Oncol./ESMO 24, 2048–2056. [DOI] [PubMed] [Google Scholar]
- Singh, A. , Settleman, J. , 2010. EMT, cancer stem cells and drug resistance: an emerging axis of evil in the war on cancer. Oncogene 29, 4741–4751. [DOI] [PMC free article] [PubMed] [Google Scholar]
- Smyth, G.K. , 2005. Limma: linear models for microarray data. In Gentleman R., Carey V., Dudoit S., Irizarry R., Huber W.(Eds.), Bioinformatics and Computational Biology Solutions using R and Bioconductor Springer; New York: 397–420. [Google Scholar]
- Suzuki, T. , Yoshida, K. , Wada, Y. , Hamai, Y. , Sentani, K. , Oue, N. , Yasui, W. , 2007. Melanoma-associated antigen-A1 expression predicts resistance to docetaxel and paclitaxel in advanced and recurrent gastric cancer. Oncol. Rep. 18, 329–336. [PubMed] [Google Scholar]
- Tai, I.T. , Dai, M. , Owen, D.A. , Chen, L.B. , 2005. Genome-wide expression analysis of therapy-resistant tumors reveals SPARC as a novel target for cancer therapy. J. Clin. Invest. 115, 1492–1502. [DOI] [PMC free article] [PubMed] [Google Scholar]
- Thomas, P.D. , Kejariwal, A. , Campbell, M.J. , Mi, H. , Diemer, K. , Guo, N. , Ladunga, I. , Ulitsky-Lazareva, B. , Muruganujan, A. , Rabkin, S. , Vandergriff, J.A. , Doremieux, O. , 2003. PANTHER: a browsable database of gene products organized by biological function, using curated protein family and subfamily classification. Nucleic Acids Res. 31, 334–341. [DOI] [PMC free article] [PubMed] [Google Scholar]
- Tournigand, C. , Andre, T. , Achille, E. , Lledo, G. , Flesh, M. , Mery-Mignard, D. , Quinaux, E. , Couteau, C. , Buyse, M. , Ganem, G. , Landi, B. , Colin, P. , Louvet, C. , de Gramont, A. , 2004. FOLFIRI followed by FOLFOX6 or the reverse sequence in advanced colorectal cancer: a randomized GERCOR study. J. Clin. Oncol. Off. J. Am. Soc. Clin. Oncol. 22, 229–237. [DOI] [PubMed] [Google Scholar]
- van Cutsem, E. , Labianca, R. , Bodoky, G. , Barone, C. , Aranda, E. , Nordlinger, B. , Topham, C. , Tabernero, J. , Andre, T. , Sobrero, A.F. , Mini, E. , Greil, R. , Di, C.F. , Collette, L. , Cisar, L. , Zhang, X. , Khayat, D. , Bokemeyer, C. , Roth, A.D. , Cunningham, D. , 2009. Randomized phase III trial comparing biweekly infusional fluorouracil/leucovorin alone or with irinotecan in the adjuvant treatment of stage III colon cancer: PETACC-3. J. Clin. Oncol 27, 3117–3125. [DOI] [PubMed] [Google Scholar]
- van Loevezijn, A. , Allen, J.D. , Schinkel, A.H. , Koomen, G.J. , 2001. Inhibition of BCRP-mediated drug efflux by fumitremorgin-type indolyl diketopiperazines. Bioorg. Med. Chem. Lett. 11, 29–32. [DOI] [PubMed] [Google Scholar]
- Veitch, Z.W. , Guo, B. , Hembruff, S.L. , Bewick, A.J. , Heibein, A.D. , Eng, J. , Cull, S. , Maclean, D.A. , Parissenti, A.M. , 2009. Induction of 1C aldoketoreductases and other drug dose-dependent genes upon acquisition of anthracycline resistance. Pharmacogenet. Genomics 19, 477–488. [DOI] [PubMed] [Google Scholar]
- Voulgari, A. , Pintzas, A. , 2009. Epithelial-mesenchymal transition in cancer metastasis: mechanisms, markers and strategies to overcome drug resistance in the clinic. Biochim. Biophys. Acta 1796, 75–90. [DOI] [PubMed] [Google Scholar]
- Walther, A. , Johnstone, E. , Swanton, C. , Midgley, R. , Tomlinson, I. , Kerr, D. , 2009. Genetic prognostic and predictive markers in colorectal cancer. Nat. Rev. Cancer 9, 489–499. [DOI] [PubMed] [Google Scholar]
- Wu, C.P. , Hsieh, C.H. , Wu, Y.S. , 2011. The emergence of drug transporter-mediated multidrug resistance to cancer chemotherapy. Mol. Pharm. 8, 1996–2011. [DOI] [PubMed] [Google Scholar]
- Wu, K.L. , Khan, S. , Lakhe-Reddy, S. , Jarad, G. , Mukherjee, A. , Obejero-Paz, C.A. , Konieczkowski, M. , Sedor, J.R. , Schelling, J.R. , 2004. The NHE1 Na+/H+ exchanger recruits ezrin/radixin/moesin proteins to regulate Akt-dependent cell survival. J. Biol. Chem. 279, 26280–26286. [DOI] [PubMed] [Google Scholar]
- Yang, A.D. , Fan, F. , Camp, E.R. , van, B.G. , Liu, W. , Somcio, R. , Gray, M.J. , Cheng, H. , Hoff, P.M. , Ellis, L.M. , 2006. Chronic oxaliplatin resistance induces epithelial-to-mesenchymal transition in colorectal cancer cell lines. Clin. Cancer Res. 12, 4147–4153. [DOI] [PubMed] [Google Scholar]
- Zamble, D.B. , Mu, D. , Reardon, J.T. , Sancar, A. , Lippard, S.J. , 1996. Repair of cisplatin–DNA adducts by the mammalian excision nuclease. Biochemistry 35, 10004–10013. [DOI] [PubMed] [Google Scholar]
- Zhong, L. , Shen, H. , Huang, C. , Jing, H. , Cao, D. , 2011. AKR1B10 induces cell resistance to daunorubicin and idarubicin by reducing C13 ketonic group. Toxicol. Appl. Pharmacol. 255, 40–47. [DOI] [PMC free article] [PubMed] [Google Scholar]
- Zhou, Q. , Sparreboom, A. , Tan, E.H. , Cheung, Y.B. , Lee, A. , Poon, D. , Lee, E.J. , Chowbay, B. , 2005. Pharmacogenetic profiling across the irinotecan pathway in Asian patients with cancer. Br. J. Clin. Pharmacol. 59, 415–424. [DOI] [PMC free article] [PubMed] [Google Scholar]
Associated Data
This section collects any data citations, data availability statements, or supplementary materials included in this article.
Supplementary Materials
The following are the supplementary data related to this article:
Supplementary data
Supplementary data
Supplementary data
Supplementary data