

Abstract
Periampullary adenocarcinomas include four anatomical sites of origin (the pancreatic duct, bile duct, ampulla and duodenum) and most of them fall into two histological subgroups (pancreatobiliary and intestinal). Determining the exact origin of the tumor is sometimes difficult, due to overlapping histopathological characteristics. The prognosis depends on the histological subtype, as well as on the anatomical site of origin, the former being the more important. The molecular basis for these differences in prognosis is poorly understood. Whole‐genome analyses were used to investigate the association between molecular tumor profiles, pathogenesis and prognosis. A total of 85 periampullary adenocarcinomas were characterized by mRNA and miRNA expressions profiling. Molecular profiles of the tumors from the different anatomical sites of origin as well as of the different histological subtypes were compared. Differentially expressed mRNAs and miRNAs between the two histopathological subtypes were linked to specific molecular pathways. Six miRNA families were downregulated and four were upregulated in the pancreatobiliary type as compared to the intestinal type (P < 0.05). miRNAs and mRNAs associated with improved overall and recurrence free survival for the two histopathological subtypes were identified. For the pancreatobiliary type the genes ATM, PTEN, RB1 and the miRNAs miR‐592 and miR‐497, and for the intestinal type the genes PDPK1, PIK3R2, G6PC and the miRNAs miR‐127‐3p, miR‐377* were linked to enriched pathways and identified as prognostic markers. The molecular signatures identified may in the future guide the clinicians in the therapeutic decision making to an individualized treatment, if confirmed in other larger datasets.
Keywords: Periampullary adenocarcinoma, Pancreatic cancer, Molecular expression profiling, Prognostic markers, Signaling pathways, Histological subtypes
Highlights
Periampullary carcinomas are distinct at level of histology rather than of origin.
Molecular findings stress the importance of stratifying tumors according to subtype.
Prognostic mRNAs and miRNAs are linked to the two histological subtypes.
mRNAs and miRNAs expression of subtypes are linked to specific enriched pathways.
Ten miRNA families are differentially expressed in the two subtypes.
1. Introduction
Periampullary adenocarcinomas (PAs) can originate from the pancreatic ducts, the distal common bile duct, the ampulla of Vater and the duodenum. Adenocarcinomas of all the four anatomical sites are classified according to the histological appearance and most of them fall into either pancreatobiliary (P) or intestinal (I) type ( Albores‐Saavedra et al., 2007; Westgaard et al., 2008 ). The adenocarcinomas with origin in the ampulla, at the intersection of the pancreas, the common bile duct and the duodenum, are those that typically can exhibit either an intestinal or pancreatobiliary appearance or a mixture of the two. Due to periampullary growth and overlapping histological phenotypes, accurate histological classification and anatomical base of the tumor may be difficult to ascertain. The different subgroups have similar clinical presentation, and are resected by pancreatoduodenectomy with curative intent. According to current national guidelines, only patients with pancreatic and duodenal adenocarcinomas are treated with adjuvant chemotherapy. Despite advances in surgery, radiotherapy and chemotherapy, the prognosis is poor. Pancreatic ductal adenocarcinoma (PDAC) is the most common and the most aggressive type, having a 5‐year overall survival of 20% following treatment with curative intent (Neoptolomos et al., 2010, 2013, 2012). Adjuvant chemotherapy on PAs has proven to have an additional effect of survival compared to surgery alone (Neoptolemos et al., 2012, 2010, 2004, 2007). Interestingly, there is evidence that histological subtype may be of even stronger prognostic impact than the anatomical site of origin (Westgaard et al., 2008). The patients suffering from adenocarcinoma of intestinal type do better than patients with adenocarcinoma of pancreatobiliary type (Albores‐Saavedra et al., 2007, 2013, 2008). Patients with tumors of the same histological subtype, but from different anatomical site of origin, have similar overall survival (Westgaard et al., 2013). Due to the differences in pathogenesis and survival, accurate histological classification of the periampullary adenocarcinomas is crucial for an adequate prognostic estimation and an individualized therapeutic decision. Molecular classification of the tumor may contribute to individualized treatment of the patients.
Based upon the analyses of small series of PDACs, molecular subtypes for this anatomical site have been proposed (Collisson et al., 2011, 2012, 2013 ). PAs originating from other sites than the pancreatic ducts have not yet been profiled by both miRNAs and mRNAs expression although an integrative platform for miRNA, mRNA and proteins has recently been published ( Thomas et al., 2014 ). The aim of the present study was to gain molecular insight into the pathogenesis of PAs by identifying miRNAs and mRNAs expression profiles of tumors from the different anatomical sites of origin, as well as of the two main histological subtypes and to relate their significance to survival. Pathway‐based strategies were applied to identify dysregulated pathways specific for the various molecular subtypes identified of PAs. Identification of dysregulated mRNAs and miRNAs in PAs associated with better overall and recurrence free survival may help understand the pathogenesis of the disease and identify potential drug targets.
2. Materials and methods
2.1. Patients and specimens
A total of 85 patients were included in the present investigation, 41 (48.2%) males and 44 (51.8%) females, with median age of 67 years (range 34–84 years). Fresh frozen tumor and adjacent normal tissue were collected from patients with adenocarcinomas admitted to Oslo University Hospital (2008–2011) for pancreatoduodenectomy with curative intent. The macroscopic and microscopic pathology work followed a standardized protocol. The diagnoses were independently verified according to the WHO Classification of Tumors of the Digestive System (Bosman et al., 2010), by two experienced pathologists. Only ductal adenocarcinomas of either pancreatobiliary or intestinal type, as first described by Kimura and colleagues (Kimura et al., 1994), were included in the project. The adenocarcinomas were classified according to site of origin, histological subgroups and tumor stage, in accordance with the pTNM Classification of Malignant Tumors (Sobin et al., 2009). Additionally, the resection margins, perineural and vascular tumor invasion were recorded (Table 1). Tumors (n = 4) that were of mixed pancreatobiliary and intestinal types were classified according to the WHO classification as the dominant subtype. Molecular analysis was performed on frozen tissue samples, and the diagnoses were set separately on this material, to ensure that the morphology matched the original diagnoses on the formalin fixed paraffin embedded (FFPE) material. Out of a total of 114 patients with adenocarcinomas, 85 patients with tumors in the periampullary region met the criteria for inclusion in this project, 68 pancreatobiliary tumors and 17 intestinal tumors (Figure 1). The remaining 29 tumors were excluded from the study due to variant type adenocarcinomas, metastatic adenocarcinomas, or low percentage of estimated tumor cells of the prepared specimen (< 10%).
Table 1.
Pathological characteristics of tumors with reference to site of origin and histopathology. Number of mRNA and miRNA samples from PDAC (P) (n = 49, n = 52), bile duct (P) (n = 8, n = 8), ampulla (P) (n = 8, n = 8), ampulla (I) (n = 7, n = 7), Duodenum (I) (n = 9, n = 9), normal (n = 12, n = 6).
| Periampullary adenocarcinomas total number = 85 | PDAC (P) | Bile duct (P) | Ampulla (P) | Ampulla (I) | Duodenum (I) | |
|---|---|---|---|---|---|---|
| Total (P) number, n = 68 | Total (I) number, n = 17 | |||||
| Number (%) | Number (%) | Number (%) | Number (%) | Number (%) | ||
| Histopathology of PAs | Pancreato‐biliary | 52 (76.5) | 8 (11.8) | 8 (11.8) | 0 | 0 |
| Intestinal | 0 | 0 | 0 | 7 (41.2) | 10 (58.8) | |
| Differentiation grade of tumors | Poor | 20 (38.4) | 4 (50) | 4 (50) | 0 | 2 (20) |
| Moderate | 31 (59.6) | 4 (50) | 4 (50) | 7 (100) | 8 (80) | |
| Well | 1 (1.9) | 0 | 0 | 0 | 0 | |
| pT | T1 | 4 (7.7) | 0 | 0 | 0 | 1 (10) |
| T2 | 5 (9.6) | 0 | 0 | 6 (85.7) | 2 (20) | |
| T3 | 43 (82.7) | 8 (100) | 5 (62.5) | 1 (14.3) | 3 (30) | |
| T4 | 0 | 0 | 3 (37.5) | 0 | 4 (40) | |
| N | N0 | 12 (23) | 4 (50) | 5 (62.5) | 4 (57.1) | 4 (40) |
| N1 | 40 (76.9) | 4 (50) | 3 (37.5) | 3 (42.8) | 5 (50) | |
| N2 | – | – | – | – | 1 (10) | |
| M | M0 | 50 (96.1) | 8 (100) | 8 (100) | 7 (100) | 8 (80) |
| M1 | 2 (3.8) | 0 | 0 | 0 | 2 (20) | |
| R | R0 | 22 (42.3) | 6 (80) | 7 (90) | 7 (100) | 9 (90) |
| R1 | 30 (57.6) | 2 (20) | 1 (10) | 0 | 1 (10) | |
| Vessel infiltration | Yes | 26 (50) | 4 (50) | 5 (62.5) | 2 (28.5) | 7 (70) |
| No | 26 (50) | 4 (50) | 3 (37.5) | 5 (71.4) | 3 (30) | |
| Perineural infiltration | Yes | 51 (98) | 7 (87.5) | 7 (87.5) | 1 (14.28) | 3 (30) |
| No | 1 (2) | 1 (12.5) | 1 (12.5) | 6 (85.7) | 7 (70) | |
| KRAS mutations in codons 12 and 13 | Mutated | 45/52 (87) | 6/8 (75) | 6/8 (75) | 2/7 (29) | 6/10 (60) |
| Wild type | 7/52 (13) | 2/8 (25) | 2/8 (25) | 5/7 (71) | 4/10 (40) | |
Figure 1.
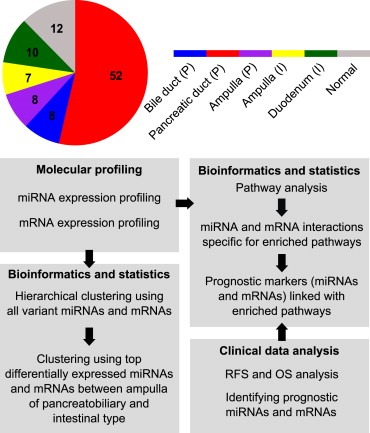
The analysis pipeline. The coloring of the circle corresponds to the five different subgroups and normal tissue samples.
The characteristics of the 85 PAs are presented in Table 1. A total of 52 PDACs were used in the analyses, of which 49 samples were analyzed for mRNAs and 51 for miRNAs, with 48 samples analyzed for expression of both mRNAs and miRNAs. Ten adenocarcinomas from the duodenum were examined; nine samples were profiled for miRNAs and nine for mRNAs, of which eight samples were in common for miRNAs and mRNAs. The sample distribution is shown in Figure 1. A total of 65 and 67 pancreatobiliary samples were used in the analysis of mRNAs and miRNAs, respectively. Of the intestinal samples, 16 were analyzed for both mRNAs and miRNAs. The study was approved by the Regional Ethics Committee, and all patients included had given their signed informed consent.
2.2. Specimen preparation and RNA purification
The tumor samples available were sectioned and stained with HE in preset intervals. The tumor cells content was estimated as a fraction of the whole HE section (10 × 20 mm) by a trained pathologist. We selected the section with the highest estimated tumor percentage. Total RNA was isolated from whole sections of fresh frozen tumor (n = 85) and adjacent normal tissues from patients with pancreatitis (n = 12) according to the manufacturer's instructions (mirVana miRNA Isolation Kit Ambion/Life Technologies). The RNA concentration was measured using a Nanodrop ND‐1000 spectrophotometer, and the quality assessed on a Bioanalyzer 2100 (Agilent). The RIN‐values ranged from 2.0 to 9.9 with 16 of 85 samples below 5.0.
2.3. mRNA expression analysis, pre‐processing and normalization
A total of 100 ng total RNA was converted to cDNA, amplified and labeled with Cy‐3 using LowInput QuickAmp Labeling Kit (Agilent Technologies, Santa Clara, CA, USA) according to the manufacturer's instructions. After cleaning of the samples on RNeasy Mini Columns (Qiagen) the efficiency of the labeling reaction labeled cRNA was measured using Nanodrop ND‐1000. 600 ng Cy‐3 labeled cRNA was hybridized to SurePrint G3 Human GE 8x60K microarrays containing probes for 42,545 individual mRNAs for 17 h at 65 °C using Hi‐RPM Gene Expression Hybridization Kit (Agilent Technologies, Santa Clara, CA, USA). The arrays were washed according to the manufacturer's instructions, using Gene Expression Wash Buffer Kit (Agilent Technologies, Santa Clara, CA, USA), and scanned on an Agilent DNA Microarray Scanner. Hybridization signals were extracted using Feature Extraction 10.7.3.1 (Agilent Technologies, Santa Clara, CA, USA). The mRNA microarray data was background corrected and quantile normalized. Filtering of controls and low expressed probes was performed by calculating the 95% percentile of the negative control probes on each array, and probes that were at least 10% brighter than the negative controls on at least 50% of the arrays were included in the further analysis.
2.4. miRNA expression analysis, pre‐processing and normalization
Some of the samples were vacuum centrifuged to achieve the required concentration of 50 ng/μl. 200 ng total RNA was dephosphorylated and labeled by Cyanine‐3‐pCp using miRNA Complete Labeling and Hybridization kit (Agilent Technologies, Santa Clara, CA, USA) according to the manufacturer's instructions. The labeled total RNA was cleaned using Micro Bio‐Spin 6 columns to remove DMSO contamination and unincorporated Cyanine‐3‐pCp, vacuum centrifuged until dryness and dissolved in RNase‐free H2O. Samples were hybridized to SurePrint G3 Human v16 miRNA 8x60K microarrays containing probes for 1368 miRNAs for 20 h at 55 °C. The arrays were washed according to the manufacturer's instructions, using Gene Expression Wash Buffer Kit (Agilent Technologies, Santa Clara, CA, USA), and scanned on an Agilent DNA Microarray Scanner. Hybridization signals were extracted using Feature Extraction 10.7.3.1 (Agilent Technologies, Santa Clara, CA, USA). The miRNA microarray data was normalized using Robust Multiarray Average approach and undetected probes were flagged and filtered if not detected in 50% of the array replicates using AgimicroRNA package Version 2.10.0 in R (Lopez‐Romero, 2011). The data is accessible through GEO accession number GSE60980.
2.5. KRAS mutational analysis
Tumor DNA was screened for the presence of seven KRAS mutations in codons 12 and 13; (KRAS g.34G>C (p.G12R), g.34G>A (p.G12S), g.34G>T (p.G12C), g.35G>A (p.G12D), g.35G>C (p.G12A), g.35G>T (p.G12V), g.38G>A (p.G13D)) as previously described (Hamfjord et al., 2011).
2.6. Bioinformatical and statistical analysis
2.6.1. Clustering and differential expression analysis of the five subgroups
Hierarchical clustering was performed on the PAs (n = 85) from the different sites of origin. All the intrinsically variable mRNAs (s.d. > 0.8) and miRNAs (s.d. > 0.5) were used in the analysis. Thus, 7516 mRNAs and 246 miRNAs from the microarray data sets were used for cluster analysis. Complete linkage together with Pearson's correlation coefficient and Spearman's rank correlation for genes and samples were used, respectively (Berry et al., 2010). The grouping of samples was based on molecular profiles independent of morphology or any clinical features.
Hierarchical clustering based on the histological subtypes (i.e. pancreatobiliary (n = 68) and intestinal (n = 17)) were performed separately using the intrinsically variable mRNAs (s.d. > 0.8) and miRNAs (s.d. > 0.5) using Pearson's correlation coefficient and Spearman's rank correlation for genes and samples, respectively.
The moderated t‐test (modT) (Smyth et al., 2004, 2005) was carried out to identify differentially expressed mRNAs between ampullary adenocarcinomas of pancreatobiliary (ampulla (P)) and intestinal type (ampulla (I)) at adjusted P < 0.05 (Benjamini and Hochberg, 1995). Using the same procedure, the differentially expressed miRNAs between ampulla (P) and ampulla (I) were identified. The analysis was carried out using the Bioconductor package limma in R (Gentleman et al., 2004). The differentially expressed miRNAs and mRNAs were used for hierarchical clustering of all the PAs using complete linkage and Pearson's correlation coefficient and Spearman's rank correlation for genes and samples, respectively.
2.6.2. Survival analysis
Survival analysis was performed using the Kaplan–Meier estimator as implemented in the KMsurv package (Therneau and Grambsch, 2000) and the log‐rank test. Overall survival (OS) time was calculated from date of surgery to time of death. OS data were obtained from the National Population Registry in Norway. Four patients with distant metastasis (M1) at time of resection, and one patient that died from cardiac arrest were not included in the survival analysis. Recurrence free survival (RFS) time was calculated from date of surgery to date of recurrence of disease. Recurrence was defined as radiological evidence of intra‐abdominal soft tissue around the surgical site or of distant metastasis.
To identify potential prognostic markers (i.e. miRNAs and mRNAs) for pancreatobiliary and intestinal adenocarcinomas, Cox regression analysis was performed. The results were confirmed by the log‐rank test (P < 0.05). The Kaplan–Meier survival curves for the identified prognostic markers were plotted. The expression for each sample was designated as high if the expression was higher than the 75th percentile expression value within each histopathological subgroup, otherwise as low.
2.6.3. Pathway analysis
Gene set enrichment analysis (GSEA) ( Subramanian et al., 2005 ) was used to identify deregulated pathways in the PAs. GSEA is a statistical tool for microarray data analysis based on a modified Kolmogorov–Smirnov statistics. It ranks all the genes based on the expression ratio between the normal and the tumor samples and determines whether the high‐ranking genes are enriched with genes in a specified pathway. GSEA was used to identify pathways enriched in the five subgroups of the PAs (i.e. from each site of origin including its histopathological subgroup) compared to the normal tissue samples. All gene sets were selected from four different sources: BioCarta, KEGG, Pathway Interaction Database and Reactome as documented in MSigDb version v4.0.
Enrichment score, nominal P value and FDR for each pathway enriched in the five subgroups using GSEA were calculated. Z‐scores obtained from the P values and FDR scores were plotted using JavaTree view (Saldanha, 2004).
2.6.4. Pathway based interaction of miRNAs and mRNAs
All the validated interactions curated from miRwalk database (Dweep et al., 2011) of differentially expressed miRNAs between the pancreatobiliary and intestinal adenocarcinomas, and statistically enriched mRNAs from GSEA analysis for each pathway were extracted. The prognostic miRNA and mRNA markers were linked to the enriched pathways.
3. Results
An overview of the analyses carried out on the PAs using molecular profiling data of miRNAs and mRNAs, clinical data and KRAS mutation status is summarized in Figure 1.
3.1. mRNA expression data analysis of all PAs
Unsupervised hierarchical clustering was performed using all the intrinsically variable mRNAs (i.e. 7516 mRNA) having the s.d. > 0.8 for all the 85 PAs. The heatmap (Figure 2) shows three main clusters, where 11 of the 16 profiled tumors with intestinal subtype cluster together. In addition to the main cluster, consisting of pancreatobiliary (35/65) samples, the normal samples form a cluster together with seven samples from the PDACs, three from the bile duct and two with intestinal subtype from the ampulla. Three of the pancreatobiliary samples from the ampulla cluster with the intestinal samples. No difference in survival was observed between the three main clusters of the heatmap (data not shown). The robustness of clustering of samples based on morphological subtype was tested by varying the threshold, inclusion and exclusion of samples, and by varying the clustering parameters.
Figure 2.
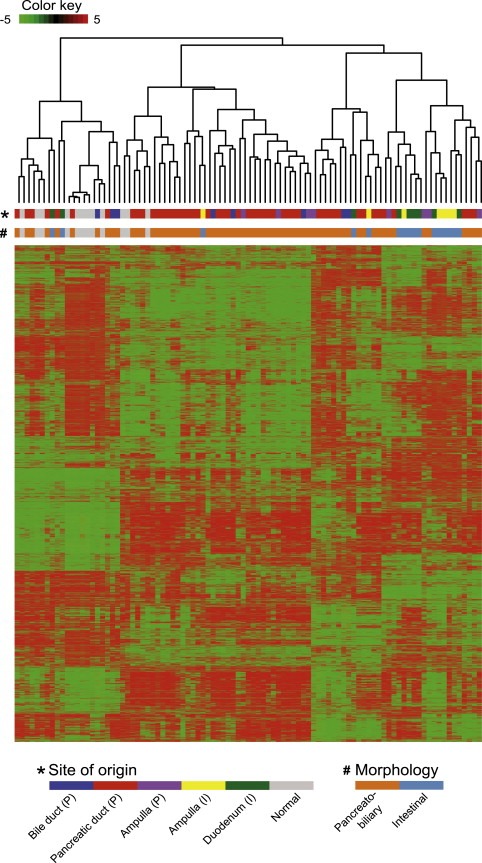
Hierarchical clustering of the 85 PAs, using the 7516 most variable mRNAs across the dataset.
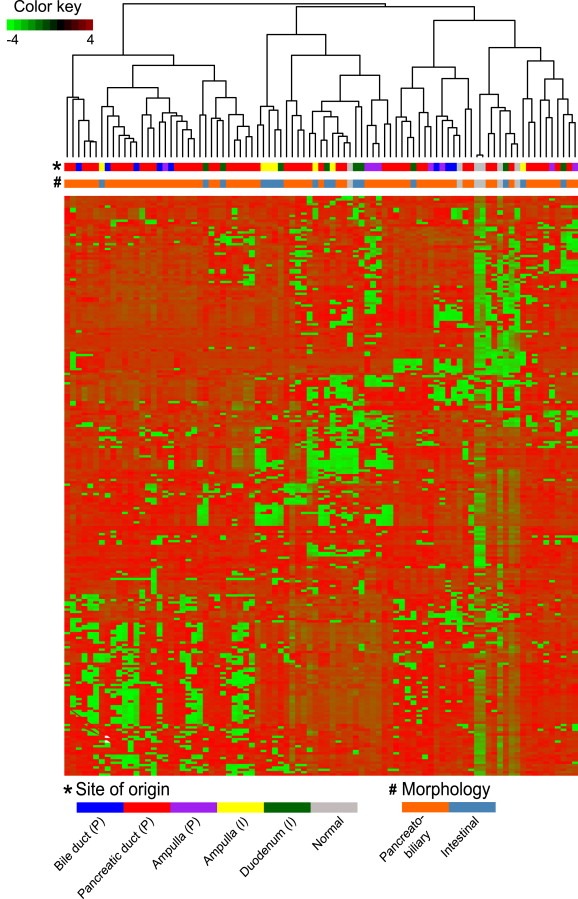
To identify clustering patterns independent of histopathology, separate hierarchical clustering was carried out for all samples using the most intrinsically variant genes for intestinal ((n = 16) (s.d > 0.8) i.e. 4422 mRNAs), and pancreatobiliary ((n = 65) (s.d > 0.8) i.e. 4249 mRNAs) subtypes, respectively. In both figures Figures S.1a and S.1b two main clusters are observed. In S.1a the pancreatobiliary samples cluster together in one major cluster and the normal samples cluster together with a few of the pancreatobiliary samples with low tumor content. In S.1b the intestinal samples form one major cluster, and the normal samples cluster together in a separate cluster with a few intestinal samples of low tumor content. Interestingly, none of the histological subtypes form clusters based on site of origin. Despite the small sample size in each subgroup except for the PDACs, a high significance is associated with molecular profile clusters and morphological subtypes at P value < 0.001 from both hypergeometric distribution test and Fischer's exact test, indicating that clustering is not by chance but has a biological significance. The relative association between molecular profiles and site of origin was studied, and we could not find any strong association between molecular profiles and site of origin.
The moderated t‐test was carried out between the two histological subtypes from the ampullary site of origin, (ampulla (P) n = 8 and ampulla (I) n = 7) to identify differentially expressed genes with P < 0.05 (Supplementary Table S.1a). The 360 mRNAs, differentially expressed between ampulla (P) and ampulla (I) were used to cluster all the PAs (Figure 3). The intestinal samples from ampulla (5/7) and duodenum (4/9) clustered together and separately from the pancreatobiliary samples.
Figure 3.
Hierarchical clustering of the PA samples based on differentially expressed mRNAs (n = 360) between eight samples from the ampulla (P) and seven samples from the ampulla (I).
The moderated t‐test was carried out between all the pancreatobiliary and the intestinal samples to identify differentially expressed genes with FDR adjusted P < 0.05 (Supplementary Table S.2a). In total 374 and 173 genes were upregulated in the pancreatobiliary and the intestinal type, respectively. Genes that are differentially expressed (upregulated) in the pancreatobiliary type are transcriptionally regulated by the WNT3A, TGFB1, HDAC, BDNF and ERBB4. In the intestinal type the differentially expressed (upregulated) genes are transcriptionally regulated by CDKN2A, RB1, PPARA. These genes were identified using functional analysis performed in the Ingenuity Pathway Analysis tool (Ingenuity Systems) by using Fisher's exact test (P < 0.000001) (Supplementary Tables S.3a and S.3b). A list of the genes that were identified both in the comparison between pancreatobiliary versus intestinal types and in the comparison between the ampulla (P) versus ampulla (I) types is provided in Supplementary Table S.4.
3.2. miRNA expression data analysis of all PAs
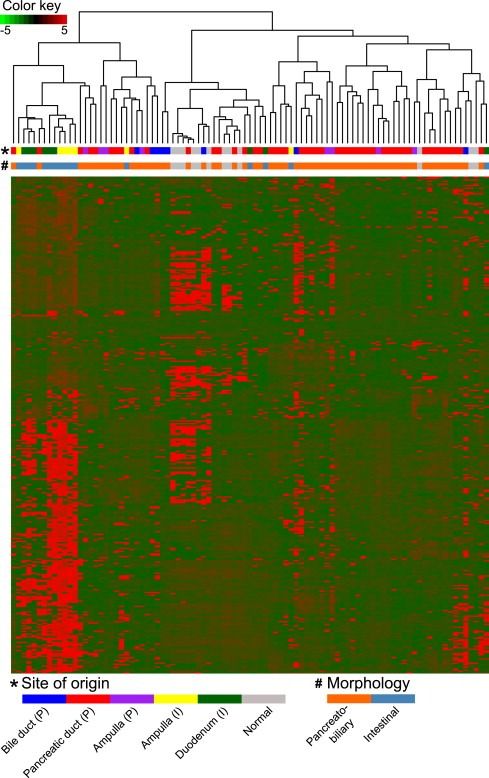
Hierarchical clustering was performed using intrinsically variable miRNAs having s.d. > 0.5 for all the PAs (i.e. 256 miRNAs). The heatmap shows miRNAs distributing the samples into three major clusters (Figure 4). The first cluster includes the majority of the pancreatobiliary samples, the second cluster with more than half of the intestinal samples (9/16) including three ampulla (P) samples. The third cluster contains the normal samples and a few samples with low tumor content. The same distribution was observed for the mRNA clustering of three ampulla (P) samples. At both the miRNA and mRNA level clear clusters of pancreatobiliary and intestinal samples were observed.
Figure 4.
Hierarchical clustering of the PAs (n = 85) based on intrinsically variable miRNAs (n = 256).
To identify clustering patterns independent of histopathological subtype, separate hierarchical clustering was performed of pancreatobiliary and intestinal samples. The most variant miRNAs i.e. 508 for the intestinal and 498 for the pancreatobiliary type were used, respectively (Supplementary Figures S.2a and S.2b). In Figure S.2a the pancreatobiliary subtype from the ampulla (5/8 samples) cluster together, while PDAC and bile duct samples are intermixed. The normal samples form a separate cluster. In Figure S.2b, two major clusters are observed, one with the normal samples and one with the intestinal samples. The samples from ampulla and duodenum do not cluster with respect to site of origin.
The moderated t‐test was carried out between ampulla (P) and ampulla (I) to identify differentially expressed miRNAs with P < 0.05, (Supplementary Table S.1b). A total of 35 miRNAs differentially expressed between ampulla (P) and ampulla (I) were used for clustering all the PAs (Figure 5). The pancreatobiliary samples from the PDAC, bile duct and ampulla do not cluster with respect to site of origin. Seven of the intestinal samples form a separate cluster, while three samples cluster with the normal samples. This is most likely due to the lower tumor content in these samples.
Figure 5.
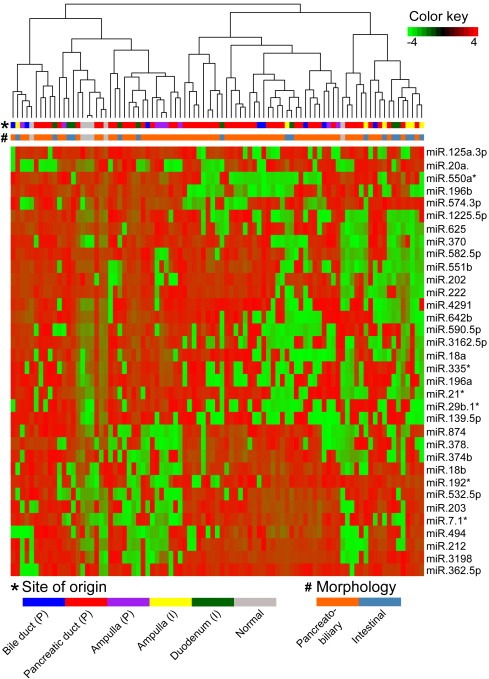
Hierarchical clustering of the PAs (n = 85) based on differentially expressed miRNAs (n=35) between the ampulla (P) and the ampulla (I).
The moderated t‐test was carried out to identify differentially expressed miRNAs between the pancreatobiliary and intestinal samples with P < 0.05 (Supplementary Table S.2b). Six miRNA families are downregulated in the samples with pancreatobiliary histopathology compared to the intestinal type (miR‐17, miR‐196, miR‐192, miR‐194, miR‐19 and miR‐548), while four miRNA families are upregulated in the pancreatobiliary type compared to the intestinal one (miR‐154, miR‐99, miR‐329 and miR‐199); see Supplementary Table S.5. Both in the pancreatobiliary versus intestinal samples, and the ampulla (P) versus ampulla (I) comparison, the miR‐18a, miR‐18b, miR‐196a, miR‐196b, miR‐203, miR‐20a, miR‐378* and miR‐625 are all differentially expressed.
3.3. Survival analysis
Median RFS for patients with PDAC (P) is 10 months, 16.5 months for patients with distal bile duct adenocarcinoma (P), 20.5 months for patient with ampullary adenocarcinoma (P), 21 months for patients with duodenal adenocarcinoma (I) and 39 months for patients with ampullary adenocarcinoma (I) (Figure 6). A similar trend was observed for OS (Supplementary Figure S.3) with P value = 0.0015. For patients with the intestinal subtype the median RFS was 28 months and the median OS was 31 months, while for patients with the pancreatobiliary subtype the median RFS was 12.5 months and the median OS was 20 months with P value = 0.01.
Figure 6.
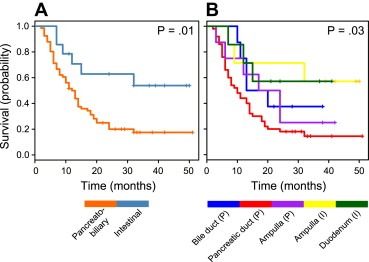
A. Kaplan–Meier curve demonstrating recurrence free survival (RFS) for patients with intestinal (I) versus pancreatobiliary (P) subtype of adenocarcinomas. B. Kaplan–Meier curve demonstrating RFS for patients in the five subgroups of PAs.
None of the three major clusters observed in the heatmap of 2, 3 had any significant differences in survival.
3.4. Pathway analysis
Gene set enrichment analysis (GSEA) was used to identify the significantly enriched pathways among the differentially expressed genes (mRNAs) from each of the five subgroups (Figure 7) (Subramanian et al., 2005 ). Normal tissues were used as a reference for comparisons with each subgroup. A total of 15 pathways were significantly enriched in at least one of the five subgroups at P < 0.05 and with a false discovery rate FDR < 0.25. The Wnt signaling and interferon gamma signaling pathways were enriched only in the PAs with pancreatobiliary histopathology. The glucose metabolism, glycolysis, phosphatidylinositol signaling and DNA repair signaling pathways are all enriched only in the PAs of the intestinal type. Both the insulin receptor recycling and insulin receptor signaling cascades are downregulated in the intestinal PAs and unaffected in the pancreatobiliary type. Pathways like ATM, ATR, PPAR signaling, p73, RB1, p53 and E2F, are affected in all subgroups, but at different relative levels. Supplementary Table S.6 gives the enrichment score, nominal P‐value and FDR value for each pathway enriched in the five subgroups using GSEA. The Z‐scores obtained from the P values and FDR score were plotted using the JavaTree view (Saldanha, 2004).
Figure 7.
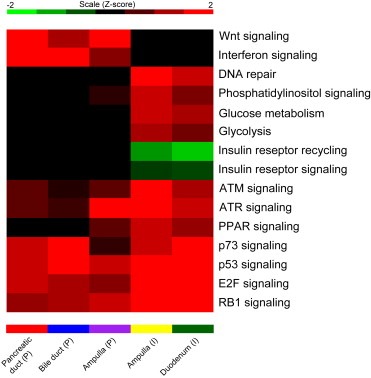
The heatmap based on mRNA expressions contains enrichment P values transformed to Z‐scores for the five subtypes of PAs. Red signifies maximal expression (upregulation), green signifies minimal expression (downregulation) and black shows no affect in the pathway regulation.
3.5. Cox regression to identify prognostic markers in patients with adenocarcinomas of pancreatobiliary and intestinal type
The Cox regression survival analysis linked better OS or RFS with upregulation or downregulation of 302 and 274 mRNAs in patients with pancreatobiliary and intestinal histopathology, respectively (Supplementary Tables S.7a and S.7b). From these genes, upregulation of four tumor suppressor genes (PTEN, RB1, ATM and KANK1) are linked to better OS or RFS. The downregulation of three oncogenes PAX5, PTTG2 and JAK3 are linked with better OS or RFS in patients with adenocarcinomas of pancreatobiliary type. For patients with adenocarcinoma of intestinal type, downregulation of four oncogenes (ELL, PDGFB, PIM1 and AR) and upregulation of a tumor suppressor gene (PYCARD) are linked to better OS or RFS.
Downregulation and upregulation of miR‐196b and miR‐592 respectively, are linked with both better RFS and OS at P < 0.05 for Cox regression test analysis with a significant log‐rank P < 0.05 for pancreatobiliary samples (See Materials and Methods). Upregulation of miR‐95 and downregulation of miR‐497 are linked to better RFS and OS for pancreatobiliary samples, respectively (Supplementary Table T.8a).
Downregulation of nine miRNAs (miR‐193b*, miR‐493*, miR‐450a, miR‐365, miR‐654‐3p, miR‐424, miR‐382, miR‐127‐3p and miR‐485‐3p) is linked to better RFS, and downregulation of two miRNAs (miR‐455‐3p and miR‐335) is linked to better OS for intestinal samples (Supplementary Table T.8b).
3.6. Pathway based interaction of mRNA‐miRNA
Validated interactions linked with specific pathways (i.e. listed in Figure 7) from the miRwalk database (Dweep et al., 2011) were identified between differentially expressed miRNAs in the pancreatobiliary versus the intestinal sample comparison, and the genes involved in the enriched pathways were identified. The miRNA families deregulated in each of the pathways, and miRNA and mRNA expressions linked to better OS or RFS specific for each pathway are shown in Table 2. All pathway specific interactions between miRNAs and mRNAs are documented in Supplementary Table S9.
Table 2.
The number of interactions between miRNAs and mRNAs, miRNA families and the miRNAs and mRNAs (i.e., genes) linked to better RFS and OS with reference to enriched pathways.
| Pathways | Interactions (miRNA‐mRNA) | Pancreatobiliary prognostic markers (miRNA and mRNA) | Intestinal prognostic markers (miRNA and mRNA) | miRNA family |
|---|---|---|---|---|
| Insulin regulation and recycling | 175 (40–45) | CALM1, PCK2, SLC2A4, PDPK1, PPARGC1A, PIK3R1, PHKB, hsa‐miR‐196b, hsa‐miR‐497 | FBP1, G6PC, PCK2, PIK3R2, PDPK1, hsa‐miR‐424, hsa‐miR‐382, hsa‐miR‐127‐3p, hsa‐miR‐193b*, hsa‐miR‐365, hsa‐miR‐455‐3p, hsa‐miR‐335 | miR‐192, miR‐194, miR‐196, miR‐17, miR‐18, miR‐19, miR‐194, miR‐199, miR‐99, miR‐329 |
| Wnt signaling | 163 (40–38) | LRP6, CXXC4, PPARD, CCND2, hsa‐miR‐196b, hsa‐miR‐497, has‐miR‐592 | WNT5A, CAMK2G, VANGL1, NFATC4, hsa‐miR‐455‐3p, hsa‐miR‐335, hsa‐miR‐193b*, hsa‐miR‐365, hsa‐miR‐424, hsa‐miR‐127‐3p | miR‐192, miR‐194, miR‐196, miR‐17, miR‐18, miR‐19, miR‐194, miR‐199, miR‐99, miR‐154 |
| E2F | 162 (43–27) | RB1, ATM,E2F7 | E2B2, CEBPA, hsa‐miR‐193b*, hsa‐miR‐365, hsa‐miR‐654‐3p, hsa‐miR‐424, hsa‐miR‐127‐3p, hsa‐miR‐377*, hsa‐miR‐455‐3p, hsa‐miR‐335 | miR‐192, miR‐194, miR‐196, miR‐17, miR‐18, miR‐19, miR‐194, miR‐199, miR‐99, miR‐154 |
| PPAR | 150 (44–38) | PIK3R1, RB1, RXRA, PCK2, PDPK1, PPARD, PTGS2 | miR‐192, miR‐194, miR‐196, miR‐17, miR‐18, miR‐19, miR‐194, miR‐199, miR‐99, miR‐154, miR‐329 | |
| p73 | 117 (43–23) | BBC3, WT1, GATA1, RB1, ITCH | hsa‐miR‐193b*, hsa‐miR‐654‐3p, hsa‐miR‐424, hsa‐miR‐127‐3p, hsa‐miR‐335 | miR‐192, miR‐194, miR‐196, miR‐17, miR‐18, miR‐19, miR‐194, miR‐199, miR‐99, miR‐154, miR‐329 |
| ATM | 107 (43–12) | ATM, hsa‐miR‐196b, hsa‐miR‐497 | hsa‐miR‐365, hsa‐miR‐654‐3p, hsa‐miR‐424, hsa‐miR‐127‐3p, hsa‐miR‐377*, hsa‐miR‐455‐3p, hsa‐miR‐335 | miR‐192, miR‐194, miR‐196, miR‐17, miR‐18, miR‐19, miR‐194, miR‐199, miR‐99, miR‐154 |
| p53 | 76 (46–17) | RB1, PTEN, BBC3, hsa‐miR‐196b, hsa‐miR‐497, has‐miR‐592 | GADD45B, hsa‐miR‐485‐3p, hsa‐miR‐193b*, hsa‐miR‐365, hsa‐miR‐654‐3p, hsa‐miR‐424, hsa‐miR‐127‐3p, hsa‐miR‐377*, hsa‐miR‐455‐3p, hsa‐miR‐335 | miR‐192, miR‐194, miR‐196, miR‐17, miR‐18, miR‐19, miR‐194, miR‐199, miR‐99, miR‐154, miR‐329 |
| Interferon/cytokine | 66 (29–14) | hsa‐miR‐196b, hsa‐miR‐497 | hsa‐miR‐377*, hsa‐miR‐455‐3p, hsa‐miR‐424, hsa‐miR‐365 | miR‐192, miR‐194, miR‐196, miR‐17, miR‐18, miR‐19, miR‐194, miR‐199, miR‐99 |
| RB1 | 44 (25–7) | RB1, hsa‐miR‐497 | hsa‐miR‐193b*, hsa‐miR‐365, hsa‐miR‐654‐3p, hsa‐miR‐424, hsa‐miR‐127‐3p, hsa‐miR‐377*, hsa‐miR‐455‐3p, hsa‐miR‐335 | miR‐192, miR‐194, miR‐17, miR‐18, miR‐19, miR‐194, miR‐199, miR‐99 |
| Phosphatidyl‐inosiol signaling | 42 (27–7) | PIK3R1, CALM1, ITPR1, has‐miR‐497 | PIK3R2, INPPL1, hsa‐miR‐335, hsa‐miR‐424 | miR‐192, miR‐17, miR‐18, miR‐19, miR‐194, miR‐199, miR‐99, miR‐329 |
| DNA repair | 27 (16–9) | FANCG, ATM | hsa‐miR‐335, hsa‐miR‐424 | miR‐192, miR‐17, miR‐18, miR‐19, miR‐154 |
| ATR | 19 (13–10) | – | – | miR‐192, miR‐17, miR‐18, miR‐19, miR‐196, miR‐99 |
| Glycolysis and Gluconeogenesis | 6 (4–5) | FBP1, G6PC, ALDH9A1 | – |
3.7. KRAS mutation analysis
We found a significantly higher frequency of KRAS mutations (84%) in the pancreatobiliary type compared to the intestinal type (47%). The KRAS mutational frequencies at the different sites of origin were; PDAC (P) 87%, bile duct (P) 75%, duodenum (I) 60%, ampulla (P) 75% and ampulla (I) 29% as presented in Table 1. The mutational status of KRAS was not significantly related to RFS and OS for any of the subgroups.
4. Discussion
The present study is the first multilevel whole‐genome analysis of PAs, with results that provide new insights into current molecular knowledge of these tumors. A limitation of our study is small sample size for each group except PDAC. The imbalance in sample size between the tumor subtypes and tumor origin is a weakness. However the hierarchical clustering, both at the mRNA and miRNA level, identified clusters based on histological subtype and is supported by statistical tests. Separated hierarchical clustering did not identify site of origin specific gene expression patterns, but was distinct in the two main histological types. No significant correlation was observed between molecular subtypes and site of origin. A larger sample size in each group is required for validating the correlation.
The result of unsupervised hierarchical clustering showed three main clusters, one cluster for the intestinal type, one for the pancreatobiliary type and one for the normal samples. However, some of the tumors from both subtypes clustered together with the normal samples. Our attempt to lower the sample selection bias may have been too liberal when including the samples with tumor cells as low as 10%. This can explain why some of the tumors from both subtypes clustered together with the normal samples. This problem with low tumor content is greatest in the pancreatobiliary type carcinomas, which characteristically grow in a highly dispersed fashion. Another well‐known problem that may explain the unexpected clustering is the heterogeneity of the tumors. Four samples had mixed morphology and the fresh tumor tissue analyzed differed from the main part of the tumor on which the diagnosis was made. As a control, the diagnosis was set on both the FFPE tissue and a frozen section of the fresh material. Three of the pancreatobiliary samples from the ampulla clustered with the intestinal samples. The three tumors had mixed morphology, and were partly poorly differentiated. The unexpected clustering according to the diagnosis of the main part of the tumor, clustered as expected according to the type of the fresh sample analyzed.
The molecular findings emphasize the importance of stratifying patients with adenocarcinomas of pancreatobiliary versus intestinal type. The two histological subtypes are targeted by specific and distinct sets of miRNA families and mRNAs. Six miRNA families are downregulated and four are upregulated in the pancreatobiliary type as compared to the intestinal type adenocarcinomas (P < 0.05). Pancreatobiliary and intestinal type adenocarcinomas do exhibit very different clinical characteristics as shown in Table 1, thus the survival differences can be attributed to both tumor characteristics and molecular differences.
Various important pathways related to PDACs have been previously documented (Jones et al., 2008). The results from the pathway analysis suggest that different pathogenic mechanisms are involved in the two histological subtypes. Wnt signaling, which is enriched only in the pancreatobiliary type, is commonly associated with pancreatic cancer development and has been linked to KRAS mutations (Zhang et al., 2013). The frequency of KRAS mutations was significantly higher in the pancreatobiliary type PAs as compared to the intestinal type. We observed some variation in the frequency between tumors from the different sites of origin, with the highest frequency of KRAS mutations in the PDACs and the lowest in the ampullary adenocarcinomas of the intestinal type.
The Insulin receptor recycling and the insulin regulation pathways, which crosstalk with the glucose metabolism and phosphatidylinositol signaling pathways, play an important role in proliferation and apoptosis (Subramani et al., 2014). These pathways are all depleted in the intestinal PAs and are unaffected in pancreatobiliary type, and this finding fits with unfavorable prognosis of pancreatobiliary type over intestinal type. Deregulation of these pathways has been reported to be associated with colon and breast cancer (Chang et al., 2013 and Giovannucci, 2001 ).
The tumor suppressor pathways (p53 and p73), the transcription factor pathway (E2F1 and RB1), PPAR‐γ and the cytokine pathways (IFN1), enriched in our study may all be potential targets for new chemotherapeutic treatment alone or in interplay between two or more signaling pathways (Sherr and McCormick, 2002).
The PPAR‐γ pathway, known to inhibit tumor growth by differentiation and apoptosis, was upregulated in the intestinal PAs. Upregulation of the PPAR pathway has been associated with shorter OS, a finding contradicting a study in pancreatic cell lines given “PPAR‐γ ligand troglitazone” which resulted in reduced growth (Kristiansen et al., 2006 and Yoshizawa et al., 2002). To clarify the role of PPAR in pancreatic cancer, further studies are needed.
Several miRNAs and mRNAs associated with improved OS and RFS for the two histopathological subtypes are reported. For the pancreatobiliary type the genes ATM, PTEN, RB1 and the miRNAs miR‐592 and miR‐497, and for the intestinal type, the genes PDPK1, PIK3R2, G6PC and the miRNAs miR‐127‐3p, miR‐377* are linked to enriched pathways and identified as prognostic markers. The miR‐17 and miR‐19 families are associated with the RB1, E2F1, TGF‐beta, P53, PI3 kinase and hedgehog signaling pathways, where the miR‐19 family is an important oncogenic component of the miR‐17 cluster (Conkrite et al., 2011, 2013, 2013 and Olive et al., 2009). The miR‐99, miR‐192, miR‐194 and miR‐215 families are all linked to IGF and p53 signaling (Chen et al., 2012, 2013 and Pichiorri et al., 2010). TGF‐beta and Wnt catenin signaling are associated with the miR‐154 family (Milosevic et al., 2012 ). miR‐196 is an important factor for HOX gene activation and function where HOX gene expression is controlled by Wnt signaling (Chen et al., 2011 and Maloof et al., 1999). The miR‐192, miR‐194 and miR‐199 families are also associated with better OS and RFS in tumors with intestinal histology in our study. Further, the two pathways ATM and ATR signaling pathways, known to crosstalk, are enriched, but to a larger extent in the intestinal PAs. ATM signaling controls DNA double strand breaks, while ATR has an important role in DNA damage control (Cimprich and Cortez, 2008; Zou et al., 2007). Cytokines (IFN1), which acts upon cell differentiation, growth, and the immune system were upregulated in all our samples, but to a higher extent in tumors of pancreatobiliary type. It has recently been shown that by combining IFN‐1 and PPAR inhibitors the antitumor effect is improved by targeting different signaling pathways with antitumor effect and tumor resistance mechanisms (Dicitore et al., 2014).
The identified miRNAs and mRNAs with prognostic significance, specific for the histopathological subtypes (P and I) enhance our understanding of the molecular basis of the PAs. Our study emphasizes the fact that PAs are distinct at the level of histopathology rather than at the level of site of origin.
There are important clinical implications of the findings of our study. Our data support the notion that prospective clinical trials on adjuvant treatment for PAs may benefit by stratifying patients based on histopathology. The histological subtypes should be taken into account when considering curative intent surgery for metastatic PAs (De Jong et al., 2010). The identified markers at the molecular level could open up for validation of predictive and prognostic biomarkers guiding in the therapeutic decision making to an individualized treatment, especially whether the patients should undergo upfront surgery or neoadjuvant treatment.
Supporting information
The following are the supplementary data related to this article:
Supplementary data
Supplementary data
Supplementary Figure S.1a Hierarchical clustering of the pancreatobiliary (n = 65) and the normal samples using the variant mRNAs identified within the pancreatobiliary subgroup.
Supplementary Figure S.1b Hierarchical clustering of the intestinal (n = 16) and the normal samples using the variant mRNAs identified within the intestinal subgroup.
Supplementary Figure S.2a Hierarchical clustering of the pancreatobiliary (n = 67) and the normal samples using the most variable miRNAs across pancreatobiliary samples.
Supplementary Figure S.2b Hierarchical clustering of the intestinal subtype (n = 16) and the normal samples using the most variable miRNAs across intestinal samples.
Supplementary Figure S.3 Kaplan–Meier curve demonstrating overall survival for patients in the five subgroups of PAs
Acknowledgments
Supported by grants from South‐Eastern Regional Health Authority, Holes Foundation and Oslo University Hospital. We thank all the patients who participated in the study.
Supplementary data 1.
1.1.
Supplementary data related to this article can be found at http://dx.doi.org/10.1016/j.molonc.2014.12.002.
Sandhu V., Bowitz Lothe I.M., Labori K.J., Lingjærde O.C., Buanes T., Dalsgaard A.M., Skrede M.L., Hamfjord J., Haaland T., Eide T.J., Børresen-Dale A.-L., Ikdahl T., Kure E.H., (2015), Molecular signatures of mRNAs and miRNAs as prognostic biomarkers in pancreatobiliary and intestinal types of periampullary adenocarcinomas, Molecular Oncology 9, doi: 10.1016/j.molonc.2014.12.002.
References
- Albores-Saavedra, J. , Simpson, K. , Dancer, Y.J. , Hruban, R. , 2007. Intestinal type adenocarcinoma: a previously unrecognized histologic variant of ductal carcinoma of the pancreas. Ann. Diagn. Pathol. 11, 3–9. [DOI] [PubMed] [Google Scholar]
- Benjamini, Y. , Hochberg, Y. , 1995. Controlling the false discovery rate: a practical and powerful approach to multiple testing. J. Roy. Stat. Soc. B. 57, 289–300. [Google Scholar]
- Berry, M.P. , Graham, C.M. , McNab, F.W. , Xu, Z. , Bloch, S.A. , Oni, T. , Wilkinson, K.A. , Banchereau, R. , Skinner, J. , Wilkinson, R.J. , Quinn, C. , Blankenship, D. , Dhawan, R. , Cush, J.J. , Mejias, A. , Ramilo, O. , Kon, O.M. , Pascual, V. , Banchereau, J. , Chaussabel, D. , O'Garra, A. , 2010. An interferon-inducible neutrophil-driven blood transcriptional signature in human tuberculosis. Nature 466, 973–977. [DOI] [PMC free article] [PubMed] [Google Scholar]
- In Bosman F.T., Carneiro F., Hruban R.H., Theise N.D.(Eds.), WHO Classification of Tumors of the Digestive System fourth Ed. International Agency for Research on Cancer; [Google Scholar]
- Chang, W.W. , Lin, R.J. , Yu, J. , Chang, W.Y. , Fu, C.H. , Lai, A.C. , Yu, J.C. , Yu, A.L. , 2013. The expression and significance of insulin-like growth factor-1 receptor and its pathway on breast cancer stem/progenitors. Breast Cancer Res. BCR. 15, R39 [DOI] [PMC free article] [PubMed] [Google Scholar]
- Chen, C. , Zhang, Y. , Zhang, L. , Weakley, S.M. , Yao, Q. , 2011. MicroRNA-196: critical roles and clinical applications in development and cancer. J. Cell. Mol. Med. 15, 14–23. [DOI] [PMC free article] [PubMed] [Google Scholar]
- Chen, Z. , Jin, Y. , Yu, D. , Wang, A. , Mahjabeen, I. , Wang, C. , Liu, X. , Zhou, X. , 2012. Down-regulation of the microRNA-99 family members in head and neck squamous cell carcinoma. Oral Oncol. 48, 686–691. [DOI] [PMC free article] [PubMed] [Google Scholar]
- Cimprich, K.A. , Cortez, D. , 2008. ATR: an essential regulator of genome integrity. Nat. Rev. Mol. Cel. Biol. 9, 616–627. [DOI] [PMC free article] [PubMed] [Google Scholar]
- Collisson, E.A. , Sadanandam, A. , Olson, P. , Gibb, W.J. , Truitt, M. , Gu, S. , Cooc, J. , Weinkle, J. , Kim, G.E. , Jakkula, L. , Feiler, H.S. , Ko, A.H. , Olshen, A.B. , Danenberg, K.L. , Tempero, M.A. , Spellman, P.T. , Hanahan, D. , Gray, J.W. , 2011. Subtypes of pancreatic ductal adenocarcinoma and their differing responses to therapy. Nat. Med. 17, 500–503. [DOI] [PMC free article] [PubMed] [Google Scholar]
- Conkrite, K. , Sundby, M. , Mukai, S. , Thomson, J.M. , Mu, D. , Hammond, S.M. , MacPherson, D. , 2011. miR-17∼92 cooperates with RB pathway mutations to promote retinoblastoma. Genes Dev. 25, 1734–1745. [DOI] [PMC free article] [PubMed] [Google Scholar]
- De Jong, M.C. , Tsai, S. , Cameron, J.L. , Wolfgang, C.L. , Hirose, K. , van Vledder, M.G. , Eckhauser, F. , Herman, J.M. , Edil, B.H. , Choti, M.A. , Schulick, R.D. , Pawlik, T.M. , 2010. Safety and efficacy of curative intent surgery for peri-ampullary liver metastasis. J. Surg. Oncol. 102, 256–263. [DOI] [PubMed] [Google Scholar]
- Dicitore, A. , Caraglia, M. , Gaudenzi, G. , Manfredi, G. , Amato, B. , Mari, D. , Persani, L. , Arra, C. , Vitale, G. , 2014. Type I interferon-mediated pathway interacts with peroxisome proliferator activated receptor-gamma (PPAR-gamma): at the cross-road of pancreatic cancer cell proliferation. Biochim. Biophys. Acta 1845, 42–52. [DOI] [PubMed] [Google Scholar]
- Donahue, T.R. , Tran, L.M. , Hill, R. , Li, Y. , Kovochich, A. , Calvopina, J.H. , Patel, S.G. , Wu, N. , Hindoyan, A. , Farrell, J.J. , Li, X. , Dawson, D.W. , Wu, H. , 2012. Integrative survival-based molecular profiling of human pancreatic cancer. Clin. Cancer Res. official J. Am. Assoc. Cancer Res. 18, 1352–1363. [DOI] [PMC free article] [PubMed] [Google Scholar]
- Dweep, H. , Sticht, C. , Pandey, P. , Gretz, N. , 2011. miRWalk-database: prediction of possible miRNA binding sites by “walking” the genes of three genomes. J. Biomed. Inform. 44, 839–847. [DOI] [PubMed] [Google Scholar]
- Gentleman, R.C. , Carey, V.J. , Bates, D.M. , Bolstad, B. , Dettling, M. , Dudoit, S. , Ellis, B. , Gautier, L. , Ge, Y. , Gentry, J. , Hornik, K. , Hothorn, T. , Huber, W. , Iacus, S. , Irizarry, R. , Leisch, F. , Li, C. , Maechler, M. , Rossini, A.J. , Sawitzki, G. , Smith, C. , Smyth, G. , Tierney, L. , Yang, J.Y. , Zhang, J. , 2004. Bioconductor: open software development for computational biology and bioinformatics. Genome Biol. 5, R80 [DOI] [PMC free article] [PubMed] [Google Scholar]
- Giovannucci, E. , 2001. Insulin, insulin-like growth factors and colon cancer: a review of the evidence. J. Nutr. 131, 3109S–3120S. [DOI] [PubMed] [Google Scholar]
- Hamfjord, J. , Stangeland, A.M. , Skrede, M.L. , Tveit, K.M. , Ikdahl, T. , Kure, E.H. , 2011. Wobble-enhanced ARMS method for detection of KRAS and BRAF mutations. Diagn. Mol. Pathol. Am. J. Surg. Pathol. part B 20, 158–165. [DOI] [PubMed] [Google Scholar]
- Hamilton, M.P. , Rajapakshe, K. , Hartig, S.M. , Reva, B. , McLellan, M.D. , Kandoth, C. , Ding, L. , Zack, T.I. , Gunaratne, P.H. , Wheeler, D.A. , Coarfa, C. , McGuire, S.E. , 2013. Identification of a pan-cancer oncogenic microRNA superfamily anchored by a central core seed motif. Nat. Commun. 4, 2730 [DOI] [PMC free article] [PubMed] [Google Scholar]
- Jones, S. , Zhang, X. , Parsons, D.W. , Lin, J.C. , Leary, R.J. , Angenendt, P. , Mankoo, P. , Carter, H. , Kamiyama, H. , Jimeno, A. , Hong, S.M. , Fu, B. , Lin, M.T. , Calhoun, E.S. , Kamiyama, M. , Walter, K. , Nikolskaya, T. , Nikolsky, Y. , Hartigan, J. , Smith, D.R. , Hidalgo, M. , Leach, S.D. , Klein, A.P. , Jaffee, E.M. , Goggins, M. , Maitra, A. , Iacobuzio-Donahue, C. , Eshleman, J.R. , Kern, S.E. , Hruban, R.H. , Karchin, R. , Papadopoulos, N. , Parmigiani, G. , Vogelstein, B. , Velculescu, V.E. , Kinzler, K.W. , 2008. Core signaling pathways in human pancreatic cancers revealed by global genomic analyses. Science 321, 1801–1806. [DOI] [PMC free article] [PubMed] [Google Scholar]
- Kimura, W. , Futakawa, N. , Yamagata, S. , Wada, Y. , Kuroda, A. , Muto, T. , Esaki, Y. , 1994. Different clinicopathologic findings in two histologic types of carcinoma of papilla of Vater. Jpn. J. Cancer Res. Gann 85, 161–166. [DOI] [PMC free article] [PubMed] [Google Scholar]
- Kristiansen, G. , Jacob, J. , Buckendahl, A.C. , Grutzmann, R. , Alldinger, I. , Sipos, B. , Kloppel, G. , Bahra, M. , Langrehr, J.M. , Neuhaus, P. , Dietel, M. , Pilarsky, C. , 2006. Peroxisome proliferator-activated receptor gamma is highly expressed in pancreatic cancer and is associated with shorter overall survival times. Clin. Cancer Res. official J. Am. Assoc. Cancer Res. 12, 6444–6451. [DOI] [PubMed] [Google Scholar]
- Lopez-Romero, P. , 2011. Pre-processing and differential expression analysis of Agilent microRNA arrays using the AgiMicroRna Bioconductor library. BMC genomics 12, 64 [DOI] [PMC free article] [PubMed] [Google Scholar]
- Maloof, J.N. , Whangbo, J. , Harris, J.M. , Jongeward, G.D. , Kenyon, C. , 1999. A Wnt signaling pathway controls hox gene expression and neuroblast migration in C. elegans . Development 126, 37–49. [DOI] [PubMed] [Google Scholar]
- Milosevic, J. , Pandit, K. , Magister, M. , Rabinovich, E. , Ellwanger, D.C. , Yu, G. , Vuga, L.J. , Weksler, B. , Benos, P.V. , Gibson, K.F. , McMillan, M. , Kahn, M. , Kaminski, N. , 2012. Profibrotic role of miR-154 in pulmonary fibrosis. Am. J. Respir. Cel. Mol. Biol. 47, 879–887. [DOI] [PMC free article] [PubMed] [Google Scholar]
- MSigDb: http://www.broadinstitute.org/gsea/msigdb/index.jsp (version v4.0 revised on May 31, 2013).
- Murphy, B.L. , Obad, S. , Bihannic, L. , Ayrault, O. , Zindy, F. , Kauppinen, S. , Roussel, M.F. , 2013. Silencing of the miR-17∼92 cluster family inhibits medulloblastoma progression. Cancer Res. 73, 7068–7078. [DOI] [PMC free article] [PubMed] [Google Scholar]
- Neoptolemos, J.P. , Moore, M.J. , Cox, T.F. , Valle, J.W. , Palmer, D.H. , McDonald, A.C. , Carter, R. , Tebbutt, N.C. , Dervenis, C. , Smith, D. , Glimelius, B. , Charnley, R.M. , Lacaine, F. , Scarfe, A.G. , Middleton, M.R. , Anthoney, A. , Ghaneh, P. , Halloran, C.M. , Lerch, M.M. , Olah, A. , Rawcliffe, C.L. , Verbeke, C.S. , Campbell, F. , Buchler, M.W. , European Study Group for Pancreatic, C2012. Effect of adjuvant chemotherapy with fluorouracil plus folinic acid or gemcitabine vs observation on survival in patients with resected periampullary adenocarcinoma: the ESPAC-3 periampullary cancer randomized trial. JAMA: J. Am. Med. Assoc. 308, 147–156. [DOI] [PubMed] [Google Scholar]
- Neoptolemos, J.P. , Stocken, D.D. , Bassi, C. , Ghaneh, P. , Cunningham, D. , Goldstein, D. , Padbury, R. , Moore, M.J. , Gallinger, S. , Mariette, C. , Wente, M.N. , Izbicki, J.R. , Friess, H. , Lerch, M.M. , Dervenis, C. , Olah, A. , Butturini, G. , Doi, R. , Lind, P.A. , Smith, D. , Valle, J.W. , Palmer, D.H. , Buckels, J.A. , Thompson, J. , McKay, C.J. , Rawcliffe, C.L. , Buchler, M.W. , European Study Group for Pancreatic, C2010. Adjuvant chemotherapy with fluorouracil plus folinic acid vs gemcitabine following pancreatic cancer resection: a randomized controlled trial. JAMA: J. Am. Med. Assoc. 304, 1073–1081. [DOI] [PubMed] [Google Scholar]
- Neoptolemos, J.P. , Stocken, D.D. , Friess, H. , Bassi, C. , Dunn, J.A. , Hickey, H. , Beger, H. , Fernandez-Cruz, L. , Dervenis, C. , Lacaine, F. , Falconi, M. , Pederzoli, P. , Pap, A. , Spooner, D. , Kerr, D.J. , Buchler, M.W. , European Study Group for Pancreatic, C2004. A randomized trial of chemoradiotherapy and chemotherapy after resection of pancreatic cancer. New Engl. J. Med. 350, 1200–1210. [DOI] [PubMed] [Google Scholar]
- Oettle, H. , Neuhaus, P. , Hochhaus, A. , Hartmann, J.T. , Gellert, K. , Ridwelski, K. , Niedergethmann, M. , Zulke, C. , Fahlke, J. , Arning, M.B. , Sinn, M. , Hinke, A. , Riess, H. , 2013. Adjuvant chemotherapy with gemcitabine and long-term outcomes among patients with resected pancreatic cancer: the CONKO-001 randomized trial. JAMA: J. Am. Med. Assoc. 310, 1473–1481. [DOI] [PubMed] [Google Scholar]
- Oettle, H. , Post, S. , Neuhaus, P. , Gellert, K. , Langrehr, J. , Ridwelski, K. , Schramm, H. , Fahlke, J. , Zuelke, C. , Burkart, C. , Gutberlet, K. , Kettner, E. , Schmalenberg, H. , Weigang-Koehler, K. , Bechstein, W.O. , Niedergethmann, M. , Schmidt-Wolf, I. , Roll, L. , Doerken, B. , Riess, H. , 2007. Adjuvant chemotherapy with gemcitabine vs observation in patients undergoing curative-intent resection of pancreatic cancer: a randomized controlled trial. JAMA: J. Am. Med. Assoc. 297, 267–277. [DOI] [PubMed] [Google Scholar]
- Olive, V. , Bennett, M.J. , Walker, J.C. , Ma, C. , Jiang, I. , Cordon-Cardo, C. , Li, Q.J. , Lowe, S.W. , Hannon, G.J. , He, L. , 2009. miR-19 is a key oncogenic component of mir-17-92. Genes Dev. 23, 2839–2849. [DOI] [PMC free article] [PubMed] [Google Scholar]
- Overman, M.J. , Zhang, J. , Kopetz, S. , Davies, M. , Zhi-Qin, J. , Stemke-Hale, K. , Rummele, P. , Pilarsky, C. , Grutzmann, R. , Hamilton, S. , Hwang, R. , Abbruzzese, J.L. , Varadhachary, G. , Broom, B. , Wang, H. , 2013. Gene expression profiling of ampullary carcinomas classifies ampullary carcinomas into biliary-like and intestinal-like subtypes that are prognostic of outcome. PloS One 8, e65144 [DOI] [PMC free article] [PubMed] [Google Scholar]
- Pichiorri, F. , Suh, S.S. , Rocci, A. , De Luca, L. , Taccioli, C. , Santhanam, R. , Zhou, W. , Benson, D.M. , Hofmainster, C. , Alder, H. , Garofalo, M. , Di Leva, G. , Volinia, S. , Lin, H.J. , Perrotti, D. , Kuehl, M. , Aqeilan, R.I. , Palumbo, A. , Croce, C.M. , 2010. Downregulation of p53-inducible microRNAs 192, 194, and 215 impairs the p53/MDM2 autoregulatory loop in multiple myeloma development. Cancer cell 18, 367–381. [DOI] [PMC free article] [PubMed] [Google Scholar] [Retracted]
- Saldanha, A.J. , 2004. Java Treeview–extensible visualization of microarray data. Bioinformatics 20, 3246–3248. [DOI] [PubMed] [Google Scholar]
- Sherr, C.J. , McCormick, F. , 2002. The RB and p53 pathways in cancer. Cancer cell 2, 103–112. [DOI] [PubMed] [Google Scholar]
- Smyth, G.K. , 2004. Linear models and empirical bayes methods for assessing differential expression in microarray experiments. Stat. Appl. Genet. Mol. Biol. 3, Article3 [DOI] [PubMed] [Google Scholar]
- Smyth, G.K. , Michaud, J. , Scott, H.S. , 2005. Use of within-array replicate spots for assessing differential expression in microarray experiments. Bioinformatics 21, 2067–2075. [DOI] [PubMed] [Google Scholar]
- Sobin, L.H. , Gospodarowicz, M.K. , Wittekind, Ch. , International Union against Cancer, 2009. Classification of Malignant Tumorus seventh ed. Wiley-BlackWell; Hoboken, NJ: [Google Scholar]
- Subramani, R. , Lopez-Valdez, R. , Arumugam, A. , Nandy, S. , Boopalan, T. , Lakshmanaswamy, R. , 2009. Targeting insulin-like growth factor 1 receptor inhibits pancreatic cancer growth and metastasis. PloS One 9, e97016 [DOI] [PMC free article] [PubMed] [Google Scholar]
- Subramanian, A. , Tamayo, P. , Mootha, V.K. , Mukherjee, S. , Ebert, B.L. , Gillette, M.A. , Paulovich, A. , Pomeroy, S.L. , Golub, T.R. , Lander, E.S. , Mesirov, J.P. , 2005. Gene set enrichment analysis: a knowledge-based approach for interpreting genome-wide expression profiles. Proc. Natl. Acad. Sci. United States America 102, 15545–15550. [DOI] [PMC free article] [PubMed] [Google Scholar]
- Therneau, Terry M. , Grambsch, Patricia M. , 2000. Modeling Survival Data: Extending the Cox Model Springer; New York: 0-387-98784-3 [Google Scholar]
- Thomas, J.K. , Kim, M.S. , Balakrishnan, L. , Nanjappa, V. , Raju, R. , Marimuthu, A. , Radhakrishnan, A. , Muthusamy, B. , Khan, A.A. , Sakamuri, S. , Tankala, S.G. , Singal, M. , Nair, B. , Sirdeshmukh, R. , Chatterjee, A. , Prasad, T.S. , Maitra, A. , Gowda, H. , Hruban, R.H. , Pandey, A. , 2014. Pancreatic Cancer Database: an integrative resource for pancreatic cancer. Cancer Biol. Ther. 15, [DOI] [PMC free article] [PubMed] [Google Scholar]
- Westgaard, A. , Pomianowska, E. , Clausen, O.P. , Gladhaug, I.P. , 2013. Intestinal-type and pancreatobiliary-type adenocarcinomas: how does ampullary carcinoma differ from other periampullary malignancies?. Ann. Surg. Oncol. 20, 430–439. [DOI] [PubMed] [Google Scholar]
- Westgaard, A. , Tafjord, S. , Farstad, I.N. , Cvancarova, M. , Eide, T.J. , Mathisen, O. , Clausen, O.P. , Gladhaug, I.P. , 2008. Pancreatobiliary versus intestinal histologic type of differentiation is an independent prognostic factor in resected periampullary adenocarcinoma. BMC cancer 8, 170 [DOI] [PMC free article] [PubMed] [Google Scholar]
- Winter, J.M. , Brennan, M.F. , Tang, L.H. , D'Angelica, M.I. , Dematteo, R.P. , Fong, Y. , Klimstra, D.S. , Jarnagin, W.R. , Allen, P.J. , 2012. Survival after resection of pancreatic adenocarcinoma: results from a single institution over three decades. Ann. Surg. Oncol. 19, 169–175. [DOI] [PubMed] [Google Scholar]
- Yoshizawa, K. , Cioca, D.P. , Kawa, S. , Tanaka, E. , Kiyosawa, K. , 2002. Peroxisome proliferator-activated receptor gamma ligand troglitazone induces cell cycle arrest and apoptosis of hepatocellular carcinoma cell lines. Cancer 95, 2243–2251. [DOI] [PubMed] [Google Scholar]
- Zhang, Y. , Morris, J.P.t. , Yan, W. , Schofield, H.K. , Gurney, A. , Simeone, D.M. , Millar, S.E. , Hoey, T. , Hebrok, M. , Pasca di Magliano, M. , 2013. Canonical wnt signaling is required for pancreatic carcinogenesis. Cancer Res. 73, 4909–4922. [DOI] [PMC free article] [PubMed] [Google Scholar]
- Zou, L. , 2007. Single- and double-stranded DNA: building a trigger of ATR-mediated DNA damage response. Genes Dev. 21, 879–885. [DOI] [PubMed] [Google Scholar]
Associated Data
This section collects any data citations, data availability statements, or supplementary materials included in this article.
Supplementary Materials
The following are the supplementary data related to this article:
Supplementary data
Supplementary data
Supplementary Figure S.1a Hierarchical clustering of the pancreatobiliary (n = 65) and the normal samples using the variant mRNAs identified within the pancreatobiliary subgroup.
Supplementary Figure S.1b Hierarchical clustering of the intestinal (n = 16) and the normal samples using the variant mRNAs identified within the intestinal subgroup.
Supplementary Figure S.2a Hierarchical clustering of the pancreatobiliary (n = 67) and the normal samples using the most variable miRNAs across pancreatobiliary samples.
Supplementary Figure S.2b Hierarchical clustering of the intestinal subtype (n = 16) and the normal samples using the most variable miRNAs across intestinal samples.
Supplementary Figure S.3 Kaplan–Meier curve demonstrating overall survival for patients in the five subgroups of PAs