

Abstract
Metastatic colorectal cancer (CRC) is complex clinical challenge for which there are limited treatment options. Chemotherapy with or without surgery provides moderate improvements in overall survival and quality of life; nevertheless the 5‐year survival remains below 30%. Oncolytic vaccinia virus (VV) shows strong anti‐tumour activity in models of CRC, however transient delays in disease progression are insufficient to lead to long‐term survival. Here we examined the efficacy of VV with oxaliplatin or SN‐38 (active metabolite of irinotecan) in CRC cell lines in vitro and VV with irinotecan in an orthotopic model of metastatic CRC. Synergistic improvements in in vitro cell killing were observed in multiple cell lines. Combination therapy was well tolerated in tumour‐bearing mice and the median survival was significantly increased relative to monotherapy despite a drug‐dependent decrease in the mean tumour titer. Increased apoptosis following in vitro and in vivo combination therapy was observed. In vitro cell cycle analysis showed increases in S‐phase cells following infection occurred in both infected and uninfected cell populations. This corresponded to a 4‐fold greater increase in apoptosis in the uninfected compared to infected cells following combination therapy. Combination treatment strategies are among the best options for patients with advanced cancers. VV is currently under clinical investigation in patients with CRC and the data presented here suggest that its combination with irinotecan may provide benefit to a subset of CRC patients. Further, investigation of this combination is necessary to determine the tumour characteristics responsible for mediating synergy.
Keywords: Double‐deleted vaccinia virus, Oncolytic virotherapy, Metastatic colorectal cancer, Chemotherapy, Orthotopic tumour model, Combination therapy
Abbreviations
- CRC
colorectal cancer
- MOA
mechanism of action
- OV
oncolytic virus
- VV
vaccinia virus
- OX
oxaliplatin
- CPT-11
irinotecan
- 5-FU
5-fluorouracil
- LV
leucovorin
- CI
combination index
- Fa
fraction affected
- IP
intraperitoneal
- MOI
multiplicity of infection
- IHC
immunohistochemistry
- PFU
plaque forming unit
- RFP
red fluorescent protein
- TNF
tumour necrosis factor
- TRAIL
tumour necrosis factor-related apoptosis inducing ligand
- PFA
paraformaldehyde
- 7-AAD
7-Aminoactinomycin D
- HBSS
Hank's Balanced Salt Solution
- dpi
days post-infection
- SD
standard deviation
- SEM
standard error of the mean
1. Introduction
Cancer is a complex and heterogeneous disease for which successful treatment regimens are rarely simple. Today, there are few chemotherapeutics administered alone. Combination chemotherapy and multi‐modality cancer treatment strategies (surgery and/or radiation therapy) have significantly improved survival for many cancer types; unfortunately, for advanced diseases such as metastatic colorectal cancer (CRC), these traditional approaches are still inadequate (Brenner et al., 2014) for the majority of patients. Novel combination therapy strategies that include targeted agents with multiple mechanisms of action (MOAs), increased specificity and decreased toxicity are required to improve outcomes in diseases where effective traditional therapies are lacking.
Oncolytic viruses (OVs) are tumour‐specific agents that take advantage of the many deregulated pathways characteristic of malignant cells. OVs have multi‐mechanistic modes of action, including direct oncolysis, induction of anti‐tumour immune responses (Greiner et al., 2006; Sobol et al., 2010), and anti‐angiogenesis (Breitbach et al., 2011, 2007). OVs have been studied in a wide variety of preclinical models and show promising results in early phase clinical trials (Patel and Kratzke, 2013). As with the vast majority of cancer therapies, OVs are unlikely to be delivered alone but rather as part of a rationally designed, combination therapy regimen (Ottolino‐Perry et al., 2010). OVs have been combined with surgical resection (Acuna et al., 2014; Gholami et al., 2013; Nakano et al., 2005; Tai et al., 2013), radiation (Advani et al., 2012; Mansfield et al., 2013), and numerous chemotherapy drugs (Cherubini et al., 2011; Gutermann et al., 2006; Heinemann et al., 2011; Huang et al., 2011; Maitra et al., 2014; Takakura et al., 2010; Zaoui et al., 2012; Ziauddin et al., 2010) in preclinical models. Combination OV and chemotherapy studies have demonstrated that particular combinations can be highly synergistic in specific tumour models. In many cases it is still unclear what exact MOA underlies these synergistic interactions.
In this study we investigate the efficacy of an attenuated oncolytic vaccinia virus (VV) combined with chemotherapy in models of colorectal carcinomatosis; a clinically challenging, locally disseminated disease with limited treatment options. Currently, the 5‐year survival rate in patients with inoperable tumours is less than 10% (Brenner et al., 2014). CRC chemotherapy drugs including oxaliplatin (OX) a platinum‐based DNA‐crosslinker, irinotecan (also known as CPT‐11) which is activated by hydrolysis to SN‐38 a topoisomerase I inhibitor, and 5‐fluorouracil (5‐FU)/leucovorin (LV) a pyrimidine analog and its enhancer, are used to reduce tumour burden and palliate symptoms. Addition of OX and CPT‐11 to the standard 5‐FU regimen has significantly improved survival in patients with peritoneally disseminated CRC (Kerscher et al., 2013). Furthermore, intraoperative heated intraperitoneal chemotherapy with a combination of 5‐FU, LV, OX and/or mitomycin C (DNA‐crosslinker) has resulted in reported 5‐year survival rates between 19 and 31% in select patient populations (Kuijpers et al., 2013).
It has previously been shown that OX synergistically improves killing in CRC cells when combined with VV expressing tumour necrosis factor (TNF)‐related apoptosis inducing ligand (TRAIL) (Ziauddin et al., 2010). Combination therapy significantly increased induction of apoptosis and improved survival relative to monotherapy in models of disseminated CRC in a transgene‐dependent manner. Other platinum‐based agents have also been shown to synergize with VV primarily through enhanced anti‐tumour immune responses (Song et al., 2007; Yu et al., 2009). While CPT‐11 has been demonstrated to interact synergistically with oncolytic herpes simplex virus (Gutermann et al., 2006), adenovirus (Cherubini et al., 2011) and reovirus (Maitra et al., 2014) its effect when combined with oncolytic VV is unknown.
We have previously shown that ‘double‐deleted’ VV (vvDD) (McCart et al., 2001) significantly improved survival in peritoneally disseminated models of metastatic CRC, however no long term survival was observed (Ottolino‐Perry et al., 2014). In this study we identify virus/drug combinations that exhibit synergistic interactions and uncover a novel mechanism of virus‐induced sensitization to CPT‐11 therapy. Additionally, we report improved survival with combination therapy in an orthotopic model of metastatic CRC.
2. Materials and methods
2.1. Cells lines and drugs
Human colorectal adenocarcinoma (HT29 and DLD1) and monkey kidney fibroblast (CV‐1) cell lines were obtained from the American Type Culture Collection (ATCC; Manassas, VA). MC38 murine colorectal adenocarcinoma and 24‐JK murine sarcoma cell lines were obtained from National Institutes of Health (Bethesda, Maryland, USA). Cells were cultured in Dulbecco's Modified Eagle Medium (DMEM; Sigma Aldrich, St. Louis, MO, USA) supplemented with 10% (v/v) heat‐inactivated fetal bovine serum (FBS; PAA Laboratories, Etobicoke, ON, Canada) and 1% antibiotic‐antimycotic (Invitrogen, GIBCO, Grand Island, NY, USA) at 37°C with 5% CO2. Stocks of oxaliplatin (0.5 mg/ml in water; Sigma Aldrich) and SN38 (1 mg/ml in dimethyl sulfoxide; Sigma Aldrich) were stored at −20°C. Clinical grade CPT‐11 (20 mg/ml; Princess Margaret Hospital Pharmacy, University Health Network) used in in vivo studies, was stored at 4°C and used within 3 weeks of dispensing.
2.2. Vaccinia virus
Vaccinia virus expressing the human somatostatin receptor (SR) and red fluorescent protein (RFP) under control of the p7.5 and Psel promoters, respectively, was generated as previously described (McCart et al., 2004; Ottolino‐Perry et al., 2014). Virus was propagated in 24‐JK cells and purified by ultracentrifugation over a sucrose cushion. Virus was titered on CV‐1 cells and stored at −80°C.
2.3. In vitro dose response
Cells were seeded in 96‐well plates and incubated overnight. For simultaneous therapy, cells were pre‐infected with vvDD‐SR‐RFP using low‐serum DMEM (2.5% FBS) at low volume (25 μl). Plates were incubated for 2 hours (h) with shaking then supplemented with DMEM (10% FBS) containing increasing drug concentrations and incubated for 72 h. For virus pre‐treatment experiments, pre‐infection was performed as above, after which wells were supplemented with 75 μl DMEM (10% FBS) and incubated for 24 h prior to addition of drug (25 μl). In drug pre‐treatment experiments, cells were treated with drug 24 h prior to pre‐infection, performed as above. All experiments used a fixed‐ratio dose escalation. Seventy‐two hours after the final treatment, cell viability was assessed by 3‐(4,5‐dimethyl‐2‐yl)‐5‐(3‐carboxymethoxyphenyl)‐2‐(4‐sulfophenyl)‐2H‐tetrazolium (MTS) assay (CellTiter96® Aqueous One Solution, Promega, Madison, WI, USA) according to the manufacturers protocol. Experiments were performed in quadruplicate and three individual experiments were carried out for each cell line and drug.
2.4. Combination index
The Chou and Talalay method (Chou and Talalay, 1984) for quantifying drug–drug interactions was used. Data from individual dose response experiments was used to calculate the combination index (CI) over a range of fraction‐affected (Fa) values. The average CI values for three experiments were plotted in Fa–CI plots where CI = 1 is additive, CI < 1 is synergistic and CI > 1 is antagonistic.
2.5. Fluorescence microscopy
Infected cells were imaged using a Zeiss AxioObserver microscope (Carl Zeiss, Oberkochen, Germany) equipped with a Series 120Q Fluorescence Illumination unit (EXFO, Quebec City, QC, Canada). Images were acquired with a Coolsnap HQ camera (Roper Scientific, Tucson, AZ, USA).
2.6. Virus replication
Cells were seeded in 6‐well plates at 5 × 10⁵/well and incubated overnight. Pre‐infection was performed at a multiplicity of infection (MOI) of 0.1 for 2 h in 0.5 ml low‐serum DMEM with shaking. Cells were supplemented with drug‐containing medium (at indicated doses) or medium alone. Cells and supernatant were collected at indicated time points. Samples underwent three freeze–thaw cycles and sonication to release virus particles. Virus was quantified by plaque assay on CV‐1 cells.
2.7. Flow cytometry
Treated cells were harvested, washed in PBS and stained with Annexin V‐FITC (Biolegend, San Diego, CA, USA) and 7‐Aminoactinomycin D (7‐AAD; Biolegend) as per the manufacturer's protocol. Triplicates for each treatment group were run and 20 000 events per sample were collected using a FACScan Flow Cytometer (Becton, Dickinson and Company, Franklin Lakes, NJ, USA) and analyzed (BD Cell QuestPro software). To analyze the cell cycle, treated cells were harvested, washed in PBS and fixed in a 1% paraformaldehyde (PFA) solution on ice for 1 h. PFA was removed and cells were washed with PBS, resuspended in ice cold 70% ethanol and incubated overnight or until further analysis. Ethanol was removed and cells were washed with PBS prior to staining with 4′6‐diamidino‐2‐phenylindole (DAPI) solution (1 ug/ml in 0.1% Triton‐X‐100, Bioshop, Burlington, ON, Canada). Cells were incubated for 30 min at room temperature and analyzed on a BD LSRFortessa cell analyzer (Becton, Dickinson and Company). Cell cycle modeling was performed ModFit LT software (Verify Software House, Topsham, ME, USA).
2.8. Mice
Mice were housed under standard conditions and given food and water ad lib. Protocols were approved by the Animal Care Centre, UHN, Toronto, Canada. Female BALB/c Nu/Nu (Taconic Farms Inc., Hudson, NY, USA) mice were injected intraperitoneally (IP) with 5 × 10⁶ DLD1 cells. CPT‐11 (40 mg/kg) was delivered IP on days 10, 14, 18 and 22 and virus (109 plaque forming units; pfu) was given IP on day 12. Control mice received IP injections of Hank's Balanced Salt Solution (HBSS; Invitrogen, GIBCO) on the same schedule as combination treated mice. Mice were sacrificed at time points indicated and blood/tissues were collected for toxicology, biodistribution and immunohistochemistry (IHC) studies.
2.9. Blood work
Complete blood counts were performed using a HEMAVET® Multispecies Hematology Analyzer (Drew Scientific, Dallas, TX, USA). Liver enzyme biochemistry analysis was performed on a VETSCAN VS2 (Abaxis, Union City, CA, USA) using the Comprehensive Diagnostic Profile (Abaxis).
2.10. Virus biodistribution
Tissues were collected 6 days post‐infection (dpi) and stored at −80°C in HBSS. Samples were homogenized using a TissueLyzer II (Qiagen, Hilden, Germany), underwent three freeze–thaw cycles and sonication prior to titering on CV‐1 cells.
2.11. Immunohistochemistry
Tissues were fixed in 10% formalin for 72 h then transferred to 70% ethanol. Samples were paraffin embedded, sectioned and stained using the following primary antibodies: polyclonal goat anti‐mouse CD31 (PECAM‐1 M‐20, SC‐1506, 1/2000 dilution; Serotec, Raleigh, NC, USA), polyclonal rabbit anti‐VV (ab35219, dilution 1/1000, Abcam, Cambridge, MA, USA), polyclonal rabbit anti‐cleaved caspase 3 (cat# 9661, dilution 1/600, Cell Signaling, Danvers, MA, USA) and monoclonal rat anti‐mouse F4/80 (MCA497GA clone A3.1, dilution 1/2000, Serotec). Slides were scanned using ScanScope XT (Aperio Technologies, Vista, CA, USA) and staining was quantified using ImageScope's Positive Pixel algorithm (Aperio Technologies). Specifically, regions of interest were drawn around individual tumours and the software calculated the number of positive pixels relative to the total number of pixels per tumour section (% positive).
2.12. Statistical analysis
Data were analyzed using the Student's two‐tailed t‐test or one‐way ANOVA were applicable. Survival curves were analyzed by OASIS (online application for survival analysis; http://sbi.postech.ac.kr/oasis/surv) (Yang et al., 2011) using a weighted log‐rank test (rho = 0, gamma = 1). All other statistical analysis was performed using Prism 5 Software (GraphPad Software, Inc., La Jolla, CA, USA). Data are presented as the mean ± SD or SEM and statistical significance was defined as p < 0.05.
3. Results
3.1. Vaccinia virus synergizes with chemotherapy in CRC cell lines
Cell viability was determined following treatment of human (HT29, DLD1) and mouse (MC38) CRC cell lines with vvDD and OX or SN‐38 (active metabolite of CPT‐11) alone or in combination. Cells were treated at increasing doses (fixed ratio) of virus and/or drug and assayed for cell viability at 72 h post treatment (Figure 1). Cell lines were differentially susceptible to individual therapies, with MC38 and HT29 cells showing increased sensitivity to SN‐38 (IC50 0.4 μM ± 0.2 and 0.25 μM ± 0.06, respectively) and OX (23 μM ± 2 and 63 μM ± 18, respectively) compared to DLD1 cells (IC50 8 μM ± 3 and 78 μM ± 27, respectively).
Figure 1.
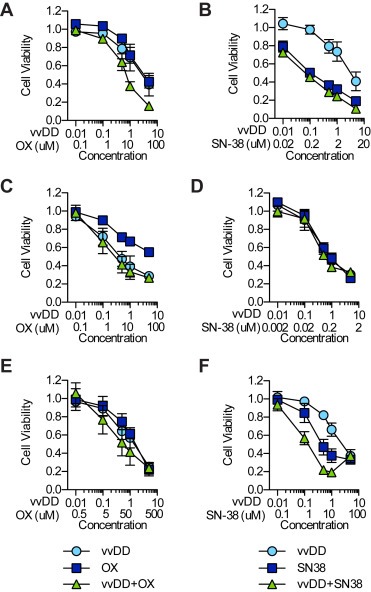
Combination VV and chemotherapy in CRC cells. Cells were treated simultaneously with vvDD and OX (A, C, E) or SN‐38 (B, D, F) alone or in combination at a fixed concentration ratio. Cell viability was assessed 72 h post treatment by MTS assay. Shown is the average viability from three independent experiments ± SEM.
The Chou–Talalay method for determining drug–drug interactions (Chou and Talalay, 1984) was used to analyze the data from three independent experiments (presented in Figure 1) the results of which are presented in Fa–CI plots (Figure 2). When administered simultaneously vvDD interacted synergistically with OX over a wide range of Fa values in MC38 cells [(CI)0.1 = 0.83 ± 0.06 to (CI)0.9 = 0.70 ± 0.07] (Figure 2A) while only displaying synergy at lower Fa values in HT29 [(CI)0.1 = 0.52 ± 0.09 to (CI)0.9 = 1.065 ± 0.002] (Figure 2C) and DLD1 [(CI)0.1 = 0.6 ± 0.3 to (CI)0.9 = 2.5 ± 0.9] (Figure 2E) cells. Pretreatment with either virus or OX had little effect on synergy relative to simultaneous treatment in both MC38 and HT29 cells. In DLD1 cells, pretreatment with either agent improved synergy at higher Fa values relative to simultaneous treatment. Combination therapy with SN38 was extremely antagonistic in MC38 cells at low Fa values [(CI)0.1 not shown] but synergistic at higher values [(CI)0.1 = 27 ± 18 to (CI)0.9 = 0.30 ± 0.08]. The opposite relationship between dose and synergy was observed in HT29 cells [(CI)0.1 = 0.3 ± 0.2 to (CI)0.9 = 17 ± 15]. DLD1 cells showed consistently strong synergism between vvDD and SN38 over all fractions affected following both simultaneous treatment [(CI)0.1 = 0.5 ± 0.3 to (CI)0.9 = 0.4 ± 0.2] and virus pretreatment [(CI)0.1 = 0.5 ± 0.1 to (CI)0.9 = 0.6 ± 0.1]. Based on these data, the combination of vvDD and CPT‐11 was selected for further study in vivo.
Figure 2.
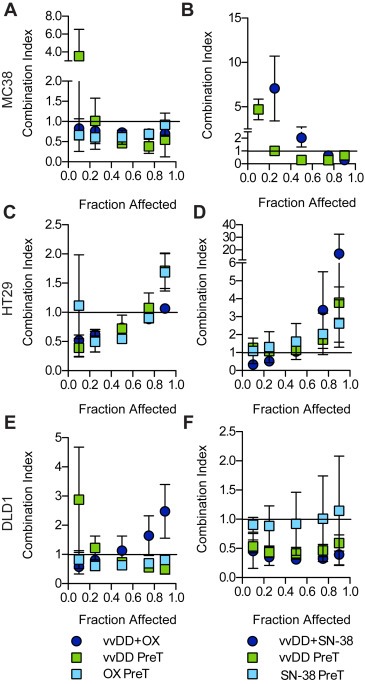
Characterization of VV and drug interactions. The combination index (CI) for each treatment combination was calculated from the dose response curves presented in Figure 1 as well as dose response data from experiments performed using a virus or drug pretreatment (PreT) schedule. Plotted are the average CI values from three independent experiments ± SEM. Extremely high CI values were omitted from the plots.
3.2. Combination therapy improves survival in vivo despite inhibition of virus replication
BALB/c nu/nu mice bearing IP DLD1 tumours were treated with vvDD (109 pfu) and/or CPT‐11 (40 mg/kg) or buffer alone. Body weight was recorded as an indicator of toxicity for all groups until the first mouse was sacrificed (Figure 3A). No significant weight loss was observed with either vvDD or CPT‐11 therapy alone. Transient weight loss was observed in combination treated mice relative to all other groups at day 14 but normalized by day 22. Complete blood counts and liver enzyme analysis were also performed to evaluate potential toxicity due to combination therapy (1, 2). Neutrophils and monocytes were elevated above the normal range in vvDD‐treated mice while only monocytes were elevated in combination treated mice. Nevertheless, there was no significant difference in any of the white blood cell compartments between treatment and control groups. Liver enzymes (albumin, alkaline phosphatase and alanine aminotransferase) were all within normal range for both vvDD and vvDD + CPT‐11 treated mice.
Figure 3.
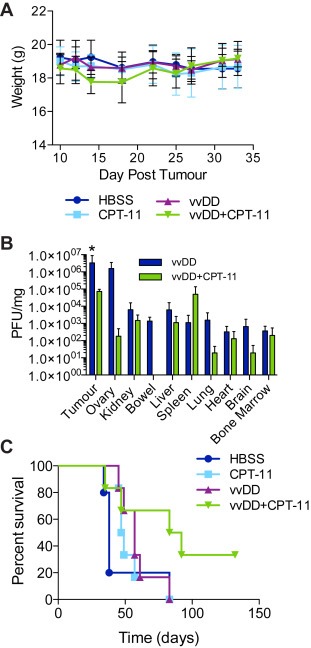
Combination therapy in an in vivo CRC model. BALB/c nu/nu mice bearing intraperitoneal (IP) DLD1 tumours were treated with IP vvDD (day 12) and/or IP irinotecan (CPT‐11; day 10, 14, 18, 22; 40 mg/kg) or vehicle alone. (A) Body weight was measured every 2–4 days up until day 30 as a measure of toxicity. (B) Biodistribution of live virus in tumours and normal organs was determined at 6. Shown is the mean plaque forming units (pfu) per mg of total protein ±SD (n = 3). *p <0.05 vvDD compared to vvDD D CPT‐11 (twoway ANOVA with Bonferroni post test). (C) Kaplan–Meier survival curve for HBSS (n = 5), CPT‐11 (n = 6), vvDD (n = 6) and vvDD D CPT‐11 (n = 6) treated mice. Group‐wise comparison shows median survival of combination treated mice (87.5 days) was significantly increased relative to either vvDD (57 days; p = 0.0179) or CPT‐11 (48 days; p = 0.0190) (weighted log‐rank test, rho = 0, gamma = 1).
Table 1.
Complete blood count. Mean (SD).
| WBC | Neu | Lym | Mono | Eosin | Baso | RBC | Hb | HCT | MCV | MCH | MCHC | RDW | PLT | MPV | |
|---|---|---|---|---|---|---|---|---|---|---|---|---|---|---|---|
| Control | 4.23 (0.18) | 0.96 (0.77) | 2.89 (0.74) | 0.33 (0.28) | 0.05 (0.06) | 0.01 (0.01) | 8.28 (1.95) | 11.75 (2.33) | 45.25 (10.11) | 54.75 (0.64) | 14.25 (0.50) | 26.05 (0.64) | 17.8 (0.71) | Higha | 4.65 (0.07) |
| vvDD | 9.87 (2.35) | 2.60a (1.05) | 5.38 (0.10) | 1.77a (0.66) | 0.11 (0.09) | 0.02 (0.02) | 9.15 (0.72) | 12.93 (1.06) | 50.37a (5.82) | 54.97 (2.52) | 14.13 (0.15) | 25.77 (0.98) | 18.20 (0.36) | Higha | 5.03 (0.06) |
| vvDD + CPT‐11 | 8.07 (2.78) | 1.97 (0.62) | 5.15 (1.96) | 0.90a (0.38) | 0.04 (0.01) | 0.02 (0.01) | 9.77a (0.32) | 13.67 (0.42) | 55.03a (1.88) | 43.00 (22.14) | 13.97 (0.15) | 24.87 (0.64) | 18.53 (0.25) | 3759.67a (266.74) | 5.07 (0.06) |
| Normal range | 1.8–10.7 | 0.1–2.4 | 0.9–9.3 | 0.0–0.4 | 0.0–0.2 | 0–0.2 | 6.36–9.42 | 11.0–15.1 | 35.1–45.4 | 45.4–60.3 | 14.1–19.3 | 30.2–34.2 | 12.4–27.0 | 592–2972 | 5.0–20.0 |
WBC, white blood cell; Neu, neutrophil; Lym, lymphocyte; Mono, monocyte; Eosin, eosinophil; Baso, basophil; RBC, red blood cell; Hb, hemoglobin; HCT, hematocrit; MCV, mean corpuscular volume; MCH, mean corpuscular hemoglobin; MCHC, mean corpuscular hemoglobin concentration; RDW, red cell distribution width; PLT, platelet; MPV, mean platelet volume.
Mean outside normal range.
Table 2.
Blood biochemistry. Mean (SD).
| ALB | ALP | ALT | AMY | TBIL | BUN | CA | PHOS | CRE | GLU | Na+ | K+ | TP | GLOB | |
|---|---|---|---|---|---|---|---|---|---|---|---|---|---|---|
| Control | 36.00a (4.24) | 31.50 (9.19) | 214.00a (237.59) | 1226.50 (406.59) | 4.50 (0.71) | 7.40 (0.85) | 2.76 (0.01) | 2.96 (0.03) | <18 | 8.80 (2.40) | 152.50a (0.71) | 55.00 (1.41) | 19.00 (2.83) | |
| vvDD | 33.00 (2.00) | 39.00 (7.00) | 87.00 (82.29) | 1208.67 (260.10) | 4.33 (0.58) | 6.20 (1.18) | 2.65 (0.14) | 3.28 (0.24) | <18 | 11.73 (0.61) | 150.33a (2.08) | 8.17 (0.58) | 51.00 (1.73) | 18.00 (1.00) |
| vvDD + CPT‐11 | 38.33a (1.53) | 38.67 (10.69) | 38.33 (3.06) | 981.00 (99.50) | 4.00 (1.00) | 5.83 (0.35) | 2.79 (0.06) | 3.23 (0.30) | <18 | 12.20 (3.40) | 151.33a (4.04) | 8.30 | 53.67 (0.58) | 16.00 (2.00) |
| Normal range | 21–34 | 28–94 | 28–184 | 12.1–20.5 | 2.77–3.02 | 2.68–3.62 | 9.7–18.6 | 143–150 | 3.8–10.0 | 18–82 | ||||
ALB, albumin; ALP, alkaline phosphatase; ALT, alanine aminotransferase; AMY, amylase; TBIL, total bilirubin; BUN, blood urea nitrogen; CA, calcium; PHOS, phosphorous; CRE, creatinine; GLU, glucose; TP, total protein; GLOB, globulin.
Mean outside normal range.
Six days post‐infection tumour and normal tissues were harvested to evaluate the biodistribution of live virus particles (Figure 3B). Virus localized specifically to tumours in both virus alone and combination treated mice. Normal tissue mean titers were at least 2–4 log decreased relative to tumour tissue in both vvDD and vvDD + CPT‐11 treated mice (with the exception of the ovaries in virus alone treated mice). While combination therapy resulted in no virus being detected in the bowel (3 of 3 mice), ovary (2 of 3), spleen (2 of 3), brain (2 of 3) and bone marrow (2 of 3), mean titers were only significantly decreased in the tumours (7 × 10⁴ ± 3 × 10⁴ pfu/mg) relative to virus alone (3 × 10⁶ ± 6 × 10⁶ pfu/mg). Combination therapy significantly improved survival relative to either monotherapy (median survival vvDD + CPT‐11, 87.5 days vs vvDD, 57 days, p = 0.0179; and CPT‐11, 48 days, p = 0.0190) (Figure 3C). These data are consistent with our in vitro results which showed a strong synergy between vvDD and SN‐38 in DLD1 cells. In addition, they indicate that virus replication is not the mediator of improved anti‐tumour efficacy.
3.3. Effect of chemotherapy on virus replication
Given that SN‐38 interacts with cellular DNA it is possible that it may also affect viral DNA synthesis. To determine whether drug treatment affected virus replication, the kinetics of viral RFP expression (Figure 4A) and live virus production (Figure 4B–D) were assessed in the presence or absence of SN‐38. Viral RFP was slightly decreased in all cell lines when combined with SN‐38 (0.1–5 μM; 5 μM not shown) relative to virus alone (MOI = 0.1). Crystal violet staining of duplicate wells confirmed cell viability over all drug doses (with exception of HT29 cells); therefore, decreases in RFP expression were not due to a loss of target cells (data not shown). SN‐38‐induced cytotoxicity in HT29 cells may account for the observed decrease in RFP expression. Synergistic dose combinations were selected to assess the effect of drug on virus replication. Despite SN‐38 and vvDD exhibiting a strongly synergistic effect in DLD1 cells there was a significant inhibitory effect of drug on viral RFP expression (Figure 4A) and virus replication (Figure 4D). SN‐38 also inhibited virus replication at synergistic dose combinations in MC38 (Figure 4B) and HT29 (Figure 4C) cells. Similarly, OX did not improve virus replication at synergistic dose combinations (Supplementary Figure 1).
Figure 4.
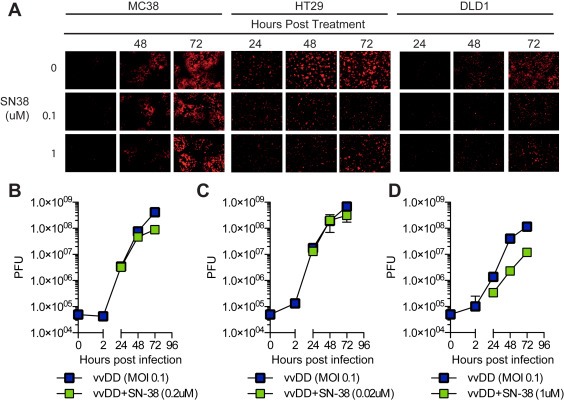
Effects of drug on virus gene expression and replication. (A) Viral RFP expression was evaluated by fluorescence microscopy 24–72 h post treatment. (B–D) Virus replication was determined in the presence and absence of SN‐38. Cells were treated at synergistic dose combinations and live virus particles were quantified at 2–72 hpi by plaque assay. Data represent the mean plaque forming units (pfu) of triplicate values ± SD. DMSO was used as a vehicle control. *p < 0.05.
3.4. Combination therapy increases apoptosis in RFP‐negative virus‐treated cells
Apoptosis is the primary mechanism of SN‐38‐induced cell death. Therefore, the effect of combination therapy on apoptosis was investigated to determine if increased apoptosis contributed to the synergy between vvDD and SN‐38 in DLD1 cells (Figure 5). In the following flow cytometry experiments a higher dose ratio (MOI:μM) was used relative to the previous experiments, due to the low rate of infection in DLD1 cells. Cells were infected (MOI = 1) and/or treated with SN‐38 (1 μM) or mock‐infected and treated with DMSO using a ‘simultaneous’ treatment protocol. Synergy at this higher dose ratio was confirmed by Chou–Talalay's combination index (Supplemental Figure 2). At 48 and 72 hpi a significant increase in apoptosis (Figure 5A, top left) was observed in both drug‐ (8 ± 1% and 31 ± 7%) and combination‐ (15 ± 1% and 46 ± 6%) treated cells relative to virus (3.4 ± 0.9% and 6.8 ± 0.8%; one‐way ANOVA, p < 0.05). Combination therapy also resulted in significantly higher levels of early apoptosis (Annexin V+/7AAD‐) relative to drug and virus alone (9 ± 1% vs 5.8 ± 0.3% and 4.6 ± 0.4%, respectively; one‐way ANOVA, p < 0.05). Representative scatterplots from 72 hpi are shown in Figure 5A.
Figure 5.
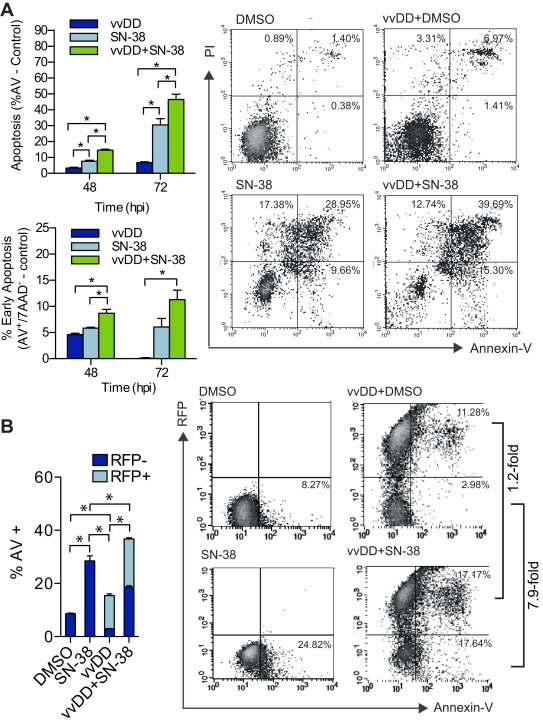
Induction of apoptosis in combination VV and SN‐38 treated cells. DLD1 cells treated with vvDD (MOI 1) in the presence and absence of SN38 (1 μM) were analyzed by flow cytometry. (A) Total (top graph) and early (bottom graph) apoptosis (Annexin‐V positive) cells at 48 and 72 h post treatment. Representative dot plots (right) of 72 hpi data presented in graphs. Bars represent the mean percentage of triplicate values ±SEM. *p < 0.05; one‐way ANOVA. (B) Proportion of uninfected (RFP−) and infected (RFP+) cells undergoing apoptosis in vvDD and vvDD + SN‐38 treated cells at 72 hpi (left). Representative dot plots (right) of data presented in graphs. Bars represent the mean percentage of RFP+/AV+ and RFP−/AV+ cells of triplicates ±SEM. *p < 0.05; two‐way ANOVA.
VV efficiency replicates its DNA and produces thousands of viral progeny leading to host cell lysis within approximately 24 hpi (Moss, 2007). Given that synergy was not due to an increase in virus production and that apoptosis – the primary mechanism of SN‐38 induced cell death ‐ was increased with combination therapy, we hypothesized that virus treatment sensitized cells to drug‐induced cell death. To test this hypothesis, we determined whether the observed increase in apoptosis following combination treatment occurred preferentially in RFP‐positive or RFP‐negative cells. In these studies, RFP expression is under control of the early/late promoter, Psel, and therefore served as a marker of both early viral gene expression, which occurs prior to viral DNA replication (approximately 5 hpi) and late viral gene expression (Hammond et al., 1997). Therefore, RFP‐negative cells represent the population of cells that are either uninfected or in the initial stages of viral infection (i.e. prior to early gene expression). Cells were stratified based on RFP expression and the percentage of apoptotic cells (annexin‐V+) in the RFP+ and RFP− compartments was compared between vvDD and vvDD + SN‐38 treatments (Figure 5B). At 48 hpi virus alone resulted in 15.4 ± 1.2% annexin‐V+ staining, of which 80.9 ± 1.7% (12.5 ± 1.1% of total) were RFP+ and 19.1 ± 1.7% (2.9 ± 0.2% of total) were RFP−. Addition of SN‐38 increased annexin‐V staining to 36.7 ± 1.7% of which 49.3 ± 0.2% (18.1 ± 0.8% of total) were RFP+ and 50.7 ± 0.2% (18.6 ± 0.9% of total) were RFP−. The overall increase in apoptosis following combination treatment corresponded to an approximately 1.5‐fold increase in apoptosis in RFP+ cells and 6.4‐fold increase in RFP− cells relative to virus alone. The disproportionate increase in apoptosis in RFP− virus‐treated cells suggests that these cells are being sensitized to drug‐induced cell death and this likely contributed to the observed synergy.
3.5. VV induced cell cycle arrest may prime cells for SN‐38 therapy
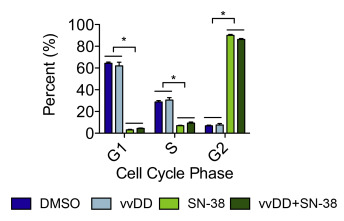
The effect of VV on cell cycle has been well documented; shortly after infection (24 hpi) VV induces S‐phase arrest in order to promote virus replication (Wali and Strayer, 1999). Additionally, cells in S‐phase are known to show heightened susceptibility to SN‐38‐induced cell death (Horwitz and Horwitz, 1973). Taken together with our findings that SN38 inhibits virus replication, and increases apoptosis when given in combination, we hypothesized that vvDD affects cycling of uninfected cancer cells thereby sensitizing them to SN‐38 treatment. To test this hypothesis, we investigated cell lines where combination treatment was (Figure 6) or was not synergistic (Supplemental Figure 3), expecting that if a bystander effect was responsible for SN‐38 sensitization virus‐induced alterations in cell cycle distribution would only be observed in the former. To ensure that cells were cycling throughout the experiment, treatments were carried out on sub‐confluent monolayers and control cells were confirmed to be undergoing exponential growth throughout the course of the experiment. Following treatment of DLD1 cells, virus alone resulted in a significant increase in S‐phase cells (38 ± 1% vs 16.1 ± 0.6%, p < 0.001, two‐way ANOVA) and a small but significant increase in G2/M phase cells (17 ± 2% vs 12.7 ± 0.9%, p < 0.05), while drug alone resulted in a significant increase in S‐ (45 ± 3% vs 16.1 ± 0.6%, p < 0.001) and G2/M‐phase (35 ± 2% vs 12.7 ± 0.9%, p < 0.001) cells relative to control (Figure 6A). Combination therapy also resulted in a significant increase in S‐ (50 ± 2% vs 16.1 ± 0.6%, p < 0.001) but not G2/M− (12 ± 2% vs 12.7% ± 0.9, p > 0.05) phase cells relative to control (Figure 6A).
Figure 6.
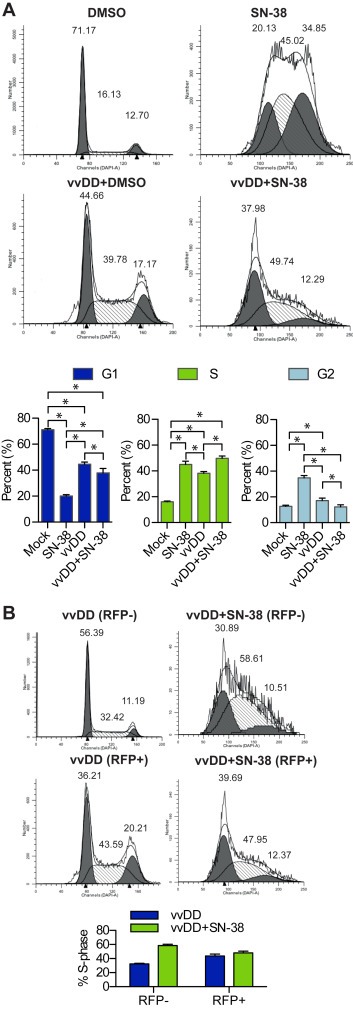
Cell cycle analyses of VV and SN‐38 treated cells. DLD1 cells treated with vvDD (MOI 1) in the presence and absence of SN‐38 (1 μM) were stained with DAPI and analyzed by flow cytometry for DNA content at 72 h post treatment. (A) Representative cell cycle histograms (top) and quantification of cell cycle distribution (bottom). (B) Cell cycle analysis of uninfected (gated RFP−) and infected (gated RFP+) virus‐treated cells from (A) (left) and quantification of cells in S‐phase (right). Bar graphs represent the mean of triplicates ±SD, *p < 0.05. Histograms are superimposed with a software‐generated model of DNA distribution.
While it is know that VV induces a general S‐phase arrest, to our knowledge it has not been shown whether arrest occurs solely in infected cells or if there is also a bystander effect. To investigate this possibility, data was stratified based on RFP‐expression to determine if vvDD affected cell cycling in both the RFP+ and RFP− populations. vvDD alone resulted in a significant increase in both RFP+ (44 ± 3% vs 16.1 ± 0.6%, p < 0.001) and RFP− (32.4 ± 0.9% vs 16.1 ± 0.6%, p < 0.001) S‐phase cells relative to control (Figure 6B). Similarly, the percentage of RFP− combination‐treated cells in S‐phase (59 ± 2%) was significantly higher than that observed with virus (32.4 ± 0.9%, p < 0.001), drug (45 ± 3%, p < 0.001) and control (16.1 ± 0.6, p < 0.001)‐treated cells. The significant S‐phase increase in RFP−, virus‐treated cells, combined with the disproportioned increase in apoptosis in RFP− combination‐treated cells supports our conclusion that VV sensitizes cells that are either uninfected or in the early stages of infection to SN‐38‐induced apoptosis.
In HT29 cells treated at a non‐synergistic dose combination, virus alone had no effect on the overall proportion of S‐phase cells compared to mock (31 ± 5% vs 29 ± 3%, p > 0.05) (Supplemental Figure 3). In contrast, SN‐38 (0.02 μM) had a profound effect of cell cycle, causing a dramatic shift of cells into G2/M (90 ± 2%). Cell cycle distribution following combination therapy was indistinguishable from that of SN‐38 alone, indicating that HT29 cells are extremely sensitive to SN‐38‐induced cell cycle effects even in the presence vvDD. Alternatively, in DLD1 cells, combination therapy resulted in an intermediate distribution between that of VV alone and SN‐38 alone. Therefore, the lack of synergy in HT29 cells may be due in part to the absence of VV‐induced cell cycle effects and increased SN‐38 sensitivity.
3.6. Apoptosis and immune cell infiltration in combination treated CRC tumours
In order to determine whether vvDD interacted in a similar way with CPT‐11 in vivo as it did with SN‐38 in vitro, IHC studies were performed at various time points to look at virus, apoptosis and immune cell infiltration in tumours (Figure 7). Multiple tumour sections per mouse were analyzed using ImageScope's Positive Pixel Algorithm which quantifies the percentage of positively staining pixels relative to the total number of pixels in a given region of interest. Biodistribution data at 6 dpi suggested that CPT‐11 had an inhibitory effect on virus replication (Figure 3B) as was seen in vitro (Figure 4). IHC staining 1 dpi showed no significant difference in the amount of virus in tumours following combination therapy compared to virus alone; whereas by 3 dpi VV staining was significantly increased in tumours from virus alone treated mice (15.4 ± 2.8% vs 3.1 ± 1.5%, p = 0.0175) (Figure 7A). This indicates that there is no significant difference in the initial infection of tumours and that virus replication and/or spread is impeded by CPT‐11. Given the role of apoptosis in mediating in vitro synergy we also looked at markers of apoptosis (Figure 7B and C). At 1 dpi combination treatment significantly increased activated caspase‐3 staining relative to all other groups (3.0 ± 0.3%, vvDD + CPT‐11; vs 0.79 ± 0.12%, CPT‐11; 0.64 ± 0.09%, vvDD; 0.44 ± 0.12%, HBSS; p < 0.0001). By 3 dpi caspase‐3 activation was increased in all treatment groups relative to control (4.0 ± 0.3%, CPT‐11; 6.6 ± 0.7%, vvDD; 4.6 ± 0.6%, vvDD + CPT‐11; vs 1.5 ± 0.2%, HBSS). The early increase in apoptosis following combination therapy likely contributes to the improved treatment efficacy, however to sustain long‐term inhibition of disease progression, as was seen in the survival studies, there are almost certainly other factors involved.
Figure 7.
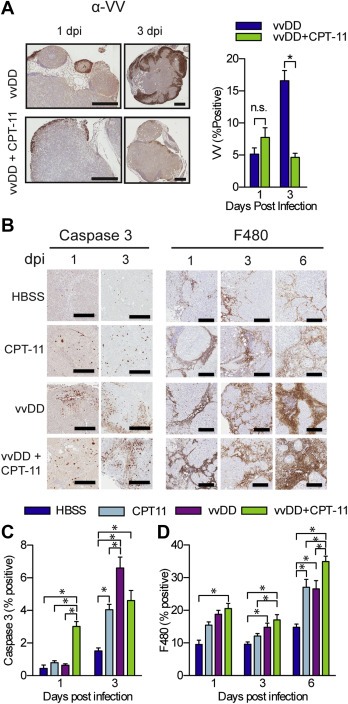
In vivo virus replication, apoptosis and immune infiltration is augmented by VV and CPT‐11 combination therapy. Mice treated as in Figure 3 were sacrificed at 1, 3 and 6 dpi and all macroscopic tumours were removed, formalin‐fixed and analyzed by IHC (n = 3–4). (A) Representative images (left) and quantification (right) of VV staining of tumours from mice treated with vvDD or vvDD + CPT‐11. Representative images (B) and quantification of IHC staining for activated caspase 3 (C) and F480 (D). Graphs depict the mean percentage of positively staining pixels relative to the total number of pixels per tumour. Bars represent the average of all tumours from each mouse in each treatment group ± SEM. Mean [range] number of tumours analyzed per mouse: 3 [1–6], 1 dpi and 23.3 [15–29], 3 dpi (HBSS); 16.3 [13–20], 1 dpi and 17.7 [13–22], 3 dpi (CPT‐11); 20.8 [8–36], 1 dpi and 15 [9–23], 3 dpi (vvDD); 14.25 [7–31], 1 dpi and 5.7 [1–14], 3 dpi (vvDD + CPT‐11). *p < 0.05.
Oncolytic VV therapy is mediated at least in part through induction of an anti‐tumour immune response (Ehrig et al., 2013; Kirn et al., 2007). Viral lysis of tumour cells releases cellular‐ and viral‐associated danger signals as well as tumour‐associated antigens. Resultant local inflammation can lead to cross priming of immune cells towards tumour antigens. Both VV and CPT‐11 are known to increase tumour‐infiltrating immune cells such as macrophages in CRC tumour models (Ehrig et al., 2013; Wang et al., 2011) and increased tumour‐infiltrating lymphocyte scores have been shown to improve the clinical efficacy of CPT‐11 in primary and metastatic CRC (Halama et al., 2011, 2009). Given this evidence we examined the effect of combination therapy on immune cell infiltration. The early increase in tumour apoptosis in combination treated mice was accompanied by an increase in macrophage infiltration (Figure 7B and D). At 1 dpi combination treatment resulted in significantly increased macrophage infiltration relative to control (20.6 ± 1.6% vs 9.5 ± 1.3%, p < 0.05). By 3 dpi macrophage infiltration was still increased in vvDD + CPT‐11 treated tumours (17.1 ± 1.7%) relative to control (9.6 ± 0.7%, p < 0.05) or drug alone (12.1 ± 0.8%, p < 0.05). Infiltration into tumours from vvDD treated mice was also significantly increased relative to control (14.8 ± 1.3%, p < 0.05). Increased macrophage infiltration in combination treated mice relative to all other groups was maintained at 6 dpi (p < 0.05). Staining for other immune cell infiltrates and stroma cells (B‐cells and endothelial cells, data not shown) was not significantly different between treatment groups. The early and sustained increase in macrophage infiltration following combination therapy likely contributed to improved anti‐tumour efficacy, as seen in previous studies, while simultaneously limiting VV replication and spread.
4. Discussion
Metastatic CRC represents a complex and challenging clinical problem. Unfortunately, the efficacy of current chemotherapy regimens is limited by the development of dose‐limiting toxicities (Goldwasser et al., 2000; Kemeny et al., 2002) and chemo‐resistance (Marin et al., 2012). Novel combination treatments that could effectively decrease tumour burden or decrease toxicity and chemo‐resistance would be of clinical benefit.
OVs have unique characteristics that make them ideal candidates for the treatment of such locally advanced diseases. Owing to their multi‐mechanistic mode of action, the risk of acquired‐resistance is low and potential to synergize with secondary therapies is high. Not surprisingly, the preclinical literature increasingly supports the concept that, like most other cancer therapies, OV therapy may be most effective when delivered as part of a rationally designed combination treatment strategy (Ottolino‐Perry et al., 2010).
We and others have shown that vvDD can be used to significantly improve survival in murine models of peritoneally disseminated CRC (Chalikonda et al., 2008; Ottolino‐Perry et al., 2014). Two early phase clinical trails are currently underway looking at IV (Jennerex, NCT01380600) and IP (Genelux, NCT01443260) delivery of VV in this patient population. Here we aimed to identify potential synergistic interactions between oncolytic VV and current CRC chemotherapy drugs such that future clinical trials may take advantage of existing therapies to maximize the therapeutic benefit of OVs in these patients.
Analysis of virus–drug interactions using the Chou–Talalay method (Chou and Talalay, 1984) demonstrated that vvDD synergizes with OX and SN‐38 in a dose‐, cell line‐ and schedule‐dependent manner. In contrast to previous work that reported no synergy between a different oncolytic VV (vJS6) and OX in MC38 and DLD1 cells (Ziauddin et al., 2010), we observed synergistic interactions in all cell lines tested (at specific doses with different treatment schedules). Differences in the virus backbone (vJS6; contains a single attenuation deletion, tk‐) as well as the selected dose combinations and experimental design may account for the divergent findings. Despite being the most sensitive to SN‐38 induced cell death, HT29 cells showed the least amount of synergy when treated with vvDD + SN‐38 (synergy observed only a low Fa values). SN‐38 was strongly synergistic in MC38 and DLD1 cells over a range of Fa values. In these cells, SN‐38 synergistically improved cell killing when delivered as part of a simultaneous and virus pretreatment schedule; however, drug pretreatment was extremely antagonistic in MC38 cells (data not shown) and at most additive in DLD1 cells.
In vivo combination of vvDD with CPT‐11 was well tolerated; no hematological or liver function abnormalities were attributed to combination treatment. Despite substantially decreased virus in the tumours, combination therapy significantly improved survival over either monotherapy. In vitro investigation of the mechanism of synergy confirmed that drug‐induced enhancement of virus replication did not account for improved cell death with combination therapy. SN‐38 acts at the level of cellular DNA replication, binding to DNA and topoisomerase I to form irreversible double‐strand DNA breaks when in contact with a replication fork (Pommier, 2006) therefore it is conceivable that the drug may also act on viral DNA replication. It should be noted though, that VV encodes its own viral topoisomerase I and previous work has shown it not to be susceptible to camptothecin (parent drug of CPT‐11)‐induced inhibition (Gupta et al., 1992). Currently, it is not clear how SN‐38 and/or CPT‐11 inhibit virus replication and given the added influence of the immune system the mechanism may differ between our in vivo and in vitro models.
The effect of treatment schedule on virus–drug interactions in DLD1 cells – namely that virus pretreatment or simultaneous schedules were generally more synergistic than drug pretreatment – points to virus‐induced sensitization of cells to SN‐38 toxicity as the likely mediator of synergy. Consistent with this hypothesis we show that combination treatment significantly increased apoptosis, the primary mechanism of SN‐38 (Pommier, 2006) but not VV‐induced cell death. SN38/CPT‐11 are cell cycle‐specific drugs that induce apoptosis in cells undergoing active DNA replication (Horwitz and Horwitz, 1973). Effects of VV on cell cycle have been previously reported for total cell populations exposed to virus (Wali and Strayer, 1999). We show that VV‐induced S‐phase accumulation occurs in cells undergoing active viral gene expression as well as in cells that are either uninfected or in the very early stages of viral infection (i.e. prior to early gene expression). We hypothesize that the cell cycle shift that occurs in RFP‐negative cells represents a bystander effect of VV infection on uninfected cells. However, given that early gene expression was used as a marker of viral infection in these experiments, it is not possible to state with absolute certainty that all RFP‐negative cells were uninfected. Nevertheless, evidence exists to support the occurrence of such a bystander effect in uninfected VV‐treated cells. In one study, early activation of MEK and ERK1/2 with subsequent induction of the mitogenic signal c‐fos was observed following VV infection in the absence of virus replication, even when using a vgf‐deleted mutant (de Magalhaes et al., 2001). In a different study, activation of c‐fos was shown to be essential in human CRC cells for downstream production of tumour growth factor (TGF)‐β, which induced mitosis in a paracrine fashion (Liu et al., 2006). Further investigation is required to determine if the cell cycle effects observed in RFP‐negative cells represent a true bystander effect or if it is a result of cell signaling subsequent to early binding and infection of cells.
Consistent with the results presented here, there have been several reports of synergistic interactions between OVs and chemotherapy drugs in the absence of enhanced viral production (Gutermann et al., 2006; Huang et al., 2011). vvDD sensitizes cells to paclitaxel through induction of the danger‐associated molecular pathogen molecule HMGB1 and interferon (IFN)‐β (Huang et al., 2011). Sensitization through type‐I IFN occurred despite VV's expression of numerous anti‐IFN proteins (Smith et al., 2013). Type I IFNs can also sensitize CRC cell lines to CPT‐11 induced cell death (Ohwada et al., 1996), likely through accumulation of IFN‐treated cells in S‐phase. It is possible that IFN may play a role in the synergistic interactions observed in our studies.
Key limitations of this study and many others like it are the reliance on in vitro systems to identify synergy and the lack of confirmatory in vivo data. Indeed in vitro cultures allow focused dissection of individual pathways and proteins involved in virus–drug interactions. However, not all in vitro synergy translates into in vivo synergy. In our study, vvDD and SN‐38 interacted synergistically in MC38 cells in vitro, however, combination therapy in MC38 tumour‐bearing mice was not effective (Supplemental Figure 4). In our DLD1 model, in vitro synergy did correspond to improved survival in vivo. In order to evaluate in vivo synergy, as defined by Chou and Talalay (Chou and Talalay, 1984), a similar experimental design to that used in vitro would be required and would necessitate a large number of mice per experiment. Understanding mechanisms of synergy are important as they allow us to better design combination treatment strategies to amplify synergistic interactions. Nevertheless, demonstrated in vitro synergy and in vivo survival improvement without toxicity warrants further investigation of such combinations in clinical trials.
Another important aspect that may contribute to the differences observed between our in vitro and in vivo models is the complex metabolic pathways responsible for the conversion of CPT‐11 to SN‐38 and its subsequent inactivation. In mice, serum carboxylesterases represent one of the primary means of CPT‐11 metabolism (Morton et al., 2005). Metabolism in the gut (specifically duodenum) may also contribute SN‐38 production (Morton et al., 2005). Tumour cells can also express carboxylesterases, however their contribution to drug metabolism in murine CRC models is relatively minor (Jansen et al., 1997). Overall, mice show very high levels of metabolic conversion of CPT‐11 relative to humans (Satoh et al., 1994). For these reasons, we concluded that SN‐38 was the appropriate choice for in vitro experimentation as it more accurately modeled the extra‐tumoural conversion of CPT‐11. Furthermore, it is interesting to note that different mouse strains show different levels of SN‐38 inactivation through glucoronidation, with C57BL/6 having an approximately 2‐fold higher glucoronidation activity compared to BALB/c mice (Guo et al., 2007). Such differences may have contributed to the lack of efficacy observed in the C57BL/6 model (Supplemental Figure 4). The data presented here provides strong evidence to support the clinical investigation of VV in combination with CPT‐11. As the safety of VV for use in CRC patients is confirmed through phase I clinical trials, investigators may consider designing future clinical studies to examine the combination of VV with CPT‐11 in patients that have failed second‐line therapy. This strategy would be particularly pertinent given the bystander effect of VV on uninfected cells and the potential to reverse chemo‐resistance to CPT‐11.
Conflicts of interest
The authors disclose no potential conflicts of interest.
Supporting information
The following are the supplementary data related to this article:
Supplemental Figure 1 Effect of oxaliplatin on virus gene expression and replication. Viral RFP expression was evaluated in the presence and absence of OX. Cells were infected at MOI 0.1 and treated with increasing concentrations of drug. Fluorescence microscopy was performed at 24–72 h post treatment (A) and virus replication was determined (B–D). Data represent the mean plaque forming units (pfu) of triplicate values ± SD. *p < 0.05.
Supplemental Figure 2 VV and SN‐38 in vitro interaction. Dose response (A) and drug–drug interactions (B) were evaluated in DLD1 cells treated with vvDD and SN‐38 at a 1:1 (MOI:μM) dose ratio. (B) The combination index (CI) was less than 1 at all doses tested (0.001, 0.01, 0.1, 0.5, 1) indicating synergistic cell killing. Data represent mean fraction viability relative to DMSO treated controls ± SEM (A) or CI at the doses tested.
Supplemental Figure 3 Cell cycle analysis in HT29 cells treated at non‐synergistic doses of vvDD and SN‐38. HT29 cells were treated with vvDD (MOI = 0.1) and/or SN‐38 (0.02 μM) and analyzed by flow cytometry following DAPI staining at 48 hpi. The experiment was performed in triplicate and bars represent the mean ± SD. *p < 0.05, one‐way ANOVA with Bonferroni's multiple comparison test.
Supplemental Figure 4 Combination therapy in a syngeneic model of CRC. C57BL/6 mice bearing IP MC38 tumours were treated with IP vvDD (day 12; 109 pfu) and/or IP CPT‐11 (day 10, 14, 18, 22; 30 mg/kg) or vehicle alone. Survival was significantly improved in all treatment groups relative to the control group, however combination therapy was not better than either monotherapy. Median survival was: 21 d (HBSS), 26 d (CPT‐11, p = 0.0003), 24 d (vvDD, p = 0.023) and 26.6 d (vvDD + CPT‐11, p = 0.0003).
Acknowledgments
This work was supported by a Canadian Institute for Health Research (CIHR) operating grant (MOP‐84208) and a Terry Fox New Frontiers Program project grant (TFF‐122868). KOP was supported by a CIHR Banting and Best Doctoral Award.
Supplementary data 1.
1.1.
Supplementary data related to this article can be found at http://dx.doi.org/10.1016/j.molonc.2015.04.009.
Ottolino-Perry Kathryn, Acuna Sergio A., Angarita Fernando A., Sellers Clara, Zerhouni Siham, Tang Nan, McCart J. Andrea, (2015), Oncolytic vaccinia virus synergizes with irinotecan in colorectal cancer, Molecular Oncology, 9, doi: 10.1016/j.molonc.2015.04.009.
References
- Acuna, S.A. , Ottolino-Perry, K. , Cako, B. , Tang, N. , Angarita, F.A. , McCart, J.A. , 2014. Oncolytic vaccinia virus as an adjuvant treatment to cytoreductive surgery for malignant peritoneal mesothelioma. Ann. Surg. Oncol. 21, 2259–2266. [DOI] [PubMed] [Google Scholar]
- Advani, S.J. , Buckel, L. , Chen, N.G. , Scanderbeg, D.J. , Geissinger, U. , Zhang, Q. , Yu, Y.A. , Aguilar, R.J. , Mundt, A.J. , Szalay, A.A. , 2012. Preferential replication of systemically delivered oncolytic vaccinia virus in focally irradiated glioma xenografts. Clin. Cancer Res. 18, 2579–2590. [DOI] [PubMed] [Google Scholar]
- Breitbach, C.J. , De Silva, N.S. , Falls, T.J. , Aladl, U. , Evgin, L. , Paterson, J. , Sun, Y.Y. , Roy, D.G. , Rintoul, J.L. , Daneshmand, M. , Parato, K. , Stanford, M.M. , Lichty, B.D. , Fenster, A. , Kirn, D. , Atkins, H. , Bell, J.C. , 2011. Targeting tumor vasculature with an oncolytic virus. Mol. Ther. 19, 886–894. [DOI] [PMC free article] [PubMed] [Google Scholar]
- Breitbach, C.J. , Paterson, J.M. , Lemay, C.G. , Falls, T.J. , McGuire, A. , Parato, K.A. , Stojdl, D.F. , Daneshmand, M. , Speth, K. , Kirn, D. , McCart, J.A. , Atkins, H. , Bell, J.C. , 2007. Targeted inflammation during oncolytic virus therapy severely compromises tumor blood flow. Mol. Ther. 15, 1686–1693. [DOI] [PubMed] [Google Scholar]
- Brenner, H. , Kloor, M. , Pox, C.P. , 2014. Colorectal cancer. Lancet. 383, 1490–1502. [DOI] [PubMed] [Google Scholar]
- Chalikonda, S. , Kivlen, M.H. , O'Malley, M.E. , Eric Dong, X.D. , McCart, J.A. , Gorry, M.C. , Yin, X.Y. , Brown, C.K. , Zeh, H.J. , Guo, Z.S. , Bartlett, D.L. , 2008. Oncolytic virotherapy for ovarian carcinomatosis using a replication-selective vaccinia virus armed with a yeast cytosine deaminase gene. Cancer Gene Ther. 15, 115–125. [DOI] [PMC free article] [PubMed] [Google Scholar]
- Cherubini, G. , Kallin, C. , Mozetic, A. , Hammaren-Busch, K. , Muller, H. , Lemoine, N.R. , Hallden, G. , 2011. The oncolytic adenovirus AdΔΔ enhances selective cancer cell killing in combination with DNA-damaging drugs in pancreatic cancer models. Gene Ther. 18, 1157–1165. [DOI] [PubMed] [Google Scholar]
- Chou, T.C. , Talalay, P. , 1984. Quantitative analysis of dose-effect relationships: the combined effects of multiple drugs or enzyme inhibitors. Adv. Enzyme Regul. 22, 27–55. [DOI] [PubMed] [Google Scholar]
- de Magalhaes, J.C. , Andrade, A.A. , Silva, P.N. , Sousa, L.P. , Ropert, C. , Ferreira, P.C. , Kroon, E.G. , Gazzinelli, R.T. , Bonjardim, C.A. , 2001. A mitogenic signal triggered at an early stage of vaccinia virus infection: implication of MEK/ERK and protein kinase A in virus multiplication. J. Biol. Chem. 276, 38353–38360. [DOI] [PubMed] [Google Scholar]
- Ehrig, K. , Kilinc, M.O. , Chen, N.G. , Stritzker, J. , Buckel, L. , Zhang, Q. , Szalay, A.A. , 2013. Growth inhibition of different human colorectal cancer xenografts after a single intravenous injection of oncolytic vaccinia virus GLV-1h68. J. Transl. Med. 11, 79 5876-11-79 [DOI] [PMC free article] [PubMed] [Google Scholar]
- Gholami, S. , Chen, C.H. , Belin, L.J. , Lou, E. , Fujisawa, S. , Antonacci, C. , Carew, A. , Chen, N.G. , De Brot, M. , Zanzonico, P.B. , Szalay, A.A. , Fong, Y. , 2013. Vaccinia virus GLV-1h153 is a novel agent for detection and effective local control of positive surgical margins for breast cancer. Breast Cancer Res. 15, R26 [DOI] [PMC free article] [PubMed] [Google Scholar]
- Goldwasser, F. , Gross-Goupil, M. , Tigaud, J.M. , Di Palma, M. , Marceau-Suissa, J. , Wasserman, E. , Yovine, A. , Misset, J.L. , Cvitkovic, E. , 2000. Dose escalation of CPT-11 in combination with oxaliplatin using an every two weeks schedule: a phase I study in advanced gastrointestinal cancer patients. Ann. Oncol. 11, 1463–1470. [DOI] [PubMed] [Google Scholar]
- Greiner, S. , Humrich, J.Y. , Thuman, P. , Sauter, B. , Schuler, G. , Jenne, L. , 2006. The highly attenuated vaccinia virus strain modified virus Ankara induces apoptosis in melanoma cells and allows bystander dendritic cells to generate a potent anti-tumoral immunity. Clin. Exp. Immunol. 146, 344–353. [DOI] [PMC free article] [PubMed] [Google Scholar]
- Guo, Y. , Lu, P. , Farrell, E. , Zhang, X. , Weller, P. , Monshouwer, M. , Wang, J. , Liao, G. , Zhang, Z. , Hu, S. , Allard, J. , Shafer, S. , Usuka, J. , Peltz, G. , 2007. In silico and in vitro pharmacogenetic analysis in mice. Proc. Natl. Acad. Sci. USA. 104, 17735–17740. [DOI] [PMC free article] [PubMed] [Google Scholar]
- Gupta, M. , Zhu, C.X. , Tse-Dinh, Y.C. , 1992. An engineered mutant of vaccinia virus DNA topoisomerase I is sensitive to the anti-cancer drug camptothecin. J. Biol. Chem. 267, 24177–24180. [PubMed] [Google Scholar]
- Gutermann, A. , Mayer, E. , von Dehn-Rothfelser, K. , Breidenstein, C. , Weber, M. , Muench, M. , Gungor, D. , Suehnel, J. , Moebius, U. , Lechmann, M. , 2006. Efficacy of oncolytic herpesvirus NV1020 can be enhanced by combination with chemotherapeutics in colon carcinoma cells. Hum. Gene Ther. 17, 1241–1253. [DOI] [PubMed] [Google Scholar]
- Halama, N. , Michel, S. , Kloor, M. , Zoernig, I. , Benner, A. , Spille, A. , Pommerencke, T. , von Knebel, D.M. , Folprecht, G. , Luber, B. , Feyen, N. , Martens, U.M. , Beckhove, P. , Gnjatic, S. , Schirmacher, P. , Herpel, E. , Weitz, J. , Grabe, N. , Jaeger, D. , 2011. Localization and density of immune cells in the invasive margin of human colorectal cancer liver metastases are prognostic for response to chemotherapy. Cancer Res. 71, 5670–5677. [DOI] [PubMed] [Google Scholar]
- Halama, N. , Michel, S. , Kloor, M. , Zoernig, I. , Pommerencke, T. , von Knebel Doeberitz, M. , Schirmacher, P. , Weitz, J. , Grabe, N. , Jager, D. , 2009. The localization and density of immune cells in primary tumors of human metastatic colorectal cancer shows an association with response to chemotherapy. Cancer Immun. 9, 1 [PMC free article] [PubMed] [Google Scholar]
- Hammond, J.M. , Oke, P.G. , Coupar, B.E. , 1997. A synthetic vaccinia virus promoter with enhanced early and late activity. J. Virol. Methods. 66, 135–138. [DOI] [PubMed] [Google Scholar]
- Heinemann, L. , Simpson, G.R. , Boxall, A. , Kottke, T. , Relph, K.L. , Vile, R. , Melcher, A. , Prestwich, R. , Harrington, K.J. , Morgan, R. , Pandha, H.S. , 2011. Synergistic effects of oncolytic reovirus and docetaxel chemotherapy in prostate cancer. BMC Cancer. 11, 221 [DOI] [PMC free article] [PubMed] [Google Scholar]
- Horwitz, S.B. , Horwitz, M.S. , 1973. Effects of camptothecin on the breakage and repair of DNA during the cell cycle. Cancer Res. 33, 2834–2836. [PubMed] [Google Scholar]
- Huang, B. , Sikorski, R. , Kirn, D.H. , Thorne, S.H. , 2011. Synergistic anti-tumor effects between oncolytic vaccinia virus and paclitaxel are mediated by the IFN response and HMGB1. Gene Ther. 18, 164–172. [DOI] [PubMed] [Google Scholar]
- Jansen, W.J. , Zwart, B. , Hulscher, S.T. , Giaccone, G. , Pinedo, H.M. , Boven, E. , 1997. CPT-11 in human colon-cancer cell lines and xenografts: characterization of cellular sensitivity determinants. Int. J. Cancer. 70, 335–340. [DOI] [PubMed] [Google Scholar]
- Kemeny, N. , Tong, W. , Gonen, M. , Stockman, J. , Di Lauro, C. , Teitcher, J. , White, P. , Price, C. , Saltz, L. , Sharma, S. , Graham, M.A. , 2002. Phase I study of weekly oxaliplatin plus irinotecan in previously treated patients with metastatic colorectal cancer. Ann. Oncol. 13, 1490–1496. [DOI] [PubMed] [Google Scholar]
- Kerscher, A.G. , Chua, T.C. , Gasser, M. , Maeder, U. , Kunzmann, V. , Isbert, C. , Germer, C.T. , Pelz, J.O. , 2013. Impact of peritoneal carcinomatosis in the disease history of colorectal cancer management: a longitudinal experience of 2406 patients over two decades. Br. J. Cancer. 108, 1432–1439. [DOI] [PMC free article] [PubMed] [Google Scholar]
- Kirn, D.H. , Wang, Y. , Le Boeuf, F. , Bell, J. , Thorne, S.H. , 2007. Targeting of interferon-beta to produce a specific, multi-mechanistic oncolytic vaccinia virus. Plos Med. 4, e353 [DOI] [PMC free article] [PubMed] [Google Scholar]
- Kuijpers, A.M. , Mirck, B. , Aalbers, A.G. , Nienhuijs, S.W. , de Hingh, I.H. , Wiezer, M.J. , van Ramshorst, B. , van Ginkel, R.J. , Havenga, K. , Bremers, A.J. , de Wilt, J.H. , Te Velde, E.A. , Verwaal, V.J. , 2013. Cytoreduction and HIPEC in The Netherlands: nationwide long-term outcome following the Dutch protocol. Ann. Surg. Oncol. 20, 4224–4230. [DOI] [PMC free article] [PubMed] [Google Scholar]
- Liu, G. , Ding, W. , Liu, X. , Mulder, K.M. , 2006. c-Fos is required for TGFbeta1 production and the associated paracrine migratory effects of human colon carcinoma cells. Mol. Carcinog. 45, 582–593. [DOI] [PubMed] [Google Scholar]
- Maitra, R. , Seetharam, R. , Tesfa, L. , Augustine, T.A. , Klampfer, L. , Coffey, M.C. , Mariadason, J.M. , Goel, S. , 2014. Oncolytic reovirus preferentially induces apoptosis in KRAS mutant colorectal cancer cells, and synergizes with irinotecan. Oncotarget. 5, 2807–2819. [DOI] [PMC free article] [PubMed] [Google Scholar]
- Mansfield, D. , Pencavel, T. , Kyula, J.N. , Zaidi, S. , Roulstone, V. , Thway, K. , Karapanagiotou, L. , Khan, A.A. , McLaughlin, M. , Touchefeu, Y. , Seth, R. , Melcher, A.A. , Vile, R.G. , Pandha, H.S. , Harrington, K.J. , 2013. Oncolytic vaccinia virus and radiotherapy in head and neck cancer. Oral Oncol. 49, 108–118. [DOI] [PubMed] [Google Scholar]
- Marin, J.J. , Sanchez de Medina, F. , Castano, B. , Bujanda, L. , Romero, M.R. , Martinez-Augustin, O. , Moral-Avila, R.D. , Briz, O. , 2012. Chemoprevention, chemotherapy, and chemoresistance in colorectal cancer. Drug Metab. Rev. 44, 148–172. [DOI] [PubMed] [Google Scholar]
- McCart, J.A. , Mehta, N. , Scollard, D. , Reilly, R.M. , Carrasquillo, J.A. , Tang, N. , Deng, H. , Miller, M. , Xu, H. , Libutti, S.K. , Alexander, H.R. , Bartlett, D.L. , 2004. Oncolytic vaccinia virus expressing the human somatostatin receptor SSTR2: molecular imaging after systemic delivery using 111In-pentetreotide. Mol. Ther. 10, 553–561. [DOI] [PubMed] [Google Scholar]
- McCart, J.A. , Ward, J.M. , Lee, J. , Hu, Y. , Alexander, H.R. , Libutti, S.K. , Moss, B. , Bartlett, D.L. , 2001. Systemic cancer therapy with a tumor-selective vaccinia virus mutant lacking thymidine kinase and vaccinia growth factor genes. Cancer Res. 61, 8751–8757. [PubMed] [Google Scholar]
- Morton, C.L. , Iacono, L. , Hyatt, J.L. , Taylor, K.R. , Cheshire, P.J. , Houghton, P.J. , Danks, M.K. , Stewart, C.F. , Potter, P.M. , 2005. Activation and antitumor activity of CPT-11 in plasma esterase-deficient mice. Cancer Chemother. Pharmacol. 56, 629–636. [DOI] [PubMed] [Google Scholar]
- Moss, B. , 2007. Poxviridae: the viruses and their replication. In Knipe D., Howely P.(Eds.), Fields' Virology. Lippincott Williams & Wilkins; [Google Scholar]
- Nakano, K. , Todo, T. , Zhao, G. , Yamaguchi, K. , Kuroki, S. , Cohen, J.B. , Glorioso, J.C. , Tanaka, M. , 2005. Enhanced efficacy of conditionally replicating herpes simplex virus (G207) combined with 5-fluorouracil and surgical resection in peritoneal cancer dissemination models. J. Gene Med. 7, 638–648. [DOI] [PubMed] [Google Scholar]
- Ohwada, S. , Kobayashi, I. , Maemura, M. , Satoh, Y. , Ogawa, T. , Iino, Y. , Morishita, Y. , 1996. Interferon potentiates antiproliferative activity of CPT-11 against human colon cancer xenografts. Cancer Lett. 110, 149–154. [DOI] [PubMed] [Google Scholar]
- Ottolino-Perry, K. , Diallo, J.S. , Lichty, B.D. , Bell, J.C. , Andrea McCart, J. , 2010. Intelligent design: combination therapy with oncolytic viruses. Mol. Ther. 18, 251–263. [DOI] [PMC free article] [PubMed] [Google Scholar]
- Ottolino-Perry, K. , Tang, N. , Head, R. , Ng, C. , Arulanandam, R. , Angarita, F.A. , Acuna, S.A. , Chen, Y. , Bell, J. , Dacosta, R.S. , McCart, J.A. , 2014. Tumor vascularization is critical for oncolytic vaccinia virus treatment of peritoneal carcinomatosis. Int. J. Cancer. 134, 717 [DOI] [PubMed] [Google Scholar]
- Patel, M.R. , Kratzke, R.A. , 2013. Oncolytic virus therapy for cancer: the first wave of translational clinical trials. Transl. Res. 161, 355–364. [DOI] [PubMed] [Google Scholar]
- Pommier, Y. , 2006. Topoisomerase I inhibitors: camptothecins and beyond. Nat. Rev. Cancer. 6, 789–802. [DOI] [PubMed] [Google Scholar]
- Satoh, T. , Hosokawa, M. , Atsumi, R. , Suzuki, W. , Hakusui, H. , Nagai, E. , 1994. Metabolic activation of CPT-11, 7-ethyl-10-[4-(1-piperidino)-1-piperidino]carbonyloxycamptothecin, a novel antitumor agent, by carboxylesterase. Biol. Pharm. Bull. 17, 662–664. [DOI] [PubMed] [Google Scholar]
- Smith, G.L. , Benfield, C.T. , Maluquer de Motes, C. , Mazzon, M. , Ember, S.W. , Ferguson, B.J. , Sumner, R.P. , 2013. Vaccinia virus immune evasion: mechanisms, virulence and immunogenicity. J. Gen. Virol. 94, 2367 [DOI] [PubMed] [Google Scholar]
- Sobol, P.T. , Boudreau, J.E. , Stephenson, K. , Wan, Y. , Lichty, B.D. , Mossman, K.L. , 2010. Adaptive antiviral immunity is a determinant of the therapeutic success of oncolytic virotherapy. Mol. Ther. 19, 335–344. [DOI] [PMC free article] [PubMed] [Google Scholar]
- Song, C.K. , Han, H.D. , Noh, K.H. , Kang, T.H. , Park, Y.S. , Kim, J.H. , Park, E.S. , Shin, B.C. , Kim, T.W. , 2007. Chemotherapy enhances CD8(+) T cell-mediated antitumor immunity induced by vaccination with vaccinia virus. Mol. Ther. 15, 1558–1563. [DOI] [PubMed] [Google Scholar]
- Tai, L.H. , de Souza, C.T. , Belanger, S. , Ly, L. , Alkayyal, A.A. , Zhang, J. , Rintoul, J.L. , Ananth, A.A. , Lam, T. , Breitbach, C.J. , Falls, T.J. , Kirn, D.H. , Bell, J.C. , Makrigiannis, A.P. , Auer, R.A. , 2013. Preventing postoperative metastatic disease by inhibiting surgery-induced dysfunction in natural killer cells. Cancer Res. 73, 97–107. [DOI] [PubMed] [Google Scholar]
- Takakura, M. , Nakamura, M. , Kyo, S. , Hashimoto, M. , Mori, N. , Ikoma, T. , Mizumoto, Y. , Fujiwara, T. , Urata, Y. , Inoue, M. , 2010. Intraperitoneal administration of telomerase-specific oncolytic adenovirus sensitizes ovarian cancer cells to cisplatin and affects survival in a xenograft model with peritoneal dissemination. Cancer Gene Ther. 17, 11–19. [DOI] [PMC free article] [PubMed] [Google Scholar]
- Wali, A. , Strayer, D.S. , 1999. Infection with vaccinia virus alters regulation of cell cycle progression. DNA Cell Biol. 18, 837–843. [DOI] [PubMed] [Google Scholar]
- Wang, E. , Bussom, S. , Chen, J. , Quinn, C. , Bedognetti, D. , Lam, W. , Guan, F. , Jiang, Z. , Mark, Y. , Zhao, Y. , Stroncek, D.F. , White, J. , Marincola, F.M. , Cheng, Y.C. , 2011. Interaction of a traditional Chinese Medicine (PHY906) and CPT-11 on the inflammatory process in the tumor microenvironment. BMC Med. Genomics. 4, 38 8794-4-38 [DOI] [PMC free article] [PubMed] [Google Scholar]
- Yang, J.S. , Nam, H.J. , Seo, M. , Han, S.K. , Choi, Y. , Nam, H.G. , Lee, S.J. , Kim, S. , 2011. OASIS: online application for the survival analysis of lifespan assays performed in aging research. PLoS One. 6, e23525 [DOI] [PMC free article] [PubMed] [Google Scholar]
- Yu, Y.A. , Galanis, C. , Woo, Y. , Chen, N. , Zhang, Q. , Fong, Y. , Szalay, A.A. , 2009. Regression of human pancreatic tumor xenografts in mice after a single systemic injection of recombinant vaccinia virus GLV-1h68. Mol. Cancer. Ther. 8, 141–151. [DOI] [PMC free article] [PubMed] [Google Scholar]
- Zaoui, K. , Bossow, S. , Grossardt, C. , Leber, M.F. , Springfeld, C. , Plinkert, P.K. , Kalle, C. , Ungerechts, G. , 2012. Chemovirotherapy for head and neck squamous cell carcinoma with EGFR-targeted and CD/UPRT-armed oncolytic measles virus. Cancer Gene Ther. 19, 181–191. [DOI] [PubMed] [Google Scholar]
- Ziauddin, M.F. , Guo, Z.S. , O'Malley, M.E. , Austin, F. , Popovic, P.J. , Kavanagh, M.A. , Li, J. , Sathaiah, M. , Thirunavukarasu, P. , Fang, B. , Lee, Y.J. , Bartlett, D.L. , 2010. TRAIL gene-armed oncolytic poxvirus and oxaliplatin can work synergistically against colorectal cancer. Gene Ther. 17, 550–559. [DOI] [PMC free article] [PubMed] [Google Scholar]
Associated Data
This section collects any data citations, data availability statements, or supplementary materials included in this article.
Supplementary Materials
The following are the supplementary data related to this article:
Supplemental Figure 1 Effect of oxaliplatin on virus gene expression and replication. Viral RFP expression was evaluated in the presence and absence of OX. Cells were infected at MOI 0.1 and treated with increasing concentrations of drug. Fluorescence microscopy was performed at 24–72 h post treatment (A) and virus replication was determined (B–D). Data represent the mean plaque forming units (pfu) of triplicate values ± SD. *p < 0.05.
Supplemental Figure 2 VV and SN‐38 in vitro interaction. Dose response (A) and drug–drug interactions (B) were evaluated in DLD1 cells treated with vvDD and SN‐38 at a 1:1 (MOI:μM) dose ratio. (B) The combination index (CI) was less than 1 at all doses tested (0.001, 0.01, 0.1, 0.5, 1) indicating synergistic cell killing. Data represent mean fraction viability relative to DMSO treated controls ± SEM (A) or CI at the doses tested.
Supplemental Figure 3 Cell cycle analysis in HT29 cells treated at non‐synergistic doses of vvDD and SN‐38. HT29 cells were treated with vvDD (MOI = 0.1) and/or SN‐38 (0.02 μM) and analyzed by flow cytometry following DAPI staining at 48 hpi. The experiment was performed in triplicate and bars represent the mean ± SD. *p < 0.05, one‐way ANOVA with Bonferroni's multiple comparison test.
Supplemental Figure 4 Combination therapy in a syngeneic model of CRC. C57BL/6 mice bearing IP MC38 tumours were treated with IP vvDD (day 12; 109 pfu) and/or IP CPT‐11 (day 10, 14, 18, 22; 30 mg/kg) or vehicle alone. Survival was significantly improved in all treatment groups relative to the control group, however combination therapy was not better than either monotherapy. Median survival was: 21 d (HBSS), 26 d (CPT‐11, p = 0.0003), 24 d (vvDD, p = 0.023) and 26.6 d (vvDD + CPT‐11, p = 0.0003).