

Abstract
Recurrent gain on chromosome 3q26 encompassing the gene locus for the transcription factor SOX2 is a frequent event in human squamous cell carcinoma, including head and neck squamous cell carcinoma (HNSCC). Numerous studies demonstrated that SOX2 expression and function is related to distinct aspects of tumor cell pathophysiology. However, the underlying molecular mechanisms are not well understood, and the correlation between SOX2 expression and clinical outcome revealed conflicting data. Transcriptional profiling after silencing of SOX2 expression in a HNSCC cell line identified a set of up‐regulated genes related to cell motility (e.g. VIM, FN1, CDH2). The inverse regulation of SOX2 and aforementioned genes was validated in 18 independent HNSCC cell lines from different anatomical sites. The inhibition of cell migration and invasion by SOX2 was confirmed by constant or conditional gene silencing and accelerated motility of HNSCC cells after SOX2 silencing was partially reverted by down‐regulation of vimentin. In a retrospective study, SOX2 expression was determined by immunohistochemical staining on tissue microarrays containing primary tumor specimens of two independent HNSCC patient cohorts. Low SOX2 expression was found in 19.3% and 44.9% of primary tumor specimens, respectively. Univariate analysis demonstrated a statistically significant correlation between low SOX2 protein levels and reduced progression‐free survival (Cohort I 51 vs. 16 months; Cohort II 33 vs. 12 months) and overall survival (Cohort I 150 vs. 37 months; Cohort II 33 vs. 16 months). Multivariate Cox proportional hazard model analysis confirmed that low SOX2 expression serves as an independent prognostic marker for HNSCC patients. We conclude that SOX2 inhibits tumor cell motility in HNSCC cells and that low SOX2 expression serves as a prognosticator to identify HNSCC patients at high risk for treatment failure.
Keywords: Cell motility, Gene expression profiling, Immunohistochemistry, Prognostic biomarker, Tissue microarray
1. Introduction
Head and neck cancer is one of the most prevalent human malignancies worldwide with a five‐year survival rate for advanced stages of less than 50% (Leemans et al., 2011). The vast majority of head and neck cancer represents squamous cell carcinoma (HNSCC) arising from the epithelial lining of the upper aero‐digestive tract (Pai and Westra, 2009). Dominant risk factors are tobacco and alcohol consumption as well as infection by high‐risk types of human papilloma virus (HPV). Although improvements have been achieved in early detection, surgical techniques, radiation therapy protocols and chemotherapeutic regimes, better outcomes for patients with HNSCC remains still a major challenge (Haddad and Shin, 2008).
Similar to other solid tumors, genetic abnormalities such as recurrent gene copy alterations are frequently found in HNSCC and are thought to be critically involved in neoplastic transformation and malignant progression (Choi and Myers, 2008). High throughput genetic analysis yielded new insights into genomic aberrations and the mutational landscape of HNSCC patients (Agrawal et al., 2011; Network, 2015; Pickering et al., 2013; Stransky et al., 2011). However, only few data are available regarding how common somatic mutations or copy number alterations are related to the prognosis and the clinical outcome of HNSCC patients. Hence, the identification of informative molecular biomarkers to assist treatment decision‐making and to enable efficient and less toxic therapy of HNSCC patients is urgently needed. Recently, we reported recurrent copy number gain of the gene locus encoding the transcription factor SOX2 (sex determining region Y‐box 2) in oral squamous cell carcinoma (Freier et al., 2010b). SOX2 was identified as a lineage‐survival oncogene in lung and esophageal SCC (Bass et al., 2009), and high SOX2 expression levels were found in several human malignancies such as breast cancer (Rodriguez‐Pinilla et al., 2007), sinonasal cancers (Schröck et al., 2013) or glioblastoma (Fang et al., 2011). SOX2 has also been reported as a key player in the maintenance and self‐renewal of embryonic as well as adult stem cells (Boyer et al., 2005), and is one of the crucial transcription factors implicated in reprogramming of differentiated cells into an induced pluripotent stem cell‐like phenotype (Takahashi and Yamanaka, 2006; Yu et al., 2007). Notably, several reports have suggested a crucial impact of regulatory networks controlling the function of stem cells in the pathogenesis of certain tumors, including HNSCC (Ben‐Porath et al., 2008).
Despite the growing evidence demonstrating an important oncogenic function of SOX2 in tumor initiation and progression (Boumahdi et al., 2014; Tam and Ng, 2014), data on its correlation with clinical outcome, specifically for HNSCC patients, are sparse. The current study aims to highlight the role of SOX2 in HNSCC pathophysiology by applying in vitro and in silico analyses combined with expression analysis using retrospective patient cohorts. The final goal is addressing the question whether SOX2 expression in primary HNSCC could serve as a prognosticator for patients at a high‐risk for treatment failure and to understand the underlying molecular principles.
2. Materials and methods
2.1. HNSCC cell lines
HNSCC cell lines were established and cultured as previously described (Freier et al., 2010a; Ninck et al., 2003). Plasmids for stable SOX2 silencing in HNO223 cells were generated by cloning shRNA sequences (Supplementary Table 1) into the pSUPER‐dL_Zeo vector following digestion with BglII and HindIII restriction enzymes as described previously (Pscherer et al., 2006). Successful cloning was confirmed by sequencing. HNO223 cells were transfected with Effectene Transfection Reagent (Qiagen, Germany), and selection for stable integration was done using 60 μg/mL of Zeocin (Invitrogen, Germany). Plasmids for inducible SOX2 silencing were generated by cloning the shRNA sequences (Supplementary Table 1) into pLKO‐Tet‐On lentiviral vector (Wiederschain et al., 2009) after digestion with AgeI and EcoRI restriction enzymes (Thermo Scientific, Germany). Transfections were carried out using TransIT‐LT1 (Mirus Bio LLC, Madison, USA) and HNO41 cells were infected as previously described (Wiederschain et al., 2009). Selection for stable integration was done using 1 μg/mL of puromycin (Sigma–Aldrich). Conditional SOX2 silencing was achieved by administration of 1 μg/mL doxycycline (Sigma–Aldrich) every second day. The plasmid for ectopic SOX2 overexpression in HNO147 and HNO220 cells was generated by the Gateway LR cloning system (Life Technologies) using the pDEST26 and pDONR221–SOX2 plasmids, which were obtained from the DKFZ core facility. HNO147 and HNO220 cells were transfected with FuGene HD Transfection Reagent (Promega, Germany) according to the manufacturer's instruction. Transfected cells were cultured in the presence of 1 μg/mL puromycin for one week to enrich the relative amount of cells with ectopic overexpression.
2.2. RNA preparation and quantitative real‐time PCR
mRNA was isolated using Qiagen RNeasy Mini kit (Qiagen) according to the manufacturer's instructions and reverse transcribed into cDNA using RevertAid H Minus‐MuLV RT and oligo‐dT primers (Fermentas, Thermo Scientific, Germany). Relative quantification of gene transcription was performed by quantitative real‐time PCR (q‐RT‐PCR) using the StepOnePlus real‐time PCR system of Applied Biosystems and power SYBR Green PCR Master Mix (Applied Biosystems, Germany). Relative expression of genes of interest was determined using the ΔCt method and expression was normalized using housekeeping genes (ACTB and RPLP0). Primers are listed in Supplementary Table 2. Samples were analyzed in triplicates and StepOne Software v2.2 was used for data analysis.
2.3. Western blot analysis
Whole cell protein lysate was extracted using Radioimmunoprecipitation assay buffer (Wiechert et al., 2012) and protease and phosphatase inhibitor cocktail (Sigma–Aldrich). 20 μg of denatured protein were separated by Sodiumdodecylsulfate‐polyacrylamide gel electrophoresis (SDS‐PAGE) and transferred to polyvynil difluoride (PVDF) membranes (Millipore, Germany). After blocking with 5% milk (Roth, Germany), membrane was incubated with primary and horseradish peroxidase coupled‐secondary antibodies (Supplementary Table 3). Membranes were incubated in enhanced chemiluminiscence solution (Thermo Scientific, Germany) and developed with a classic E.O.S. developer (Agfa, Germany).
2.4. Global gene expression analysis
Gene expression profiling was performed using the Human GE 4 × 44K v2 Microarray (Agilent, Germany). Total RNA was extracted from stable HNO223‐shLuci and HNO223‐shSOX2 cell lines from two independent experiments. RNA quality was determined with the Agilent 2100 Bioanalyzer (Agilent, Germany). 1 μg of RNA was used for cDNA synthesis and labeled in two different colors, following manufacturer procedures (Two‐Color Microarray‐Based Gene Expression Analysis, Agilent). After hybridization, slides were washed and immediately scanned with an Agilent DNA Microarray Scanner G 2505 C. Agilent Feature Extraction Software Version 10.7 was used to extract and pre‐process the data. The log2 fold change and the adjusted P‐value (P ≤ 0.05) were considered for identification of differentially expressed genes using limma package in R statistical environment (R Core Team, 2014; Smyth, 2005). Functional enrichment analysis was performed using the Babelomics platform (Al‐Shahrour et al., 2008).
2.5. Migration and invasion assays
Cell migration assays were performed in triplicate using ibidi Culture‐Inserts (Ibidi®, Germany) following the manufacturer's instructions. After attachment cells were treated with 10 μg/mL Mitomycin C (Sigma–Aldrich) for one hour. Silencing of vimentin expression was achieved by transient transfection with Lipofectamine® 2000 Transfection Reagent (Life Technologies) using VIM (ID 7431) Trilencer‐27 Human siRNA (Origene, Germany). ImageJ Segmentation Plugin was used to calculate the migration rate (Schneider et al., 2012). Invasion assays were conducted using 8 micron pore size Corning BioCoat Matrigel Invasion Chambers (Corning), following instructions of the manufacturer.
2.6. Co‐immunofluorescence staining
Cells were seeded on coverslips and cultured under normal growth conditions. Fixation was done with 4% (v/v) formaldehyde in PBS, followed by permeabilization with 0.5% Triton X‐100 in PBS and blocking in 1%BSA/0.2%Tween 20 in PBS. Primary and secondary antibodies are listed in the Supplementary Table 3. Cell nuclei were counterstained with Hoechst H33342 (Calbiochem, Merck, Germany) and coverslips were embedded on slides with Mowiol (6 g glycerol, 2.4 g Mowiol 4‐88, 6 mL H2O). Representative pictures were taken with a fluorescence microscope Nikon Eclipse Ti at 20× objective magnification.
2.7. Cohort characterization, clinical and histopathological description
Two independent cohorts where used for this retrospective and monocentric study. The first cohort comprised 218 HNSCC patients treated at the University Hospital Heidelberg between the years 1990 and 2008 by surgery with or without adjuvant/neoadjuvant radiochemotherapy. Paraffin‐embedded tissue specimens from surgical resections and biopsies were provided by the tissue bank of the National Center for Tumor Disease (NCT, Institute of Pathology, University Hospital Heidelberg) after approval by the local institutional review board (ethic vote 206/2005). Follow‐up data (median follow‐up = 34 month ranging from 3 to 216 months) were available for all tumor samples at the Department of Otolaryngology, Head and Neck Surgery at the University Hospital Heidelberg, and clinical as well as histopathological features are summarized in Supplementary Table 4. First‐line treatment of patients, surgery (n = 146) or neoadjuvant chemo/radiotherapy (n = 36), was also assessed if the information was available. The second cohort comprised biopsy specimens of 69 patients treated exclusively non‐surgically by definite radiochemotherapy, definite radioimmunotherapy or inductive chemotherapy before either radiochemotherapy or radioimmunotherapy, for locally advanced HNSCC between January of 2006 and June of 2009, and is based on two clinically well‐annotated patient cohorts whose clinical characteristics have been previously published (Jensen et al., 2010, 2011). A summary of the clinical and histopathological features of the second cohort is shown in Supplementary Table 5.
The HPV DNA status and HPV16 RNA analysis were determined as described previously (Halec et al., 2013; Holzinger et al., 2012), and was available for 174 patients of the first cohort. Briefly, based on the results of Multiplex HPV Genotyping (Schmitt et al., 2006, 2008) and of viral RNA pattern analysis (Schmitt et al., 2010) on fresh‐frozen OPSCC specimens, the tumors were divided into two groups: 1) HPV non‐driven (n = 144), representing tumors negative for HPV DNA or negative for viral RNA patterns, and 2) HPV driven (n = 30), representing tumors positive for HPV16 DNA and with viral RNA expression patterns. HPV status for Cohort II was determined by immunohistochemistry detection of p16Ink4 protein expression as a surrogate marker for HPV, followed by Luminex®‐based multiplexed genotyping for detection of HPV‐specific DNA as described previously (Tinhofer et al., 2015). Patients of Cohort II were grouped as HPV non‐driven (n = 61) and HPV driven (n = 8).
2.8. Tissue microarrays and immunohistochemical staining
The generation of TMAs has been described previously (Roesch Ely et al., 2005). Briefly, sections were cut from each donor block and stained with hematoxylin and eosin to define representative tumor regions. Small tissue cylinders (ranging from 1 to 7 probes per patient) with a diameter of 0.6 mm were taken from selected areas of each donor block using a tissue chip microarrayer (Beecher Instruments, Silver Spring, MD, USA) and transferred to a recipient paraffin block. 2 μm histological sections were cut from the recipient paraffin block by using standard techniques. Immunohistochemical (IHC) staining with the anti‐human SOX2 (D6D9) XP® and anti‐human VIM 3B4 antibodies (Supplementary Table 3A) was done using the 3, 3′‐diaminobenzidine (DAB) peroxidase substrate kit according to the manufacturer's instructions (Vector Laboratories, Burlingame, U.S.A.).
2.9. Scoring system and cohorts statistical analyses
Tissue microarrays were scanned using the Nanozoomer HT Scan System (Hamamatsu Photonics, Japan), able to generate digital images and allowing large‐scale histological evaluation across the complete section. The slides were scanned at a 40‐fold magnification (0.23 μm/pixel). Three independent experienced observers analyzed the scanned slides by using the NDP Viewer software (version 1.1.27). For the semi‐quantitative analysis of the tumors, two parameters were taking into account: first, the relative number of tumor cells with SOX2 immunoreactivity (score 1: no positive cells, score 2: less than 33%, score 3: between 34% and 66%, and score 4: more than 66% positive cells) and second, the staining intensity (score 1: no staining, score 2: weak staining, score 3: moderate staining, and score 4: strong staining). The median value of the score assigned by the three observers per tumor specimen was calculated, and the values for the relative number of stained tumor cells and the staining intensity (both ranging 1–4) were multiplied, resulting in a final expression score ranging from 1 to 16. In total 218 patients of the first cohort and 69 of the second cohort revealed informative values for the SOX2 staining. Patient final scores were grouped in quartiles (1–4; 5–8; 9–12; 13–16). The method of Kaplan–Meier was used to estimate the overall survival distribution, and differences between groups were determined by log‐rank tests, highlighting two distinct groups in terms of survival. Accordingly, for the subsequent analyses patients were grouped into two classes: patients with no or very weak SOX2 expression (final expression score 1–4, herein referred as SOX2low), and those with moderate to high SOX2 expression (final expression score 5–16, herein referred as SOX2high). All statistical analysis was performed using SigmaPlot® (version 12.5) and SAS® (version 19.2) statistical software. Differences between the groups were assessed using Chi square test. Overall survival (OS) was calculated as the time from the date of primary tumor diagnosis to the date of HNSCC related death within the follow‐up interval. Progression‐free survival (PFS) was calculated from the date of primary tumor diagnosis to the date of the first local recurrence, lymph node or distant metastasis, second primary carcinoma or date of HNSCC related death within the follow‐up period (events), or to the date of HNSCC unrelated death or without progression (censored). A multivariate Cox proportional hazard model was used to assess the association between SOX2 expression scores and overall and progression‐free survival of HNSCC patients from both cohorts, together with covariates age, clinical stage (IV vs. I–III), gender (female vs. male), alcohol and tobacco consumption (never vs. former vs. current consumer), tumor subsite (Cohort I: oropharynx vs. larynx; Cohort II: oropharynx vs. hypopharynx vs. larynx vs. oral cavity vs. nasopharynx vs. tumor of multiple localizations), HPV status (driven vs. non‐driven) and, in the case of the Cohort I, first line therapy (neoadjuvant chemo/radiotherapy vs. surgery). The validity of the proportional hazards assumption was tested with Schoenfeld residuals and was met for all covariates. A P‐value below 0.05 was considered as statistically significant.
2.10. Statistics
Statistical analyses were performed using SigmaPlot® (version 12.5) and SAS® (version 19.2) statistical softwares. Experiments were done in triplicate. Data represent mean ± standard error of mean. Normality was tested by Kolmogorov–Smirnov or Shapiro–Wilke Tests. Statistical significance was calculated by two‐sided t‐test if data distributed normally or Mann–Whitney U test. A P‐value <0.05 was considered as statistically significant.
3. Results
3.1. SOX2‐related genetic network in HNSCC cell lines
HNO223 cells were transfected with shRNA expression plasmids to generate two independent cell lines with stable SOX2 silencing (HNO223‐shSOX2#1 and HNO223‐shSOX2#2), and one control cell line (HNO223‐shLuci). Efficient silencing of SOX2 expression in HNO223‐shSOX2 cells was confirmed on transcript (Figure 1A) and protein levels (Supplementary Figure 1A) with respect to HNO223‐shLuci controls. Next, we prepared total RNA from the three cell lines and conducted global gene expression profiling, which revealed 716 differentially expressed genes (adjusted P‐value < 0.05). 258 genes were up‐regulated and 458 genes down‐regulated in HNO223‐shSOX2 cell lines as compared to control cells, of which the top genes according to the logarithmic fold change are listed in Figure 1B. Differential transcription of selected genes, including SOX2, VIM, FN1 and CDH2 was confirmed by quantitative real time‐PCR (Figure 1C). Single enrichment analysis according to the functional annotation of differentially expressed genes revealed a significant over‐representation of distinct Gene Ontology terms, such as cell motility, regulation of locomotion or response to wounding (Figure 1D), suggesting a strong impact of the SOX2‐related genetic program on tumor cell mobility. It is also worth noting that numerous up‐regulated genes in HNO‐shSOX2 cells, such as VIM, HMGA2, FN1 and CDH2, indicated the presence of a mesenchymal‐like phenotype. However, the lack of significant changes in CDH1, TWIST1, SNAI1, SNAI2, ZEB1 or 2, questioned the existence of a classical epithelial‐to‐mesenchymal transition.
Figure 1.
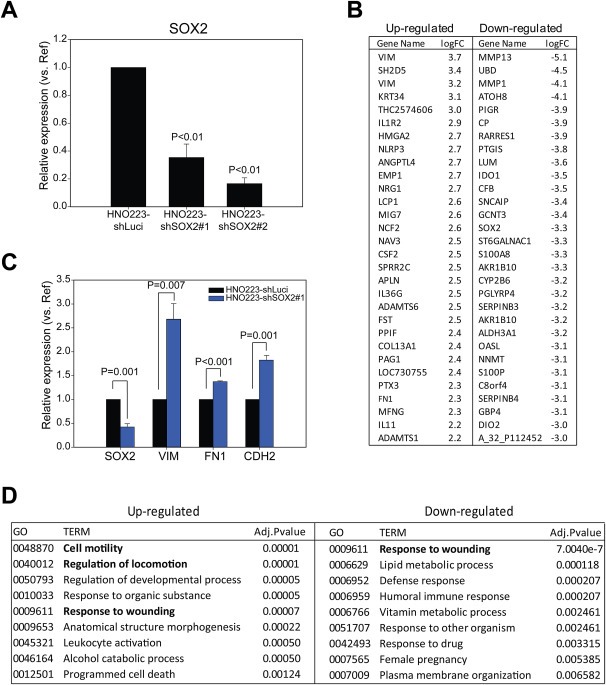
SOX2 silencing in HNO223 cells triggers up‐regulation of genes related to cellular movement. (A) q‐RT‐PCR analysis with cDNA derived from HNO223‐shLuci, HNO223‐shSOX2#1 and HNO223‐shSOX2#2 cells revealed significant silencing of SOX2 expression. SOX2 transcript levels in HNO223‐shLuci controls was set to one and relative reduction is depicted as mean value + SEM of three independent experiments. (B) Top differentially up‐ and down‐regulated genes as determined by global expression profiling with total RNA derived from HNO223‐shLuci, HNO223‐shSOX2#1 and HNO223‐shSOX2#2 cells. (C) Up‐regulation of selected candidate genes (VIM, FN1 and CDH2) in HNO223‐shSOX2#1 as compared to HNO223‐shLuci controls was confirmed by q‐RT‐PCR analysis. Transcript levels in HNO223‐shLuci controls was set to one and relative induction is depicted as mean value + SEM of three independent experiments. (D) Over‐representation of functional annotations by single enrichment analysis of statistically significant up‐ and down‐regulated genes. P ≤ 0.05 is considered as statistically significant value.
3.2. Inverse regulation of SOX2 and VIM in HNSCC cell lines
To confirm inverse regulation of the SOX2 expression status and genes implicated in tumor cell motility, we screened a set of 18 independent HNSCC cell lines with (n = 10) or without (n = 8) copy number gain of the SOX2 locus (Freier et al., 2010a; Ninck et al., 2003). Quantitative real time‐PCR revealed a clear tendency of inverse regulation for VIM, FN1 and CDH2 (Figure 2A; Supplementary Table 6). Next, we generated stable HNO41 cell lines, a second HNSCC cell line with 3q26 amplification, with a doxycycline (Dox) inducible silencing of SOX2 expression. Two independent shRNA sequences were used to establish HNO41‐shSOX2#1Tet and HNO41‐shSOX2#2Tet cell lines, and a non‐targeted shRNA was used to establish HNO41‐shNTTet controls. Conditional silencing of SOX2 transcript levels was found 24, 48 and 96 h after Dox treatment in HNO41‐shSOX2#1Tet and HNO41‐shSOX2#2Tet cells, but not in HNO41‐shNTTet controls (Figure 2B–C).
Figure 2.
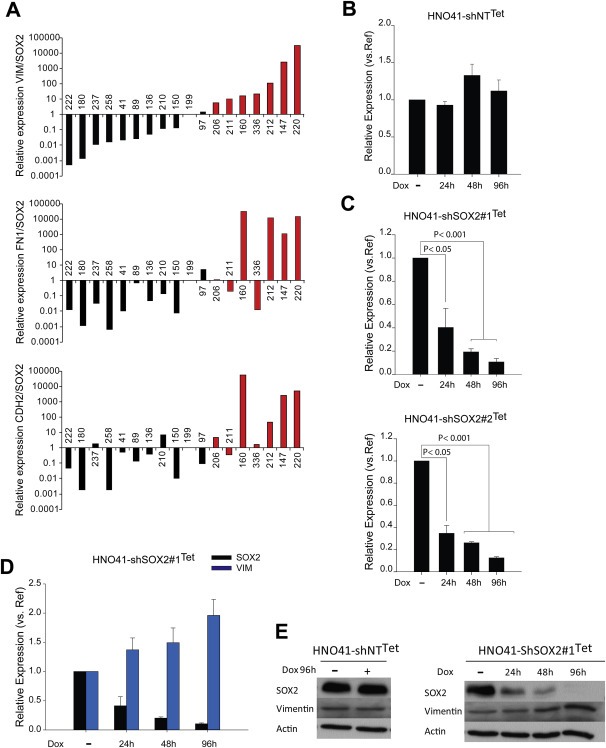
SOX2 and vimentin are inversely correlated in HNSCC tumor cells. (A) q‐RT‐PCR analysis of SOX2, VIM, FN1 and CDH2 in 18 tumor derived‐HNSCC cell lines with (black bars) or without (red bars) copy number gain of the SOX2 locus. Relative expression respect to housekeeping gene ACTB and RPLP0 was determined for each gene. Ratio of VIM, FN1 or CDH2 expression respect to SOX2 was calculated. (B) q‐RT‐PCR analysis of SOX2 in non‐targeted HNO41‐shNTTet cell line. (C) Conditional silencing of SOX2 transcription in two independent cell lines (HNO41‐shSOX2#1Tet and HNO41‐shSOX2#2Tet) at the indicated time points after doxycycline treatment (1 μg/mL Dox) was confirmed by q‐RT‐PCR analysis. SOX2 transcript levels in the absence of Dox (−) was set to one and relative reduction is depicted as mean value + SEM of three independent experiments. P ≤ 0.05 was considered as statistically significant difference. (D) Inverse regulation of SOX2 and VIM transcript levels in HNO41‐shSOX2#1Tet at the indicated time points after Dox treatment was demonstrated by q‐RT‐PCR analysis. Transcript levels in the absence of Dox (−) was set to one and relative reduction of SOX2 or induction of VIM is depicted as mean value + SEM of three independent experiments. (E) Western blot analysis of SOX2 and vimentin expression at indicated time points with whole cell lysate derived from non‐targeted HNO41‐shNTTet cells with (+) or without (−) Dox treatment (left panel) or HNO41‐shSOX2#1Tet cells (right panel). Detection of β‐Actin served as loading control for protein quantity and quality.
The class‐III intermediate filament vimentin, which is typically expressed in mesenchymal cells, showed the highest induction of all up‐regulated genes in HNO223‐shSOX2 cell lines (Figure 1B). Indeed, conditional silencing of SOX2 was accompanied by increased vimentin expression on transcript and protein levels in Dox treated HNO41‐shSOX2Tet cells, but no change was found in Dox treated HNO41‐shNTTet controls (Figure 2D–E). An inverse and mutually exclusive protein expression was already evident by co‐immunofluorescence staining of HNO‐shLuci control and HNO41‐shSOX2Tet cell lines in the absence of Dox, while silencing of SOX2 expression in HNO223‐shSOX2 cells as well as HNO41‐shSOX2Tet cells after Dox treatment, revealed a strong induction in the relative amount of Vimentin‐positive cells (Supplementary Figure 1A–B).
To further support our previous findings on an inverse regulation of SOX2 and vimentin HNO147 and HNO 220 cells, which were characterized by a high VIM/SOX2 ratio (Figure 2A) were transfected with a SOX2 expression plasmid. Co‐immunofluorescence staining confirmed high vimentin expression in both cell lines lacking nuclear SOX2 staining, while ectopic SOX2 overexpression in HNO147 and HNO220 cells after transfection revealed a strong reduction in vimentin staining (Supplementary Figure 2).
3.3. Silencing of SOX2 induces tumor cell mobility via vimentin up‐regulation
To determine whether SOX2 plays a critical role in controlling tumor cell mobility, we performed a migration assay using the established cell lines with conditional SOX2 silencing. Dox treated HNO41‐shSOX2#1Tet cells exhibited a significantly higher migration capacity in comparison to non‐treated controls or HNO41‐shNTTet cells with or without Dox administration (Figure 3A). A faster migration was also evident for HNO223‐shSOX2 cells as compared to HNO223‐shLuci controls (Supplementary Figure 3), supporting an inhibitory role of SOX2 during tumor cell migration. Co‐immunofluorescence staining demonstrated the presence of vimentin‐positive but SOX2‐negative tumor cells at the migratory border of HNO41‐shNTTet controls and HNO41‐shSOX2#1Tet cells in the absence of Dox treatment (Figure 3B), and the number of vimentin‐positive tumor cells was strongly increased in HNO41‐shSOX2#1Tet cells after Dox treatment. Next, we carried out a matrigel Boyden chamber assay to investigate the role of SOX2 silencing on tumor cell invasion. An increased number of invading cells was observed for HNO41‐shSOX2#1Tet and HNO41‐shSOX2#2Tet cells after Dox treatment as compared to HNO41‐shSOX2#1Tet and HNO41‐shSOX2#2Tet cells in the absence of Dox or HNO41‐shNTTet controls (Supplementary Figure 4).
Figure 3.
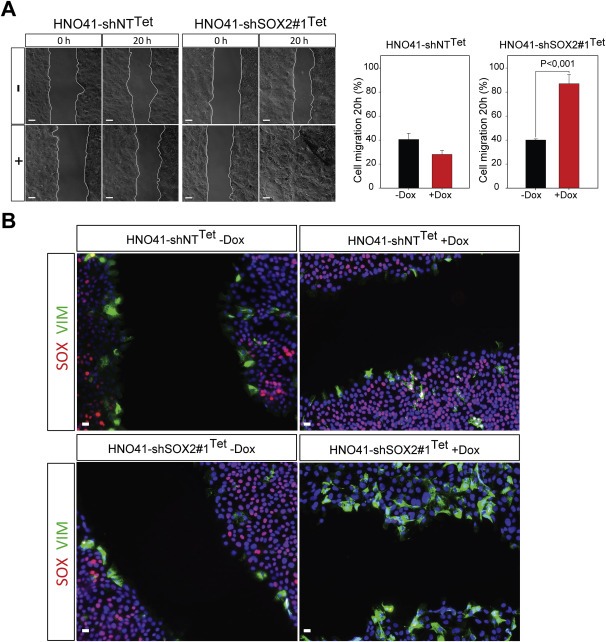
Accelerated migration of HNO41‐shSOX2Tetcells after Dox‐induced silencing of SOX2. (A) Representative phase contrast pictures of HNO41‐shNTTet and HNO41‐shSOX2#1Tet cells with (+) or without (−) 1 μg/mL Dox pre‐treatment (96 h) at the indicated time points after in vitro scratch wounding. Graphs summarize the quantification of the relative gap closure 20 h after in vitro scratch wounding, which is depicted as mean value + SEM of three independent experiments. P ≤ 0.05 is considered as statistically significant difference. (B) Representative pictures for SOX2 (red signal) and Vimentin (green signal) protein expression at the migration border 8 h after in vitro scratch wounding as determined by co‐immunofluorescence staining of HNO41‐shNTTet and HNO41‐shSOX2#1Tet cells with (+) or without (−) 1 μg/mL Dox pre‐treatment. Cell nuclei were counterstained with Hoechst H33342. Scale bars = 200 μm.
To evaluate whether up‐regulation of vimentin plays a causal role in increased migration of HNSCC cell lines after SOX2 silencing, we inhibited vimentin expression by transient transfection with two independent siRNAs. Down‐regulation of vimentin had no major impact on the migration of HNO41‐shNTTet controls and HNO41‐shSOX2#2Tet cells in the absence of Dox (Figure 4A–B). However, silencing of vimentin in HNO41‐shSOX2#2Tet cells with Dox treatment resulted in a significant impairment of migration (Figure 4B), supporting the concept that increased tumor cell migration upon loss of SOX2 expression is partially due to vimentin up‐regulation.
Figure 4.
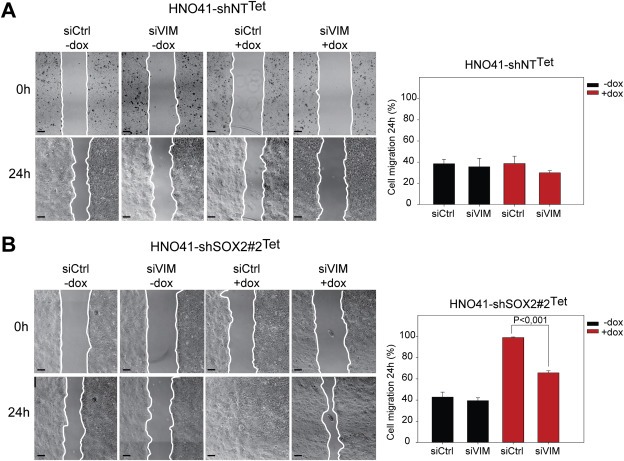
Silencing of vimentin expression partially reverts accelerated migration of HNO41‐shSOX2Tet cells after Dox treatment. Representative phase contrast pictures of HNO41‐shNTTet cells (A) and HNO41‐shSOX2#2Tet cells (B) with (+) or without (−) 1 μg/mL Dox pre‐treatment (96 h) at the indicated time points after in vitro scratch wounding. Both cell lines were either transfected with Control (siCtrl) or vimentin‐specific (siVIM) siRNAs. Scale bars = 200 μm. Graphs summarize the quantification of the relative gap closure 24 h after in vitro scratch wounding, which is depicted as mean value + SE of three independent experiments. P < 0.05 is considered as statistically significant difference.
3.4. SOX2 expression in primary HNSCC and correlation with clinical and histopathological features
A pro‐oncogenic role of SOX2 has been reported for several squamous cell carcinomas, including HNSCC (Bass et al., 2009; Boumahdi et al., 2014; Schröck et al., 2014). However, our in vitro studies unraveled a so far unknown function of SOX2 during malignant progression by inhibiting tumor cell migration and invasion. In order to address the clinical relevance of this finding, we assessed SOX2 expression in a cohort of 218 HNSCC patients (Cohort I, Supplementary Table 4) by IHC staining. Prominent nuclear staining of SOX2 was found in basal and supra‐basal keratinocytes of normal mucosa (Figure 5A–B), while a heterogeneous expression pattern was observed in primary HNSCCs ranging from no (Figure 5C–D), moderate (Figure 5E–F), to very strong staining in almost all tumor cells (Figure 5G–H). Patients were grouped in two categories: patients with no or almost absent SOX2 immunoreactivity (SOX2low), and those with moderate to strong SOX2 protein expression (SOX2high). In total, 19.3% (42/218) of all tumors where categorized as SOX2low and 80.7% (176/218) as SOX2high.
Figure 5.
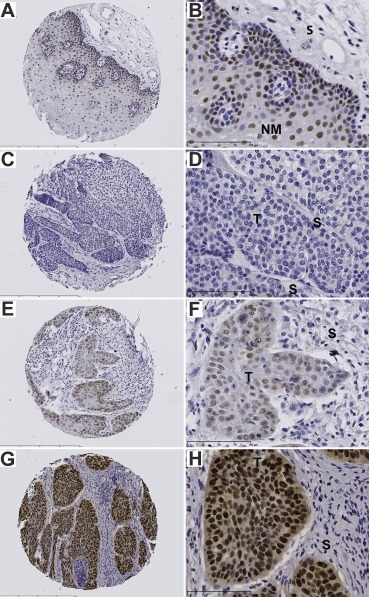
SOX2 protein expression in normal mucosa and primary tumors of HNSCC patients. Representative pictures of SOX2 protein expression (brown signal) in normal mucosa (A–B), and primary tumor sections (C–H) as determined by IHC staining. (C, D) no detectable expression; (E, F) moderate expression; (G, H) strong expression. Counterstaining was performed with hematoxylin to demonstrate tissue architecture. T, tumor; NM, normal mucosa; S, stroma. Bars: a, c, e and g 400 μm; b, d, f and h 100 μm.
Next, we compared tumors with SOX2low and SOX2high staining pattern according to clinical and histopathological features, such as age, gender, TNM status, clinical stage, pathological grade, tumor site and HPV status. No significant difference was found except for tumor localization (Supplementary Table 7). We also determined SOX2 expression in an independent cohort (Cohort II, n = 69, Supplementary Table 5) of cancer patients, who received three modern and combined organ preserving treatment regimens for locally advanced HNSCC (Jensen et al., 2010, 2011). For this cohort, we did not observe any significant difference between SOX2low and SOX2high patient subgroups concerning all clinical or histopathological characteristics tested except for the HPV status (Supplementary Table 8).
3.5. SOX2low expression serves as risk factor for unfavorable clinical outcome
To assess whether SOX2 expression serves as a prognostic factor for the outcome of HNSCC patients, we performed univariate Kaplan–Meier survival analysis. In Cohort I the median progression‐free survival (PFS) was 51 months for the SOX2high and 16 months for the SOX2low subgroup (Figure 6A; P‐value = 0.058). SOX2high tumors had a favorable statistically significant overall survival (OS) (Figure 6B; P‐value = 0.018), with a median OS of 150 months as compared to 37 months for the SOX2low subgroup. Univariate Kaplan–Meier analysis for patients of Cohort II revealed a correlation between SOX2low expression and poor PFS (Figure 6C; P‐value = 0.003) and OS (Figure 6D; P‐value <0.001). For Cohort II the median PFS was 33 months for the SOX2high and 12 months for the SOX2low subgroup, and the median OS of the SOX2high subgroup was 33 months and 16 months for the SOX2low subgroup. As SOX2 expression in Cohort I was significantly associated with the tumor subsite and patients with OPSCC were enriched in the SOX2high subgroup, we performed univariate Kaplan–Meier survival analysis for both cohorts for OPSCC and non‐OPSCC patients, respectively (Supplementary Figure 5). OPSCC patients with low SOX2 expression were associated with reduced overall survival, which was highly significant for Cohort II (P‐value = 0.02) and revealed a clear trend for Cohort I (P‐value = 0.07). Non‐OPSCC patients with low SOX2 expression were associated with reduced overall survival, which was highly significant for both Cohorts (Cohort I: P‐value = 0.001; Cohort II: P‐value = 0.013). In summary, these data strongly support the assumption that low SOX2 protein staining serves as a prognostic biomarker for primary HNSCC and that the predictive value is independent of the anatomical site.
Figure 6.
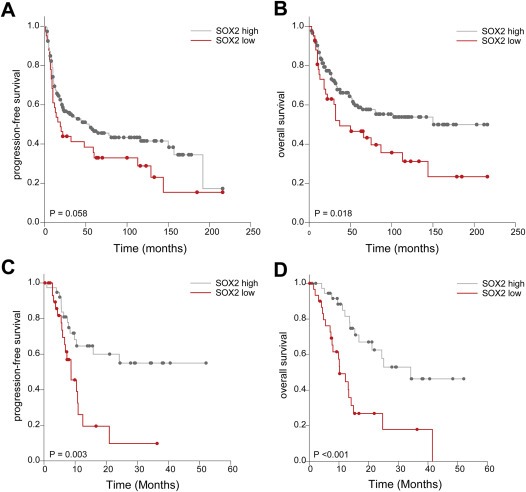
Correlation between SOX2 protein expression and survival of Cohorts I and II. (A) Univariate Kaplan–Meier graph for SOX2low (red line) and SOX2high (gray line) protein levels and progression‐free survival (median progression‐free survival 16 vs. 51 months; P = 0.058) for HNSCC patients in Cohort I. (B) Univariate Kaplan–Meier graph for SOX2low (red line) and SOX2high (gray line) protein levels and overall survival (median overall survival 37 vs. 150 months, P = 0.018) for HNSCC patients in Cohort I. (C) Univariate Kaplan–Meier graph for SOX2low (red line) and SOX2high (gray line) protein levels and progression‐free survival (median progression‐free survival 12 vs. 33 months; P = 0.003) for HNSCC patients of Cohort II. (D) Univariate Kaplan–Meier graph for SOX2low (red line) and SOX2high (gray line) protein levels and overall survival (median overall survival 16 vs. 33 months, P < 0.001) for HNSCC patients of Cohort II.
Next, we calculated a multivariate Cox proportional hazard model of a patient subgroup from Cohort I (n = 144) for whom all data of putative prognostic covariates (age, clinical stage, gender, tobacco and alcohol consumption, primary therapy, tumor subsite, HPV status and SOX2 expression) were available. A statistically significant association was found between primary therapy and OS (surgery vs. radio‐chemotherapy: HR 0.46; 95% CI 0.26–0.83; P‐value <0.001) and HPV status and OS (driven vs. non‐driven: HR 0.35; 95% CI 0.14–0.84; P‐value <0.05) (Table 1). Furthermore, a low SOX2 staining pattern revealed a clear trend towards a higher risk for reduced OS (high vs. low: HR 0.55; 95% CI 0.29–1.02; P‐value = 0.06). PFS was associated with primary therapy (surgery vs. radio‐chemotherapy: HR 0.51; 95% CI 0.30–0.88; P‐value <0.05), HPV status (driven vs. non‐driven: HR 0.42; 95% CI 0.19–0.94; P‐value <0.05) and SOX2 expression (high vs. low: HR 0.56; 95% CI 0.32–0.98; P‐value <0.05). Multivariate Cox proportional hazard model analysis of 55 patients of Cohort II for whom all putative clinical and histopathological covariates where available showed a statistically significant correlation between tumor subsite (hypopharynx vs. oropharynx: HR 0.06; 95% CI 0.01–0.32; P‐value <0.01), HPV status (non‐driven vs. driven: HR 6.53; 95% CI 1.12–38.15; P‐value <0.05) and SOX2 expression (high vs. low: HR 0.13; 95% CI 0.04–0.46; P‐value <0.001) and OS (Table 2). Moreover, PFS was associated with SOX2 (high vs. low: HR 0.17; 95% CI 0.06–0.54; P‐value <0.001).
Table 1.
Multivariate Cox proportional hazard model of OS and PFS for HNSCC patients (cohort I).
| Overall survival | Progression‐free survival | |||
|---|---|---|---|---|
| HR (95% CI) | P‐valuea | HR (95% CI) | P‐valuea | |
| Age | ||||
| >58 vs. ≤58 | 0.84 (0.52–1.35) | 0.48 | 0.94 (0.61–1.45) | 0.77 |
| Clinical stage | ||||
| IV vs. I–III | 1.68 (0.92–3.07) | 0.09 | 1.18 (0.71–1.97) | 0.52 |
| Gender | ||||
| Male vs. female | 1.07 (0.58–1.97) | 0.82 | 1.20 (0.68–2.10) | 0.54 |
| Tobacco | ||||
| Current vs. never | 1.06 (0.28–4.00) | 0.93 | 2.00 (0.55–7.25) | 0.29 |
| Former vs. never | 0.83 (0.18–3.75) | 0.81 | 1.70 (0.41–7.15) | 0.47 |
| Alcohol | ||||
| Current vs. never | 0.82 (0.32–2.13) | 0.69 | 1.04 (0.43–2.56) | 0.92 |
| Former vs. never | 0.60 (0.19–1.92) | 0.39 | 0.75 (0.25–2.26) | 0.60 |
| Tumor subsite | ||||
| Larynx vs. oropharynx | 0.73 (0.34–1.57) | 0.42 | 1.06 (0.57–1.97) | 0.85 |
| Therapy | ||||
| Surgery vs. radiation/chemotherapy | 0.46 (0.26–0.83) | <0.001 | 0.51 (0.30–0.88) | <0.05 |
| HPV | ||||
| Driven vs. non‐driven | 0.35 (0.14–0.84) | <0.05 | 0.42 (0.19–0.94) | <0.05 |
| SOX2 expression score b | ||||
| SOX2high vs. SOX2low | 0.55 (0.29–1.02) | 0.06 | 0.56 (0.32–0.98) | <0.05 |
HR, hazard ratio; CI, confidence intervals.
Statistically significant values are represented in bold.
Adjusted by age, clinical stage, gender, tobacco/alcohol consumption, tumor subsite, therapy regimen and HPV.
Table 2.
Multivariate Cox proportional hazard model of OS for HNSCC patients (cohort II).
| Overall survival | Progression‐free survival | |||
|---|---|---|---|---|
| HR (95% CI) | P‐valuea | HR (95% CI) | P‐valuea | |
| Age | ||||
| >66 vs. ≤66 | 2.41 (0.75–7.68) | 0.14 | 1.58 (0.59–4.19) | 0.36 |
| Clinical stage | ||||
| IV vs. I–III | 1.67 (0.54–5.14) | 0.38 | 0.69 (0.25–1.86) | 0.46 |
| Gender | ||||
| Male vs. female | 0.51 (0.18–1.42) | 0.20 | 0.77 (0.31–1.91) | 0.51 |
| Tobacco | ||||
| Current vs. never | 1.27 (0.31–5.23) | 0.74 | 0.74 (0.22–2.50) | 0.63 |
| Former vs. never | 4.19 (0.49–36.09) | 0.19 | 2.69 (0.36–20.38) | 0.34 |
| Alcohol | ||||
| Current vs. never | 0.62 (0.15–2.64) | 0.52 | 0.64 (0.18–2.30) | 0.50 |
| Former vs. never | 0.71 (0.14–3.58) | 0.68 | 0.30 (0.05–1.86) | 0.19 |
| Tumor subsite | ||||
| Oropharynx (reference) | 1 | 1 | ||
| Hypopharynx | 0.06 (0.01–0.32) | <0.01 | 0.25 (0.05–1.35) | 0.11 |
| Larynx | 0.92 (0.14–6.13) | 0.93 | 0.30 (0.03–3.13) | 0.31 |
| Oral cavity | 0.44 (0.10–2.04) | 0.30 | 1.27 (0.30–5.45) | 0.75 |
| Nasopharynx | 0.28 (0.04–2.13) | 0.22 | 0.46 (0.08–2.70) | 0.39 |
| Multiple localizations | 0.32 (0.09–1.17) | 0.08 | 0.65 (0.18–2.40) | 0.52 |
| HPV | ||||
| Non‐driven vs. driven | 6.53 (1.12–38.15) | <0.05 | 2.85 (0.59–13.85) | 0.19 |
| SOX2 expression score b | ||||
| SOX2high vs. SOX2low | 0.13 (0.04–0.46) | <0.001 | 0.17 (0.06–0.54) | <0.001 |
HR, hazard ratio; CI, confidence intervals.
Statistically significant values are represented in bold.
Adjusted by age, clinical stage, gender, tobacco/alcohol consumption, tumor subsite and HPV.
Finally, we investigated the expression of vimentin in primary HNSCCs with either high or low SOX2 protein levels (Figure 7A–B; Supplementary Figure 6). In line with our in vitro data, vimentin‐positive tumor cells were not detected in SOX2high but were found in SOX2low HNSCC.
Figure 7.
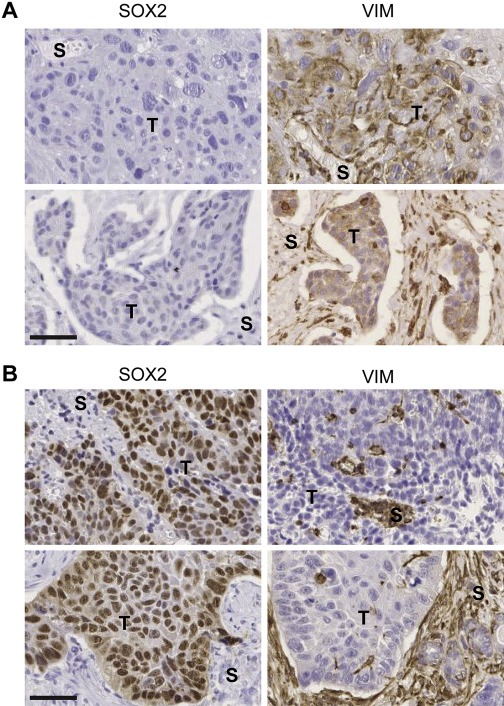
Inverse SOX2 and vimentin protein expression in primary tumors of HNSCC patients. (A) Representative pictures of no SOX2 but high VIM protein expression (brown signal) in two independent HNSCC tumors. (B) Representative pictures of high SOX2 (brown signal) but absent VIM protein expression in two independent HNSCC tumors. T, tumor; S, stroma. Bars: 50 μm.
In summary, multivariate analysis confirmed that low SOX2 expression serves as an independent prognostic biomarker to identify HNSCC patients at high risk for treatment failure, which is most likely due to an accelerated tumor cell motility and aggressive tumor growth.
4. Discussion
Amplification and recurrent copy number gain of SOX2 is a common event in several human SCCs of different organ sites, including HNSCC, suggesting that SOX2 represents a potent oncogenic transcription factor implicated in neoplastic transformation and malignant progression (Bass et al., 2009; Freier et al., 2010b; Maier et al., 2011). This assumption is further supported by experimental data demonstrating that SOX2 regulates tumor cell proliferation, survival and invasion, as well as the maintenance of pluripotency and self‐renewal in tumor initiating cells (Boumahdi et al., 2014; Bourguignon et al., 2012; Vanner et al., 2014; Xiang et al., 2011).
To gain insight into the oncogenic role of SOX2 and to unravel the underlying SOX2‐related genetic network in the context of HNSCCs, we silenced SOX2 expression in HNSCC cell lines with 3q26 gain and SOX2 overexpression and performed global gene expression profiling. Gene ontology enrichment analysis of differentially expressed genes revealed alterations in different biological functions related to cell movement and, interestingly, numerous well‐established markers of a mesenchymal phenotype, such as VIM, HMGA2, FN1 and CDH2 were identified within the top up‐regulated candidate genes, which was also validated in an independent cell line where SOX2 expression was conditionally silenced (HNO41‐shSOX2Tet).
Epithelial‐to‐mesenchymal transition (EMT) is a complex process where epithelial cells lose their epithelial features and acquire a mesenchymal‐like phenotype (Lamouille et al., 2014). Transition between epidermal and mesenchymal phenotypes play a critical role during embryogenesis and, in recent years, have been described as relevant processes in cancer, especially in tumor cell invasion and metastasis. The participation of SOX2 in the mesenchymal‐to‐epithelia transition (MET) has been previously reported in the context of reprogramming fibroblasts into induced pluripotent stem cells (iPSCs). Indeed, for the initiation of somatic reprogramming the repression of EMT is a critical event, where SOX2 in a complex with OCT4 is known to participate by suppressing the EMT marker SNAIL (Li et al., 2010; Samavarchi‐Tehrani et al., 2010). In the context of head and neck tumors the secreted protein connective tissue growth factor (CTGF) has been shown to promote MET in HNSCC cells by inducing c‐Jun, a component of the AP‐1 transcription factor, which activates the transcription of SOX2, NANOG and OCT4 (Chang et al., 2013). Noteworthy, silencing of SOX2 did not induce changes in transcriptional regulation of classical EMT markers such as CDH1, TWIST1, SNAI1, SNAI2, ZEB1 or ZEB2. Our data support the assumption that loss of SOX2 expression triggers a mesenchymal phenotype but not a classical epithelial‐to‐mesenchymal transition.
Interestingly, after SOX2 silencing, the most up‐regulated candidate gene encoded for vimentin, a well‐established marker for mesenchymal cells. Vimentin up‐regulation was confirmed both at a transcriptional and protein level in two independent cell lines. An inverse and mutually exclusive protein expression between SOX2 and vimentin was evident by co‐immunofluorescence staining in HNSCC cell lines growing under colony formation conditions. Strikingly, vimentin was preferably expressed at the border while prominent SOX2 was detectable at the center of colonies, suggesting a direct link of this inverse regulation with tumor cell motility. However, the role of SOX2 in tumor cells migration and invasion remains controversial and context dependent. Our data on the SOX2‐related genetic program highlighted cell motility as one of the most over‐represented biological functions induced by SOX2 silencing together with wound healing, a well‐known process where migration and invasion play a crucial role (Shaw and Martin, 2009). Moreover, in vitro assays confirmed a faster migration capacity in HNSCC cells after SOX2 silencing, and we could prove that up‐regulation of vimentin plays a causal role in augmented migration. Co‐immunofluorescence staining of migrating cells further demonstrated the presence of vimentin‐positive but SOX2‐negative tumor cells at the migratory front, the amount of which was strongly increased by conditional silencing of SOX2. In contrast to our findings, SOX2 was identified to promote migration of tumor cells, although mostly in cancers of non‐squamous cell origin (Ma et al., 2014; Wang et al., 2014). Regarding HNSCC, Yang and colleagues reported an association between SOX2 expression and enhanced migration and invasion capacities of the laryngeal squamous cell carcinoma cell line Hep‐2 (Yang et al., 2014, 2014). However, it is worth noting that in contrast to our cell lines, Hep‐2 lacks gain of 3q and is characterized by rather low basal SOX2 expression. In line with our findings, whole‐microRNAome and genome analysis of SOX2‐silenced human embryonal carcinoma cell (hECC) revealed a large miRNA network regulating the expression of crucial genes involved in EMT (Vencken et al., 2014). Hence, deregulation of genes involved in tumor cell motility can be at least in part due to SOX2‐related regulation of miRNAs. Based on our in vitro data, we postulated that the subgroup of HNSCC patients with low SOX2 expression should be at higher risk for treatment failure due to the more aggressive and invasive tumor growth. Indeed, detection of low SOX2 protein levels in primary HNSCC served as an independent prognostic marker for poor clinical outcome in two independent patient cohorts. Our data are in line with recent findings in lung, gastric and endometrial carcinomas (Wilbertz et al., 2011; Wong et al., 2010; Zhang et al., 2010). In these studies a low SOX2 protein level was identified as a reliable molecular biomarker to stratify a subgroup of patients at high risk for treatment failure. So far, a limited number of reports addressed the prognostic value of SOX2 protein expression in HNSCC resulting in conflicting data. A significant correlation between high SOX2 expression and decreased distant metastasis‐free survival was described for nasopharyngeal carcinoma (Wang et al., 2012), while poor disease‐free and overall survival was demonstrated for histologically lymph node‐negative SCCs of the tongue (Du et al., 2011). In contrast, other studies focusing on different HNSCC tumor localizations found no significant association between SOX2 expression and overall survival (Freier et al., 2010b; Ge et al., 2010; Schröck et al., 2014) or an improved prognosis in a subgroup analysis for patients with high OCT4 and SOX2 expression (Freier et al., 2010b; Ge et al., 2010). One possible explanation for these contradictory findings is the tremendous heterogeneity of HNSCC tumor types in terms of etiology, risk factors or therapy, which might determine whether SOX2 serves as a molecular marker for good or worse clinical outcome. Moreover, it is worth mentioning that the clinical impact of high SOX2 expression as a consequence of copy number gain could be influenced by deregulation of several other tumor‐relevant genes located on human chromosome 3q26‐29, such as PIK3CA, TP63, FXR1, SENP2, DCUN1D1, and DVL3 (Network, 2015; Qian et al., 2015; Wang et al., 2013). PIK3CA is of particular interest as activation of PI3K‐AKT signaling is one of the most common alterations in the pathogenesis of HNSCC (Horn et al., 2015; Iglesias‐Bartolome et al., 2013). To address the question whether the prognostic value of SOX2 protein levels is biased by co‐amplification of PIK3CA, we used the phosphorylation of AKT at threonine 308 and serine 473, which was available for numerous tumors from Cohort I (Freudlsperger et al., 2014), as a surrogate marker for PI3K‐AKT activity. We could not identify any significant difference between SOX2high and SOX2low subgroups (data not shown), questioning a major impact of PIK3CA co‐amplification.
Our data support a model in which high expression of SOX2 as a potent oncogene in HNSCC and other tumor entities promotes cell transformation and tumorigenesis. However, its presence in malignant carcinomas might be beneficial in terms of clinical outcome. This might be due to the fact that tumor cells with 3q gain and high SOX2 expression are more likely of an epithelial phenotype with stem cell characteristics, but lower tendency to be mobile or invasive. In contrast, tumor cells with low SOX2 expression more often develop a mesenchymal phenotype with higher migration and invasive capacity. Although HNSCC cells with low SOX2 expression might be more sensitive to systemic therapy by cytotoxic drugs, they more likely escape local treatment by surgical resection or radiotherapy, which is the predominant first‐line therapy for HNSCC patients.
5. Conclusions
We demonstrate that low SOX2 expression is an unfavorable risk factor for poor clinical outcome and serves as a prognosticator to identify HNSCC patients at high risk for treatment failure due to an invasive phenotype. This not only improves the knowledge on cellular and molecular principles of malignant progression but also could enable the stratification of HNSCC patients at high‐risk for poor therapy response.
Competing interests
The authors declare that there is no conflict of interest to disclose.
Supporting information
The following are the Supplementary data related to this article:
Supplementary data
Supplementary Figure 1 Co‐immunofluorescence staining of SOX2 and VIM protein expression of HNO223 and HNO41 cell lines. (A) Inverse SOX2 (red signal) and Vimentin (green signal) protein expression in HNO223‐shLuci and HNO223‐shSOX2#1 cells. (B) Inverse SOX2 (red signal) and Vimentin (green signal) protein expression in HNO41‐shSOX2#1Tet cells with (+) or without (−) Dox treatment (1 μg/mL) for 96 h. Cell nuclei were counterstained with Hoechst H33342. Scale bars = 200 μm.
Supplementary Figure 2 SOX2 and vimentin are inversely correlated in HNSCC tumor cells after ectopic SOX2 expression. Representative pictures of a co‐immunofluorescence staining for ectopic SOX2 expression (red signal) and endogenous vimentin protein levels (green signal) in transfected HNO147 (A) and HNO220 tumor cells (B). Nuclear staining with H33342 (blue signal).
Supplementary Figure 3 Accelerated migration of HNO223 cells with stable SOX2 silencing. Representative phase contrast pictures of HNO223‐shLuci, HNO223‐shSOX2#1 and HNO223‐shSOX#2 cell lines at the indicated time points after in vitro scratch wounding. Scale bars = 200 μm.
Supplementary Figure 4 Accelerated invasion of HNO41‐shSOX2Tet cells after conditional SOX2 silencing. Cell invasion was assessed for HNO41‐shNTTet, HNO41‐shSOX2#1Tet and HNO41‐shSOX2#2Tet cells with (+) or without (−) 1 μg/mL Dox pre‐treatment (96 h) by a Boyden chamber assay. Total amount of invading cells was quantified 24 h after seeding and is depicted as mean value + SEM of two independent experiments performed as triplicates. P ≤ 0.05 was considered as statistically significant difference.
Supplementary Figure 5 Correlation between SOX2 protein expression and survival of OPSCC and non‐OPSCC patients of Cohorts I and II. (A) Univariate Kaplan–Meier graph for SOX2low (blue line) and SOX2high (red line) protein levels and overall survival for OPSCC and non‐OPSCC patients in Cohort I. (B) Univariate Kaplan–Meier graph for SOX2low (blue line) and SOX2high (red line) protein levels and overall survival for OPSCC and non‐OPSCC patients in Cohort II.
Supplementary Figure 6 Inverse SOX2 and vimentin protein expression in primary tumors of HNSCC patients. (A–L) Representative pictures of no SOX2 (large picture) but high VIM protein expression (brown signal, insert) in a panel of independent HNSCC tumors. (M–X) Representative pictures of high SOX2 (brown signal, insert) but absent VIM (large picture) protein expression in a panel of independent HNSCC tumors. Scale Bars: 200 μm.
Acknowledgments
The authors gratefully acknowledge Nataly Henfling, Ines Kaden, Leoni Erdinger, Ingeborg Vogt, Antje Schuhmann and Martje Tönjes for excellent technical assistance. Liyan Peng and Sophie Mainitz for support in scoring. Dana Holzinger and Gordana Halec for kindly providing data on HPV status. We thank the tissue bank of the National Center for Tumor Disease (Institute of Pathology, University Hospital Heidelberg) for providing paraffin‐embedded tumor specimens. Armin Pscherer (BioRN, Heidelberg, Germany) for kindly providing the pSUPER‐dL_Zeo vector. Andrés Florez and Wei Wang for helping in the generation of the HNO41 SOX2 inducible system cell line. This work was supported by the Dietmar Hopp Stiftung (to J.H. and P.K.P.), the International Postdoc Fellowship program of the DKFZ (to P.B.), the Deutscher Akademischer Austauschdienst (DAAD) and Coordenação de Aperfeiçoamento de Pessoal de Nivel Superior (CAPES) (to A.J), the German Research Foundation (HE 5760/3‐1 to. J.H.).
Supplementary data 1.
1.1.
Supplementary data related to this article can be found online at http://dx.doi.org/10.1016/j.molonc.2015.05.006.
Bayo Pilar, Jou Adriana, Stenzinger Albrecht, Shao Chunxuan, Gross Madeleine, Jensen Alexandra, Grabe Niels, Mende Christel Herold, Rados Pantelis Varvaki, Debus Juergen, Weichert Wilko, Plinkert Peter K., Lichter Peter, Freier Kolja, Hess Jochen, (2015), Loss of SOX2 expression induces cell motility via vimentin up-regulation and is an unfavorable risk factor for survival of head and neck squamous cell carcinoma, Molecular Oncology, 9, doi: 10.1016/j.molonc.2015.05.006.
Contributor Information
Pilar Bayo, Email: pilarbz@gmail.com.
Adriana Jou, Email: a.jou@Dkfz-Heidelberg.de.
Albrecht Stenzinger, Email: albrecht.stenzinger@med.uni-heidelberg.de.
Chunxuan Shao, Email: c.shao@Dkfz-Heidelberg.de.
Madeleine Gross, Email: MadeleineGross@gmx.de.
Alexandra Jensen, Email: alexandra.jensen@med.uni-heidelberg.de.
Niels Grabe, Email: niels.grabe@bioquant.uni-heidelberg.de.
Christel Herold Mende, Email: h.mende@med.uni-heidelberg.de.
Pantelis Varvaki Rados, Email: pantelis@ufrgs.br.
Juergen Debus, Email: juergen.debus@med.uni-heidelberg.de.
Wilko Weichert, Email: wilko.weichert@med.uni-heidelberg.de.
Peter K. Plinkert, Email: peter_plinkert@med.uni-heidelberg.de
Peter Lichter, Email: Peter.Lichter@Dkfz-Heidelberg.de.
Kolja Freier, Email: kolja.freier@med.uni-heidelberg.de.
Jochen Hess, Email: j.hess@dkfz-heidelberg.de.
References
- Agrawal, N. , Frederick, M.J. , Pickering, C.R. , Bettegowda, C. , Chang, K. , Li, R.J. , Fakhry, C. , Xie, T.X. , Zhang, J. , Wang, J. , Zhang, N. , El-Naggar, A.K. , Jasser, S.A. , Weinstein, J.N. , Treviño, L. , Drummond, J.A. , Muzny, D.M. , Wu, Y. , Wood, L.D. , Hruban, R.H. , Westra, W.H. , Koch, W.M. , Califano, J.A. , Gibbs, R.A. , Sidransky, D. , Vogelstein, B. , Velculescu, V.E. , Papadopoulos, N. , Wheeler, D.A. , Kinzler, K.W. , Myers, J.N. , 2011. Exome sequencing of head and neck squamous cell carcinoma reveals inactivating mutations in NOTCH1. Science. 333, 1154–1157. [DOI] [PMC free article] [PubMed] [Google Scholar]
- Al-Shahrour, F. , Carbonell, J. , Minguez, P. , Goetz, S. , Conesa, A. , Tárraga, J. , Medina, I. , Alloza, E. , Montaner, D. , Dopazo, J. , 2008. Babelomics: advanced functional profiling of transcriptomics, proteomics and genomics experiments. Nucleic Acids Res. 36, W341–W346. [DOI] [PMC free article] [PubMed] [Google Scholar]
- Bass, A.J. , Watanabe, H. , Mermel, C.H. , Yu, S. , Perner, S. , Verhaak, R.G. , Kim, S.Y. , Wardwell, L. , Tamayo, P. , Gat-Viks, I. , Ramos, A.H. , Woo, M.S. , Weir, B.A. , Getz, G. , Beroukhim, R. , O'Kelly, M. , Dutt, A. , Rozenblatt-Rosen, O. , Dziunycz, P. , Komisarof, J. , Chirieac, L.R. , Lafargue, C.J. , Scheble, V. , Wilbertz, T. , Ma, C. , Rao, S. , Nakagawa, H. , Stairs, D.B. , Lin, L. , Giordano, T.J. , Wagner, P. , Minna, J.D. , Gazdar, A.F. , Zhu, C.Q. , Brose, M.S. , Cecconello, I. , Jr, U.R. , Marie, S.K. , Dahl, O. , Shivdasani, R.A. , Tsao, M.S. , Rubin, M.A. , Wong, K.K. , Regev, A. , Hahn, W.C. , Beer, D.G. , Rustgi, A.K. , Meyerson, M. , 2009. SOX2 is an amplified lineage-survival oncogene in lung and esophageal squamous cell carcinomas. Nat. Genet. 41, 1238–1242. [DOI] [PMC free article] [PubMed] [Google Scholar]
- Ben-Porath, I. , Thomson, M.W. , Carey, V.J. , Ge, R. , Bell, G.W. , Regev, A. , Weinberg, R.A. , 2008. An embryonic stem cell-like gene expression signature in poorly differentiated aggressive human tumors. Nat. Genet. 40, 499–507. [DOI] [PMC free article] [PubMed] [Google Scholar]
- Boumahdi, S. , Driessens, G. , Lapouge, G. , Rorive, S. , Nassar, D. , Le Mercier, M. , Delatte, B. , Caauwe, A. , Lenglez, S. , Nkusi, E. , Brohée, S. , Salmon, I. , Dubois, C. , del Marmol, V. , Fuks, F. , Beck, B. , Blanpain, C. , 2014. SOX2 controls tumour initiation and cancer stem-cell functions in squamous-cell carcinoma. Nature. 511, 246–250. [DOI] [PubMed] [Google Scholar]
- Bourguignon, L.Y. , Wong, G. , Earle, C. , Chen, L. , 2012. Hyaluronan-CD44v3 interaction with Oct4/Sox2/Nanog promotes miR-302 expression leading to self-renewal, clonal formation and cisplatin resistance in cancer stem cells from head and neck squamous cell carcinoma. J. Biol. Chem. 287, 32800–32824. [DOI] [PMC free article] [PubMed] [Google Scholar]
- Boyer, L.A. , Lee, T.I. , Cole, M.F. , Johnstone, S.E. , Levine, S.S. , Zucker, J.P. , Guenther, M.G. , Kumar, R.M. , Murray, H.L. , Jenner, R.G. , Gifford, D.K. , Melton, D.A. , Jaenisch, R. , Young, R.A. , 2005. Core transcriptional regulatory circuitry in human embryonic stem cells. Cell. 122, 947–956. [DOI] [PMC free article] [PubMed] [Google Scholar]
- Chang, C.C. , Hsu, W.H. , Wang, C.C. , Chou, C.H. , Kuo, M.Y. , Lin, B.R. , Chen, S.T. , Tai, S.K. , Kuo, M.L. , Yang, M.H. , 2013. Connective tissue growth factor activates pluripotency genes and mesenchymal-epithelial transition in head and neck cancer cells. Cancer Res. 73, 4147–4157. [DOI] [PubMed] [Google Scholar]
- Choi, S. , Myers, J.N. , 2008. Molecular pathogenesis of oral squamous cell carcinoma: implications for therapy. J. Dent. Res. 87, 14–32. [DOI] [PubMed] [Google Scholar]
- Du, L. , Yang, Y. , Xiao, X. , Wang, C. , Zhang, X. , Wang, L. , Li, W. , Zheng, G. , Wang, S. , Dong, Z. , 2011. Sox2 nuclear expression is closely associated with poor prognosis in patients with histologically node-negative oral tongue squamous cell carcinoma. Oral Oncol. 47, 709–713. [DOI] [PubMed] [Google Scholar]
- Fang, X. , Yoon, J.G. , Li, L. , Yu, W. , Shao, J. , Hua, D. , Zheng, S. , Hood, L. , Goodlett, D.R. , Foltz, G. , Lin, B. , 2011. The SOX2 response program in glioblastoma multiforme: an integrated ChIP-seq, expression microarray, and microRNA analysis. BMC Genomics. 12, 11 [DOI] [PMC free article] [PubMed] [Google Scholar]
- Freier, K. , Hofele, C. , Knoepfle, K. , Gross, M. , Devens, F. , Dyckhoff, G. , Plinkert, P. , Lichter, P. , Herold-Mende, C. , 2010. Cytogenetic characterization of head and neck squamous cell carcinoma cell lines as model systems for the functional analyses of tumor-associated genes. J. Oral Pathol. Med. 39, 382–389. [DOI] [PubMed] [Google Scholar]
- Freier, K. , Knoepfle, K. , Flechtenmacher, C. , Pungs, S. , Devens, F. , Toedt, G. , Hofele, C. , Joos, S. , Lichter, P. , Radlwimmer, B. , 2010. Recurrent copy number gain of transcription factor SOX2 and corresponding high protein expression in oral squamous cell carcinoma. Genes Chromosomes Cancer. 49, 9–16. [DOI] [PubMed] [Google Scholar]
- Freudlsperger, C. , Horn, D. , Weißfuß, S. , Weichert, W. , Weber, K.J. , Saure, D. , Sharma, S. , Dyckhoff, G. , Grabe, N. , Plinkert, P. , Hoffmann, J. , Freier, K. , Hess, J. , 2014. Phosphorylation of AKT(Ser473) serves as an independent prognostic marker for radiosensitivity in advanced head and neck squamous cell carcinoma. Int. J. Cancer. 136, 2775–2785. [DOI] [PubMed] [Google Scholar]
- Ge, N. , Lin, H.X. , Xiao, X.S. , Guo, L. , Xu, H.M. , Wang, X. , Jin, T. , Cai, X.Y. , Liang, Y. , Hu, W.H. , Kang, T. , 2010. Prognostic significance of Oct4 and Sox2 expression in hypopharyngeal squamous cell carcinoma. J. Transl. Med. 8, 94 [DOI] [PMC free article] [PubMed] [Google Scholar]
- Haddad, R.I. , Shin, D.M. , 2008. Recent advances in head and neck cancer. N. Engl. J. Med. 359, 1143–1154. [DOI] [PubMed] [Google Scholar]
- Halec, G. , Holzinger, D. , Schmitt, M. , Flechtenmacher, C. , Dyckhoff, G. , Lloveras, B. , Höfler, D. , Bosch, F.X. , Pawlita, M. , 2013. Biological evidence for a causal role of HPV16 in a small fraction of laryngeal squamous cell carcinoma. Br. J. Cancer. 109, 172–183. [DOI] [PMC free article] [PubMed] [Google Scholar]
- Holzinger, D. , Schmitt, M. , Dyckhoff, G. , Benner, A. , Pawlita, M. , Bosch, F.X. , 2012. Viral RNA patterns and high viral load reliably define oropharynx carcinomas with active HPV16 involvement. Cancer Res. 72, 4993–5003. [DOI] [PubMed] [Google Scholar]
- Horn, D. , Hess, J. , Freier, K. , Hoffmann, J. , Freudlsperger, C. , 2015. Targeting EGFR-PI3K-AKT-mTOR signaling enhances radiosensitivity in head and neck squamous cell carcinoma. Expert Opin. Ther. Targets. 1–11. [DOI] [PubMed] [Google Scholar]
- Iglesias-Bartolome, R. , Martin, D. , Gutkind, J.S. , 2013. Exploiting the head and neck cancer oncogenome: widespread PI3K-mTOR pathway alterations and novel molecular targets. Cancer Discov. 3, 722–725. [DOI] [PMC free article] [PubMed] [Google Scholar]
- Jensen, A.D. , Bergmann, Z.P. , Garcia-Huttenlocher, H. , Freier, K. , Debus, J. , Münter, M.W. , 2010. Cetuximab and radiation for primary and recurrent squamous cell carcinoma of the head and neck (SCCHN) in the elderly and multi-morbid patient: a single-centre experience. Head Neck Oncol. 2, 34 [DOI] [PMC free article] [PubMed] [Google Scholar]
- Jensen, A.D. , Krauss, J. , Weichert, W. , Bergmann, Z.P. , Freier, K. , Debus, J. , Münter, M.W. , 2011. Disease control and functional outcome in three modern combined organ preserving regimens for locally advanced squamous cell carcinoma of the head and neck (SCCHN). Radiat. Oncol. 6, 122 [DOI] [PMC free article] [PubMed] [Google Scholar]
- Lamouille, S. , Xu, J. , Derynck, R. , 2014. Molecular mechanisms of epithelial-mesenchymal transition. Nat. Rev. Mol. Cell Biol. 15, 178–196. [DOI] [PMC free article] [PubMed] [Google Scholar]
- Leemans, C.R. , Braakhuis, B.J. , Brakenhoff, R.H. , 2011. The molecular biology of head and neck cancer. Nat. Rev. Cancer. 11, 9–22. [DOI] [PubMed] [Google Scholar]
- Li, R. , Liang, J. , Ni, S. , Zhou, T. , Qing, X. , Li, H. , He, W. , Chen, J. , Li, F. , Zhuang, Q. , Qin, B. , Xu, J. , Li, W. , Yang, J. , Gan, Y. , Qin, D. , Feng, S. , Song, H. , Yang, D. , Zhang, B. , Zeng, L. , Lai, L. , Esteban, M.A. , Pei, D. , 2010. A mesenchymal-to-epithelial transition initiates and is required for the nuclear reprogramming of mouse fibroblasts. Cell Stem Cell. 7, 51–63. [DOI] [PubMed] [Google Scholar]
- Ma, K. , Pan, X. , Fan, P. , He, Y. , Gu, J. , Wang, W. , Zhang, T. , Li, Z. , Luo, X. , 2014. Loss of miR-638 in vitro promotes cell invasion and a mesenchymal-like transition by influencing SOX2 expression in colorectal carcinoma cells. Mol. Cancer. 13, 118 [DOI] [PMC free article] [PubMed] [Google Scholar]
- Maier, S. , Wilbertz, T. , Braun, M. , Scheble, V. , Reischl, M. , Mikut, R. , Menon, R. , Nikolov, P. , Petersen, K. , Beschorner, C. , Moch, H. , Kakies, C. , Protzel, C. , Bauer, J. , Soltermann, A. , Fend, F. , Staebler, A. , Lengerke, C. , Perner, S. , 2011. SOX2 amplification is a common event in squamous cell carcinomas of different organ sites. Hum. Pathol. 42, 1078–1088. [DOI] [PubMed] [Google Scholar]
- Network, C.G.A. , 2015. Comprehensive genomic characterization of head and neck squamous cell carcinomas. Nature. 517, 576–582. [DOI] [PMC free article] [PubMed] [Google Scholar]
- Ninck, S. , Reisser, C. , Dyckhoff, G. , Helmke, B. , Bauer, H. , Herold-Mende, C. , 2003. Expression profiles of angiogenic growth factors in squamous cell carcinomas of the head and neck. Int. J. Cancer. 106, 34–44. [DOI] [PubMed] [Google Scholar]
- Pai, S.I. , Westra, W.H. , 2009. Molecular pathology of head and neck cancer: implications for diagnosis, prognosis, and treatment. Annu. Rev. Pathol. 4, 49–70. [DOI] [PMC free article] [PubMed] [Google Scholar]
- Pickering, C.R. , Zhang, J. , Yoo, S.Y. , Bengtsson, L. , Moorthy, S. , Neskey, D.M. , Zhao, M. , Ortega Alves, M.V. , Chang, K. , Drummond, J. , Cortez, E. , Xie, T.X. , Zhang, D. , Chung, W. , Issa, J.P. , Zweidler-McKay, P.A. , Wu, X. , El-Naggar, A.K. , Weinstein, J.N. , Wang, J. , Muzny, D.M. , Gibbs, R.A. , Wheeler, D.A. , Myers, J.N. , Frederick, M.J. , 2013. Integrative genomic characterization of oral squamous cell carcinoma identifies frequent somatic drivers. Cancer Discov. 3, 770–781. [DOI] [PMC free article] [PubMed] [Google Scholar]
- Pscherer, A. , Schliwka, J. , Wildenberger, K. , Mincheva, A. , Schwaenen, C. , Döhner, H. , Stilgenbauer, S. , Lichter, P. , 2006. Antagonizing inactivated tumor suppressor genes and activated oncogenes by a versatile transgenesis system: application in mantle cell lymphoma. FASEB J. 20, 1188–1190. [DOI] [PubMed] [Google Scholar]
- Qian, J. , Hassanein, M. , Hoeksema, M.D. , Harris, B.K. , Zou, Y. , Chen, H. , Lu, P. , Eisenberg, R. , Wang, J. , Espinosa, A. , Ji, X. , Harris, F.T. , Rahman, S.M. , Massion, P.P. , 2015. The RNA binding protein FXR1 is a new driver in the 3q26-29 amplicon and predicts poor prognosis in human cancers. Proc. Natl. Acad. Sci. U. S. A. 112, 3469–3474. [DOI] [PMC free article] [PubMed] [Google Scholar]
- R Core Team, 2014. R: a Language and Environment for Statistical Computing R Foundation for Statistical Computing; Vienna, Austria: [Google Scholar]
- Rodriguez-Pinilla, S.M. , Sarrio, D. , Moreno-Bueno, G. , Rodriguez-Gil, Y. , Martinez, M.A. , Hernandez, L. , Hardisson, D. , Reis-Filho, J.S. , Palacios, J. , 2007. Sox2: a possible driver of the basal-like phenotype in sporadic breast cancer. Mod. Pathol. 20, 474–481. [DOI] [PubMed] [Google Scholar]
- Roesch Ely, M. , Nees, M. , Karsai, S. , Mägele, I. , Bogumil, R. , Vorderwülbecke, S. , Ruess, A. , Dietz, A. , Schnölzer, M. , Bosch, F.X. , 2005. Transcript and proteome analysis reveals reduced expression of calgranulins in head and neck squamous cell carcinoma. Eur. J. Cell Biol. 84, 431–444. [DOI] [PubMed] [Google Scholar]
- Samavarchi-Tehrani, P. , Golipour, A. , David, L. , Sung, H.K. , Beyer, T.A. , Datti, A. , Woltjen, K. , Nagy, A. , Wrana, J.L. , 2010. Functional genomics reveals a BMP-driven mesenchymal-to-epithelial transition in the initiation of somatic cell reprogramming. Cell Stem Cell. 7, 64–77. [DOI] [PubMed] [Google Scholar]
- Schmitt, M. , Bravo, I.G. , Snijders, P.J. , Gissmann, L. , Pawlita, M. , Waterboer, T. , 2006. Bead-based multiplex genotyping of human papillomaviruses. J. Clin. Microbiol. 44, 504–512. [DOI] [PMC free article] [PubMed] [Google Scholar]
- Schmitt, M. , Dalstein, V. , Waterboer, T. , Clavel, C. , Gissmann, L. , Pawlita, M. , 2010. Diagnosing cervical cancer and high-grade precursors by HPV16 transcription patterns. Cancer Res. 70, 249–256. [DOI] [PubMed] [Google Scholar]
- Schmitt, M. , Dondog, B. , Waterboer, T. , Pawlita, M. , 2008. Homogeneous amplification of genital human alpha papillomaviruses by PCR using novel broad-spectrum GP5+ and GP6+ primers. J. Clin. Microbiol. 46, 1050–1059. [DOI] [PMC free article] [PubMed] [Google Scholar]
- Schneider, C.A. , Rasband, W.S. , Eliceiri, K.W. , 2012. NIH Image to ImageJ: 25 years of image analysis. Nat. Methods. 9, 671–675. [DOI] [PMC free article] [PubMed] [Google Scholar]
- Schröck, A. , Bode, M. , Göke, F.J. , Bareiss, P.M. , Schairer, R. , Wang, H. , Weichert, W. , Franzen, A. , Kirsten, R. , van Bremen, T. , Queisser, A. , Kristiansen, G. , Heasley, L. , Bootz, F. , Lengerke, C. , Perner, S. , 2014. Expression and role of the embryonic protein SOX2 in head and neck squamous cell carcinoma. Carcinogenesis. 35, 1636–1642. [DOI] [PubMed] [Google Scholar]
- Schröck, A. , Göke, F. , Wagner, P. , Bode, M. , Franzen, A. , Braun, M. , Huss, S. , Agaimy, A. , Ihrler, S. , Menon, R. , Kirsten, R. , Kristiansen, G. , Bootz, F. , Lengerke, C. , Perner, S. , 2013. Sex determining region Y-box 2 (SOX2) amplification is an independent indicator of disease recurrence in sinonasal cancer. PLoS One. 8, e59201 [DOI] [PMC free article] [PubMed] [Google Scholar]
- Shaw, T.J. , Martin, P. , 2009. Wound repair at a glance. J. Cell Sci. 122, 3209–3213. [DOI] [PMC free article] [PubMed] [Google Scholar]
- Smyth, G.K. , 2005. limma: Linear models for microarray data. In Gentleman R., Carey V., Huber W., Irizarry R., Dudoit S.(Eds.), Bioinformatics and Computational Biology Solutions Using R and Bioconductor. Springer; New York: 397–420. [Google Scholar]
- Stransky, N. , Egloff, A.M. , Tward, A.D. , Kostic, A.D. , Cibulskis, K. , Sivachenko, A. , Kryukov, G.V. , Lawrence, M.S. , Sougnez, C. , McKenna, A. , Shefler, E. , Ramos, A.H. , Stojanov, P. , Carter, S.L. , Voet, D. , Cortés, M.L. , Auclair, D. , Berger, M.F. , Saksena, G. , Guiducci, C. , Onofrio, R.C. , Parkin, M. , Romkes, M. , Weissfeld, J.L. , Seethala, R.R. , Wang, L. , Rangel-Escareño, C. , Fernandez-Lopez, J.C. , Hidalgo-Miranda, A. , Melendez-Zajgla, J. , Winckler, W. , Ardlie, K. , Gabriel, S.B. , Meyerson, M. , Lander, E.S. , Getz, G. , Golub, T.R. , Garraway, L.A. , Grandis, J.R. , 2011. The mutational landscape of head and neck squamous cell carcinoma. Science. 333, 1157–1160. [DOI] [PMC free article] [PubMed] [Google Scholar]
- Takahashi, K. , Yamanaka, S. , 2006. Induction of pluripotent stem cells from mouse embryonic and adult fibroblast cultures by defined factors. Cell. 126, 663–676. [DOI] [PubMed] [Google Scholar]
- Tam, W.L. , Ng, H.H. , 2014. Sox2: masterminding the root of cancer. Cancer Cell. 26, 3–5. [DOI] [PubMed] [Google Scholar]
- Tinhofer, I. , Jöhrens, K. , Keilholz, U. , Kaufmann, A. , Lehmann, A. , Weichert, W. , Stenzinger, A. , Stromberger, C. , Klinghammer, K. , Becker, E.T. , Dommerich, S. , Stölzel, K. , Hofmann, V.M. , Hildebrandt, B. , Moser, L. , Ervens, J. , Böttcher, A. , Albers, A. , Stabenow, R. , Reinecke, A. , Budach, V. , Hoffmeister, B. , Raguse, J.D. , 2015. Contribution of human papilloma virus to the incidence of squamous cell carcinoma of the head and neck in a European population with high smoking prevalence. Eur. J. Cancer. 51, 514–521. [DOI] [PubMed] [Google Scholar]
- Vanner, R.J. , Remke, M. , Gallo, M. , Selvadurai, H.J. , Coutinho, F. , Lee, L. , Kushida, M. , Head, R. , Morrissy, S. , Zhu, X. , Aviv, T. , Voisin, V. , Clarke, I.D. , Li, Y. , Mungall, A.J. , Moore, R.A. , Ma, Y. , Jones, S.J. , Marra, M.A. , Malkin, D. , Northcott, P.A. , Kool, M. , Pfister, S.M. , Bader, G. , Hochedlinger, K. , Korshunov, A. , Taylor, M.D. , Dirks, P.B. , 2014. Quiescent sox2(+) cells drive hierarchical growth and relapse in sonic hedgehog subgroup medulloblastoma. Cancer Cell. 26, 33–47. [DOI] [PMC free article] [PubMed] [Google Scholar]
- Vencken, S.F. , Sethupathy, P. , Blackshields, G. , Spillane, C. , Elbaruni, S. , Sheils, O. , Gallagher, M.F. , O Leary, J.J. , 2014. An integrated analysis of the SOX2 microRNA response program in human pluripotent and nullipotent stem cell lines. BMC Genomics. 15, 711 [DOI] [PMC free article] [PubMed] [Google Scholar]
- Wang, J. , Qian, J. , Hoeksema, M.D. , Zou, Y. , Espinosa, A.V. , Rahman, S.M. , Zhang, B. , Massion, P.P. , 2013. Integrative genomics analysis identifies candidate drivers at 3q26-29 amplicon in squamous cell carcinoma of the lung. Clin. Cancer Res. – Off. J. Am. Assoc. Cancer Res. 19, 5580–5590. [DOI] [PMC free article] [PubMed] [Google Scholar]
- Wang, X. , Ji, X. , Chen, J. , Yan, D. , Zhang, Z. , Wang, Q. , Xi, X. , Feng, Y. , 2014. SOX2 enhances the migration and invasion of ovarian cancer cells via Src kinase. PLoS One. 9, e99594 [DOI] [PMC free article] [PubMed] [Google Scholar] [Retracted]
- Wang, X. , Liang, Y. , Chen, Q. , Xu, H.M. , Ge, N. , Luo, R.Z. , Shao, J.Y. , He, Z. , Zeng, Y.X. , Kang, T. , Yun, J.P. , Xie, F. , 2012. Prognostic significance of SOX2 expression in nasopharyngeal carcinoma. Cancer Invest. 30, 79–85. [DOI] [PubMed] [Google Scholar]
- Wiechert, L. , Németh, J. , Pusterla, T. , Bauer, C. , De Ponti, A. , Manthey, S. , Marhenke, S. , Vogel, A. , Klingmüller, U. , Hess, J. , Angel, P. , 2012. Hepatocyte-specific S100a8 and S100a9 transgene expression in mice causes Cxcl1 induction and systemic neutrophil enrichment. Cell Commun. Signal. 10, 40 [DOI] [PMC free article] [PubMed] [Google Scholar]
- Wiederschain, D. , Wee, S. , Chen, L. , Loo, A. , Yang, G. , Huang, A. , Chen, Y. , Caponigro, G. , Yao, Y.M. , Lengauer, C. , Sellers, W.R. , Benson, J.D. , 2009. Single-vector inducible lentiviral RNAi system for oncology target validation. Cell Cycle. 8, 498–504. [DOI] [PubMed] [Google Scholar]
- Wilbertz, T. , Wagner, P. , Petersen, K. , Stiedl, A.C. , Scheble, V.J. , Maier, S. , Reischl, M. , Mikut, R. , Altorki, N.K. , Moch, H. , Fend, F. , Staebler, A. , Bass, A.J. , Meyerson, M. , Rubin, M.A. , Soltermann, A. , Lengerke, C. , Perner, S. , 2011. SOX2 gene amplification and protein overexpression are associated with better outcome in squamous cell lung cancer. Mod. Pathol. 24, 944–953. [DOI] [PubMed] [Google Scholar]
- Wong, O.G. , Huo, Z. , Siu, M.K. , Zhang, H. , Jiang, L. , Wong, E.S. , Cheung, A.N. , 2010. Hypermethylation of SOX2 promoter in endometrial carcinogenesis. Obstet. Gynecol. Int. 2010, [DOI] [PMC free article] [PubMed] [Google Scholar]
- Xiang, R. , Liao, D. , Cheng, T. , Zhou, H. , Shi, Q. , Chuang, T.S. , Markowitz, D. , Reisfeld, R.A. , Luo, Y. , 2011. Downregulation of transcription factor SOX2 in cancer stem cells suppresses growth and metastasis of lung cancer. Br. J. Cancer. 104, 1410–1417. [DOI] [PMC free article] [PubMed] [Google Scholar]
- Yang, N. , Hui, L. , Wang, Y. , Yang, H. , Jiang, X. , 2014. Overexpression of SOX2 promotes migration, invasion, and epithelial-mesenchymal transition through the Wnt/β-catenin pathway in laryngeal cancer Hep-2 cells. Tumour Biol. 35, 7965–7973. [DOI] [PubMed] [Google Scholar]
- Yang, N. , Hui, L. , Wang, Y. , Yang, H. , Jiang, X. , 2014. SOX2 promotes the migration and invasion of laryngeal cancer cells by induction of MMP-2 via the PI3K/Akt/mTOR pathway. Oncol. Rep. 31, 2651–2659. [DOI] [PubMed] [Google Scholar]
- Yu, J. , Vodyanik, M.A. , Smuga-Otto, K. , Antosiewicz-Bourget, J. , Frane, J.L. , Tian, S. , Nie, J. , Jonsdottir, G.A. , Ruotti, V. , Stewart, R. , Slukvin, I.I. , Thomson, J.A. , 2007. Induced pluripotent stem cell lines derived from human somatic cells. Science. 318, 1917–1920. [DOI] [PubMed] [Google Scholar]
- Zhang, X. , Yu, H. , Yang, Y. , Zhu, R. , Bai, J. , Peng, Z. , He, Y. , Chen, L. , Chen, W. , Fang, D. , Bian, X. , Wang, R. , 2010. SOX2 in gastric carcinoma, but not Hath1, is related to patients' clinicopathological features and prognosis. J. Gastrointest. Surg. 14, 1220–1226. [DOI] [PubMed] [Google Scholar]
Associated Data
This section collects any data citations, data availability statements, or supplementary materials included in this article.
Supplementary Materials
The following are the Supplementary data related to this article:
Supplementary data
Supplementary Figure 1 Co‐immunofluorescence staining of SOX2 and VIM protein expression of HNO223 and HNO41 cell lines. (A) Inverse SOX2 (red signal) and Vimentin (green signal) protein expression in HNO223‐shLuci and HNO223‐shSOX2#1 cells. (B) Inverse SOX2 (red signal) and Vimentin (green signal) protein expression in HNO41‐shSOX2#1Tet cells with (+) or without (−) Dox treatment (1 μg/mL) for 96 h. Cell nuclei were counterstained with Hoechst H33342. Scale bars = 200 μm.
Supplementary Figure 2 SOX2 and vimentin are inversely correlated in HNSCC tumor cells after ectopic SOX2 expression. Representative pictures of a co‐immunofluorescence staining for ectopic SOX2 expression (red signal) and endogenous vimentin protein levels (green signal) in transfected HNO147 (A) and HNO220 tumor cells (B). Nuclear staining with H33342 (blue signal).
Supplementary Figure 3 Accelerated migration of HNO223 cells with stable SOX2 silencing. Representative phase contrast pictures of HNO223‐shLuci, HNO223‐shSOX2#1 and HNO223‐shSOX#2 cell lines at the indicated time points after in vitro scratch wounding. Scale bars = 200 μm.
Supplementary Figure 4 Accelerated invasion of HNO41‐shSOX2Tet cells after conditional SOX2 silencing. Cell invasion was assessed for HNO41‐shNTTet, HNO41‐shSOX2#1Tet and HNO41‐shSOX2#2Tet cells with (+) or without (−) 1 μg/mL Dox pre‐treatment (96 h) by a Boyden chamber assay. Total amount of invading cells was quantified 24 h after seeding and is depicted as mean value + SEM of two independent experiments performed as triplicates. P ≤ 0.05 was considered as statistically significant difference.
Supplementary Figure 5 Correlation between SOX2 protein expression and survival of OPSCC and non‐OPSCC patients of Cohorts I and II. (A) Univariate Kaplan–Meier graph for SOX2low (blue line) and SOX2high (red line) protein levels and overall survival for OPSCC and non‐OPSCC patients in Cohort I. (B) Univariate Kaplan–Meier graph for SOX2low (blue line) and SOX2high (red line) protein levels and overall survival for OPSCC and non‐OPSCC patients in Cohort II.
Supplementary Figure 6 Inverse SOX2 and vimentin protein expression in primary tumors of HNSCC patients. (A–L) Representative pictures of no SOX2 (large picture) but high VIM protein expression (brown signal, insert) in a panel of independent HNSCC tumors. (M–X) Representative pictures of high SOX2 (brown signal, insert) but absent VIM (large picture) protein expression in a panel of independent HNSCC tumors. Scale Bars: 200 μm.