

Abstract
Papillary renal cell carcinoma (pRCC) is the second most common RCC subtype and can be further classified as type 1 (pRCC1) or 2 (pRCC2). There is currently minimal understanding of pRCC1 pathogenesis, and treatment decisions are mostly empirical. The aim of this study was to identify biological pathways that are involved in pRCC1 pathogenesis using an integrated genomic approach. By microarray analysis, we identified a number of significantly dysregulated genes and microRNAs (miRNAs) that were unique to pRCC1. Integrated bioinformatics analyses showed enrichment of the focal adhesion and extracellular matrix (ECM) pathways. We experimentally validated that many members of these pathways are dysregulated in pRCC1. We identified and experimentally validated the downregulation of miR‐199a‐3p in pRCC1. Using cell line models, we showed that miR‐199a‐3p plays an important role in pRCC1 pathogenesis. Gain of function experiments showed that miR‐199a‐3p overexpression significantly decreased cell proliferation (p = 0.013). We also provide evidence that miR‐199a‐3p regulates the expression of genes linked to the focal adhesion and ECM pathways, such as caveolin 2 (CAV2), integrin beta 8 (ITGB8), MET proto‐oncogene and mammalian target of rapamycin (MTOR). Using a luciferase reporter assay, we further provide evidence that miR‐199a‐3p overexpression decreases the expression of MET and MTOR. Using an integrated gene/miRNA approach, we provide evidence linking miRNAs to the focal adhesion and ECM pathways in pRCC1 pathogenesis. This novel information can contribute to the development of effective targeted therapies for pRCC1, for which there is none currently available in the clinic.
Keywords: Papillary renal cell carcinoma, Genetics, Focal adhesion, Extracellular matrix, miR‐199a‐3p, MET
Highlights
Dysregulated genes and microRNAs in pRCC1 were identified by integrated analysis.
Members of the focal adhesion and ECM pathways are aberrantly expressed in pRCC1.
miR‐199a‐3p is downregulated in pRCC1 and regulates MET and MTOR.
Overexpression of miR‐199a‐3p led to decreased proliferation.
miR‐199a‐3p may be a tumor suppressor in pRCC1.
1. Introduction
Renal cell carcinoma (RCC) 2 constitutes the majority of renal neoplasms diagnosed in adults. This cancer is not a single disease, but instead encompasses a spectrum of subtypes (Delahunt et al., 2014; Ljungberg et al., 2010). Clear cell RCC (ccRCC) is the most common RCC subtype, whereas papillary RCC (pRCC) is second and can be further subdivided into type 1 (pRCC1) and 2 (pRCC2) (Delahunt et al., 2013; Delahunt and Eble, 1997; Ljungberg et al., 2010). pRCC1 is characterized by small cells with pale cytoplasm, whereas large cells and eosinophilic cytoplasm are hallmarks of type 2 (Delahunt and Eble, 1997). Only few molecular changes are reported for pRCC. Hereditary pRCC1 is associated with dysregulation in the MET proto‐oncogene. In sporadic pRCC1, this gene can be mutated and over‐expressed at the mRNA level (Lubensky et al., 1999; Sweeney et al., 2002). MET is an important transducer of downstream signaling pathways, including the focal adhesion and Akt signaling pathways (Chen and Chen, 2006; Xiao et al., 2001). In contrast, fumarate hydratase, a gene involved in the citric acid cycle, is commonly inactivated in hereditary pRCC2 (Toro et al., 2003). Gain of chromosome 17 is more frequently seen in type 1, and gain of 5q and loss of 1p and 3p are observed in type 2 (Klatte et al., 2009; Sanders et al., 2002). At the primary tumor level, pRCC2 has a worse prognosis than type 1 (Pignot et al., 2007). However, a study demonstrated that metastatic pRCC1 may be associated with a significantly worse survival outcome than metastatic pRCC2 (Klatte et al., 2009).
Due to the lack of understanding of the pathogenesis underlining pRCC, most patients are treated empirically using protocols designed for the clear cell subtype. There is currently no effective targeted therapy specific for patients with metastatic pRCC and no accurate prognostic models to predict its outcome. A thorough molecular understanding of the pathobiological mechanisms underpinning pRCC1 is a cornerstone towards that objective, which will lead into the new age of personalized medicine in kidney cancer (Pasic et al., 2013; White and Yousef, 2011).
A class of short, non‐coding RNA molecules, called microRNAs (miRNAs), were first discovered by Victor Ambros and colleagues in 1993 (Lee et al., 1993). After two decades since their discovery, significant advances have been made in understanding the role of these endogenously expressed molecules in health and disease. miRNAs are highly conserved and are predominantly known for their ability to regulate expression of their target genes by base‐pairing to the 3′ untranslated region (UTR) via the seed sequence. These regulatory molecules can downregulate mRNA expression by initiating mRNA decay or repress the initiation and post‐initiation steps of translation (Mathonnet et al., 2007; Nottrott et al., 2006). Each miRNA is predicted to target hundreds of potential mRNAs (Hendrickson et al., 2009). Dysregulation of miRNA expression can abrogate a biological pathway and contribute to disease, including cancer. Recent evidence suggested the involvement of miRNAs in the clear cell subtype of RCC (Khella et al., 2013; Lichner et al., 2014; White et al., 2011) but little is known about their role in pRCC.
The focal adhesion and extracellular matrix (ECM) pathways are integral in maintaining cellular physiology. These pathways constitute a number of components that can mediate cell signal transduction to regulate processes, such as cell survival, proliferation and migration (Gilmore and Romer, 1996; Meredith, Jr. et al., 1993). These pathways have been shown to be dysregulated in a variety of malignancies, including breast cancer (Beaty et al., 2014), hepatocellular carcinoma (Ryu et al., 2014) and prostate cancer (Hensley et al., 2014). Emerging evidence suggests an important role for the focal adhesion and ECM pathways in RCC pathogenesis. For instance, RCC metastasis is facilitated by integrin‐dependent adhesion to components of blood vessels via a chemokine receptor (Jones et al., 2007). Moreover, miRNAs have been reported to regulate the expression of members of the focal adhesion and ECM pathways (Sengupta et al., 2008). A recent report showed that miR‐218 down‐regulates the expression of caveolin 2 (CAV2), and transfection of this miRNA in A498 and 786‐O cells led to significantly decreased cell proliferation, wound healing and cell invasion (Yamasaki et al., 2013).
The introduction of the concept of “integrated analysis” that combines multiple levels of molecular changes has revolutionized our understanding of RCC pathogenesis (Cancer Genome Atlas Research Network, 2013; Girgis et al., 2012). In the present study, using an integrated gene/miRNA approach, we provide evidence that links miRNAs to the focal adhesion and ECM pathways in pRCC1. We identified a number of uniquely dysregulated genes and miRNAs that are enriched in these biological pathways. We validated the differential regulation of members of these pathways on pRCC1 tissues. We also show that miR‐199a‐3p, which has decreased expression in pRCC1, targets members of the focal adhesion and ECM pathways, including MET. Finally, we provided evidence that miR‐199a‐3p may be an important tumor suppressor in pRCC1.
2. Material and methods
2.1. Patient sample collection
A total of 52 pRCC1 cases with 51 normal kidney tissues were obtained for this study with research ethics board approval. Patients provided informed consent for the collection of tissue for experimentation. A pathologist confirmed the pRCC1 diagnosis.
2.2. Cell culture and transfection
The 786‐O, ACHN and CAKI‐1 cell lines, derived from ccRCC, were obtained from the American Type Culture Collection (ATCC, Manassas, VA, USA), and grown in cell media containing RPMI and 10% fetal bovine serum. Cells were seeded in a cell culture plate one day before transfection. Cells reached ∼60–70% confluency when transfection was carried out using siPORT™ NeoFX™ Transfection Agent (Invitrogen, Carlsbad, CA, USA) in accordance with the manufacturer's protocol. Cells were transfected with the mirVana™ miR‐199a‐3p mimic, which is a chemically modified and stable miRNA, and or mirVana™ miRNA negative control #1 (Applied Biosystems, Foster City, CA, USA). The transfection reagent and mimics were both diluted with Opti‐MEM® Reduced Serum Media (Invitrogen). Each transfection experiment was performed in three biological and technical replicates. A negative control was included for each experiment.
2.3. RNA extraction and quantitative reverse transcription PCR
After 24 h of transfection with the miRNA mimics at 37 °C in 10% CO2, 786‐O, CAKI‐1, and ACHN cells were lysed with QIAzol Lysis Reagent (Qiagen, Mississauga, ON, Canada). Total RNA, including miRNAs, was extracted from fresh frozen tissue samples and cultured cells using the miRNeasy Mini Kit (Qiagen) in accordance to the manufacturer's protocol. The quality of RNA was determined by measuring the A260/280 and A260/230 ratios with the NanoDrop 2000c spectrophotometer (Nanodrop Technologies Inc., Wilmington, DE, USA). RNA extracts were stored at −80 °C until use.
The expression level of miR‐199a‐3p was measured by quantitative reverse transcription polymerase chain reaction (qRT‐PCR) using TaqMan® miRNA assays (Applied Biosystems) (Chen et al., 2005). A total of 5 ng of extracted RNA was used for reverse transcription, and the cycling conditions for amplification were as follows: 16 °C for 30 min, 42 °C for 30 min and 85 °C for 5 min. RNU44 was used as the endogenous control for relative quantification of miR‐199a‐3p. For gene quantification, 500 ng of RNA was reverse transcribed using High Capacity cDNA Reverse Transcription Kit (Applied Biosystems). The expression level of target genes CAV2, integrin beta 8 (ITGB8), MET and mammalian target of rapamycin (MTOR) was measured using Fast SYBR Green Master Mix (Applied Biosystems). Primers for these genes were designed with software Primer3 (v. 0.4.0) (http://gmdd.shgmo.org/primer3/?seqid=47, accessed March 3, 2014). The primer sequences are included in Supplementary Table S1. Reference genes included the TATA box binding protein gene for pRCC type 1 and normal kidney tissues, and the hypoxanthine phosphoribosyltransferase 1 gene for 786‐O, CAKI‐1 and ACHN cell lines. Real‐time PCR amplification for both miRNA and gene was conducted on the Viia™ 7 Real‐Time PCR System (Applied Biosystems). Real‐time PCR was performed as technical triplicates for each sample and control.
2.4. Pathway validation
RNA isolated from fresh frozen samples of pRCC1 and normal kidney tissues were pooled separately and reverse transcribed using the High Capacity cDNA Reverse Transcription Kit (Applied Biosystems). 50 ng of cDNA from the pooled pRCC1 and 50 ng of cDNA from the pooled normal kidney were used for each reaction in the TaqMan® Array Human Extracellular Matrix & Adhesion Molecules 96‐well plate, Fast (Applied Biosystems). Real‐time PCR was performed on the StepOnePlus™ System (Applied Biosystems) as per the manufacturer's protocol. Data was analyzed using the DataAssist™ Software (Applied Biosystems).
2.5. Protein extraction and western blot analysis
786‐O and CAKI‐1 cells were transfected for 72 h with either the mirVana™ miR‐199a‐3p mimic or mirVana™ miRNA negative control #1 (Applied Biosystems) at 37 °C in 10% CO2. Protein was extracted using Lysis Buffer 11 (R&D Systems, Minneapolis, MN, USA) spiked with protease inhibitor mixture (Roche, Laval, QC, Canada) and Phosphatase Inhibitor Cocktail 3 (Sigma–Aldrich, Oakville, ON, Canada). Protein extracts were centrifuged at 12,000 × g for 10 min at 4 °C and the supernatant was collected. Protein concentration was measured using the Micro BCA™ Protein Assay Kit (Thermo Scientific, Rockford, IL, USA) as indicated by the manufacturer's protocol. Bovine serum albumin was used as the standard for protein quantification.
A total of 25 μg of extracted protein was separated on a 10% polyacrylamide gel and transferred onto a nitrocellulose membrane. Blocking was performed with 5% skim milk diluted in 1× phosphate buffered saline with Tween® 20 (Sigma Aldrich, St. Louis, MO, USA). Blots were stained with mTOR (7C10) Rabbit mAb (Cell Signaling Technology, Danvers, MA, USA) or Met Rabbit Ab (Cell Signaling Technology), and incubated with diluted antibody overnight at 4 °C with shaking. After washing with 1× phosphate buffered saline and 1× phosphate buffered saline with Tween® 20 (Sigma Aldrich), secondary staining was carried out using anti‐Rabbit IgG horseradish peroxidase conjugate (Promega, Madison, WI, USA). Chemiluminescence signal was detected using the Pierce™ ECL Western Blotting Substrate (Thermo Scientific) and Amersham Hyperfilm™ ECL (GE Healthcare, Buckinghamshire, UK). Membranes were stripped of protein with Antibody Stripping Buffer (Gene Bio‐Application L.T.D, Israel). As a loading control, anti‐β actin antibody (Cell Signaling Technology) was used and secondary staining was performed with anti‐Mouse IgG horseradish peroxidase conjugate (Promega). Western blot experiments were performed in biological triplicate.
2.6. Luciferase assay
786‐O cells were seeded on a 96‐well plate with a white, opaque bottom overnight at 37 °C and in 5% CO2. On the following day, using 0.10 μl per well of DharmaFECT Duo Transfection Reagent (Thermo Scientific) cells were co‐transfected with the pMirTarget vector encoding for either the 3′ UTR of MET or MTOR (Origene, Rockville, MD, USA) and 50 nM of mirVana™ miR‐199a‐3p mimic or mirVana™ miRNA negative control #1 (Applied Biosystems) as per the manufacturer's protocol. Luminescence signal was detected using britelite™ plus (PerkinElmer, Netherlands) according to the manufacturer's protocol and SpectraMax® M5e Multi‐Mode Microplate Reader (VWR, Radnor, PA, USA). Experiments were performed in biological triplicate.
2.7. Proliferation assay
786‐O cells were seeded in a 96‐well plate and grown to confluency before transfection with the siPORT™ NeoFX™ Transfection Agent and 30 nM of mirVana™ miR‐199a‐3p mimic or mirVana™ miRNA negative control #1 (Applied Biosystems). After 24 h of transfection, cells were incubated with the Cell Proliferation Reagent WST‐1 (Roche, Germany) as per manufacturer's protocol. Absorbance from the cell suspensions was detected at 440 nm using the SpectraMax® M5e Multi‐Mode Microplate Reader (VWR). A background control was included in measuring absorbance. Three biological replicates were performed for the proliferation assay.
2.8. Statistical analysis
Statistical analysis was performed with GraphPad Prism 6 Software (GraphPad, La Jolla, CA, USA). Unpaired t‐test with Welch's correction and Mann–Whitney test were used to measure statistical significance. A p‐value < 0.05 was considered statistically significant.
2.9. Bioinformatic analysis
Hierarchical clustering was performed with Sparse Hierarchical Clustering from the GenePattern software using the 5000 genes with the most variance (http://www.broadinstitute.org/cancer/software/genepattern/, accessed August 1, 2014) (Reich et al., 2004). Supervised clustering was carried out with the ClassNeighbors algorithm (Golub et al., 1999). Differential gene analysis was performed using GeneSpring version 12.5 software. The fold‐change cut‐off was 2.0 and the unpaired t‐test was used to measure statistical significance.
Multiple softwares were used to perform targeted prediction analysis for miR‐199a‐3p, including PicTar (http://pictar.mdc‐berlin.de/, accessed April 10, 2014) and TargetScan version 5.2 (http://www.targetscan.org/vert_50/, accessed April 10, 2014). Pathway analysis was conducted using DIANA – mirPath software (http://diana.cslab.ece.ntua.gr/pathways/, accessed August 1, 2014) and DAVID Functional Annotation Bioinformatics Microarray Analysis (http://david.abcc.ncifcrf.gov/, accessed March 3, 2014). In addition, PANTHER Classification System was used to perform Gene Ontology on significantly dysregulated genes in pRCC1 (http://www.pantherdb.org/, accessed July 4, 2014) (Mi et al., 2013).
3. Results
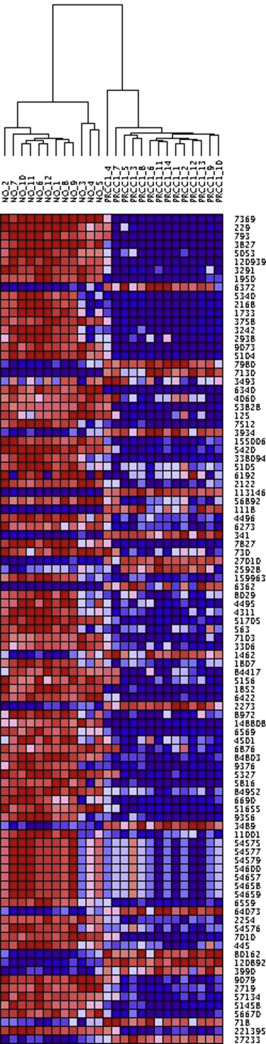
3.1. Differential gene and miRNA expression in pRCC1 compared to normal kidney
Hierarchical clustering of microarray data obtained from two independent publically available datasets from the National Centre for Biotechnology Information Gene Expression Omnibus (GSE7023 and GSE26574) (Barrett et al., 2013; Edgar et al., 2002) showed that pRCC1 cases clustered together away from normal kidney samples from both sets of data at the mRNA level (Supplementary Figure 1A and 1B). Interestingly, pRCC1 also clustered in a separate arm from ccRCC (Supplementary Figure 1C), indicating a unique pathogenesis pathway for this subtype. We identified 1590 genes, that are significantly (p < 0.05) dysregulated in pRCC1 compared to normal kidney with a fold‐change greater than 2. This included MET proto‐oncogene, MDM2 proto‐oncogene, E3 ubiquitin protein ligase and vascular endothelial growth factor A (Data not shown).
We next mapped the chromosomal locations of these genes. Our results showed that chromosomal localization of these genes is significantly enriched for chromosome 17. Multiple genes on chromosome 17, such as integrin alpha 3, chemokine ligand 18 and CD68, were found to be overexpressed in pRCC1 compared to normal kidney tissue. This is in keeping with previous reporting that trisomy of chromosome 17 is a characteristic feature of pRCC1 (Klatte et al., 2009).
Hierarchical clustering of miRNA expression also showed that pRCC1 cases clustered together in a separate arm that is distinct from normal kidney (Data not shown). We analyzed differential miRNA expression between pRCC1 and normal kidney tissues using our recently published microarray data (Youssef et al., 2011). Using 5 pRCC1 cases and 20 normal kidney tissues, we identified a number of miRNAs that are significantly dysregulated in pRCC1. The top up‐ and down‐regulated miRNAs are shown in Table 1. Additionally, we validated our finding on an independent data set (GSE41282) (Barrett et al., 2013; Edgar et al., 2002). We observed a significant number of common dysregulated miRNAs, including down‐regulation of miR‐126, ‐199a‐3p and −200c. Differences between the two studies can be attributed to the use of different technical platforms and statistical methods of analysis. Interestingly, our significantly dysregulated miRNAs in pRCC1 were also distinct from those previously reported for ccRCC, with the exception of miR‐200c underexpression (Jung et al., 2009). This supports the hypothesis that pRCC1 is a distinct molecular entity.
Table 1.
Top significantly up‐ and downregulated microRNAs (miRNAs) in papillary renal cell carcinoma type 1 (pRCC1) compared to normal kidney.
| Up‐regulated | Score | Down‐regulated | Score |
|---|---|---|---|
| hsa‐miR‐197 | 5.993 | hsa‐miR‐200c | 12.129 |
| hsa‐miR‐23b* | 5.368 | hsa‐miR‐199a‐5p | 9.233 |
| hsa‐miR‐380 | 4.576 | hsa‐miR‐199a‐3p | 9.147 |
| hsa‐miR‐1229 | 4.477 | hsa‐miR‐139‐5p | 8.521 |
| hsa‐miR‐548l | 4.231 | hsa‐miR‐100 | 8.312 |
| hsa‐miR‐92b | 4.003 | hsa‐miR‐652 | 7.748 |
| hsa‐miR‐367* | 3.974 | hsa‐miR‐660 | 7.473 |
| hsa‐miR‐346 | 3.941 | hsa‐miR‐502‐3p | 7.349 |
| hsa‐miR‐411* | 3.726 | hsa‐miR‐532‐5p | 7.252 |
| hsa‐miR‐519b‐3p | 3.683 | hsa‐miR‐145 | 7.170 |
| hsa‐miR‐92a | 3.670 | hsa‐miR‐126 | 6.580 |
| hsa‐miR‐1197 | 3.655 | hsa‐miR‐532‐3p | 6.366 |
| hsa‐miR‐1260 | 3.507 | hsa‐miR‐500* | 6.337 |
| hsa‐miR‐299‐5p | 3.466 | hsa‐miR‐214 | 6.070 |
| hsa‐miR‐101* | 3.401 | hsa‐miR‐215 | 6.020 |
| hsa‐miR‐25 | 3.391 | hsa‐miR‐363 | 6.003 |
| hsa‐miR‐520d‐5p | 3.336 | hsa‐miR‐378 | 5.993 |
| hsa‐miR‐28‐3p | 3.321 | hsa‐miR‐187 | 5.686 |
| hsa‐miR‐520f | 3.320 | hsa‐miR‐127‐3p | 5.684 |
| hsa‐miR‐24‐2* | 3.316 | hsa‐miR‐501‐5p | 5.629 |
3.2. Focal adhesion and ECM pathways are dysregulated in pRCC1
In order to identify pathways that are involved in pRCC1 pathogenesis, we performed Gene Ontology and pathway analyses comparing significantly up‐ or down‐regulated genes in pRCC1 to normal kidney. We identified a number of significantly altered biological processes in pRCC1 (Supplementary Figure 2A and 2B). These included biological adhesion, immune system, metabolic and apoptotic processes.
We also conducted pathway analysis using the predicted gene targets of the top significantly up‐ and down‐regulated miRNAs in pRCC1 compared to normal kidney tissue listed in Table 1. We found several interesting pathways, including adherens junction, focal adhesion, TGF‐beta signaling, Wnt signaling and MAP kinase signaling pathway (Supplementary Table S2). Of interest, the predicted gene targets of the top dysregulated miRNAs were significantly (p < 0.05) enriched in the focal adhesion pathway (Figure 1). Moreover, the predicted targets of previously identified miRNAs that are aberrantly expressed in ccRCC indicated enrichment for different biological pathways (White et al., 2011). This suggests that there may be different mechanisms driving pathogenesis of pRCC1 and ccRCC.
Figure 1.
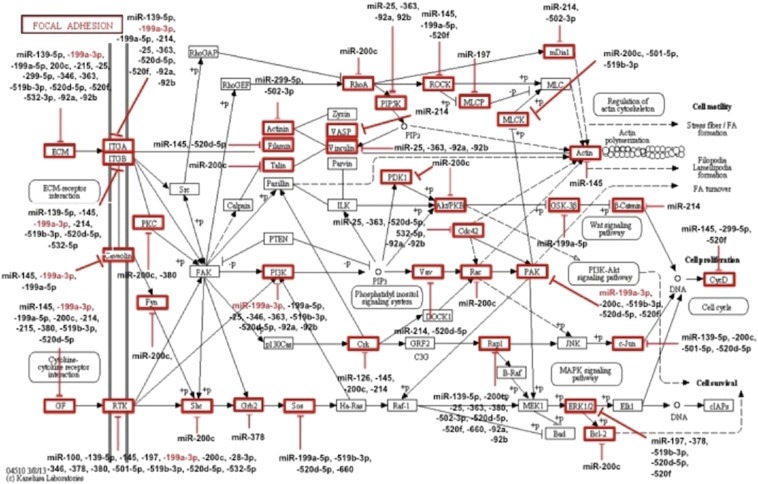
Predicted interactions between dysregulated miRNAs in papillary renal cell carcinoma type 1 (pRCC1) and their target genes in the focal adhesion pathway. Pathway analysis was performed using 20 significantly (p < 0.05) up‐ or down‐regulated miRNAs in pRCC1. Predicted target genes for each miRNA are enclosed in a red box. miR‐199a‐3p is highlighted in red.
3.3. Experimental validation of pathway analysis
The focal adhesion pathway was one of the biological pathways to have significant enrichment for the predicted gene targets of these dysregulated miRNAs in pRCC1 (Figure 1). Using a PCR array, we compared the expression of members of the focal adhesion and ECM pathways between normal kidney and pRCC1. Our results show that a significant number of genes involved in these pathways are differentially expressed at the mRNA level in pRCC1 compared to normal kidney tissue, including secreted phosphoprotein 1, vascular cell adhesion molecule and several matrix metalloproteinases (Table 2).
Table 2.
Partial list of differentially expressed members of the focal adhesion and extracellular matrix (ECM) pathways in papillary renal cell carcinoma type 1 (pRCC1) compared to normal kidney tissue.
| Gene symbol | Unigene | Gene name | Fold change relative to normal kidney |
|---|---|---|---|
| CD44 | Hs.153304 | CD44 molecule | 9.5029 |
| CLEC3B | Hs.162844 | C‐type lectin domain family 3, member B | −13.4228 |
| CNTN1 | Hs.355024 | Contactin 1 | −13.2626 |
| COL11A1 | Hs.266273 | Collagen, type XI, alpha 1 | 38.0566 |
| COL1A1 | Hs.164004 | Collagen, type 1, alpha 1 | 19.1859 |
| FN1 | Hs.1549976 | Fibronectin 1 | 9.5115 |
| ITGA8 | Hs.233321 | Integrin alpha 8 | −13.5501 |
| ITGAM | Hs.355885 | Integrin alpha M | 9.4734 |
| ITGB2 | Hs.164957 | Integrin beta 2 | 9.3786 |
| KAL1 | Hs.608006 | Kallmann syndrome 1 sequence | 9.4786 |
| LAMA3 | Hs.165042 | Laminin, alpha 3 | 9.3994 |
| MMP10 | Hs.233987 | Matrix metalloproteinase 10 | 364583745.2 |
| MMP12 | Hs.899662 | Matrix metalloproteinase 12 | 19.1859 |
| MMP2 | Hs.1548727 | Matrix metalloproteinase 2 | 9.5293 |
| MMP3 | Hs.968305 | Matrix metalloproteinase 3 | 174.9229 |
| MMP8 | Hs.1029057 | Matrix metalloproteinase 8 | 37.5978 |
| MMP9 | Hs.957555 | Matrix metalloproteinase 9 | 76.8927 |
| SPP1 | Hs.959010 | Secreted phosphoprotein 1 | 9.5056 |
| THBS2 | Hs.1568063 | Thrombospondin 2 | 9.3423 |
| TIMP1 | Hs.99999139 | TIMP metalloproteinase inhibitor | 9.436 |
| VCAM1 | Hs.103372 | Vascular cell adhesion molecule 1 | 9.0579 |
| VCAN | Hs.171642 | Versican | 37.6786 |
3.4. miR‐199a‐3p is significantly down‐regulated in pRCC1 and targets members of the focal adhesion and ECM pathways
miR‐199a‐3p was one of the most significantly (p < 0.05) downregulated miRNAs in pRCC1. We first validated the downregulation of miR‐199a‐3p in an independent set of pRCC1 and their normal counterparts from the same patient by qRT‐PCR. Our results show downregulation of this miRNA in all samples examined (Figure 2A). The miR‐199a‐1 stem loop is encoded on chromosome 19 and miR‐199a‐2 is found on chromosome 1. Previous reports have indicated that segments of chromosome 1 are deleted in pRCC (Jiang et al., 1998). Therefore, deletion of the locus encoding miR‐199a‐2 in pRCC1 may contribute to its downregulation. In order to investigate the potential involvement of miR‐199a‐3p in pRCC1 pathogenesis, we performed target prediction analysis. We identified a number of genes including CAV2, ITGB8, MET and MTOR as potential targets of this miRNA. MET has been previously reported to be overexpressed in pRCC1 (Yang et al., 2005). It should be noted, however, that there are a number of other miRNAs that are dysregulated in pRCC1 and these miRNAs should be further investigated in future studies.
Figure 2.
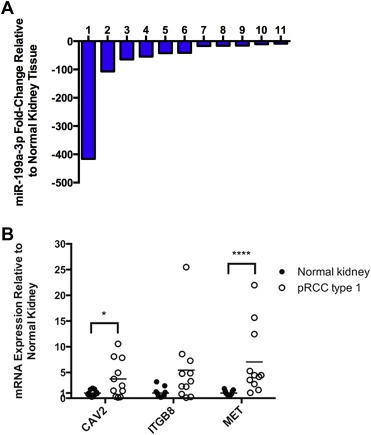
Quantitative reverse transcription‐PCR (qRT‐PCR) validation of microRNA (miRNA) and mRNA differential expression in papillary renal cell carcinoma type 1 (pRCC1). A) miR‐199a‐3p is downregulated in pRCC1. Representative bar graph showing relative miR‐199a‐3p expression in pRCC1 compared to normal kidney for each patient. RNU44 was used as the endogenous control. B) miR‐199a‐3p targets are upregulated in pRCC1 compared to normal kidney. Individual dots show relative caveolin 2 (CAV2), integrin beta 8 (ITGB8) and MET mRNA expression levels in pRCC1 and normal kidney samples. TATA box binding protein was used as the reference gene. Statistical significance was calculated using the t‐test with Welch's correction for CAV2 and ITGB8, and Mann–Whitney test for MET. *p < 0.05, ****p < 0.0001.
3.5. Experimental target validation
In order to experimentally validate the potential regulation of these genes by miR‐199a‐3p, we first investigated the presence of an inverse correlation of the expression of miR‐199a‐3p and its predicted targets in pRCC1 relative to normal kidney tissue. As shown in Figure 2B, CAV2, ITGB8 and MET showed upregulation in pRCC1 compared to normal kidney. This provides support to the hypothesis that these molecules are controlled by miR‐199a‐3p in pRCC1. At the mRNA level, only MTOR expression was not found to be upregulated in pRCC1 (Data not shown).
We then tested the ability of miR‐199a‐3p to regulate the expression level of these genes using cell line models. The 786‐O, CAKI‐1 and ACHN kidney cancer cell lines were found to have significantly low endogenous expression of miR‐199a‐3p. Transfection of 786‐O and CAKI‐1 cells with a miR‐199a‐3p mimic resulted in a decrease in CAV2, ITGB8, MET and MTOR expression compared to cells transfected with the non‐targeting miRNA mimic, which served as the negative experimental control (Figure 3A–B). We also examined the effect of miR‐199a‐3p on the same targets in the ACHN RCC cell line. Our results show that miR‐199a‐3p transfection led to decrease of expression of ITGB8 and MET to a variable degree (Supplementary Figure 3A).
Figure 3.
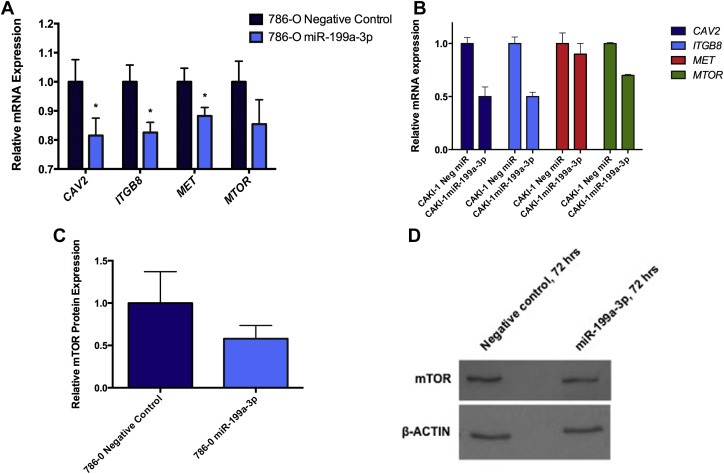
miR‐199a‐3p downregulates the expression of its target genes. A) miR‐199a‐3p was transfected into 786‐O cells for 24 h, and mRNA expression levels of caveolin 2 (CAV2), integrin beta 8 (ITGB8), MET and mammalian target of rapamycin (MTOR) were measured by quantitative reverse transcription PCR (qRT‐PCR). All genes showed lower mRNA expression in miR‐199a‐3p transfected cells relative to the negative control group. Hypoxanthine phosphoribosyltransferase 1 was used as the reference gene. Each experiment represents a summary three biological and technical replicates. Statistical analysis was performed using the unpaired t‐test with Welch's correction. *p < 0.05. B) miR‐199a‐3p was transfected into CAKI‐1 cells for 24 h, and CAV2, MET, ITGB8 and MTOR had decreased expression levels at the mRNA compared to the negative control measured by qRT‐PCR. The reference control was the hypoxanthine phosphoribosyl transferase 1 gene. C) 786‐O cells were transfected with miR‐199a‐3p. Total protein was extracted after 72 h and western blot analysis was performed for mTOR. Cells transfected with the miR‐199a‐3p mimic showed lower mTOR protein concentration compared to the negative control. β‐actin was used as a loading control. Experiments were performed in three biological replicates. D) Representative western blot image of mTOR and β‐actin expression levels in 786‐O cell line.
We also examined the effect of miR‐199a‐3p on Met and mTOR expression at the protein level. Using Western blot analysis, we found a decrease in the protein expression of mTOR in miR‐199a‐3p transfected 786‐O cells compared to the negative control (Figure 3C–D). There was also reduction in Met and mTOR expression after CAKI‐1 cells were transfected with miR‐199a‐3p (Supplementary Figure 3B). Recent reports have shown that miRNA can affect their targets at the mRNA, protein levels or both (Hendrickson et al., 2009).
To provide additional evidence supporting the interaction of miR‐199a‐3p with MET and MTOR, we conducted a 3′ UTR luciferase reporter assay. We measured a significantly lower luminescence signal from 786‐O cells co‐transfected with the plasmid encoding for the 3′ UTR of MTOR downstream of the luciferase enzyme and miR‐199a‐3p mimic compared to cells co‐transfected with the same plasmid and miRNA negative control (p = 0.0038) (Figure 4). Similar results were observed for 786‐O cells co‐transfected with the plasmid encoding for the 3′ UTR of MET and miR‐199a‐3p mimic (p = 0.0071) (Figure 4).
Figure 4.
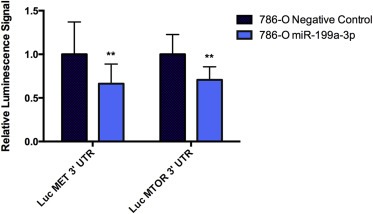
miR‐199a‐3p targets the 3′ untranslated region (UTR) of MET and mammalian target of rapamycin (MTOR). 786‐O cells were co‐transfected for 24 h with a miR‐199a‐3p or non‐targeting microRNA (miRNA) mimic and a plasmid encoding the 3′ UTR of MET or MTOR downstream of luciferase. Cells were lysed and luminescence was measured after adding luciferase substrate. Cells transfected with the miR‐199a‐3p mimic has a lower signal compared to the negative control. Experiments were performed in three biological replicates. Statistical significance was measured using the Mann–Whitney test. **p < 0.01.
3.6. Overexpression of miR‐199a‐3p reduces kidney cancer cell proliferation
In order to explore the functional impact of miR‐199a‐3p on pRCC1 pathogenesis, we performed pathway analysis of its predicted targets. miR‐199a‐3p was predicted to significantly affect a number of pathways that can be involved in pRCC1 pathogenesis including the focal adhesion, ECM‐receptor interaction and regulation of actin cytoskeleton pathways (Table 3). Other interesting pathways included ErbB signaling pathway, mTOR signaling pathway and MAP kinase signaling pathway.
Table 3.
Biological pathways with significant enrichment for predicted gene targets of miR‐199a‐3p.
| Biological pathway | p‐value |
|---|---|
| ECM‐receptor interaction | <0.001 |
| Regulation of actin cytoskeleton | 0.001 |
| Focal adhesion | 0.002 |
| ErbB signaling pathway | 0.004 |
| Glioma | 0.004 |
| mTOR signaling pathway | 0.008 |
| MAPK signaling pathway | 0.008 |
| Melanoma | 0.010 |
| Chronic myeloid leukemia | 0.014 |
| Small cell lung cancer | 0.029 |
| Prostate cancer | 0.036 |
We next investigated the potential tumor suppressive role for miR‐199a‐3p in pRCC1 by performing a proliferation assay. After 24 h, 786‐O cells that were transfected with the miR‐199a‐3p mimic had a significantly lower proliferation rate compared to the negative control (Figure 5).
Figure 5.
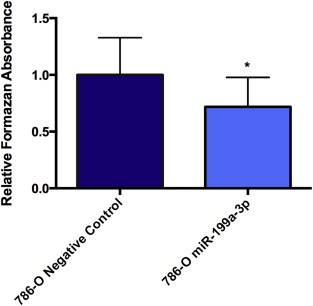
miR‐199a‐3p overexpression decreases cell proliferation. miR‐199a‐3p was transfected into 786‐O cells. After 24 h, cells were then incubated with WST‐1 reagent for 30 min. Formazan absorbance was measured at 440 nm. Cells transfected with the non‐targeting miRNA had a higher absorbance value compared to cells treated with the miR‐199a‐3p mimic. Experiments were conducted as biological triplicate. Statistical significance was measured using the Mann–Whitney test. *p < 0.05.
4. Discussion
The dismal response of metastatic pRCC to targeted therapy is a clear indication that our knowledge of the molecular players involved in this cancer is lacking. A previous study has indicated that the G1‐S checkpoint may be dysregulated in this RCC subtype (Yang et al., 2005). In the current study, we provide preliminary evidence through gene expression analysis that members of the focal adhesion and ECM pathways are involved in pRCC1. We also identified significantly up‐ or downregulated miRNAs in pRCC1 compared to normal kidney (p < 0.05) (Table 1). We further show that these miRNAs can regulate the expression of genes associated with the focal adhesion and ECM pathways (Figure 1), and this was experimentally validated. Our results are in agreement with previous literature. For example, we showed that secreted phosphoprotein 1 and vascular cell adhesion molecule 1 had higher mRNA expression in pRCC1 compared to normal kidney tissue, which reflects previous findings by other independent groups (Matusan et al., 2005; Shioi et al., 2006).
We provide multiple lines of evidence showing the involvement of the miR‐199a‐3p/focal adhesion and ECM pathways in pRCC1. These include the presence of an inverse correlation between the miRNA and its predicted targets in pRCC1 tissues compared to normal (Figure 2A–B). We also found that the predicted gene targets of miR‐199a‐3p were significantly enriched in the focal adhesion and ECM pathways (Table 3). To confirm our in silico findings, we over‐expressed miR‐199a‐3p in 786‐O and CAKI‐1 cells and measured a decrease in the mRNA expression of CAV2, ITGB8, MET and MTOR compared to the negative control group (Figure 3A–B). Finally, we provided evidence that miR‐199a‐3p targets the 3′ UTR of MET and MTOR by conducting a luciferase reporter assay (Figure 4). Therefore, miR‐199a‐3p can represent an attractive therapeutic target in pRCC1 that post‐transcriptionally regulates components of the focal adhesion and ECM pathways. By modulating miR‐199a‐3p expression, we can simultaneously achieve control over a number of pathways. These results should be, however, interpreted with caution due to the possibility of an indirect effect of the miRNA on other molecules.
We observed that miR‐199a‐3p negatively regulates proliferation of 786‐O cells (Figure 5). There are different mechanisms by which miR‐199a‐3p can affect cancer cell proliferation. Inhibition of the focal adhesion and ECM pathways has been previously linked to a decrease in cell proliferation (Gilmore and Romer, 1996). Another study also determined that miR‐199a‐3p negatively regulates cellular proliferation in hepatocellular carcinoma (Henry et al., 2010). A group also provided evidence that miR‐199a‐3p targets MET and its downstream targets, including MTOR (Huang et al., 2014). In addition, investigators found that miR‐199a‐3p downregulates the expression of MET and MTOR in hepatocellular carcinoma (Fornari et al., 2010). miR‐199a‐3p also negatively regulates MTOR in endometrial cancer (Wu et al., 2013). Dysregulation of miR‐199a‐3p is not limited to pRCC1 since it has a role in other malignancies, such as gastric cancer (Wang et al., 2014), papillary thyroid carcinoma (Minna et al., 2014), and colorectal cancer (Han et al., 2014). We previously showed that miR‐199a‐3p is downregulated in ccRCC (Chow et al., 2010). However, the role of miR‐199a‐3p in ccRCC warrants investigation.
In general, patients with metastatic non‐ccRCC, including pRCC, have poor response to mTOR inhibitors (Voss et al., 2014). Therefore, an effective targeted therapy for pRCC is warranted, particularly because this RCC subtype has a worse survival outcome than other non‐clear cell histologies (Motzer et al., 2002). Moreover, we provide evidence that MTOR is not upregulated at the transcriptional level in pRCC1 compared to normal kidney tissue (Data not shown). This finding may shed light on the low efficacy of mTOR inhibitors on treating this kidney cancer subtype. It would be warranted to further investigate the role of mTOR in pRCC1 by examining its protein expression and phosphorylation level compared to normal kidney tissue. In addition, the differential expression level of downstream targets of mTOR, such as the eukaryotic initiation factor 4E‐binding protein, should be measured. Although we provide evidence that miR‐199a‐3p targets MTOR at the mRNA and protein level, this oncogene may not have a significant role in the initiation or propagation of pRCC1, and there may be other genes with a greater oncogenic potential. In addition, a phase II clinical trial was recently performed for the administration of foretinib, a dual inhibitor of Met and vascular endothelial growth factor receptor 2, in pRCC patients (Choueiri et al., 2013). Patients with germline mutations in the MET proto‐oncogene had a high response rate to foretinib (Choueiri et al., 2013). It may be of interest to study whether miR‐199a‐3p may be a predictive biomarker for foretinib treatment in pRCC patients. Additionally, our study sheds light on the possibility of using other targeted therapies that intersect the focal adhesion and ECM pathways, such as the focal adhesion kinase inhibitor TAE226 (Halder et al., 2007).
There are a number of limitations in our study. For instance, 786‐O, CAKI and ACHN cells were used to perform in vitro experiments, as there is no currently available cell line for pRCC1. Future investigations on the molecular mechanisms underlining pRCC1 requires the use of cell lines generated from a patient with this RCC subtype since the function of miRNAs can be cell line specific (Flores et al., 2014). It still remains a task to elucidate whether dysregulation of the focal adhesion and ECM pathways is involved in the initiation or propagation of pRCC1. Moreover, the role of miR‐199a‐3p in pRCC1 pathogenesis must be interpreted with caution in view of the reported occurrence of trisomy 7 and MET activating mutations in this RCC subtype. These mechanisms, in addition to downregulation of miR‐199a‐3p, may occur concomitantly and exhibit a synergistic effect on pRCC1 disease progression. In addition, loss of miR‐199a‐3p may also serve as a supplementary oncogenic function in a subset of patients with trisomy 7 or mutated MET. A larger patient data set is required in order to address these potential scenarios.
5. Conclusions
We provided evidence for the aberrant expression of multiple members of the focal adhesion and ECM pathways in pRCC1 by both miRNA and gene expression analyses. We showed that miR‐199a‐3p can target members of these pathways, including MET and its downstream target MTOR, although the role of mTOR in pRCC1 requires further elucidation. Finally, this miRNA may have a tumor suppressive function in pRCC1 by inhibiting cellular proliferation. Insights into the molecular components driving pRCC1 are essential for the design and development of effective drug inhibitors.
Supporting information
The following are the supplementary data related to this article:
Supplementary Table S1 List of forward and reverse primers used for relative gene quantification by quantitative reverse transcription PCR (qRT‐PCR).
Supplementary Table S2 Partial List of pathways enriched with the predicted gene targets of dysregulated microRNAs (miRNAs) in papillary renal cell carcinoma type 1 (pRCC1)
Supplementary Figure 1. Papillary renal cell carcinoma type 1 (pRCC1) has a distinct mRNA expression profile. A) Gene microarray expression data was extracted from the publically available dataset GSE26574 and unsupervised clustering was performed using GenePattern software on the 5,000 genes with the most variance between pRCC1 and normal kidney tissue. A separation between pRCC1 and normal kidney tissues was observed. B) Microarray data was retrieved from GSE7023 for pRCC1 and normal kidney tissues. Hierarchical clustering was conducted as above. Again, pRCC1 tissues clustered separately from normal kidney tissue. C) Gene microarray data from pRCC1 and clear cell RCC (ccRCC) was extracted from GSE26574 and unsupervised clustering was performed using the top 5,000 differentially expressed genes. pRCC1 and ccRCC clustered away from one another on separate arms.
Supplementary Figure 2. Pathways that are involved in papillary renal cell carcinoma type 1 (pRCC1) pathogenesis. A) Gene Ontology analysis was performed on significantly (p<0.05) up‐regulated genes in pRCC1 compared to normal kidney tissue. The pie chart represents the proportion of up‐repregulated genes associated with a given biological process. B) Significantly (p<0.05) down‐regulated genes in pRCC1 were identified and analyzed using Gene Ontology. The pie chart demonstrates the proportion of down‐regulated genes associated with a specific biological process.
Supplementary Figure 3. miR‐199a‐3p downregulates the expression of its target genes in other kidney cancer cell lines. A) miR‐199a‐3p transfection led to decrease of expression of ITGB8 and MET to a variable degree in the ACHN cell line. The reference control gene was hypoxanthine phosphoribosyl transferase 1. B) There was also reduction in Met and mTOR protein expression levels after CAKI‐1 cells were transfected with miR‐199a‐3p compared to cells transfected with the non‐targeting miRNA negative control. β‐actin was used as a loading control.
Supplementary data
Supplementary data
Supplementary data
Supplementary data
Acknowledgments
GMY is supported by grants from the Canadian Institute of Health Research (MOP 119606), Kidney Foundation of Canada (KFOC130030), Kidney Cancer Research Network of Canada, and Prostate Cancer Canada Movember Discovery Grants (D2013‐39). The funding sources only provided financial support in the preparation of this manuscript.
Supplementary data 1.
1.1.
Supplementary data related to this article can be found at http://dx.doi.org/10.1016/j.molonc.2015.04.007.
Wala Samantha Jane, Karamchandani Jason Raj, Saleeb Rola, Evans Andrew, Ding Qiang, Ibrahim Rania, Jewett Michael, Pasic Maria, Finelli Antonio, Pace Kenneth, Lianidou Evi, Yousef George Makram, (2015), An integrated genomic analysis of papillary renal cell carcinoma type 1 uncovers the role of focal adhesion and extracellular matrix pathways, Molecular Oncology, 9, doi: 10.1016/j.molonc.2015.09.008.
Footnotes
Non‐standard abbreviations: RCC; renal cell carcinoma, ccRCC; clear cell RCC, pRCC; papillary RCC, pRCC1; pRCC type 1, pRCC2; pRCC type 2, miRNAs; microRNAs, UTR; untranslated region, ECM; extracellular matrix, CAV2; caveolin 2, qRT‐PCR; quantitative reverse transcription polymerase chain reaction, ITGB8; integrin beta 8, MTOR; mammalian target of rapamycin.
Contributor Information
Samantha Jane Wala, Email: Samantha.wala@gmail.com.
Jason Raj Karamchandani, Email: jkaramch@gmail.com.
Rola Saleeb, Email: rola.saleeb@mail.utoronto.ca.
Andrew Evans, Email: andrew.evans@uhn.on.ca.
Qiang Ding, Email: DingQ@smh.ca.
Rania Ibrahim, Email: IbrahimR@smh.ca.
Michael Jewett, Email: m.jewett@utoronto.ca.
Maria Pasic, Email: pasicm@stjoe.on.ca.
Antonio Finelli, Email: antonio.finelli@uhn.ca.
Kenneth Pace, Email: pacek@smh.ca.
Evi Lianidou, Email: lianidou@chem.uoa.gr.
George Makram Yousef, Email: yousefg@smh.ca.
References
- Barrett, T. , Wilhite, S.E. , Ledoux, P. , Evangelista, C. , Kim, I.F. , Tomashevsky, M. , Marshall, K.A. , Phillippy, K.H. , Sherman, P.M. , Holko, M. , Yefanov, A. , Lee, H. , Zhang, N. , Robertson, C.L. , Serova, N. , Davis, S. , Soboleva, A. , 2013. NCBI GEO: archive for functional genomics data sets–update. Nucleic Acids Res. 41, D991–D995. [DOI] [PMC free article] [PubMed] [Google Scholar]
- Beaty, B.T. , Wang, Y. , Bravo-Cordero, J.J. , Sharma, V.P. , Miskolci, V. , Hodgson, L. , Condeelis, J. , 2014. Talin regulates moesin-NHE-1 recruitment to invadopodia and promotes mammary tumor metastasis. J. Cell Biol. 205, 737–751. [DOI] [PMC free article] [PubMed] [Google Scholar]
- Cancer Genome Atlas Research Network, 2013. Comprehensive molecular characterization of clear cell renal cell carcinoma. Nature. 499, 43–49. [DOI] [PMC free article] [PubMed] [Google Scholar]
- Chen, C. , Ridzon, D.A. , Broomer, A.J. , Zhou, Z. , Lee, D.H. , Nguyen, J.T. , Barbisin, M. , Xu, N.L. , Mahuvakar, V.R. , Andersen, M.R. , Lao, K.Q. , Livak, K.J. , Guegler, K.J. , 2005. Real-time quantification of microRNAs by stem-loop RT-PCR. Nucleic Acids Res. 33, e179 [DOI] [PMC free article] [PubMed] [Google Scholar]
- Chen, S.Y. , Chen, H.C. , 2006. Direct interaction of focal adhesion kinase (FAK) with Met is required for FAK to promote hepatocyte growth factor-induced cell invasion. Mol. Cell Biol. 26, 5155–5167. [DOI] [PMC free article] [PubMed] [Google Scholar]
- Choueiri, T.K. , Vaishampayan, U. , Rosenberg, J.E. , Logan, T.F. , Harzstark, A.L. , Bukowski, R.M. , Rini, B.I. , Srinivas, S. , Stein, M.N. , Adams, L.M. , Ottesen, L.H. , Laubscher, K.H. , Sherman, L. , McDermott, D.F. , Haas, N.B. , Flaherty, K.T. , Ross, R. , Eisenberg, P. , Meltzer, P.S. , Merino, M.J. , Bottaro, D.P. , Linehan, W.M. , Srinivasan, R. , 2013. Phase II and biomarker study of the dual MET/VEGFR2 inhibitor foretinib in patients with papillary renal cell carcinoma. J. Clin. Oncol. 31, 181–186. [DOI] [PMC free article] [PubMed] [Google Scholar]
- Chow, T.F. , Mankaruous, M. , Scorilas, A. , Youssef, Y. , Girgis, A. , Mossad, S. , Metias, S. , Rofael, Y. , Honey, R.J. , Stewart, R. , Pace, K.T. , Yousef, G.M. , 2010. The miR-17-92 cluster is over expressed in and has an oncogenic effect on renal cell carcinoma. J. Urol. 183, 743–751. [DOI] [PubMed] [Google Scholar]
- Delahunt, B. , Cheville, J.C. , Martignoni, G. , Humphrey, P.A. , Magi-Galluzzi, C. , McKenney, J. , Egevad, L. , Algaba, F. , Moch, H. , Grignon, D.J. , Montironi, R. , Srigley, J.R. , 2013. The International Society of Urological Pathology (ISUP) grading system for renal cell carcinoma and other prognostic parameters. Am. J. Surg. Pathol. 37, 1490–1504. [DOI] [PubMed] [Google Scholar]
- Delahunt, B. , Eble, J.N. , 1997. Papillary renal cell carcinoma: a clinicopathologic and immunohistochemical study of 105 tumors. Mod. Pathol. 10, 537–544. [PubMed] [Google Scholar]
- Delahunt, B. , Srigley, J.R. , Montironi, R. , Egevad, L. , 2014. Advances in renal neoplasia: recommendations from the 2012 International Society of Urological Pathology Consensus Conference. Urology. 83, 969–974. [DOI] [PubMed] [Google Scholar]
- Edgar, R. , Domrachev, M. , Lash, A.E. , 2002. Gene Expression Omnibus: NCBI gene expression and hybridization array data repository. Nucleic Acids Res. 30, 207–210. [DOI] [PMC free article] [PubMed] [Google Scholar]
- Flores, O. , Kennedy, E.M. , Skalsky, R.L. , Cullen, B.R. , 2014. Differential RISC association of endogenous human microRNAs predicts their inhibitory potential. Nucleic Acids Res. 42, 4629–4639. [DOI] [PMC free article] [PubMed] [Google Scholar]
- Fornari, F. , Milazzo, M. , Chieco, P. , Negrini, M. , Calin, G.A. , Grazi, G.L. , Pollutri, D. , Croce, C.M. , Bolondi, L. , Gramantieri, L. , 2010. MiR-199a-3p regulates mTOR and c-Met to influence the doxorubicin sensitivity of human hepatocarcinoma cells. Cancer Res. 70, 5184–5193. [DOI] [PubMed] [Google Scholar]
- Gilmore, A.P. , Romer, L.H. , 1996. Inhibition of focal adhesion kinase (FAK) signaling in focal adhesions decreases cell motility and proliferation. Mol. Biol. Cell. 7, 1209–1224. [DOI] [PMC free article] [PubMed] [Google Scholar]
- Girgis, A.H. , Iakovlev, V.V. , Beheshti, B. , Bayani, J. , Squire, J.A. , Bui, A. , Mankaruos, M. , Youssef, Y. , Khalil, B. , Khella, H. , Pasic, M. , Yousef, G.M. , 2012. Multilevel whole-genome analysis reveals candidate biomarkers in clear cell renal cell carcinoma. Cancer Res. 72, 5273–5284. [DOI] [PubMed] [Google Scholar]
- Golub, T.R. , Slonim, D.K. , Tamayo, P. , Huard, C. , Gaasenbeek, M. , Mesirov, J.P. , Coller, H. , Loh, M.L. , Downing, J.R. , Caligiuri, M.A. , Bloomfield, C.D. , Lander, E.S. , 1999. Molecular classification of cancer: class discovery and class prediction by gene expression monitoring. Science. 286, 531–537. [DOI] [PubMed] [Google Scholar]
- Halder, J. , Lin, Y.G. , Merritt, W.M. , Spannuth, W.A. , Nick, A.M. , Honda, T. , Kamat, A.A. , Han, L.Y. , Kim, T.J. , Lu, C. , Tari, A.M. , Bornmann, W. , Fernandez, A. , Lopez-Berestein, G. , Sood, A.K. , 2007. Therapeutic efficacy of a novel focal adhesion kinase inhibitor TAE226 in ovarian carcinoma. Cancer Res. 67, 10976–10983. [DOI] [PubMed] [Google Scholar]
- Han, Y. , Kuang, Y. , Xue, X. , Guo, X. , Li, P. , Wang, X. , Guo, X. , Yuan, B. , Zhi, Q. , Zhao, H. , 2014. NLK, a novel target of miR-199a-3p, functions as a tumor suppressor in colorectal cancer. Biomed. Pharmacother. 68, 497–505. [DOI] [PubMed] [Google Scholar]
- Hendrickson, D.G. , Hogan, D.J. , McCullough, H.L. , Myers, J.W. , Herschlag, D. , Ferrell, J.E. , Brown, P.O. , 2009. Concordant regulation of translation and mRNA abundance for hundreds of targets of a human microRNA. PLoS Biol. 7, e1000238 [DOI] [PMC free article] [PubMed] [Google Scholar]
- Henry, J.C. , Park, J.K. , Jiang, J. , Kim, J.H. , Nagorney, D.M. , Roberts, L.R. , Banerjee, S. , Schmittgen, T.D. , 2010. miR-199a-3p targets CD44 and reduces proliferation of CD44 positive hepatocellular carcinoma cell lines. Biochem. Biophys. Res. Commun. 403, 120–125. [DOI] [PMC free article] [PubMed] [Google Scholar]
- Hensley, P.J. , Desiniotis, A. , Wang, C. , Stromberg, A. , Chen, C.S. , Kyprianou, N. , 2014. Novel pharmacologic targeting of tight junctions and focal adhesions in prostate cancer cells. PLoS One. 9, e86238 [DOI] [PMC free article] [PubMed] [Google Scholar]
- Huang, J. , Dong, B. , Zhang, J. , Kong, W. , Chen, Y. , Xue, W. , Liu, D. , Huang, Y. , 2014. miR-199a-3p inhibits hepatocyte growth factor/c-Met signaling in renal cancer carcinoma. Tumour. Biol. 35, 5833–5843. [DOI] [PubMed] [Google Scholar]
- Jiang, F. , Richter, J. , Schraml, P. , Bubendorf, L. , Gasser, T. , Sauter, G. , Mihatsch, M.J. , Moch, H. , 1998. Chromosomal imbalances in papillary renal cell carcinoma: genetic differences between histological subtypes. Am. J. Pathol. 153, 1467–1473. [DOI] [PMC free article] [PubMed] [Google Scholar]
- Jones, J. , Marian, D. , Weich, E. , Engl, T. , Wedel, S. , Relja, B. , Jonas, D. , Blaheta, R.A. , 2007. CXCR4 chemokine receptor engagement modifies integrin dependent adhesion of renal carcinoma cells. Exp. Cell Res. 313, 4051–4065. [DOI] [PubMed] [Google Scholar]
- Jung, M. , Mollenkopf, H.J. , Grimm, C. , Wagner, I. , Albrecht, M. , Waller, T. , Pilarsky, C. , Johannsen, M. , Stephan, C. , Lehrach, H. , Nietfeld, W. , Rudel, T. , Jung, K. , Kristiansen, G. , 2009. MicroRNA profiling of clear cell renal cell cancer identifies a robust signature to define renal malignancy. J. Cell Mol. Med. 13, 3918–3928. [DOI] [PMC free article] [PubMed] [Google Scholar]
- Khella, H.W. , Bakhet, M. , Allo, G. , Jewett, M.A. , Girgis, A.H. , Latif, A. , Girgis, H. , Von, B.,I. , Bjarnason, G.A. , Yousef, G.M. , 2013. miR-192, miR-194 and miR-215: a convergent microRNA network suppressing tumor progression in renal cell carcinoma. Carcinogenesis. 34, 2231–2239. [DOI] [PubMed] [Google Scholar]
- Klatte, T. , Pantuck, A.J. , Said, J.W. , Seligson, D.B. , Rao, N.P. , LaRochelle, J.C. , Shuch, B. , Zisman, A. , Kabbinavar, F.F. , Belldegrun, A.S. , 2009. Cytogenetic and molecular tumor profiling for type 1 and type 2 papillary renal cell carcinoma. Clin. Cancer Res. 15, 1162–1169. [DOI] [PubMed] [Google Scholar]
- Lee, R.C. , Feinbaum, R.L. , Ambros, V. , 1993. The C. elegans heterochronic gene lin-4 encodes small RNAs with antisense complementarity to lin-14. Cell. 75, 843–854. [DOI] [PubMed] [Google Scholar]
- Lichner, Z. , Saleh, C. , Subramaniam, V. , Seivwright, A. , Prud'homme, G.J. , Yousef, G.M. , 2014. miR-17 inhibition enhances the formation of kidney cancer spheres with stem cell/tumor initiating cell properties. Oncotarget. [DOI] [PMC free article] [PubMed] [Google Scholar]
- Ljungberg, B. , Cowan, N.C. , Hanbury, D.C. , Hora, M. , Kuczyk, M.A. , Merseburger, A.S. , Patard, J.J. , Mulders, P.F. , Sinescu, I.C. , 2010. EAU guidelines on renal cell carcinoma: the 2010 update. Eur. Urol. 58, 398–406. [DOI] [PubMed] [Google Scholar]
- Lubensky, I.A. , Schmidt, L. , Zhuang, Z. , Weirich, G. , Pack, S. , Zambrano, N. , Walther, M.M. , Choyke, P. , Linehan, W.M. , Zbar, B. , 1999. Hereditary and sporadic papillary renal carcinomas with c-met mutations share a distinct morphological phenotype. Am. J. Pathol. 155, 517–526. [DOI] [PMC free article] [PubMed] [Google Scholar]
- Mathonnet, G. , Fabian, M.R. , Svitkin, Y.V. , Parsyan, A. , Huck, L. , Murata, T. , Biffo, S. , Merrick, W.C. , Darzynkiewicz, E. , Pillai, R.S. , Filipowicz, W. , Duchaine, T.F. , Sonenberg, N. , 2007. MicroRNA inhibition of translation initiation in vitro by targeting the cap-binding complex eIF4F. Science. 317, 1764–1767. [DOI] [PubMed] [Google Scholar]
- Matusan, K. , Dordevic, G. , Mozetic, V. , Lucin, K. , 2005. Expression of osteopontin and CD44 molecule in papillary renal cell tumors. Pathol. Oncol. Res. 11, 108–113. [DOI] [PubMed] [Google Scholar]
- Meredith, J.E. , Fazeli, B. , Schwartz, M.A. , 1993. The extracellular matrix as a cell survival factor. Mol. Biol. Cell. 4, 953–961. [DOI] [PMC free article] [PubMed] [Google Scholar]
- Mi, H. , Muruganujan, A. , Thomas, P.D. , 2013. PANTHER in 2013: modeling the evolution of gene function, and other gene attributes, in the context of phylogenetic trees. Nucleic Acids Res. 41, D377–D386. [DOI] [PMC free article] [PubMed] [Google Scholar]
- Minna, E. , Romeo, P. , De, C.L. , Dugo, M. , Cassinelli, G. , Pilotti, S. , Degl'Innocenti, D. , Lanzi, C. , Casalini, P. , Pierotti, M.A. , Greco, A. , Borrello, M.G. , 2014. miR-199a-3p displays tumor suppressor functions in papillary thyroid carcinoma. Oncotarget. 5, 2513–2528. [DOI] [PMC free article] [PubMed] [Google Scholar]
- Motzer, R.J. , Bacik, J. , Mariani, T. , Russo, P. , Mazumdar, M. , Reuter, V. , 2002. Treatment outcome and survival associated with metastatic renal cell carcinoma of non-clear-cell histology. J. Clin. Oncol. 20, 2376–2381. [DOI] [PubMed] [Google Scholar]
- Nottrott, S. , Simard, M.J. , Richter, J.D. , 2006. Human let-7a miRNA blocks protein production on actively translating polyribosomes. Nat. Struct. Mol. Biol. 13, 1108–1114. [DOI] [PubMed] [Google Scholar]
- Pasic, M.D. , Samaan, S. , Yousef, G.M. , 2013. Genomic medicine: new frontiers and new challenges. Clin. Chem. 59, 158–167. [DOI] [PubMed] [Google Scholar]
- Pignot, G. , Elie, C. , Conquy, S. , Vieillefond, A. , Flam, T. , Zerbib, M. , Debre, B. , Amsellem-Ouazana, D. , 2007. Survival analysis of 130 patients with papillary renal cell carcinoma: prognostic utility of type 1 and type 2 subclassification. Urology. 69, 230–235. [DOI] [PubMed] [Google Scholar]
- Reich, M. , Ohm, K. , Angelo, M. , Tamayo, P. , Mesirov, J.P. , 2004. GeneCluster 2.0: an advanced toolset for bioarray analysis. Bioinformatics. 20, 1797–1798. [DOI] [PubMed] [Google Scholar]
- Ryu, J. , Kang, M. , Lee, M.S. , Kim, H.J. , Nam, S.H. , Song, H.E. , Lee, D. , Lee, J.W. , 2014. Cross talk between the TM4SF5/focal adhesion kinase and the interleukin-6/STAT3 pathways promotes immune escape of human liver cancer cells. Mol. Cell Biol. 34, 2946–2960. [DOI] [PMC free article] [PubMed] [Google Scholar]
- Sanders, M.E. , Mick, R. , Tomaszewski, J.E. , Barr, F.G. , 2002. Unique patterns of allelic imbalance distinguish type 1 from type 2 sporadic papillary renal cell carcinoma. Am. J. Pathol. 161, 997–1005. [DOI] [PMC free article] [PubMed] [Google Scholar]
- Sengupta, S. , den Boon, J.A. , Chen, I.H. , Newton, M.A. , Stanhope, S.A. , Cheng, Y.J. , Chen, C.J. , Hildesheim, A. , Sugden, B. , Ahlquist, P. , 2008. MicroRNA 29c is down-regulated in nasopharyngeal carcinomas, up-regulating mRNAs encoding extracellular matrix proteins. Proc. Natl. Acad. Sci. U. S. A. 105, 5874–5878. [DOI] [PMC free article] [PubMed] [Google Scholar]
- Shioi, K. , Komiya, A. , Hattori, K. , Huang, Y. , Sano, F. , Murakami, T. , Nakaigawa, N. , Kishida, T. , Kubota, Y. , Nagashima, Y. , Yao, M. , 2006. Vascular cell adhesion molecule 1 predicts cancer-free survival in clear cell renal carcinoma patients. Clin. Cancer Res. 12, 7339–7346. [DOI] [PubMed] [Google Scholar]
- Sweeney, P. , El-Naggar, A.K. , Lin, S.H. , Pisters, L.L. , 2002. Biological significance of c-met over expression in papillary renal cell carcinoma. J. Urol. 168, 51–55. [PubMed] [Google Scholar]
- Toro, J.R. , Nickerson, M.L. , Wei, M.H. , Warren, M.B. , Glenn, G.M. , Turner, M.L. , Stewart, L. , Duray, P. , Tourre, O. , Sharma, N. , Choyke, P. , Stratton, P. , Merino, M. , Walther, M.M. , Linehan, W.M. , Schmidt, L.S. , Zbar, B. , 2003. Mutations in the fumarate hydratase gene cause hereditary leiomyomatosis and renal cell cancer in families in North America. Am. J. Hum. Genet. 73, 95–106. [DOI] [PMC free article] [PubMed] [Google Scholar]
- Voss, M.H. , Bastos, D.A. , Karlo, C.A. , Ajeti, A. , Hakimi, A.A. , Feldman, D.R. , Hsieh, J.J. , Molina, A.M. , Patil, S. , Motzer, R.J. , 2014. Treatment outcome with mTOR inhibitors for metastatic renal cell carcinoma with nonclear and sarcomatoid histologies. Ann. Oncol. 25, 663–668. [DOI] [PMC free article] [PubMed] [Google Scholar]
- Wang, Z. , Ma, X. , Cai, Q. , Wang, X. , Yu, B. , Cai, Q. , Liu, B. , Zhu, Z. , Li, C. , 2014. MiR-199a-3p promotes gastric cancer progression by targeting ZHX1. FEBS Lett. 588, 4504–4512. [DOI] [PubMed] [Google Scholar]
- White, N.M. , Bao, T.T. , Grigull, J. , Youssef, Y.M. , Girgis, A. , Diamandis, M. , Fatoohi, E. , Metias, M. , Honey, R.J. , Stewart, R. , Pace, K.T. , Bjarnason, G.A. , Yousef, G.M. , 2011. miRNA profiling for clear cell renal cell carcinoma: biomarker discovery and identification of potential controls and consequences of miRNA dysregulation. J. Urol. 186, 1077–1083. [DOI] [PubMed] [Google Scholar]
- White, N.M. , Yousef, G.M. , 2011. Translating molecular signatures of renal cell carcinoma into clinical practice. J. Urol. 186, 9–11. [DOI] [PubMed] [Google Scholar]
- Wu, D. , Huang, H.J. , He, C.N. , Wang, K.Y. , 2013. MicroRNA-199a-3p regulates endometrial cancer cell proliferation by targeting mammalian target of rapamycin (mTOR). Int. J. Gynecol. Cancer. 23, 1191–1197. [DOI] [PubMed] [Google Scholar]
- Xiao, G.H. , Jeffers, M. , Bellacosa, A. , Mitsuuchi, Y. , Vande Woude, G.F. , Testa, J.R. , 2001. Anti-apoptotic signaling by hepatocyte growth factor/Met via the phosphatidylinositol 3-kinase/Akt and mitogen-activated protein kinase pathways. Proc. Natl. Acad. Sci. U. S. A. 98, 247–252. [DOI] [PMC free article] [PubMed] [Google Scholar]
- Yamasaki, T. , Seki, N. , Yoshino, H. , Itesako, T. , Hidaka, H. , Yamada, Y. , Tatarano, S. , Yonezawa, T. , Kinoshita, T. , Nakagawa, M. , Enokida, H. , 2013. MicroRNA-218 inhibits cell migration and invasion in renal cell carcinoma through targeting caveolin-2 involved in focal adhesion pathway. J. Urol. 190, 1059–1068. [DOI] [PubMed] [Google Scholar]
- Yang, X.J. , Tan, M.H. , Kim, H.L. , Ditlev, J.A. , Betten, M.W. , Png, C.E. , Kort, E.J. , Futami, K. , Furge, K.A. , Takahashi, M. , Kanayama, H.O. , Tan, P.H. , Teh, B.S. , Luan, C. , Wang, K. , Pins, M. , Tretiakova, M. , Anema, J. , Kahnoski, R. , Nicol, T. , Stadler, W. , Vogelzang, N.G. , Amato, R. , Seligson, D. , Figlin, R. , Belldegrun, A. , Rogers, C.G. , Teh, B.T. , 2005. A molecular classification of papillary renal cell carcinoma. Cancer Res. 65, 5628–5637. [DOI] [PubMed] [Google Scholar]
- Youssef, Y.M. , White, N.M. , Grigull, J. , Krizova, A. , Samy, C. , Mejia-Guerrero, S. , Evans, A. , Yousef, G.M. , 2011. Accurate molecular classification of kidney cancer subtypes using microRNA signature. Eur. Urol. 59, 721–730. [DOI] [PubMed] [Google Scholar]
Web references
- DAVID Functional Annotation Bioinformatics Microarray Analysis (http://david.abcc.ncifcrf.gov/).
- DIANA – mirPath (http://diana.cslab.ece.ntua.gr/pathways/).
- GenePattern (http://www.broadinstitute.org/cancer/software/genepattern).
- PANTHER Classification System (http://www.pantherdb.org/).
- PicTar (http://pictar.mdc-berlin.de/).
- Primer3 (http://gmdd.shgmo.org/primer3/?seqid=47).
- TargetScanHuman 5.2 (http://www.targetscan.org/vert_50/).
Associated Data
This section collects any data citations, data availability statements, or supplementary materials included in this article.
Supplementary Materials
The following are the supplementary data related to this article:
Supplementary Table S1 List of forward and reverse primers used for relative gene quantification by quantitative reverse transcription PCR (qRT‐PCR).
Supplementary Table S2 Partial List of pathways enriched with the predicted gene targets of dysregulated microRNAs (miRNAs) in papillary renal cell carcinoma type 1 (pRCC1)
Supplementary Figure 1. Papillary renal cell carcinoma type 1 (pRCC1) has a distinct mRNA expression profile. A) Gene microarray expression data was extracted from the publically available dataset GSE26574 and unsupervised clustering was performed using GenePattern software on the 5,000 genes with the most variance between pRCC1 and normal kidney tissue. A separation between pRCC1 and normal kidney tissues was observed. B) Microarray data was retrieved from GSE7023 for pRCC1 and normal kidney tissues. Hierarchical clustering was conducted as above. Again, pRCC1 tissues clustered separately from normal kidney tissue. C) Gene microarray data from pRCC1 and clear cell RCC (ccRCC) was extracted from GSE26574 and unsupervised clustering was performed using the top 5,000 differentially expressed genes. pRCC1 and ccRCC clustered away from one another on separate arms.
Supplementary Figure 2. Pathways that are involved in papillary renal cell carcinoma type 1 (pRCC1) pathogenesis. A) Gene Ontology analysis was performed on significantly (p<0.05) up‐regulated genes in pRCC1 compared to normal kidney tissue. The pie chart represents the proportion of up‐repregulated genes associated with a given biological process. B) Significantly (p<0.05) down‐regulated genes in pRCC1 were identified and analyzed using Gene Ontology. The pie chart demonstrates the proportion of down‐regulated genes associated with a specific biological process.
Supplementary Figure 3. miR‐199a‐3p downregulates the expression of its target genes in other kidney cancer cell lines. A) miR‐199a‐3p transfection led to decrease of expression of ITGB8 and MET to a variable degree in the ACHN cell line. The reference control gene was hypoxanthine phosphoribosyl transferase 1. B) There was also reduction in Met and mTOR protein expression levels after CAKI‐1 cells were transfected with miR‐199a‐3p compared to cells transfected with the non‐targeting miRNA negative control. β‐actin was used as a loading control.
Supplementary data
Supplementary data
Supplementary data
Supplementary data