

Abstract
The feasibility of longitudinal metastatic biopsies for gene expression profiling in breast cancer is unexplored. Dynamic changes in gene expression can potentially predict efficacy of targeted cancer drugs.
Patients enrolled in a phase III trial of metastatic breast cancer with docetaxel monotherapy versus combination of docetaxel + sunitinib were offered to participate in a translational substudy comprising longitudinal fine needle aspiration biopsies and Positron Emission Tomography imaging before (T1) and two weeks after start of treatment (T2). Aspirated tumor material was used for microarray analysis, and treatment‐induced changes (T2 versus T1) in gene expression and standardized uptake values (SUV) were investigated and correlated to clinical outcome measures.
Gene expression profiling yielded high‐quality data at both time points in 14/18 patients. Unsupervised clustering revealed specific patterns of changes caused by monotherapy vs. combination therapy (p = 0.021, Fisher's exact test). A therapy‐induced reduction of known proliferation and hypoxia metagene scores was prominent in the combination arm. Changes in a previously reported hypoxia metagene score were strongly correlated to the objective responses seen by conventional radiology assessments after 6 weeks in the combination arm, Spearman's ρ = 1 (p = 0.017) but not in monotherapy, ρ = −0.029 (p = 1). Similarly, the Predictor Analysis of Microarrays 50 (PAM50) proliferation metagene correlated to tumor changes merely in the combination arm at 6 and 12 weeks (ρ = 0.900, p = 0.083 and ρ = 1, p = 0.017 respectively). Reductions in mean SUV were a reliable early predictor of objective response in monotherapy, ρ = 0.833 (p = 0.008), but not in the combination arm ρ = −0.029 (p = 1).
Gene expression profiling of longitudinal metastatic aspiration biopsies was feasible, demonstrated biological validity and provided predictive information.
Keywords: Breast cancer, Relapse biopsy, Positron emission tomography, Hypoxia, Sunitinib
Highlights
Sequential biopsies were incorporated in a phase 3 trial of advanced breast cancer.
Gene expression profiling of sequential metastatic aspiration biopsies was feasible.
Comparison of pre‐with post‐treatment profiles showed biologically valid changes.
Changes in hypoxia and proliferation scores could predict response to sunitinib.
1. Introduction
In early breast cancer, gene expression has emerged as a method for classifying into biologically and clinically relevant subtypes, defining prognosis and selecting patients for treatment (Prat et al., 2012). In metastatic breast cancer (MBC) the data on gene expression and its impact on treatment effect or survival are scarce. Classical prognostic and predictive biomarkers that are determined on primary tumor are used. Accumulating evidence suggests that this strategy is suboptimal as the metastatic disease is often different from the primary, owing to clonal evolution, tumor heterogeneity and effect of adjuvant treatments (Foukakis et al., 2012).
This limitation has been recognized, and both retrospective (Lindstrom et al., 2012) and prospective (Amir et al., 2012; Thompson et al., 2010) studies have demonstrated that determining diagnosis and estrogen receptor and human epidermal growth factor 2 (HER2) on metastatic biopsies have an impact on treatment selection and in some cases on survival (Botteri et al., 2012). Several efforts have focused on identifying surrogate biomarkers in peripheral blood, not limited to proteins by classical biochemical assays, but also circulating tumor cells (Bidard et al., 2013) and more recently circulating tumor DNA (Dawson et al., 2013). All these are however in early stage of development and their clinical validity and utility remain to be proven. Similarly, evolving imaging methods using 18F‐2‐fluoro‐2‐deoxyglucose positron emission tomography/computed tomography (FDG‐PET/CT) appear promising for therapy monitoring and prediction but are to date not utilized clinically (Cachin et al., 2006; De Giorgi et al., 2009; Dose Schwarz et al., 2005).
Sunitinib is a multi‐targeted tyrosine kinase inhibitor with antiangiogenic and tumor inhibitory effects both in vivo and in vitro (Abrams et al., 2003; O'Farrell et al., 2003). Targets of sunitinib include vascular endothelial growth factor receptors, platelet‐derived growth factor receptors and stem cell factor receptor. In MBC, single agent sunitinib demonstrated antitumoral effect with overall response rate of 11% in a phase II trial (Burstein et al., 2008). In a subsequent phase III trial the addition of sunitinib to standard first line treatment with docetaxel was assessed (Bergh et al., 2012). The objective response (OR) rate was higher with the combination than with monotherapy (55% vs. 42%). However, this did not translate into improvements in median progression‐free survival (PFS, 8.6 vs. 8.3 months) or overall survival (24.8 vs. 25.5 months). The patients included in the trial at Karolinska Hospital were also offered to participate in a translational substudy utilizing sequential metastatic fine needle aspiration biopsies (FNAB) and FDG‐PET/CT. Here, we report the results of the substudy, as a proof of concept for this strategy aiming at understanding drug action and identifying potential biomarkers.
2. Materials and methods
2.1. The docetaxel ± sunitinib phase III clinical trial
The randomized phase III trial of docetaxel ± sunitinib in MBC has been reported in detail elsewhere (see Supplementary Methods for the full study protocol) (Bergh et al., 2012). Briefly, it was a prospective, multicenter, randomized, open‐label, phase III study, comparing docetaxel (75 mg/m2 intravenously every 3 weeks (q3w)) combined with sunitinib (37.5 mg orally once daily from days 2–15 q3w) versus docetaxel alone (100 mg/m2 q3w), as first line therapy in patients with HER2 negative MBC. Patients were stratified based on the number of metastatic sites, estrogen receptor status and disease‐free interval after prior adjuvant treatment. Measurable disease by Response Evaluation Criteria in Solid Tumors (RECIST) version 1.0 or bone‐only disease was allowed. The primary endpoint was PFS, defined as the time from the date of randomization to the first evidence of progression or death from any cause. Conventional radiological tumor assessments were performed at baseline and at 6 weeks intervals (based on RECIST) and were evaluated by the investigators and retrospectively by an independent central review laboratory blinded to treatment assignment (RadPharm, Princeton, NJ). OR were confirmed at least 6 weeks after having been initially documented.
2.2. The exploratory substudy at Karolinska
All patients included in the phase III trial at Karolinska University Hospital were offered to participate in this exploratory substudy (see Supplementary Methods for the main study protocol including the substudy amendment). The main objective of the study was to determine whether gene expression profiling is feasible using sequential, intra‐patient FNAB. Secondary objectives were to identify potential biomarkers of early response by gene expression and/or FDG‐PET/CT and to explore drug action in vivo by changes in gene expression.
Patients were subjected to baseline FDG‐PET/CT assessment, followed by Ultrasound/CT‐guided FNAB of one tumor lesion prior to start of treatment (time point T1). The aspirated material allowed the morphological confirmation of the lesion and RNA isolation. FDG‐PET/CT and FNAB of the same lesion were repeated at Day 14 ± 1 (time point T2). Patients were treated and evaluated according to the main study protocol. The randomization algorithm of the phase III trial was not stratified by site and was not affected by the participation in the substudy.
The study was approved by the ethics committee of the Karolinska Institutet. A separate written informed consent for the substudy was obtained from all patients.
2.3. Functional imaging with 18F‐FDG‐PET/CT
The methodology, technical details and equipment used for the 18F‐FDG‐PET/CT are detailed in the Supplementary Methods. Tumor assessments were performed at T1 and T2, using the same radiopharmaceutical and activity at both times. The radioactive uptake in the selected regions of interest and of the same tumor areas was calculated and evaluated by the investigators who were blinded to study arm. Three‐dimensional isocontour‐ROI's were used to assess standardized uptake values (SUV) of the lesion targeted for FNAB. PET response was stratified by the metabolic response criteria using a threshold of >25% reduction in maximum SUV (SUVmax) and mean SUV (SUVmean) at T2 compared to baseline.
2.4. Metastatic lesion biopsies and gene expression profiling
Ultrasound/CT‐guided FNAB from a selected metastasis was obtained at T1 and T2 allowing for morphological confirmation of the lesion and gene expression profiling at both times. To perform gene expression analysis, RNA extraction was performed using the RNeasy mini kit (Qiagen, Hilden, Germany) according to a standard protocol. In brief, biopsies preserved in RNAlater were centrifuged and the pellets were transferred into RLT buffer (RNeasy Lysis Buffer, Qiagen, Hilden, Germany). Proteinase K was added and the samples were treated for 10 min at 55 °C (Egyházi et al., 2004). Total RNA was then isolated using Qiagen's microspin technology. DNase was also added to the samples. The quality of the RNA was assessed by measuring the 28S:18S ribosomal RNA ratio using an Agilent 2100 bioanalyzer (Agilent Technologies, Rockville, MD, USA). All samples with RNA of high quality were stored at −80 °C until used in microarray experiments. Due to the low amounts of RNA retrieved from FNAB samples, a two‐cycle cDNA synthesis protocol was used to generate labeled cRNA for hybridization. Samples were hybridized in the GeneChip® Human Genome U133 Plus 2.0 Array (Affymetrix, CA, USA) containing 54,675 probesets. A summary of the handling of the FNAB according to the Biospecimen Reporting for Improved Study Quality (BRISQ) (Moore et al., 2011) recommendations is provided in the Supplementary Table S1.
2.5. Gene expression data analysis
All gene expression data analysis was done in R/Bioconductor. Probe intensities were extracted from Affymetrix CEL files and background corrected, normalized and summarized to probeset expression using the rma function from the affy package with the default settings (Gautier et al., 2004). The quality of gene expression data was assessed with the arrayQualityMetrics package (Kauffmann et al., 2009). Control of RNA integrity and correction of RNA quality effects was performed using the AffyRNADegradation package (Fasold and Binder, 2013). Probesets were mapped to Entrez Gene IDs using the hgu133plus2.db package and expression data was collapsed to gene level using a non‐specific filter keeping only the probesets with highest interquartile range in the case of multiple mappings to the same Entrez Gene ID. An exception of this was the hypoxia metagene, which is based on the same platform. Intra‐patient change from T1 to T2 for each gene was also derived. Expression levels are log2 transformed intensity values, hence a difference in expression by one unit corresponds to a two‐fold mean change in probe intensities.
For unsupervised clustering, a further non‐specific filtering was applied to keep only the top 1000 genes with highest interquartile range of expression across samples – or intrapatient change from T1 to T2 when these quantities were explored. Cluster heatmaps were drawn where rows and columns of the data matrix were arranged based on unsupervised clustering using the Euclidean distance metric and average‐linkage hierarchical clustering algorithm. In each cluster heatmap, the leaves of the dendrograms were reordered according to the column and row means of the matrix, respectively, maintaining constrains of the dendrograms from the hierarchical clustering. Clustering patterns were further visualized using multidimensional scaling plots in which a Euclidian‐based distance metric was used. Finally, an unsupervised 2‐means clustering of the change from baseline values was performed.
Two previously published metagenes were studied: The 11 proliferation genes in the Predictor Analysis of Microarrays 50 (PAM50) gene set ‐ the PAM50‐proliferation index (Nielsen et al., 2010) (proliferation metagene) and the 51 HG‐U133 Plus 2 probesets in the common hypoxia metagene by Buffa et al. (Buffa et al., 2010). For each sample and metagene, a metagene score was calculated as the average expression of the genes/probesets in the metagene.
Group‐level treatment induced changes in gene expression from T1 to T2 in each arm were quantified with moderated paired t‐test statistics using the limma package. Gene set enrichment analyses (GSEA) of the Kyoto Encyclopedia of Genes and Genomes (KEGG) gene set collections in the Molecular Signatures Database (Broad Institute, version 4.0) was performed using the GSEA Software (Broad Institute, version 2.0.13) (Subramanian et al., 2005) with genes pre‐ranked according to the moderated paired t‐test statistics.
Array data were deposited at the Gene Expression Omnibus Database under accession number GSE54323.
2.6. Statistical analysis
All statistical analysis was done in R version 3.0.2. Spearman's rank correlation coefficient and Fisher's exact test were used to assess association between two continuous variables and two categorical variables, respectively. The median PFS was calculated using the R package survival with the default settings. All statistical tests were two‐sided.
3. Results
3.1. Patient characteristics and clinical outcome
Twenty‐one patients were included in the docetaxel ± sunitinib trial at Karolinska and 18 of them agreed to participate in the substudy. Of the 18 women enrolled, 8 were randomly assigned to sunitinib plus docetaxel and 10 to docetaxel alone (Figure 1). Demographic and baseline disease characteristics were well balanced between the treatment arms (Table 1).
Figure 1.
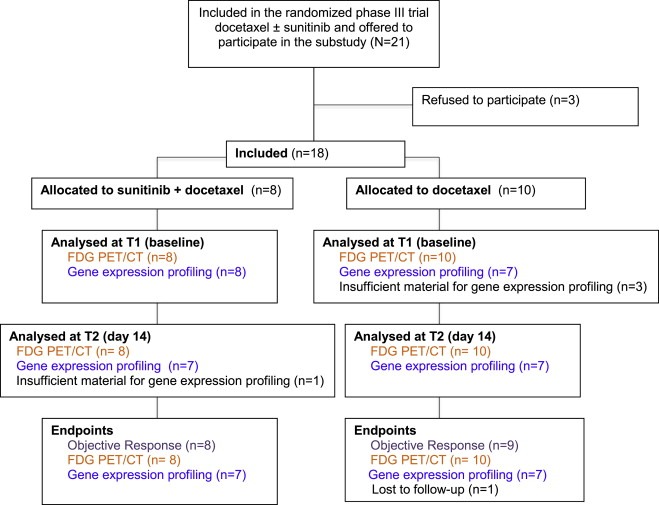
Consort diagram of the Karolinska substudy in the docetaxel ± sunitinib phase III trial of metastatic breast cancer. FDG PET/CT = 18F‐2‐fluoro‐2‐deoxyglucose positron emission tomography/computed tomography.
Table 1.
Baseline characteristics of the 18 patients included in the study.
| Variable | Sunitinib + docetaxel | Docetaxel |
|---|---|---|
| No. of patients | 8 | 10 |
| Age | ||
| Median | 59 | 52 |
| Range | 33–66 | 28–62 |
| Extend of disease | ||
| Metastatic | 7 | 10 |
| Locally recurrenta | 1 | 0 |
| Location of metastasis | ||
| Visceral | 5 | 9 |
| Bone only | 2 | 1 |
| Histology | ||
| Ductal | 8 | 10 |
| Other | 0 | 0 |
| Estrogen receptor status | ||
| Positive | 6 | 8 |
| Negative | 2 | 2 |
| Recurrence‐free interval | ||
| ≤12 months | 0 | 2 |
| >12 months | 8 | 8 |
Non‐operable.
Efficacy results based on independent central review were available for 17 patients (one patient in the monotherapy arm was lost to follow up). An OR was seen in 11 patients (all confirmed partial responses), 5 with partial response and 3 with stable disease in combination arm (OR rate = 63%) and 6 with partial response, 2 with stable disease and 1 with progressive disease in the monotherapy arm (OR rate = 67%). Median PFS was 7 months (95% Confidence interval = 5.36 – not reached) in the combination arm and 8.2 months (95% Confidence interval 3.94 – not reached) in the docetaxel arm.
3.2. Treatment‐induced changes in 18F‐FDG PET/CT
All 18 patients had a positive FDG‐PET/CT uptake in the regions of interest at baseline before starting treatment, measured by SUV. Changes in SUVmax and SUVmean between T1 and T2 were investigated in the two treatment arms (Supplementary Table S2). The result of serial‐assessment in regions of interest shows that the reduction of median SUVmax was greater than 25% in both groups, and median SUVmean was reduced by 24% in the combination arm and 30% in the monotherapy arm.
3.3. Feasibility of FNAB and gene expression profiling
Metastatic FNAB were carried out in 17 of the 18 patients at both time points with no complications reported. The biopsy sites are seen in Figure 2. Representative tumor material, sufficient for RNA extraction both in T1 and T2 was obtained in 14 cases, 7 in each arm (Figure 1). The quality of RNA was approved for microarray experiments in all samples. A quality control of the expression data indicated low levels of RNA degradation with no confounding pattern among the samples (Supplementary Figure S1). Correction of RNA quality effects using the AffyRNADegradation package did not affect further analyses (data not shown) and all results presented are generated using the original, uncorrected data. Furthermore, gene expression profiles were consistent when a different RNA amplification kit or RNA from another lesion was used (study subject 10, Supplementary Figure S2).
Figure 2.
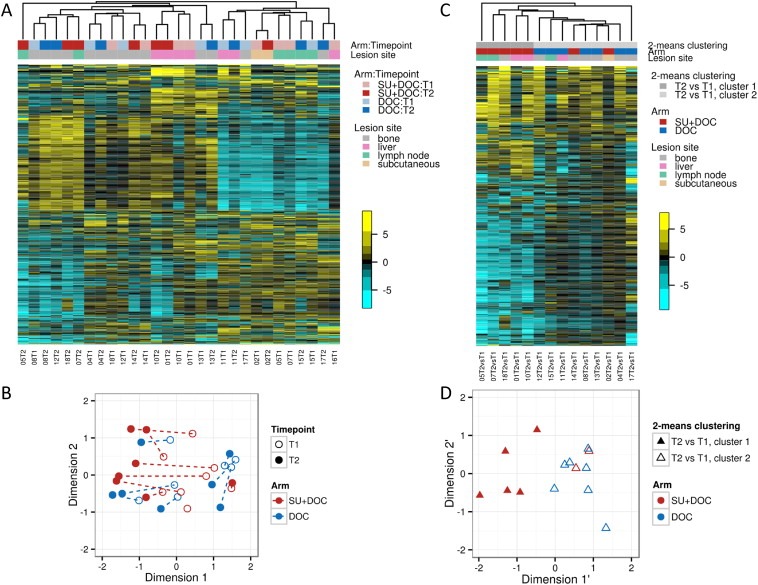
Unsupervised clustering of gene expression profiles. Cluster heatmap of gene expression (median centered by rows) for top 1000 most varying genes in all 29 samples (A), and corresponding multidimensional scaling plot where distances on the plot can be interpreted in terms of leading log2 fold change (B). The paired samples from the same patient are indicated by a dotted line. Cluster heatmap of change from baseline gene expression to day 14 for top 1000 most varying genes in all 14 paired samples (C), and corresponding multidimensional scaling plot (D). T1 = baseline; T2 = day 14; DOC = docetaxel, SU = sunitinib.
3.4. Unsupervised clustering of gene expression profiles
Unsupervised clustering of the 29 gene expression profiles (15 at T1 and 14 at T2) demonstrated a substantial inter‐patient variation and a strong tendency of paired samples from the same patient to cluster together – 5 of 7 in monotherapy and 2 of 7 in the combination arm (Figure 2A and 2B). Furthermore, a large distinct cluster of down‐regulated genes (upper right part of Figure 2A) was formed, overrepresented by genes related to immune response (gene to biological process ontology conditional hyper‐geometric test for overrepresentation, data not shown). Interestingly, also samples from the same metastatic site (liver, bone or lymph node) formed distinct clusters (Figure 2A). However, when intra‐patient change of gene expression from T1 to T2 was analyzed, patterns specific to therapy emerged, with more pronounced changes seen in the combination arm (Figure 2C and 2D). There was a significant agreement between treatment arm and the unsupervised 2‐means clustering based on change from T1 to T2 (p = 0.021, by Fisher's exact test). An explorative GSEA indicated that treatment led to up‐regulation of immune response related genes and down‐regulation of cell cycle related genes in both arms (Supplementary Table S3).
3.5. Treatment‐induced changes in hypoxia and proliferation
The effect of treatment in gene expression was further explored using the previously published hypoxia and PAM50‐proliferation metagenes. A decrease in both metagene scores from T1 to T2 was seen in the majority of cases (Figure 3). There was a high correlation between the hypoxia and proliferation metagene scores (Spearman's ρ = 0.929, p = 0.007 in the combination arm and ρ = 0.821, p = 0.034 in the monotherapy arm), despite that there is no overlap in the genes that comprise these signatures. The decrease in both hypoxia and proliferation scores was more pronounced in the combination arm (Figure 3).
Figure 3.
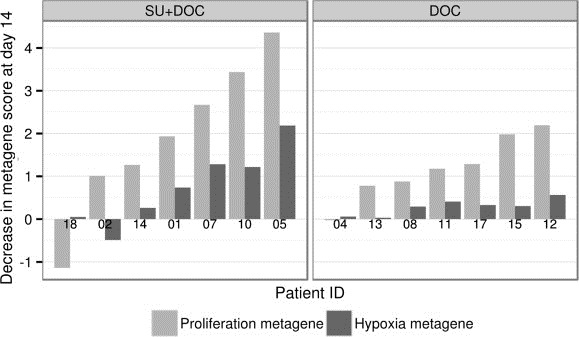
Treatment‐induced changes in the PAM50‐proliferation metagene and hypoxia metagene scores in the combination (SU + DOC) and monotherapy (DOC) arms. A decrease in metagene scores by one unit corresponds to a 2‐fold mean decrease in probe intensities from baseline to day 14. Patients are ordered on the x‐axis according to their decrease in PAM50‐proliferation metagene score.
3.6. FDG‐PET/CT and gene expression changes as early response markers
Variations in SUV and in hypoxia and proliferation metagenes from T1 to T2 were plotted against the changes of target lesions in CT scan at 6 weeks versus baseline, as assessed by RECIST (Figure 4). A significant correlation was observed between SUVmean and tumor size changes in the monotherapy arm, Spearman's ρ = 0.833, p = 0.008, but not in the combination arm ρ = −0.029, p = 1 (Figure 4A). Reductions in the hypoxia metagene score were highly correlated to OR in the combination arm, ρ = 1, p = 0.017, but not in the monotherapy arm, ρ = −0.029, p = 1 (Figure 4B). These findings remained essentially unchanged when OR was evaluated at 12 weeks (Supplementary Figure S3). Similar to hypoxia, the PAM50 proliferation metagene was well correlated to tumor changes merely in the combination arm at 6 and 12 weeks (ρ = 0.900, p = 0.083 and ρ = 1, p = 0.017 respectively, Supplementary Figure S3). Due to the small number of patients and the censoring of patients that stopped therapy without progressive disease, correlation between gene expression or SUV changes and PFS or overall survival could not be assessed.
Figure 4.
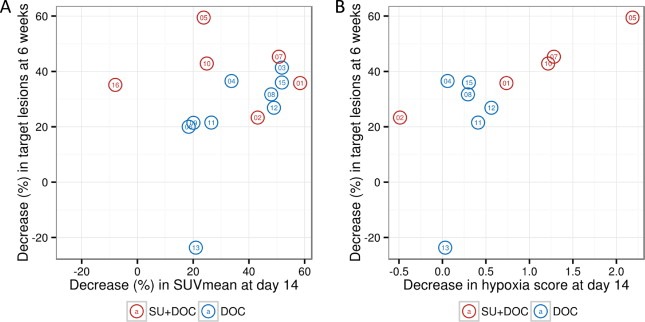
Treatment‐induced changes in SUVmean(A) and hypoxia metagene score (B) in relation to the objective response (OR) seen after 6 weeks of treatment by Computed Tomography scan (independent review by RECIST v 1.0) in the combination (SU‐DOC, red circles) and monotherapy (DOC, blue circles) arms. Patient ID is seen in the center of each circle; only patients with measurable disease are included in this analysis. A decrease in hypoxia metagene scores by one unit corresponds to a 2‐fold mean decrease in probe intensities from baseline to day 14. A high correlation is seen between SUVmean and OR in the DOC arm (Spearman's ρ = 0.833, P = 0.008) and between hypoxia metagene score and OR in the SU + DOC arm (Spearman's ρ = 1, P = 0.017).
4. Discussion
Despite the introduction of new drugs, MBC has a dismal prognosis (Foukakis et al., 2011). It is widely accepted that new therapeutic strategies and methods of drug development are needed in order to achieve a clinically meaningful improvement of survival in MBC, without compromising quality of life and with a sustainable cost of care (Jonsson and Bergh, 2012). Especially with novel targeted drugs, it is of utmost importance to personalize treatment and select patients in whom the target in question is active (Bergh, 2009).
To this direction, designing clinical trials with mandatory tissue biopsies is a promising approach. Previous data show high acceptance from patients, feasibility and safety of the procedure (Gomez‐Roca et al., 2012; Seah et al., 2013). Little is known however about the scientific and clinical usefulness of such methods, especially for high‐throughput molecular analysis such as gene expression profiling. To our knowledge, this is the first report of a clinical trial in MBC utilizing sequential, metastatic FNAB for gene expression analysis in combination with functional imaging. We demonstrate that this trial design is feasible and despite the small number of patients in this pilot study, can give high yields of information related to drug action and potential predictive biomarkers.
The use of sequential biopsies did not compromise the acceptance rate (85%), or safety as no complications were reported in the trial. In 82% of the cases representative and adequate material for gene expression profiling was obtained at both time points. The generated data were approved in comprehensive quality controls and dynamic changes in the relevant processes of cell proliferation and response to hypoxia highlight the biological validity of the gene expression data.
The intra‐individual longitudinal design facilitated the discovery of potential biomarkers and very robust correlations of both SUV and gene expression signatures with treatment effect were observed. Changes in hypoxia and proliferation metagene scores after 2 weeks of treatment were a strong predictor of the response documented at 6 and 12 weeks, exclusively in patients treated with sunitinib. This finding clearly demonstrates that in vivo observed changes in relevant biological pathways could be used as early response markers. Preliminary data show that in addition to efficacy, also safety outcomes may be predicted using this approach (Foukakis et al., 2014).
Decrease of SUVmean seen in FDG‐PET/CT after the first treatment cycle was highly indicative of response in patients treated with docetaxel, similar to findings in neoadjuvant treatment of breast cancer (Gebhart et al., 2013). Although PET did not add to the predictive information in the combination arm, its role in the proposed trial design should be further investigated, probably using tracers more specific to the drug in question. Whole‐body functional imaging could provide predictive information per se or complement biopsies by addressing the potential caveats of tumor heterogeneity and differential responses of metastatic lesions to therapy.
In summary, this pilot study is a proof of concept for a novel design of clinical trials, incorporating longitudinal metastatic biopsies and functional imaging. In contrast to classical trials investigating mean therapy effects in large groups of patients, the intra‐patient comparisons applied here give insights into drug action mechanisms and predictive biomarkers in individual patients. Application of this strategy in oncology drug development may lead to enrichment of trials with patients gaining more from treatment and drug efficacy being rapidly evaluated.
Funding
This work was supported by the Swedish Cancer Foundation, the Cancer Society in Stockholm, the Swedish Research Council, Breast Cancer Theme Center (BRECT) at Karolinska Institutet, the Stockholm County Council and an unrestricted research grant from Pfizer.
Disclosure of potential conflicts of interest
Jonas Bergh has received a research grant by Pfizer paid to Karolinska for conducting the study. The other authors disclosed no potential conflicts of interest.
Supporting information
The following are the supplementary data related to this article:
Supplementary data
Supplementary Figure S1RNA degradation curves stratified by time point and coloured by treatment arm before (A) and after (B) correction using the AffyRNADegradation package. DOC = docetaxel, SU = sunitinib.
Supplementary Figure S2Cluster heatmap of gene expression (median centered by rows) for top 1000 most varying genes in all arrays, including case number 10 analyzed by a different RNA amplification kit (NuGEN, Ovation Pico WTA System) and the same case with a baseline biopsy from a different liver metastasis. As the dendrogram demonstrates, the effect of treatment clearly has a much stronger effect on gene expression, while the effect of the amplification kit and the choice of lesion (in the same organ) have a weaker effect. Although this is only shown in a single case, it indicates that the biological and therapy predictive information is not affected by technical parameters (RNA amplification and choice of lesion for FNA biopsy).
Supplementary Figure S3Treatment‐induced changes in SUVmean (A) and hypoxia metagene score (B) in relation to the objective response (OR) seen after 12 weeks by Computed Tomography scan in the combination (SU‐DOC, red circles) and monotherapy (DOC, blue circles) arms (independent review by RECIST v 1.0). Correlations between the change in PAM50‐proliferation metagene score and OR at 6 weeks (C) and 12 weeks (D) are also illustrated. Patient ID is seen in the center of each circle, only patients with measurable disease are included in this analysis.
Supplementary data
Supplementary data
Supplementary data
Acknowledgments
We thank all patients for participating in the study.
Supplementary data 1.
1.1.
Supplementary data related to this article can be found at http://dx.doi.org/10.1016/j.molonc.2015.03.011.
Foukakis Theodoros, Lövrot John, Sandqvist Patricia, Xie Hanjing, Lindström Linda S., Giorgetti Carla, Jacobsson Hans, Hedayati Elham, Bergh Jonas, (2015), Gene expression profiling of sequential metastatic biopsies for biomarker discovery in breast cancer, Molecular Oncology, 9, doi: 10.1016/j.molonc.2015.03.011.
References
- Abrams, T.J. , Lee, L.B. , Murray, L.J. , Pryer, N.K. , Cherrington, J.M. , 2003. SU11248 inhibits KIT and platelet-derived growth factor receptor beta in preclinical models of human small cell lung cancer. Mol. Cancer Ther. 2, 471–478. [PubMed] [Google Scholar]
- Amir, E. , Miller, N. , Geddie, W. , Freedman, O. , Kassam, F. , Simmons, C. , Oldfield, M. , Dranitsaris, G. , Tomlinson, G. , Laupacis, A. , Tannock, I.F. , Clemons, M. , 2012. Prospective study evaluating the impact of tissue confirmation of metastatic disease in patients with breast Cancer. J. Clin. Oncol. 30, 587–592. [DOI] [PMC free article] [PubMed] [Google Scholar]
- Bergh, J. , 2009. Quo vadis with targeted drugs in the 21st century?. J. Clin. Oncol. 27, 2–5. [DOI] [PubMed] [Google Scholar]
- Bergh, J. , Bondarenko, I.M. , Lichinitser, M.R. , Liljegren, A. , Greil, R. , Voytko, N.L. , Makhson, A.N. , Cortes, J. , Lortholary, A. , Bischoff, J. , Chan, A. , Delaloge, S. , Huang, X. , Kern, K.A. , Giorgetti, C. , 2012. First-line treatment of advanced breast Cancer with sunitinib in combination with docetaxel versus docetaxel alone: results of a prospective, randomized phase III study. J. Clin. Oncol. 30, 921–929. [DOI] [PubMed] [Google Scholar]
- Bidard, F.C. , Fehm, T. , Ignatiadis, M. , Smerage, J.B. , Alix-Panabieres, C. , Janni, W. , Messina, C. , Paoletti, C. , Muller, V. , Hayes, D.F. , Piccart, M. , Pierga, J.Y. , 2013. Clinical application of circulating tumor cells in breast cancer: overview of the current interventional trials. Cancer Metastasis Rev. 32, 179–188. [DOI] [PMC free article] [PubMed] [Google Scholar]
- Botteri, E. , Disalvatore, D. , Curigliano, G. , Brollo, J. , Bagnardi, V. , Viale, G. , Orsi, F. , Goldhirsch, A. , Rotmensz, N. , 2012. Biopsy of liver metastasis for women with breast cancer: impact on survival. Breast 21, 284–288. [DOI] [PubMed] [Google Scholar]
- Buffa, F.M. , Harris, A.L. , West, C.M. , Miller, C.J. , 2010. Large meta-analysis of multiple cancers reveals a common, compact and highly prognostic hypoxia metagene. Br. J. Cancer 102, 428–435. [DOI] [PMC free article] [PubMed] [Google Scholar]
- Burstein, H.J. , Elias, A.D. , Rugo, H.S. , Cobleigh, M.A. , Wolff, A.C. , Eisenberg, P.D. , Lehman, M. , Adams, B.J. , Bello, C.L. , DePrimo, S.E. , Baum, C.M. , Miller, K.D. , 2008. Phase II study of sunitinib malate, an oral multitargeted tyrosine kinase inhibitor, in patients with metastatic breast Cancer previously treated with an anthracycline and a taxane. J. Clin. Oncol. 26, 1810–1816. [DOI] [PubMed] [Google Scholar]
- Cachin, F. , Prince, H.M. , Hogg, A. , Ware, R.E. , Hicks, R.J. , 2006. Powerful prognostic stratification by [18F]fluorodeoxyglucose positron emission tomography in patients with metastatic breast cancer treated with high-dose chemotherapy. J. Clin. Oncol. 24, 3026–3031. [DOI] [PubMed] [Google Scholar]
- Dawson, S.J. , Tsui, D.W. , Murtaza, M. , Biggs, H. , Rueda, O.M. , Chin, S.F. , Dunning, M.J. , Gale, D. , Forshew, T. , Mahler-Araujo, B. , Rajan, S. , Humphray, S. , Becq, J. , Halsall, D. , Wallis, M. , Bentley, D. , Caldas, C. , Rosenfeld, N. , 2013. Analysis of circulating tumor DNA to monitor metastatic breast cancer. N. Engl. J. Med. 368, 1199–1209. [DOI] [PubMed] [Google Scholar]
- De Giorgi, U. , Valero, V. , Rohren, E. , Dawood, S. , Ueno, N.T. , Miller, M.C. , Doyle, G.V. , Jackson, S. , Andreopoulou, E. , Handy, B.C. , Reuben, J.M. , Fritsche, H.A. , Macapinlac, H.A. , Hortobagyi, G.N. , Cristofanilli, M. , 2009. Circulating tumor cells and [18F]fluorodeoxyglucose positron emission tomography/computed tomography for outcome prediction in metastatic breast cancer. J. Clin. Oncol. 27, 3303–3311. [DOI] [PubMed] [Google Scholar]
- Dose Schwarz, J. , Bader, M. , Jenicke, L. , Hemminger, G. , Janicke, F. , Avril, N. , 2005. Early prediction of response to chemotherapy in metastatic breast cancer using sequential 18F-FDG PET. J. Nucl. Med. 46, 1144–1150. [PubMed] [Google Scholar]
- Egyházi, S. , B, J. , Skoog, L. , Huang, F. , Borg, A.L. , Frostvik Stolt, M. , Hägerström, T. , Ringborg, U. , Bergh, J. , 2004. Proteinase K added to the extraction procedure markedly increases RNA yield from primary breast tumors for use in microarray studies. Clin. Chem. 50, 975–976. [DOI] [PubMed] [Google Scholar]
- Fasold, M. , Binder, H. , 2013. AffyRNADegradation: control and correction of RNA quality effects in GeneChip expression data. Bioinformatics 29, 129–131. [DOI] [PMC free article] [PubMed] [Google Scholar]
- Foukakis, T. , Astrom, G. , Lindstrom, L. , Hatschek, T. , Bergh, J. , 2012. When to order a biopsy to characterise a metastatic relapse in breast cancer. Ann. Oncol. 23, (Suppl. 10) x349–353. [DOI] [PubMed] [Google Scholar]
- Foukakis, T. , Fornander, T. , Lekberg, T. , Hellborg, H. , Adolfsson, J. , Bergh, J. , 2011. Age-specific trends of survival in metastatic breast cancer: 26 years longitudinal data from a population-based cancer registry in Stockholm, Sweden. Breast Cancer Res. Treat. 1–8. [DOI] [PubMed] [Google Scholar]
- Foukakis, T. , Lovrot, J. , Bergh, J. , 2014. Thyroid hormone inactivation in gastrointestinal stromal tumors. N. Engl. J. Med. 371, 84–85. [DOI] [PubMed] [Google Scholar]
- Gautier, L. , Cope, L. , Bolstad, B.M. , Irizarry, R.A. , 2004. affy–analysis of affymetrix GeneChip data at the probe level. Bioinformatics 20, 307–315. [DOI] [PubMed] [Google Scholar]
- Gebhart, G. , Gamez, C. , Holmes, E. , Robles, J. , Garcia, C. , Cortes, M. , de Azambuja, E. , Fauria, K. , Van Dooren, V. , Aktan, G. , Coccia-Portugal, M.A. , Kim, S.B. , Vuylsteke, P. , Cure, H. , Eidtmann, H. , Baselga, J. , Piccart, M. , Flamen, P. , Di Cosimo, S. , 2013. 18F-FDG PET/CT for early prediction of response to neoadjuvant lapatinib, trastuzumab, and their combination in HER2-positive breast Cancer: results from neo-ALTTO. J. Nucl. Med. 54, 1862–1868. [DOI] [PubMed] [Google Scholar]
- Gomez-Roca, C.A. , Lacroix, L. , Massard, C. , De Baere, T. , Deschamps, F. , Pramod, R. , Bahleda, R. , Deutsch, E. , Bourgier, C. , Angevin, E. , Lazar, V. , Ribrag, V. , Koscielny, S. , Chami, L. , Lassau, N. , Dromain, C. , Robert, C. , Routier, E. , Armand, J.P. , Soria, J.C. , 2012. Sequential research-related biopsies in phase I trials: acceptance, feasibility and safety. Ann. Oncol. 23, 1301–1306. [DOI] [PubMed] [Google Scholar]
- Jonsson, B. , Bergh, J. , 2012. Hurdles in anticancer drug development from a regulatory perspective. Nat. Rev. Clin. Oncol. 9, 236–243. [DOI] [PubMed] [Google Scholar]
- Kauffmann, A. , Gentleman, R. , Huber, W. , 2009. arrayQualityMetrics–a bioconductor package for quality assessment of microarray data. Bioinformatics 25, 415–416. [DOI] [PMC free article] [PubMed] [Google Scholar]
- Lindstrom, L.S. , Karlsson, E. , Wilking, U.M. , Johansson, U. , Hartman, J. , Lidbrink, E.K. , Hatschek, T. , Skoog, L. , Bergh, J. , 2012. Clinically used breast cancer markers such as estrogen receptor, progesterone receptor, and human epidermal growth factor receptor 2 are unstable throughout tumor progression. J. Clin. Oncol. 30, 2601–2608. [DOI] [PubMed] [Google Scholar]
- Moore, H.M. , Kelly, A.B. , Jewell, S.D. , McShane, L.M. , Clark, D.P. , Greenspan, R. , Hayes, D.F. , Hainaut, P. , Kim, P. , Mansfield, E.A. , Potapova, O. , Riegman, P. , Rubinstein, Y. , Seijo, E. , Somiari, S. , Watson, P. , Weier, H.U. , Zhu, C. , Vaught, J. , 2011. Biospecimen reporting for improved study quality (BRISQ). Cancer Cytopathol. 119, 92–101. [DOI] [PubMed] [Google Scholar]
- Nielsen, T.O. , Parker, J.S. , Leung, S. , Voduc, D. , Ebbert, M. , Vickery, T. , Davies, S.R. , Snider, J. , Stijleman, I.J. , Reed, J. , Cheang, M.C. , Mardis, E.R. , Perou, C.M. , Bernard, P.S. , Ellis, M.J. , 2010. A comparison of PAM50 intrinsic subtyping with immunohistochemistry and clinical prognostic factors in tamoxifen-treated estrogen receptor-positive breast cancer. Clin. Cancer Res. 16, 5222–5232. [DOI] [PMC free article] [PubMed] [Google Scholar]
- O'Farrell, A.M. , Abrams, T.J. , Yuen, H.A. , Ngai, T.J. , Louie, S.G. , Yee, K.W. , Wong, L.M. , Hong, W. , Lee, L.B. , Town, A. , Smolich, B.D. , Manning, W.C. , Murray, L.J. , Heinrich, M.C. , Cherrington, J.M. , 2003. SU11248 is a novel FLT3 tyrosine kinase inhibitor with potent activity in vitro and in vivo. Blood 101, 3597–3605. [DOI] [PubMed] [Google Scholar]
- Prat, A. , Ellis, M.J. , Perou, C.M. , 2012. Practical implications of gene-expression-based assays for breast oncologists. Nat. Rev. Clin. Oncol. 9, 48–57. [DOI] [PMC free article] [PubMed] [Google Scholar]
- Seah, D.S. , Scott, S.M. , Najita, J. , Openshaw, T. , Krag, K. , Frank, E. , Sohl, J. , Stadler, Z.K. , Garrett, M. , Silverman, S.G. , Peppercorn, J. , Winer, E.P. , Come, S.E. , Lin, N.U. , 2013. Attitudes of patients with metastatic breast cancer toward research biopsies. Ann. Oncol. 24, 1853–1859. [DOI] [PubMed] [Google Scholar]
- Subramanian, A. , Tamayo, P. , Mootha, V.K. , Mukherjee, S. , Ebert, B.L. , Gillette, M.A. , Paulovich, A. , Pomeroy, S.L. , Golub, T.R. , Lander, E.S. , Mesirov, J.P. , 2005. Gene set enrichment analysis: a knowledge-based approach for interpreting genome-wide expression profiles. Proc. Natl. Acad. Sci. U S A 102, 15545–15550. [DOI] [PMC free article] [PubMed] [Google Scholar]
- Thompson, A.M. , Jordan, L.B. , Quinlan, P. , Anderson, E. , Skene, A. , Dewar, J.A. , Purdie, C.A. , 2010. Prospective comparison of switches in biomarker status between primary and recurrent breast cancer: the breast recurrence in tissues study (BRITS). Breast Cancer Res. 12, R92 [DOI] [PMC free article] [PubMed] [Google Scholar]
Associated Data
This section collects any data citations, data availability statements, or supplementary materials included in this article.
Supplementary Materials
The following are the supplementary data related to this article:
Supplementary data
Supplementary Figure S1RNA degradation curves stratified by time point and coloured by treatment arm before (A) and after (B) correction using the AffyRNADegradation package. DOC = docetaxel, SU = sunitinib.
Supplementary Figure S2Cluster heatmap of gene expression (median centered by rows) for top 1000 most varying genes in all arrays, including case number 10 analyzed by a different RNA amplification kit (NuGEN, Ovation Pico WTA System) and the same case with a baseline biopsy from a different liver metastasis. As the dendrogram demonstrates, the effect of treatment clearly has a much stronger effect on gene expression, while the effect of the amplification kit and the choice of lesion (in the same organ) have a weaker effect. Although this is only shown in a single case, it indicates that the biological and therapy predictive information is not affected by technical parameters (RNA amplification and choice of lesion for FNA biopsy).
Supplementary Figure S3Treatment‐induced changes in SUVmean (A) and hypoxia metagene score (B) in relation to the objective response (OR) seen after 12 weeks by Computed Tomography scan in the combination (SU‐DOC, red circles) and monotherapy (DOC, blue circles) arms (independent review by RECIST v 1.0). Correlations between the change in PAM50‐proliferation metagene score and OR at 6 weeks (C) and 12 weeks (D) are also illustrated. Patient ID is seen in the center of each circle, only patients with measurable disease are included in this analysis.
Supplementary data
Supplementary data
Supplementary data