

Abstract
Malignant gliomas represent the most devastating group of brain tumors in adults, among which glioblastoma multiforme (GBM) exhibits the highest malignancy rate. Despite combined modality treatment, GBM recurs and is invariably fatal. A further insight into the molecular background of gliomagenesis is required to improve patient outcomes. The primary aim of this study was to gain broad information on the miRNA expression pattern in malignant gliomas, mainly GBM. We investigated the global miRNA profile of malignant glioma tissues with miRNA microarrays, deep sequencing and meta‐analysis. We selected miRNAs that were most frequently deregulated in glioblastoma tissues, as well as in peritumoral areas, in comparison with normal human brain. We identified candidate miRNAs associated with the progression from glioma grade III to glioma grade IV. The meta‐analysis of miRNA profiling studies in GBM tissues summarizes the past and recent advances in the investigation of the miRNA signature in GBM versus noncancerous human brain and provides a comprehensive overview. We propose a list of 35 miRNAs whose expression is most frequently deregulated in GBM patients and of 30 miRNA candidates recognized as novel GBM biomarkers.
Keywords: Brain tumors, Glioblastoma, Gliomas, Meta-Analysis, microRNA, miRNA profiling
Highlights
Using microarrays and deep sequencing to characterize miRNAs in glioma tissues.
Meta‐analysis provided a panel of 35 glioblastoma‐related miRNAs.
30 novel miRNA biomarkers of glioblastoma were identified.
25 candidate miRNAs associated with malignant glioma progression are reported.
The resulting miRNA list provide potential therapeutic targets for glioblastoma.
1. Introduction
Malignant gliomas are the most common and aggressive primary brain tumors in adults. WHO grade IV glioblastoma multiforme (GBM) is the most frequent type and is characterized by strong vascular proliferation, invasiveness, diminished apoptosis, radio‐ and chemoresistance. Despite treatment, the median survival of GBM patients is approximately 12 months from diagnosis (Cheng et al., 2010; Stupp et al., 2005).
Treatment of GBM remains one of the most challenging tasks in clinical oncology. It is the consequence of its highly invasive nature and of its extensive heterogeneity at the cellular and molecular levels (Bonavia et al., 2011). Recently, large‐scale analysis of GBM tissues carried out within The Cancer Genome Atlas Research project confirmed an enormous complexity of epigenetic and genetic alterations in GBM. Drivers of glioblastoma initiation, progression and therapeutic resistance have been attributed to changes in the tumor metabolism and microenvironment, activation of stem pathways, epi‐ and genetic alterations including somatic mutations, copy number variations, genomic gains and losses and transcriptional rearrangements (Brennan et al., 2013; Schonberg et al., 2013). Currently, it seems to be very unlikely to distinguish a single genetic or cellular event that can effectively be targeted for all patients. Future therapies may require some individualization according to each patient's tumor genotype profile or glioblastoma molecular subtype (Purow and Schiff, 2009; Verhaak et al., 2010).
Recently, it has become evident that microRNAs (miRNAs) play a crucial role in the regulation of gene expression both in normal and cancer cells. miRNAs are a class of naturally occurring, small (20–23 nt) non‐coding RNAs that target mRNAs at the posttranscriptional level. At sites with extensive pairing complementarity, metazoan miRNAs can direct Argonaute‐catalyzed mRNA cleavage or, more frequently, direct translational repression, mRNA destabilization or a combination of the two. Animal miRNAs bind their target sites mostly in the 3′ untranslated region (3′‐UTR) of mRNA transcripts, but an increasing amount of evidence has confirmed many functional miRNA target sites located in protein coding regions of mammalian transcripts as well (Fang and Rajewsky, 2011; Gu et al., 2013). It is assumed that miRNAs are involved in the regulation of approximately 60% of all protein‐coding genes in mammals (Friedman et al., 2009). A single miRNA can be involved in the regulation of many target RNAs and thus modulate multiple pathways. This class of non‐coding RNAs is perceived as a group of crucial regulators of virtually all cellular processes, including proliferation, differentiation, apoptosis and growth. miRNAs can function either as tumor promoters (oncogenic miRNAs or ‘oncomirs’) or as tumor suppressors, and contribute to carcinogenesis. They are considered to be potentially useful targets or tools for therapeutic applications, as well as promising biomarkers of human cancers (Di Leva et al., 2014; Iorio and Croce, 2012). Alterations in the specific miRNA expression profile have been identified in a number of cancers, including gliomas. To date, several miRNA profiling studies of GBM tissues based on microarrays, PCR arrays and deep sequencing have been published (Ciafre et al., 2005; Dong et al., 2010; Hua et al., 2012; Lang et al., 2012; Rao et al., 2010; Skalsky and Cullen, 2011). A combined analysis of the mRNA and miRNA expression profiling signature has been used to identify five GBM subclasses with concordant miRNA and mRNA expression patterns corresponding to each major stage of neural stem cell differentiation (Kim et al., 2011). Integration of miRNA and mRNA signature data is an emerging potent tool for revealing subtype‐specific regulators of differential expression in GBM (Setty et al., 2012).
We aimed here to gain broad information on the miRNA expression pattern in malignant gliomas based on microarray and deep sequencing approaches. We compared global miRNA expression in adult malignant gliomas (mainly glioblastoma), tumor margin and non‐tumor brain tissues. Furthermore, we sought to identify miRNAs that can be associated with glioma progression by investigating the miRNA expression patterns in glioma specimens of WHO grade III and IV.
The other objective was to perform a meta‐analysis of miRNA profiling studies in GBM tissues. We found out that over 290 miRNAs have been reported to be deregulated in GBM tissues in comparison to normal human brain, out of which we selected a set of 35 miRNAs that are most frequently deregulated in glioma patients worldwide. Finally, we propose 30 potentially novel miRNA biomarkers of glioblastoma. To our knowledge, the meta‐analysis of miRNA expression in glioblastoma has not been reported previously. Such an integrative approach is crucial for the identification of glioma‐specific miRNAs that demonstrate a potential to develop miRNA‐based therapies or new diagnostic applications.
2. Material and methods
2.1. Tissue collection
Malignant glioma tissues and adjacent peritumoral brain tissues (glioma borders) were obtained at the time of surgery from 20 patients operated in the Department of Neurosurgery and Neurotraumatology of the Poznan University of Medical Sciences, Poland between 2010 and 2011. Tissues were flash frozen after surgery. Prior to the procedure, donors' consent and approval from the Bioethics Council of the Poznan University of Medical Sciences had been obtained.
Total RNA from normal human brain was obtained commercially (FirstChoice® Human Brain Reference RNA, Ambion). According to the manufacturer's information, this RNA sample was pooled from multiple, healthy donors and several brain regions. Additional array data on miRNA expression in three normal, postmortem brain tissues had been published previously (Hu et al., 2011) and deposited in the Gene Expression Omnibus (GEO) database. The miRNA expression array data was downloaded from GEO datasets GSM652746, GSM652747, GSM652748. It was obtained from total RNA isolated from postmortem superior frontal gyrus and analyzed using Agilent Human miRNA Microarrays (G4471A, Agilent Technologies).
2.2. RNA isolation and quantification
Total RNA from frozen glioma and peritumoral brain tissues was extracted using a standard Trizol (Invitrogen) method, according to the manufacturer's protocol. RNA samples were treated with DNase I using DNA‐free DNase Treatment and Removal Reagent (Ambion). RNA was quantified and assessed using Agilent 2100 Bioanalyzer and RNA 6000 Nano Kit (Agilent Technologies). Only samples with RNA integrity over 8 were used for further studies.
2.3. MicroRNA microarrays
100 ng of each RNA sample were hybridized to Agilent Human microRNA Microarrays 14.0, 8 × 15 K (G4471A, Agilent Technologies). MicroRNA labeling, microarray hybridization and washing, as well as data generation were performed at Warsaw University of Life Sciences, following standard Agilent's instructions. Agilent miRNA assays used in this study contained eight 15 K microarrays on a single glass slide, each including probes for 866 human and 89 human viral miRNAs from the Sanger miRbase v14.0. The GeneSpring GX 9 software (Agilent Technologies) was used for value extraction. Prior to analysis, non‐specific filtering was done to remove probes and samples with an excessive number of missing values. Probes with missing signal in at least 60% of the samples were removed, then samples in which the signal was missing in at least half of the probes were also removed. This reduced the number of probes from initial 871 to 303 and the number of samples to 20. Then the data was median‐centered.
The raw probe data from human gliomas (20 samples) was simultaneously analyzed with 3 datasets on miRNA expression in normal human brain (GEO GSM652746, GSM652747, GSM652748). The analysis of differential expression was performed with linear methods for microarrays using R/Bioconductor limma package. We used Benjamini–Hochberg (FDR) multiple testing adjustment. Probes declared as differentially expressed realized adjusted p‐values below 0.05. All original microarray data is deposited in the NCBI GEO database [GSE61710].
2.4. Deep sequencing analysis
Sequencing has been carried out on SOLiD V4 instrument by Sequomics Biotechnology Ltd., Szeged, Hungary.
2.4.1. Library preparation for small RNA sequencing
Library preparation for small RNA sequencing was performed using Applied Biosystems Incorporated's (ABI) small RNA sequencing protocol and the SOLiD V4 System. Total RNA was subjected to miRNA enrichment using PureLink miRNA Isolation Kit (Invitrogen). The samples containing small RNAs were converted into cDNA libraries using SOLiD™ Small RNA Expression Kit (ABI). Briefly, after hybridization and ligation to the adaptor mix, the samples were reverse transcribed to generate cDNAs. The cDNA libraries were amplified through 18 cycles of PCR using one of the supplied primer sets containing 6‐nt‐long sequence‐specific barcodes. The individual libraries of PCR products, containing cDNAs with barcodes, were purified and size‐selected in the range of 60–80 nt by electrophoresis on 10% (w/v) TBE‐Urea polyacrylamide gels. The individual cDNA libraries were quantitated and titrated for emulsion PCR, which was carried out according to SOLiD™ 4 System Templated Bead Preparation Protocol. From the small RNA sequencing, 36‐nt‐long sequencing reads were obtained.
2.4.2. Pre‐processing and mapping of the sequencing reads
From the raw sequencing reads, 3′ adapter sequences were removed using the cutadapt software [http://journal.embnet.org/index.php/embnetjournal/article/view/200]. Next, cleaned reads were aligned to the human genome (hg19 assembly) in color space using the SHRIMP2 software, version 2.2.3 (David et al., 2011). The alignment mode was set to local and the default set of options optimized for miRNA mapping (“mirna” mode) was used. The score threshold was set to 80% of the best possible match for a given read and only the best strata of hits were reported. The resulting SAM files were processed using the in‐house perl scripts in order to extract the read regions aligning to the human genome, excluding the non‐aligning ends. Then, sequences were collapsed to unique representatives with the occurrence count. The process was repeated for all libraries separately.
2.4.3. miRNA prediction and expression profiling
For prediction of novel miRNA species, we employed the miRDeep2 software, version 2.0.0.5 (Friedlander et al., 2012). In order to increase the predictive power of the method, we used the collapsed reads from all libraries as an input for a single analysis. The minimum read stack was set to 20. Next, the sequences of mature predicted putative miRNAs and their precursors were extracted and complemented by known miRNAs from miRBase (rel. 19). Such a complete set was used as a reference for expression profiling using the miRDeep2 quantifier.pl script. The candidates with miRDeep2 score higher than 4 or with seed region identical to known mouse miRNAs, together with a read count from all libraries higher than 100, were selected for further analyses. The miRDeep2 score cut‐off was chosen based on the distribution of the calculated false positive predictions.
Statistica Software, 1998 Edition, was used for the statistical analysis of miRNA differential expression. Analysis of variance (ANOVA) was used to determine the significance of the difference between means and the Tukey's test was used for pairwise comparisons, in which p ≤ 0.05 was considered as statistically significant.
2.5. Functional analysis with IPA
The selected miRNAs were analyzed to identify the networks and pathways. For this purpose, we used Ingenuity Pathway Analysis software (IPA, Ingenuity® Systems; http://www.ingenuity.com). A core analysis was employed to identify the most relevant miRNA targets, canonical pathways, biological functions and physiological processes from the interactions reported in the IPA database.
2.6. Meta‐analysis: identification and selection of relevant studies
PubMed was used to search for glioblastoma/gliomas miRNA expression profiling studies published up to January 2014. The database was searched by means of the MeSH terms: ‘glioblastoma’, ‘GBM’, ‘gliomas’ and ‘malignant gliomas’ in combination with ‘miRNA’ and ‘microRNA’. Potentially associated publications were assessed by looking through their abstracts and the most relevant publications were subjected to closer examination. Eligible studies had to meet the following criteria: (i) they were miRNA expression profiling studies in malignant glioma/glioblastoma patients, (ii) they used tissue samples obtained from surgically resected glial tumors and corresponding noncancerous or normal tissues for comparison and differential expression analysis, and (iii) the validation method and validation sample set were reported. Accordingly, studies were excluded based on the following criteria: (i) they were not conducted on human samples, (ii) they lacked normal or noncancerous tissue as a reference in comparison analysis, and (iii) they were review articles or profiling studies in the serum, cerebrospinal fluid or glioma cell lines.
2.6.1. Data extraction
From the full text and corresponding supplement information, the following items were collected for each study: author, journal and year of publication, location of the study, selection and characteristics of tumor and non‐tumor samples used in the study, platform of miRNA profiling, cut‐off criteria for differentially expressed (DE) miRNAs and for the list of up‐ and downregulated miRNA features and their corresponding fold change, if available. The extraction was performed by two reviewers independently. The differentially expressed miRNAs were ranked according to the number of the studies that consistently reported the miRNA as DE and with a consistent direction of change.
3. Results
3.1. MicroRNA expression pattern in malignant glioma tissues
Using miRNA microarrays, we investigated the miRNA expression pattern in malignant glioma tissues, tumor margins (adjacent peritumoral brain tissues) and normal human brain. For the latter, we used commercially available brain total RNA from multiple, healthy donors and postmortem non‐neoplastic brains. A brief characterization of tumor samples is presented in Supporting Information Table S1. By differential expression (DE) analysis with normal human brain, we sought to determine the miRNA signature both in glioblastoma tissues and in peritumoral tissues. Specifically, normal‐versus‐peritumoral comparison was conducted to identify those miRNAs that could be associated with glioblastoma tumor cell infiltration.
DE analysis revealed distinct expression patterns of miRNAs in tumors and normal brain samples, whereas borders of tumors did not constitute a separate cluster (Figure 1A and B). We observed a significant change in the expression of 97 miRNAs derived from tumor tissues in comparison to normal human brain, including 56 up‐regulated and 41 down‐regulated miRNAs, respectively (Supporting Information Tables S2 and S3 and Figure 1A). The comparison of adjacent peritumoral tissues with normal brain samples revealed 6 miRNAs with elevated expression and 16 miRNAs down‐regulated within the borders of tumors (Supporting Information Tables S4 and S5 and Figure 1B). Twenty one out of 22 miRNAs identified in borders of gliomas were also found in GBMs (Figure 1C). The group of miRNAs that were similarly deregulated both in tumor and peritumoral tissues included: up‐regulated miR‐21, miR‐630, miR‐155, miR‐1260, miR‐542‐5p, miR‐142‐5p and down‐regulated miR‐137, miR‐124, miR‐129‐3p, miR‐769‐5p, miR‐132, miR‐128, miR‐7, miR‐410, miR‐136, miR‐153, miR‐323‐3p, miR‐330‐3p, miR‐598, among others. Only miR‐625 was exclusively identified within the borders of tumors in comparison to normal brain, but did not turn out to be significantly deregulated in tumors.
Figure 1.
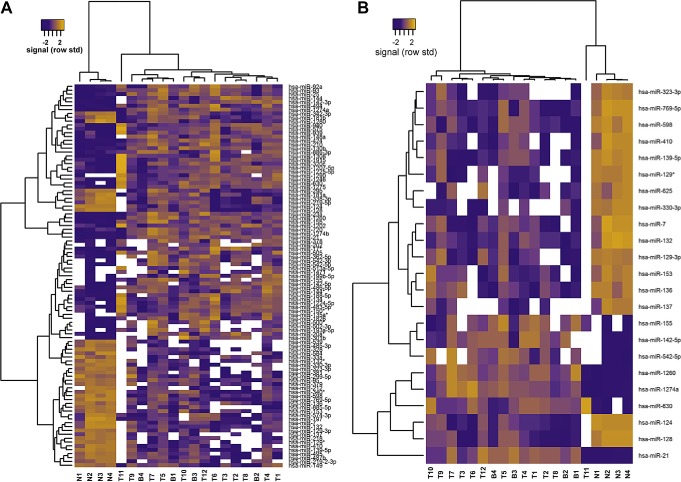
Microarray analysis of miRNA expression in GBM tissues and normal human brain. (A) Heat map of the clustered miRNAs that showed significantly different expression in GBM tissues when compared to normal human brain. miRNAs in orange showed strong signal intensity (increased expression), while those in navy blue showed low signal (decreased expression). White – lack of signal (no expression). (B) Heat map displaying the expression of miRNAs that showed distinct profile in the border of glioma in comparison to normal human brain. (C) Venn diagram illustrating the relationships between sets of differentially expressed miRNAs in GBM tissues and borders of tumor in comparison with normal brain. Circles include the total number of differentially expressed miRNAs in the direct pairwise comparison indicated. Intersection area corresponds to the number of differentially expressed miRNAs shared between each comparison. For each group, miRNAs up‐regulated (indicated in red) and down‐regulated (indicated in green) are listed in tables below the diagram. T – glioma tumor tissue; B – border of glioma tissue; N – normal human brain tissue.
Figure 1.

(Continued)
To test whether the discovered glioblastoma‐specific up‐ and down‐regulated miRNAs were known to be associated with other human pathologies, we used the miR2Disease (Jiang et al., 2009) and miRBase databases (Supporting Information Tables S2 and S3). An inspection of the current version of miRBase showed that some entries conflict with other ncRNAs, in particular snoRNAs and tRNA. When it came to our analysis, miR‐720, miR‐1274a, miR‐1308, miR‐1826 and miR‐1280 were recognized as misannotated. Mir2Disease inspection revealed that miR‐155, miR‐21, miR‐210 and miR‐93 were the most widely identified as up‐regulated in human cancers. It is interesting to note that from the group of miRNAs down‐regulated in GBM, miR‐381, miR‐379 and miR‐299‐5p, appeared to be consistently up‐regulated in a spectrum of primary muscular disorders, including Duchenne muscular dystrophy, myopathies, nemaline myopathy and dermatomyositis.
3.2. Small RNA deep sequencing
Since miRNA pattern may change during malignant glioma progression, we sought to test the miRNA profiles at different stages of glioma malignancy. Therefore, we used SOLiD sequencing‐based miRNA expression profiling to identify the most abundant miRNAs in malignant glioma of WHO grade III and IV (glioblastoma multiforme) and we performed differential expression analysis. Totally, over 19,257 million effective reads were obtained from 4 libraries analyzed (Supporting Information Table S6). After filtration to eliminate rRNA, tRNA, snRNA and snoRNA sequences, the remaining effective reads were mapped to miRBase release 19. The stringency of miRNA detection was lowered to cut‐off of 100 counts across the four libraries. The matches corresponded to 489 of the known miRNAs deposited in miRBase release 19 (Supporting Information Table S7). The 20 most abundant miRNAs that were identified in our study are shown in Table 1. They represent as much as 61.7% of all sequence reads and over 76% of sequence reads mapped to known, previously described miRNAs.
Table 1.
The 20 most abundant previously described (known) miRNAs identified by deep sequencing in human malignant gliomas.
| miRNA | Precursor | Total read count | Normalized read count | |
|---|---|---|---|---|
| Grade III gliomas | GBMs | |||
| hsa‐miR‐125b‐5p | hsa‐mir‐125b‐2 | 2,008,335 | 177,226.45 | 242,728.45 |
| hsa‐mir‐125b‐1 | 2,007,077 | 177,041.15 | 242,599.21 | |
| hsa‐miR‐99a‐5p | hsa‐mir‐99a | 1,040,918 | 71,135.01 | 154,730.79 |
| hsa‐miR‐451a | hsa‐mir‐451a | 552,324 | 100,052.15 | 70,508.54 |
| hsa‐miR‐103a‐3p | hsa‐mir‐103a‐1 | 534,548 | 86,624.95 | 72,131.67 |
| hsa‐mir‐103a‐2 | 534,548 | 86,624.95 | 72,131.67 | |
| hsa‐miR‐19b‐3p | hsa‐mir‐19b‐1 | 461,047 | 80,630.91 | 23,957.86 |
| hsa‐mir‐19b‐2 | 461,020 | 80,626.27 | 23,955.88 | |
| hsa‐miR‐29a‐3p | hsa‐mir‐29a | 381,145 | 43,837.64 | 40,508.29 |
| hsa‐miR‐125a‐5p | hsa‐mir‐125a | 298,623 | 28,204.25 | 43,594.2 |
| hsa‐miR‐29b‐3p | hsa‐mir‐29b‐2 | 237,207 | 31,159.77 | 30,681.86 |
| hsa‐mir‐29b‐1 | 237,195 | 31,159.67 | 30,680.47 | |
| hsa‐miR‐100‐5p | hsa‐mir‐100 | 221,756 | 20,710.51 | 29,609.34 |
| hsa‐miR‐126‐3p | hsa‐mir‐126 | 186,172 | 47,641.26 | 26,853.13 |
| hsa‐miR‐16‐5p | hsa‐mir‐16‐2 | 182,474 | 26,216.76 | 21,232.44 |
| hsa‐mir‐16‐2 | 182,402 | 26,201.53 | 21,231.33 | |
| hsa‐miR‐7a‐5p | hsa‐mir‐7a‐1 | 171,475 | 30,115.35 | 19,392.73 |
| hsa‐mir‐7a‐3 | 171,279 | 30,092.49 | 19,391.49 | |
| hsa‐mir‐7a‐2 | 171,276 | 30,086.79 | 19,389.27 | |
| hsa‐miR‐24‐3p | hsa‐mir‐24‐1 | 159,925 | 27,419.57 | 31,650.24 |
| hsa‐mir‐24‐2 | 159,924 | 27,418.75 | 31,651.005 | |
| hsa‐miR‐181a‐5p | hsa‐mir‐181a‐1 | 153,763 | 23,606.8 | 10,598.56 |
| hsa‐mir‐181a‐2 | 153,763 | 23,606.8 | 10,598.56 | |
| hsa‐let‐21‐5p | hsa‐miR‐21 | 152,755 | 27,453.41 | 50,868.96 |
| hsa‐let‐7g‐5p | hsa‐let‐7g | 149,887 | 18,068.65 | 16,952.26 |
| hsa‐miR‐101‐3p | hsa‐mir‐101‐2 | 136,157 | 18,319.37 | 13,006.13 |
| hsa‐mir‐101‐1 | 136,112 | 18,308.88 | 12,999.89 | |
| hsa‐miR‐9‐5p | hsa‐mir‐9‐1 | 132,699 | 22,919.48 | 18,844.93 |
| has‐mir‐9‐2 | 132,699 | 22,919.48 | 18,884.93 | |
| has‐mir‐9‐3 | 132,654 | 22,910.41 | 18,842.36 | |
| hsa‐let‐7f‐5p | hsa‐let‐7f‐1 | 121,113 | 18,181.57 | 13,624.99 |
| hsa‐let‐7f‐2 | 121,063 | 18,179.71 | 13,610.75 | |
| hsa‐miR‐19a‐3p | hsa‐mir‐19a | 106,253 | 18,341.35 | 4190.59 |
After identifying the known miRNAs, we found out that over 25,000 reads (0.13%) corresponded to 25 potentially novel miRNAs (Supporting Information Table S8). Eighteen top scoring miRNAs possessed miRDeep2 score over 5 and the estimated probability that the miRNA candidate was a true positive accounted for 64 ± 14%. Another 7 miRNA candidates with miRDeep2 score below 5 were predicted as potentially novel human miRNAs based on their high sequence similarity to known miRNAs from mice.
Differentially expressed miRNAs were determined by fold change (FC) and log2 fold change in normalized read counts between WHO grade III and grade IV gliomas. DE analysis revealed 25 miRNAs that were differentially expressed (p‐value <0.05, FC ≥ 3), out of which miR‐221‐3p, miR‐10a‐5p, miR‐155‐5p showed the strongest up‐regulation in GBMs and miR‐767‐5p, miR‐505‐5p were over 5‐fold down‐regulated (Table 2). It is worth pointing out that some miRNAs, e.g. miR‐155, miR‐505, miR‐301b, miR‐20a‐3p, were significantly enriched in glioblastoma or peritumoral tissues in comparison to normal brain, whereas miR‐129‐3p, miR‐132‐3p and miR‐181a were down‐regulated in our microarray experiments. Interestingly, in the deep sequencing DE analysis we observed a down‐regulation of miRNAs derived from miR‐17‐92 cluster: miR‐19a‐3p, miR‐7‐5p, miR‐18a‐5p, miR‐20a‐3p and miR‐19b‐3p.
Table 2.
Differentially detected miRNA from small RNA sequencing of WHO grade III and grade IV gliomas.
| miRNA | Total read count | Normalized read counts for grade III gliomas (avg) | Normalized read counts for grade IV gliomas (avg) | FC | log2 FC | p‐value |
|---|---|---|---|---|---|---|
| hsa‐miR‐221‐3p | 21,242 | 298.26 | 3414.11 | 11.45 | 3.52 | 0.022 |
| hsa‐miR‐10a‐5p | 6687 | 70.87 | 762.87 | 10.34 | 3.43 | 0.0004 |
| hsa‐miR‐155‐5p | 359 | 5.8 | 58.46 | 10.08 | 3.33 | 0.0218 |
| hsa‐miR‐671‐5p | 605 | 8.15 | 72.37 | 8.88 | 3.15 | 0.00036 |
| hsa‐miR‐34a‐5p | 41,457 | 803.29 | 6386.93 | 7.95 | 2.99 | 0.0142 |
| hsa‐miR‐129‐2‐3p | 18,910 | 404.1 | 2908.115 | 7.2 | 2.85 | 0.0177 |
| hsa‐miR‐149‐5p | 48,184 | 804.43 | 4929.35 | 6.13 | 2.62 | 0.0019 |
| hsa‐miR‐146b‐5p | 1345 | 27.45 | 156.16 | 5.69 | 2.51 | 0.0005 |
| hsa‐miR‐132‐3p | 2177 | 40.99 | 201.72 | 4.92 | 2.3 | 0.0012 |
| hsa‐miR‐152‐3p | 2164 | 63.86 | 264.745 | 4.15 | 2.05 | 0.0039 |
| hsa‐miR‐22‐5p | 2952 | 74.62 | 308.18 | 4.13 | 2.05 | 0.00029 |
| hsa‐miR‐195‐3p | 519 | 14.9 | 51.13 | 3.43 | 1.78 | 0.0009 |
| hsa‐miR‐222‐3p | 17,549 | 668.655 | 2229.455 | 3.33 | 1.74 | 0.0183 |
| hsa‐miR‐296‐3p | 108 | 3.18 | 9.54 | 3.00 | 1.59 | 0.00189 |
| hsa‐miR‐767‐5p | 1313 | 128.04 | 14.09 | 0.11 | −3.18 | 0.008 |
| hsa‐miR‐505‐5p | 539 | 57.68 | 10.65 | 0.18 | −2.44 | 0.00165 |
| hsa‐miR‐19a‐3p | 10,6253 | 9170.68 | 2095.3 | 0.23 | −2.13 | 0.032 |
| hsa‐miR‐301b | 4711 | 416.38 | 98.475 | 0.24 | −2.08 | 0.0118 |
| hsa‐miR‐181a‐2‐3p | 3830 | 315.79 | 80.54 | 0.255 | −1.97 | 0.036 |
| hsa‐miR‐106a‐5p | 63,444 | 5516.13 | 1445.55 | 0.26 | −1.93 | 0.0444 |
| hsa‐miR‐17‐5p | 70,775 | 6182.16 | 1680.59 | 0.27 | −1.88 | 0.0422 |
| hsa‐miR‐18a‐5p | 5693 | 478.215 | 140.27 | 0.29 | −1.77 | 0.026 |
| hsa‐miR‐20a‐3p | 1769 | 154.98 | 46.93 | 0.3 | −1.72 | 0.027 |
| hsa‐miR‐19b‐3p | 46,1047 | 40,315.46 | 11,978.93 | 0.3 | −1.75 | 0.0245 |
| hsa‐let‐7b‐5p | 58,991 | 6742.77 | 2235.91 | 0.33 | −1.59 | 0.00326 |
To predict the biological functions behind our sequencing and DE results, we searched for the putative target transcripts of both up‐regulated and down‐regulated miRNA series, and for the corresponding pathways using DNA intelligent (DIANA) and Kyoto Encyclopedia of Genes and Genomes (KEGG) analyses. The search generated a rank‐ordered list of KEGG pathways, issuing statistical significance based on negative natural logged P‐values (Supporting Information Table S9). Examining the KEGG pathways affected by up‐regulated miRNAs in GBM versus grade III glioma highlighted pathways associated with cancers, including ‘glioma’, ‘prostate cancer’, ‘colorectal cancer’, as well as the mitogen‐activated kinase (MAPK) signaling pathway, ‘Wnt signaling pathway’ and ‘mTOR signaling pathway’. Within those pathways, more than one miRNA was predicted to target PTEN, AKT3 or MAP kinases, for example miR‐221, miR‐222 and miR‐22 were predicted to target AKT3 and PTEN, whereas miR‐155, miR‐10a, miR‐222 and miR‐221 converged on different MAP kinases. Such observations suggest that the same gene could be targeted by several co‐transcribed miRNAs during malignant glioma progression. Analysis of the pathways potentially affected by the series of down‐regulated miRNAs pointed to ‘TGF‐beta signaling’, ‘MAPK signaling’, ‘Focal adhesion’ and ‘Axon guidance’ among the most significantly perturbed pathways.
3.3. Meta‐analysis of differentially expressed microRNAs in GBM tissues and normal human brain
We performed a meta‐analysis of miRNA profiling studies carried out on samples collected from GBM tissues. Up to January 2014, 17 research papers showed miRNA profiling results for surgically resected GBM tissues and corresponding noncancerous or normal tissues on the basis of quantitative real‐time PCR, microarray analysis or deep sequencing (Table 3). Different technological platforms (commercial or custom) were used for validation of miRNA expression in gliomas versus normal brain. The number of patients investigated ranged from 5 to 250 across the studies. Both tumor sample and reference sample groups also varied in number and composition. Considering the difficulty in accessing normal, unaffected brain tissue as a control sample, different approaches have been used: comparison to the peripheral glial area of the tumor, to brain tissues affected with non‐neoplastic‐like disorders, or to low‐grade glioma tissue samples. Other studies relied on TCGA data on normal brain expression of miRNAs or, alternatively, on commercially available RNA from normal human brain. Finally, four studies applied normal, pathologically unaffected brain samples for reference. In the meta‐analysis we did not take into consideration the studies based on established glioblastoma cell lines, glioblastoma stem cells, cerebrospinal fluid or peripheral blood of glioblastoma patients. We focused exclusively on miRNA profiling in tumor tissues.
Table 3.
MicroRNA expression profiling studies of human malignant glioma tissues included in the meta‐analysis.
| First author [reference] | Year | Tissue samples | Method | Platform | Differentially expressed miRNAs | ||||
|---|---|---|---|---|---|---|---|---|---|
| Clinical stage (no of samples) | Reference tissue (no of samples) | Cut‐off criteria | Total | Up‐regulated miRNAs | Down‐regulated miRNAs | ||||
| Ciafre | 2005 | IV (9) | Peripheral glial area of tumor (9) | miRNA microarray | Kimmel Cancer Center/Thomas Jefferson University (KCC/TJU) miRNA microarray Version 1.0 | Cancer/Normal ratio | 13 | 9 | 4 |
| Godlewski | 2008 | IV (ND) | Adjacent brain (ND) | miRNA microarray | KCC/TJU V 4.0 | SAM score | 19 | 8 | 11 |
| Silber | 2008 | III (4)IV (4) | Gliosis‐Epilepsy (4) | Real‐time PCR | TaqMan miRNA Assays Panel Early Access Kit (Applied Biosystems) | FC | 29 | 4 | 25 |
| Huse | 2009 | IV (3) | Normal brain tissue (2) | miRNA microarray | Agilent Technologies | FC (min.2) | 29 | 29 | ND |
| Sasayama | 2009 | IV (3) | Peripheral glial brain area (3) | miRNA microarray | Genopal‐Mich DNA chips (Mitsubishi Rayon) | FC > 1.5 or FC < 0.5 | 10 | 5 | 5 |
| Lavon | 2010 | III (3)IV (2) | Normal brain tissue (1) | Real‐time PCR | TaqMan miRNA Assays Panel Early Access Kit (Applied Biosystems) | FC | 71 | 43 | 28 |
| Malzkorn | 2010 | IV (4) | Primary tumor WHO II (4) | Real‐time PCR | TaqMan miRNA Assays Panel Early Access Kit (Applied Biosystems) | FC | 14 | 12 | 2 |
| Jiang | 2010 | I (1)II (1)III (1)IV (P, 1) | Normal brain tissue (3) | miRNA microarray | ND | ND | 17 | 9 | 8 |
| Dong | 2010 | IV (240) | Normal brain (10) | miRNA microarray | Agilent Technologies (TCGA data) | p‐value | 97 | 30 | 67 |
| Rao | 2010 | III (13)IV (26) | Normal brain (7) | miRNA microarray | Mercury LNA array version 10.0 (Exiqon) | FC | 94 | 55 | 29 |
| Slaby | 2010 | IV (22) | Brain tissues from arteriovenous malformations (AVM) (6) | Real‐time PCR | TaqMan MicroRNA Assay (Applied Biosystems) | FC | 8 | 2 | 6 |
| Srinivasan | 2011 | IV (354) | Normal brain (10) | miRNA microarray | Agilent Technologies (TCGA data) | p‐value ≤0.01 | 10 | 7 | 3 |
| Slaksky | 2011 | IV (6) | Non‐tumor (cortical dysplasia) (3) | Deep sequencing | Illumina | p‐value <0.05 FC > 5 | 56 | 18 | 38 |
| Lages | 2011 | II (11)III (2)IV (11) | Control brain tissue (hippocampal sclerosis) (4) | Membrane‐ array hybridization AND real‐time PCR | Self‐made (arrays) AND Taqman MicroRNA Assay (Applied Biosystems) | Cancer/Normal ratio | 26 | 15 | 11 |
| Jiang | 2012 | IV (4) | Adjacent brain (4) | miRNA microarray | Agilent Technologies | ND | 22 | 15 | 7 |
| D'Urso | 2012 | IV (94) | Normal brain tissue (Ambion) (1) | miRNA microarray | Self‐made | p‐value <0.01 | 12 | 6 | 6 |
| Hua | 2012 | IV (3) | Normal brain tissue – non‐tumor illness (3) | Deep sequencing | Illumina | p‐value <0.05 | 73 | 33 | 40 |
FC – fold change; ND‐no data.
The meta‐analysis revealed 293 deregulated miRNAs that were previously reported as deregulated in glioblastoma, out of which 145 were found to be up‐regulated (Supplemental Table S10) and 148 to be down‐regulated (Supplemental Table S11). The most extensive list of differentially expressed miRNAs was reported in a study based on TCGA miRNA microarray data (97 miRNAs, 33.1% of reported miRNAs) (Dong et al., 2010). From a total of 293 differentially expressed miRNAs, 178 were found in a single study, whereas 35 were found at least 4 times. The most common miRNAs reported as deregulated in malignant glioma tissues are summarized in Table 4. In the panel of up‐regulated miRNAs, miR‐21, miR‐10b and miR‐25 were reported the most frequently, whereas in the panel of down‐regulated miRNAs, miR‐124‐3p, miR‐139‐5p and miR‐218 were the most represented. Twenty out of the 35 most frequently deregulated miRNAs were reported in concordance with our microarray analysis (Table 4).
Table 4.
MicroRNA implicated in glioblastoma – the most frequently reported miRNAs in profiling studies.
| No. | miRNA | Expression in glioma (up↑ or down↓) | Ref. | Reported in this study (microarrays) |
|---|---|---|---|---|
| 1 | miR‐9‐5p | ↑ | (D'Urso et al., 2012; Dong et al., 2010; Jiang et al., 2012; Lages et al., 2011; Malzkorn et al., 2010; Rao et al., 2010) | |
| 2 | miR‐10a‐5p | ↑ | (Huse et al., 2009; Lavon et al., 2010; Rao et al., 2010; Skalsky and Cullen, 2011) | |
| 3 | miR‐10b‐5p | ↑ | (Ciafre et al., 2005; Godlewski et al., 2008; Hua et al., 2012; Huse et al., 2009; Jiang et al., 2012; Jiang et al., 2010; Lavon et al., 2010; Rao et al., 2010; Sasayama et al., 2009; Silber et al., 2008; Skalsky and Cullen, 2011) | |
| 4 | miR‐15b‐5p | ↑ | (Dong et al., 2010; Huse et al., 2009; Lages et al., 2011; Rao et al., 2010) | + |
| 5 | miR‐16‐5p | ↑ | (Dong et al., 2010; Lages et al., 2011; Malzkorn et al., 2010; Rao et al., 2010) | |
| 6 | miR‐17‐5p | ↑ | (Dong et al., 2010; Lages et al., 2011; Lavon et al., 2010; Malzkorn et al., 2010; Rao et al., 2010; Srinivasan et al., 2011) | |
| 7 | miR‐20a‐5p | ↑ | (Dong et al., 2010; Lages et al., 2011; Lavon et al., 2010; Malzkorn et al., 2010; Srinivasan et al., 2011) | |
| 8 | miR‐21‐5p | ↑ | (Ciafre et al., 2005; D'Urso et al., 2012; Dong et al., 2010; Godlewski et al., 2008; Hua et al., 2012; Huse et al., 2009; Jiang et al., 2012; Lages et al., 2011; Lavon et al., 2010; Malzkorn et al., 2010; Rao et al., 2010; Sasayama et al., 2009; Silber et al., 2008; Skalsky and Cullen, 2011; Slaby et al., 2010) | + |
| 9 | miR‐25‐3p | ↑ | (Ciafre et al., 2005; Dong et al., 2010; Hua et al., 2012; Huse et al., 2009; Jiang et al., 2010; Lavon et al., 2010; Malzkorn et al., 2010; Rao et al., 2010; Skalsky and Cullen, 2011) | + |
| 10 | miR‐92a‐3p | ↑ | (Dong et al., 2010; Hua et al., 2012; Lavon et al., 2010; Rao et al., 2010; Skalsky and Cullen, 2011) | + |
| 11 | miR‐92b‐3p | ↑ | (Dong et al., 2010; Hua et al., 2012; Huse et al., 2009; Rao et al., 2010; Sasayama et al., 2009; Skalsky and Cullen, 2011) | |
| 12 | miR‐93‐5p | ↑ | (Dong et al., 2010; Hua et al., 2012; Huse et al., 2009; Lavon et al., 2010; Rao et al., 2010; Skalsky and Cullen, 2011) | + |
| 13 | miR‐106a‐5p | ↑ | (Dong et al., 2010; Lavon et al., 2010; Rao et al., 2010; Srinivasan et al., 2011) | |
| 14 | miR‐106b‐5p | ↑ | (Dong et al., 2010; Hua et al., 2012; Huse et al., 2009; Lavon et al., 2010; Rao et al., 2010; Sasayama et al., 2009) | |
| 15 | miR‐130a‐3p | ↑ | (Ciafre et al., 2005; Dong et al., 2010; Jiang et al., 2010; Lavon et al., 2010; Rao et al., 2010) | |
| 16 | miR‐130b‐3p | ↑ | (Dong et al., 2010; Lavon et al., 2010; Malzkorn et al., 2010; Rao et al., 2010) | + |
| 17 | miR‐155‐5p | ↑ | (D'Urso et al., 2012; Dong et al., 2010; Lages et al., 2011; Lavon et al., 2010; Rao et al., 2010; Silber et al., 2008) | + |
| 18 | miR‐182‐5p | ↑ | (Hua et al., 2012; Huse et al., 2009; Jiang et al., 2010; Lavon et al., 2010; Rao et al., 2010) | |
| 19 | miR‐196b‐5p | ↑ | (Dong et al., 2010; Huse et al., 2009; Rao et al., 2010; Skalsky and Cullen, 2011) | + |
| 20 | miR‐210 | ↑ | (Dong et al., 2010; Lages et al., 2011; Lavon et al., 2010; Malzkorn et al., 2010; Silber et al., 2008) | + |
| 21 | miR‐7‐5p | ↓ | (Dong et al., 2010; Hua et al., 2012; Jiang et al., 2010; Lages et al., 2011; Silber et al., 2008; Skalsky and Cullen, 2011) | + |
| 22 | miR‐124‐3p | ↓ | (Dong et al., 2010; Godlewski et al., 2008; Hua et al., 2012; Jiang et al., 2010; Lages et al., 2011; Lavon et al., 2010; Rao et al., 2010; Silber et al., 2008) | + |
| 23 | miR‐128‐3p | ↓ | (Godlewski et al., 2008; Lavon et al., 2010; Silber et al., 2008; Slaby et al., 2010) | + |
| 24 | miR‐129‐5p | ↓ | (Dong et al., 2010; Hua et al., 2012; Jiang et al., 2010; Lavon et al., 2010; Rao et al., 2010; Silber et al., 2008) | |
| 25 | miR‐132‐3p | ↓ | (Dong et al., 2010; Hua et al., 2012; Lages et al., 2011; Lavon et al., 2010; Rao et al., 2010; Silber et al., 2008; Skalsky and Cullen, 2011) | + |
| 26 | miR‐136‐5p | ↓ | (Dong et al., 2010; Jiang et al., 2010; Lavon et al., 2010; Skalsky and Cullen, 2011) | + |
| 27 | miR‐137 | ↓ | (Dong et al., 2010; Godlewski et al., 2008; Lavon et al., 2010; Silber et al., 2008) | + |
| 28 | miR‐138‐5p | ↓ | (Dong et al., 2010; Hua et al., 2012; Rao et al., 2010; Silber et al., 2008) | |
| 29 | miR‐139‐5p | ↓ | (Dong et al., 2010; Godlewski et al., 2008; Jiang et al., 2012; Jiang et al., 2010; Lages et al., 2011; Lavon et al., 2010; Silber et al., 2008; Skalsky and Cullen, 2011) | + |
| 30 | miR‐153‐3p | ↓ | (Dong et al., 2010; Lavon et al., 2010; Silber et al., 2008; Skalsky and Cullen, 2011) | + |
| 31 | miR‐154‐3p | ↓ | (Dong et al., 2010; Hua et al., 2012; Lavon et al., 2010; Silber et al., 2008) | |
| 32 | miR‐203a | ↓ | (Dong et al., 2010; Hua et al., 2012; Lavon et al., 2010; Silber et al., 2008) | |
| 33 | miR‐218‐5p | ↓ | (Dong et al., 2010; Godlewski et al., 2008; Hua et al., 2012; Jiang et al., 2012; Jiang et al., 2010; Lavon et al., 2010; Silber et al., 2008; Skalsky and Cullen, 2011) | + |
| 34 | miR‐323a‐3p | ↓ | (Dong et al., 2010; Godlewski et al., 2008; Hua et al., 2012; Lavon et al., 2010; Silber et al., 2008) | + |
| 35 | miR‐328‐3p | ↓ | (Jiang et al., 2012; Lavon et al., 2010; Malzkorn et al., 2010; Silber et al., 2008) | + |
Meta‐analysis revealed that 9 miRNAs from a total of 293 miRNAs deregulated in gliomas were reported inconsistently, both as up‐ or down‐regulated, depending on the study considered (Supplemental Table S12). These were: miR‐15a, miR‐16, miR‐26b, miR‐98, miR‐126, miR‐136, miR‐138, miR‐221 and miR‐383. According to our research (microarray analysis), miR‐136 should be matched with the group of miRNAs of decreased expression level.
While considering the deep sequencing profiling of miRNAs in grade III versus grade IV gliomas in the light of the meta‐analysis results, we observed that the expression of some miRNAs remained consistent with tumor‐versus‐normal analysis (e.g. miR‐10s, miR‐155, miR‐671, miR‐146b, miR‐152‐3p, miR‐195‐3p, miR‐269‐3p, miR‐767, miR‐301b, miR‐181a‐3p), whereas other individuals exhibited the opposite trend (miR‐149, miR‐132, miR‐22‐5p, miR‐505, let‐7b and miRNAs encoded by miR‐17‐92 cluster).
3.4. Novel miRNA biomarkers of glioblastoma
Sixty three out of the 293 miRNAs/miRNAs* found in the meta‐analysis overlapped with our miRNA microarray study as significantly deregulated in gliomas (Figure 2A). Of these 63 miRNAs, 35 are down‐regulated (including miR‐7, miR‐139‐5p, miR‐218, miR‐137) and 28 up‐regulated (including miR‐21, miR‐155, miR‐210, miR‐15b, miR‐93 and miR‐25). Moreover, we report 34 miRNAs that had not been previously considered to be deregulated in malignant gliomas. To gain more insight into the specificity of newly‐identified glioma‐specific miRNAs as potential biomarkers, we investigated their scores in miR2Disease database (Supplemental Tables 2 and 3) and in miRBase. miR‐197 was shown to be down‐regulated in glioblastoma cell lines, although, for the first time, we showed its down‐expression in glioblastoma tissues. The level of miR‐381 is lowered in ovarian cancer and, according to our results, it is also down‐regulated in GBM. miR‐494 as well as miR‐202 were also found to be up‐regulated in other human malignances, similarly to what we observed in glioblastoma. Moreover, miR‐1274a, miR‐1308, miR‐1826 and miR‐1280 were recognized as misannotated according to miRBase Version 19 released in August 2012. Consequently, they were removed from further analysis and the final list of potential novel glioblastoma biomarkers consists of 30 miRNAs (Figure 2A).
Figure 2.
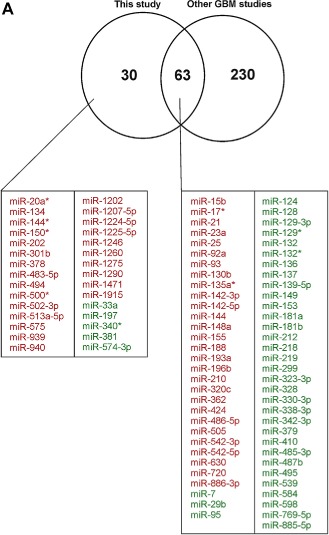
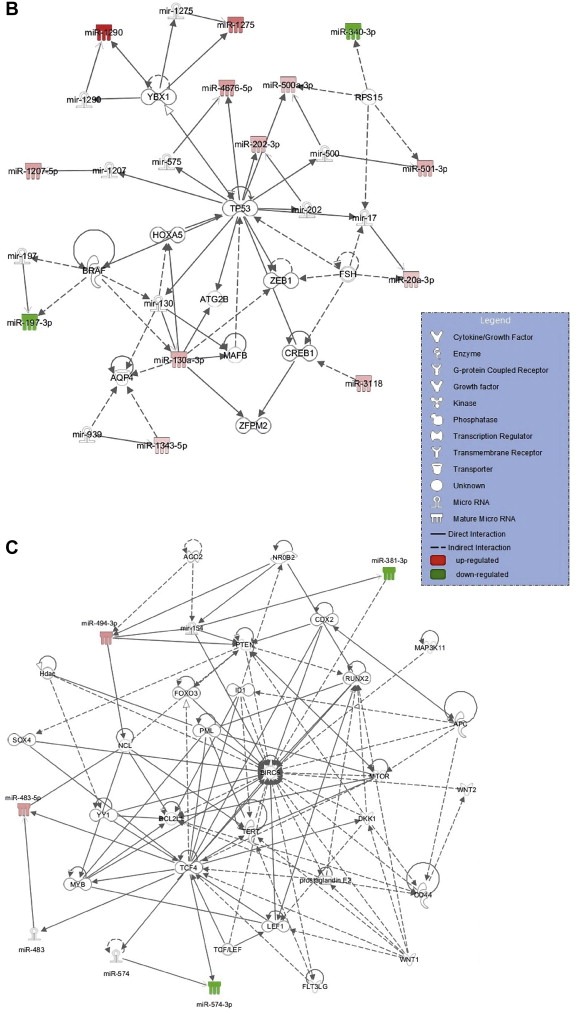
Putative novel miRNA biomarkers of glioblastoma. (A) Venn diagram showing the number of deregulated miRNAs in glioblastoma identified in the current study and in previous GBM profiling studies. The overlapping miRNAs and exclusively identified in our research are indicated below the diagram and colored (red: up‐regulated, green: down‐regulated). Functional relationships of the candidate miRNA biomarkers of glioblastoma and their targets were identified by Ingenuity Pathway Analysis and are presented in (B) the network of ‘Inflammatory Disease, Inflammatory Response, Organismal Injury and Abnormalities’ with IPA score of 31, and (C) ‘Cell Death and Survival, Cellular Development, Cellular Growth and Proliferation’ with IPA score of 7.
Figure 2.
(Continued)
Molecular network interactions and signaling pathways associated with 30 potentially novel miRNA biomarkers of glioblastoma and their predicted molecular targets were retrieved using IPA (Figure 2B and C). The most impacted biological processes and diseases regulated by the analyzed miRNAs included: cell death and survival, cellular development, cellular growth and proliferation, inflammatory response and cancer. The molecular network maps showed two main pathways in which significant miRNAs are involved. The tumor suppressor gene, TP53, was found to be at the central hub of the most significant network with a score of 31 (Figure 2B). The network included miR‐202, miR‐1290, miR‐1207, miR‐20a‐3p, miR‐500‐3p, which were up‐regulated in glioma samples, and miR‐197‐3p, miR‐340‐3p, which were down‐regulated. The second significant network (Figure 2C) involved up‐regulated miR‐494, miR‐483 and down‐regulated miR‐381, which are associated with the regulation of key genes in cancer development such as PTEN, MTOR, WNT2 and WNT1 or the apoptosis regulators BIRC5 (encoding survivin) and BCL2L.
4. Discussion
The global miRNA content in gliomas has been analyzed by several groups with the use of various types of large‐scale methods, different numbers of analyzed tumor samples, as well as diverse reference samples (non‐tumor brain tissues). Particular studies were focused on functional aspects of miRNA/miRNAs of choice and their contribution to gliomagenesis. Current progress in understanding the role of specific miRNAs recognized as deregulated in glioma cells has been reviewed (Karsy et al., 2012; Nikaki et al., 2012; Zhang et al., 2012). Integrative miRNA and mRNA expression analyses based on TCGA datasets have shown that miRNA signatures combined with transcriptome data could be useful for the identification of glioblastoma subclasses and subtype‐specific drivers of expression changes (Brennan et al., 2013; Kim et al., 2011; Setty et al., 2012; Tang et al., 2013). However, a comprehensive list of miRNAs deregulated in gliomas based on combined profiling studies is still unavailable, which makes the GBM molecular portrait incomplete.
In the present study, we investigated the genome‐wide miRNA expression pattern in malignant gliomas. We used two different technical platforms (miRNA microarray and deep sequencing) to determine the differential expression of miRNAs in glioblastoma tissues, gliomas of WHO grade III, adjacent to tumor brain samples, and normal human brain. Moreover, we conducted a meta‐analysis in order to combine the results of miRNA profiling in GBM tissues available in the literature.
4.1. MicroRNA deregulation in glioblastoma and adjacent brain
Our findings from miRNA microarrays of tumor and adjacent brain samples highlighted the altered expression of 97 miRNAs in glioblastoma in comparison to normal brain and 22 significantly different miRNAs when comparing adjacent brain samples with normal brain. We concluded that peritumoral areas are more similar to tumors than to normal, reference brain. Only miR‐625 was observed as exclusively down‐regulated within the borders of tumors, but not in GBM samples. Aberrant down‐regulation of miR‐625 has recently been shown to be associated with increased invasion and migration of gastric cancer cells, due to targeting of ILK, integrin‐like kinase (Wang et al., 2012). Other miRNA expression changes that can be associated with local invasion in glioblastoma included over‐expression of miR‐21, miR‐155, miR‐1260, miR‐630, miR‐542‐5p, miR‐142‐5p, as well as down‐regulation of miR‐124, miR‐7, miR‐132, miR‐137 and miR‐136.
Based on microarray analysis, we were able to identify miRNAs that distinguish normal brain from GBM tissue. In this group we included up‐regulated miR‐155, miR‐210, miR‐21, miR‐130b, miR‐93, miR‐15b, miR‐23a‐3p, miR‐25 and miR‐92a‐3p. Some of the aforementioned miRNAs (e.g. miR‐21, miR‐155, miR‐93, miR15b) are considered as oncomirs and, to some extent, characterized in the context of glioma (D'Urso et al., 2012; Iorio and Croce, 2012; Karsy et al., 2012; Moller et al., 2013). Others still remain unclear in terms of their function, e.g. miR‐142‐5p and miR‐542‐5p, which are overexpressed both in tumor and in peritumoral areas. In a recent study on miRNA expression changes in developing human brain, miR‐542‐5p has been found to show reduced expression at prenatal time points, spike at earliest childhood time points and subsequent decline (Moreau et al., 2013).
Consistently with other glioma miRNA profiling studies, we observed down‐regulation of miR‐124, miR‐128, miR‐218, miR‐137, miR‐132, miR‐7, miR‐132, miR‐181a, amongst others. Some of these can be classified as brain‐specific miRNAs, e.g. miR‐124, miR‐128 and miR‐132, which are enriched in neurons (Kapsimali et al., 2007; Vo et al., 2005). On the other hand, deep sequencing analysis showed that some of the brain‐enriched miRNAs were in copious amounts in malignant gliomas and ranked in the top 20 most abundant miRNAs in these tumors. In that group, one can find miR‐125b‐5p and miR‐99a, which were previously found in large quantities in brain transcriptomes (Shao et al., 2010). It is worth noticing that also miR‐21 has been shown to be a brain‐enriched miRNA, which was confirmed using both microarray and deep sequencing platforms (Hu et al., 2011; Shao et al., 2010).
In the present study, we identified 30 potentially novel miRNA biomarkers of GBM, out of which 25 emerged as up‐regulated and 5 as down‐regulated in GBMs. Although their expression and role in gliomas need further experimental investigation, computational analysis indicated that these miRNAs seemed to be potential glioma biomarkers, e.g. up‐regulated miR‐202, miR‐1290, miR‐1207, miR‐20a‐3p, miR‐500‐3p, miR‐494, miR‐483 are associated with regulation of key genes in cancer development such as TP53, PTEN, MTOR, WNT2 and WNT1 or BIRC5 and BCL2L. Particularly, miR‐1290 seems to be interesting in terms of its function in gliomas, since it has recently been shown to be involved in the radioresistance of human cervical cancer cells (Zhang et al., 2013). The over‐expression of miR‐1246, miR‐3138 and miR‐630 was also connected with the enhanced radioresistance. Interestingly, three of those miRNAs, miR‐1290, miR‐630 and miR‐1246, were among the top 10 up‐regulated miRNAs in GBMs according to our microarray data. This could suggest that they possess the potential for displaying a similar function in gliomas as previously showed in radioresistant cervical cancer. It is worth mentioning that some of the proposed novel miRNA biomarkers of glioblastoma have been recently shown to be candidate markers of different human diseases and disorders, e.g. miR‐1202 was postulated as a candidate biomarker of major depressive disorder and a predictor of antidepressant treatment response (Lopez et al., 2014). miR‐483‐5p has been reported to serve as a plasma biomarker for diagnosis and survival prediction in multiple myeloma (Qu et al., 2014), hepatocellular carcinoma (Shen et al., 2013) and adrenocortical tumors (Patel et al., 2013). Up‐regulation of miR‐494 has been demonstrated to be associated with tumor aggressiveness and metastasis in colorectal cancer, it was thus proposed as an independent prognostic marker for colorectal cancer patients (Sun et al., 2014). The same miRNA was also identified as a prognostic predictor for the minimal deviation adenocarcinoma (MDA) of uterine cervix (Lee et al., 2014) and as a risk biomarker for breast cancer development (Marino et al., 2014).
4.2. MicroRNA profile of glioma progression
We exploited the next generation sequencing platform to identify miRNAs discriminating WHO grade IV from WHO grade III gliomas. In the group of miRNAs associated with glioma progression, we included a set of 25 miRNAs that differentiate GBMs from grade III gliomas, out of which 14 miRNAs were up‐regulated in glioblastoma in comparison to grade III gliomas, whereas 11 were down‐regulated. miR‐221‐3p, miR‐10a‐5p and miR‐155 were over 10 times more abundant in GBM in comparison to glioma WHO grade III, and appeared to be the main players in glioma progression from malignancy grade III to IV. Particularly, the case of miR‐221 is interesting, but also controversial. It was shown in many studies, that miR‐221 is overexpressed in numerous human carcinomas, including melanoma, prostate cancer, breast tumors and high‐grade gliomas (Conti et al., 2009) and it is considered to act as an oncomir (Pang et al., 2010). On the other hand, in two independent profiling studies, it was signified as down‐regulated in comparison to normal human brain using qPCR (Slaby et al., 2010) and miRNA microarray (Srinivasan et al., 2011) analyses. We did not find miR‐221 as significantly deregulated in GBMs in comparison to normal human brain, whereas it appeared to be strongly up‐regulated in GBMs versus grade III gliomas, and thus potentially associated with glioma progression. The conclusion could be that the pathway involving miR‐221 overexpression may be considered as a trigger of glioma progression, but its deregulation could be omitted or bypassed by other oncomirs targeting the same downstream mRNAs.
More consistent results were obtained regarding miR‐10a and miR‐155. Recently, Lang et al. have shown that miR‐10a revealed a dramatic increase of expression in glioblastoma stem cells, as compared to normal neural stem cells. Consistent with the results from tumor stem cells, miR‐10a exhibited a substantial increase of expression in most glioblastoma tissues (Lang et al., 2012). miR‐155 has been shown to be up‐regulated both in primary and secondary GBMs and to hold a potential to promote proliferation of tumor cells by targeting GABRA1 and MXI1 (D'Urso et al., 2012; Zhou et al., 2013). It is a well‐known oncomir in many cancers, and it is thought to regulate multiple genes associated with cancer cell proliferation, apoptosis and invasiveness (Faraoni et al., 2009).
Our findings are partially concordant with the data provided by Rao et al. concerning the miRNA signature distinguishing GBM from anaplastic astrocytoma (AA) (Rao et al., 2010). Using microarrays, these authors identified a 23‐miRNA expression signature, which could discriminate GBM from AA. In line with our results, the set of discriminatory miRNAs included up‐regulated miR‐146b‐5p, miR‐155, miR‐22 and miR‐34a. Recently, it was also shown that miR‐767 could be presumed as a ‘protective’ miRNA in the context of the outcome and survival of anaplastic glioma patients, regardless of the histology type (Yan et al., 2014). According to our observations, miR‐767 was the most significantly down‐regulated miRNA in GBM samples versus anaplastic gliomas of WHO grade III. Since it looks like miR‐767 expression is under constant decrease from low‐grade through anaplastic gliomas to GBM, its expression level could be a promising prognostic marker for risk stratification of glioma patients. Surprisingly, in GBM samples we also observed down‐regulated expression of miRNAs encoded by mir‐17‐92, a polycistronic oncogenic miRNA cluster that is overexpressed in many types of human cancers (Mogilyansky and Rigoutsos, 2013). According to the meta‐analysis results, its over‐expression was observed also in GBM tissues. From the miRNA‐seq we can conclude that the level of expression of this cluster was still high in the analyzed glioma specimens, especially in the case of miR‐19a, miR‐19b, miR‐17, miR‐18a, but decreased in comparison to grade III gliomas. This observation could be explained by other results indicating that the expression levels of miR‐17‐92 cluster were reduced in hypoxia‐treated cells (Yan et al., 2009). GBM is characterized by a progressive hypoxia leading to areas of necrosis (Furnari et al., 2007). Thus, the level of miR‐17‐92 cluster could be repressed in glioblastoma compared to grade III gliomas as a consequence of a higher hypoxia rate in the neoplastic microenvironment. We observed an inconsistency of the tumor‐versus‐normal microarray analysis and the miRNA‐seq results concerning the trend of expression changes in gliomas grade III and IV also in the case of some other miRNAs (miR‐149, miR‐132, miR‐22‐5p, miR‐505, let‐7b). Further experimental examination in a more numerous collection of glioma samples will be needed to reveal the reasons for such an inconsistency.
4.3. Meta‐analysis
While elucidating that miRNA profiling in malignant gliomas is certainly an important area of research, we took a closer look into profiling studies published in recent years and conducted a meta‐analysis. Reports concerning the miRNA expression profile in GBM tissues constitute a heterogeneous group in terms of methodology, platform and control, non‐tumor brain samples. Recently, the report of Visani et al. highlighted the issue of using different non‐neoplastic references as controls in miRNA analysis (Visani et al., 2013). It was shown that the results of miRNA profiling using qRT‐PCR method can vary depending on the choice of the non‐neoplastic control (normal tissue adjacent to the tumor, commercial reference and epileptic tissue were taken into account).
The meta‐analysis revealed 293 deregulated miRNAs across all reports. The list of the most frequently deregulated miRNAs in glioblastoma multiforme versus noncancerous human brain consists of 35 miRNAs that were reported at least in 4 out of 17 studies. According to our knowledge, this set of miRNAs represents the most comprehensive and reliable list of deregulated miRNAs in GBM. From this list, 20 miRNAs were consistent with our results from microarray analysis and showed a common tendency in terms of up‐ or down‐regulation, which confirms the integrity of both our profiling study and our meta‐analysis. According to the meta‐analysis results, miR‐21, miR‐10b and miR‐25 are the most frequently up‐regulated, whereas miR‐139‐5p, miR‐218 and miR‐124‐3p are commonly down‐regulated in GBM patients. Both miR‐21 and miR‐10b belong to the best characterized miRNAs influencing malignant glioma development (Karsy et al., 2012; Mizoguchi et al., 2012; Purow, 2011) and are acclaimed to be up‐regulated in high‐grade gliomas (Visani et al., 2014). On the contrary, miR‐25 is rarely recognized as an important player in glioma biology, despite its frequent up‐regulation showed in profiling studies. miR‐25 up‐regulation in GBMs is in line with the report on its overexpression in pediatric brain tumors (Birks et al., 2011). miR‐25, together with miR‐106b and miR‐93, is encoded by miR‐106b∼25 cluster located on 7q22.1, a region commonly gained in diffuse astrocytomas (Malzkorn et al., 2010). According to the meta‐analysis results, all three aforementioned miRNAs belong to the group of most frequently up‐regulated miRNAs in GBM. It was shown that all three components of the miR‐106b∼25 cluster targeted PTEN and cooperated in decreasing PTEN abundance in human prostate cell lines (Poliseno et al., 2010). Recently, a new target of miRNAs from miR‐106b∼25 cluster was determined in breast cancer cells: EP300, the histone acetyltransferase and the transcriptional activator of E‐cadherin. Targeting EP300 resulted in acquiring an aggressive phenotype including an increase in both cell motility and invasion, as well as the ability to proliferate after treatment with doxorubicin (Zhou et al., 2014). miR‐25 was shown to be the major contributor to this phenotype. These findings give a hint to the function of miR‐25 in human cancers, although its role in gliomas needs validation, provided that its overexpression appears to be very frequent in GBMs.
The meta‐analysis revealed that in the group of the most frequently up‐regulated miRNAs in GBM we can also include miRNAs from oncogenic clusters mir‐17∼92 and miR‐106a∼363 (miR‐17‐5p, miR‐20a‐5p, miR‐92a‐3p, miR‐106a‐5p), miR‐9‐5p, miR‐155, miR‐210, miR‐10a, miR‐182, miR‐196b, as well as clustered miR‐15b and miR‐16. All of these were previously associated with many human cancers, including gliomas (Iorio and Croce, 2012; Karsy et al., 2012; Moller et al., 2013).
The list of 15 miRNAs that were recognized in the meta‐analysis as the most significantly down‐regulated in gliomas is quite concordant across the literature. Above all, this is the case for miR‐218, miR‐124‐3p, miR‐7, miR‐137, miR‐153‐3p, miR‐132, miR‐136 or miR‐129‐5p. It is worth noticing that the group of miRNAs with decreased expression levels in malignant gliomas, in spite of being consistent across profiling studies, has received limited attention in terms of functional characterization. There are some exceptions, e.g. miR‐218, which is the miRNA most frequently designated as down‐regulated in GBM and substantial efforts have been made to characterize its role. Down‐regulated miRNAs in human cancers are usually linked with tumor‐suppressive functions and their substitution in cancer cells may be effective in creating new treatment modalities. Recently, much attention was paid to the concept of miR‐34a replacement therapy of cancer (Bader, 2012). The mimic of miR‐34a is the first miRNA‐based therapeutic undergoing a clinical trial conducted by Mirna Therapeutics, Inc. Its expression has been validated in a wide range of malignant neoplasms, including gliomas. Some reports have shown a tumor‐suppressive role of miR‐34a in gliomas and GBM‐derived cell lines (Guessous et al., 2010, 2011, 2009, 2010). However, the high‐throughput profiling studies included in the meta‐analysis did not show a significant down‐regulation of this miRNA in GBMs in comparison to noncancerous human brain. On the contrary, Rao et al. noticed an elevated expression of miR‐34a in glioblastoma in comparison to anaplastic astrocytoma using microarrays (Rao et al., 2010), which is in line with our deep sequencing analysis showing the same trend in miR‐34a expression. Such contradictory results need further clarification, but it seems that miR‐34a is not a perfect candidate for miRNA replacement therapy of gliomas. Nevertheless, some interesting candidate miRNAs emerge from our meta‐analysis, e.g. miR‐218 or miR‐139.
5. Conclusions
We provide here a wide array of data on miRNA expression in malignant gliomas, which complements the current state‐of‐the‐art in the field of miRNA regulation in gliomas. Firstly, we identified a set of deregulated miRNAs in glioblastoma in comparison to normal human brain. The analysis confirmed the aberrant expression of some specific miRNAs and provides new insights into potential new GBM biomarkers. Secondly, on the basis of deep sequencing analysis, we generated a list of miRNAs that are associated with malignant glioma progression from WHO grade III to grade IV. And finally, we combined all available data on the miRNA profile in GBM tissues versus noncancerous samples to conduct a meta‐analysis. We identified a meta‐signature, consisting of 35 highly significant and consistently deregulated miRNAs across 17 different studies. To our knowledge, this is the first meta‐analysis that comprehensively and reliably presents and clarifies facts about the GBM signature. The list of 35 most frequently deregulated miRNAs in GBM could be a source of information for clinical purposes, both diagnostic and, potentially, therapeutic applications. Our analyses also clearly indicate that some miRNAs, such as miR‐221 or miR‐34a, need further exploration to deepen our understanding of their functional meaning in gliomas.
It is clear that GBM represents a heterogeneous type of neoplasm when considering its molecular and genetic features. Also the miRNA profile seems not to be uniform across different analyzed GBM tumors. Nonetheless, due to global high‐throughput profiling it is possible to select miRNAs that are at high risk of being deregulated in a majority of patients. Thus, there is a considerable hope for utilizing miRNAs as targets in prospects of glioma therapy. However, our analysis also highlights the challenges connected with the definition of miRNA functions before clinical application becomes realistic.
Author contributions
MP prepared RNA, analyzed the microarray data, performed the meta‐analysis and wrote the manuscript. KR co‐investigated the meta‐analysis data and, together with JB, contributed to the design of experiments and discussion of the results. AB contributed to the discussion of the results. MZ analyzed the deep sequencing data. MM performed the statistical analysis of deep sequencing data. AMB and SN collected the glioma tissue samples. MZB supervised the project.
Conflict of interests
Authors declare no conflict of interests.
Supporting information
The following are the supplementary data related to this article:
Supplementary data
Supplementary data
Supplementary data
Supplementary data
Supplementary data
Supplementary data
Acknowledgments
This work was supported by the European Regional Development Fund within the Innovative Economy Programme, action 1.3.1., grant UDA‐ POIG.01.03.01‐30‐050/09, and National Science Centre, grant 5955/B/P01/2010/38 (KR).
Supplementary data 1.
1.1.
Supplementary data related to this article can be found at http://dx.doi.org/10.1016/j.molonc.2015.03.007.
Piwecka Monika, Rolle Katarzyna, Belter Agnieszka, Barciszewska Anna Maria, Żywicki Marek, Michalak Marcin, Nowak Stanisław, Naskręt-Barciszewska Mirosława Z., Barciszewski Jan, (2015), Comprehensive analysis of microRNA expression profile in malignant glioma tissues, Molecular Oncology, 9, doi: 10.1016/j.molonc.2015.03.007.
References
- Bader, A.G. , 2012. miR-34-a microRNA replacement therapy is headed to the clinic. Front. Genet. 3, 120 [DOI] [PMC free article] [PubMed] [Google Scholar]
- Birks, D.K. , Barton, V.N. , Donson, A.M. , Handler, M.H. , Vibhakar, R. , Foreman, N.K. , 2011. Survey of MicroRNA expression in pediatric brain tumors. Pediatr. Blood Cancer 56, 211–216. [DOI] [PubMed] [Google Scholar]
- Bonavia, R. , Inda, M.M. , Cavenee, W.K. , Furnari, F.B. , 2011. Heterogeneity maintenance in glioblastoma: a social network. Cancer Res. 71, 4055–4060. [DOI] [PMC free article] [PubMed] [Google Scholar]
- Brennan, C.W. , Verhaak, R.G. , McKenna, A. , Campos, B. , Noushmehr, H. , Salama, S.R. , Zheng, S. , Chakravarty, D. , Sanborn, J.Z. , Berman, S.H. , Beroukhim, R. , Bernard, B. , Wu, C.J. , Genovese, G. , Shmulevich, I. , Barnholtz-Sloan, J. , Zou, L. , Vegesna, R. , Shukla, S.A. , Ciriello, G. , Yung, W.K. , Zhang, W. , Sougnez, C. , Mikkelsen, T. , Aldape, K. , Bigner, D.D. , Van Meir, E.G. , Prados, M. , Sloan, A. , Black, K.L. , Eschbacher, J. , Finocchiaro, G. , Friedman, W. , Andrews, D.W. , Guha, A. , Iacocca, M. , O'Neill, B.P. , Foltz, G. , Myers, J. , Weisenberger, D.J. , Penny, R. , Kucherlapati, R. , Perou, C.M. , Hayes, D.N. , Gibbs, R. , Marra, M. , Mills, G.B. , Lander, E. , Spellman, P. , Wilson, R. , Sander, C. , Weinstein, J. , Meyerson, M. , Gabriel, S. , Laird, P.W. , Haussler, D. , Getz, G. , Chin, L. , 2013. The somatic genomic landscape of glioblastoma. Cell 155, 462–477. [DOI] [PMC free article] [PubMed] [Google Scholar]
- Cheng, L. , Bao, S. , Rich, J.N. , 2010. Potential therapeutic implications of cancer stem cells in glioblastoma. Biochem. Pharmacol. 80, 654–665. [DOI] [PMC free article] [PubMed] [Google Scholar]
- Ciafre, S.A. , Galardi, S. , Mangiola, A. , Ferracin, M. , Liu, C.G. , Sabatino, G. , Negrini, M. , Maira, G. , Croce, C.M. , Farace, M.G. , 2005. Extensive modulation of a set of microRNAs in primary glioblastoma. Biochem. Biophys. Res. Commun. 334, 1351–1358. [DOI] [PubMed] [Google Scholar]
- Conti, A. , Aguennouz, M. , La Torre, D. , Tomasello, C. , Cardali, S. , Angileri, F.F. , Maio, F. , Cama, A. , Germano, A. , Vita, G. , Tomasello, F. , 2009. miR-21 and 221 upregulation and miR-181b downregulation in human grade II–IV astrocytic tumors. J. Neurooncol. 93, 325–332. [DOI] [PubMed] [Google Scholar]
- David, M. , Dzamba, M. , Lister, D. , Ilie, L. , Brudno, M. , 2011. SHRiMP2: sensitive yet practical SHort Read Mapping. Bioinformatics 27, 1011–1012. [DOI] [PubMed] [Google Scholar]
- Di Leva, G. , Garofalo, M. , Croce, C.M. , 2014. MicroRNAs in cancer. Annu. Rev. Pathol. 9, 287–314. [DOI] [PMC free article] [PubMed] [Google Scholar]
- Dong, H. , Siu, H. , Luo, L. , Fang, X. , Jin, L. , Xiong, M. , 2010. Investigation gene and microRNA expression in glioblastoma. BMC Genomics 11, (Suppl. 3) S16 [DOI] [PMC free article] [PubMed] [Google Scholar]
- D'Urso, P.I. , D'Urso, O.F. , Storelli, C. , Mallardo, M. , Gianfreda, C.D. , Montinaro, A. , Cimmino, A. , Pietro, C. , Marsigliante, S. , 2012. miR-155 is up-regulated in primary and secondary glioblastoma and promotes tumour growth by inhibiting GABA receptors. Int. J. Oncol. 41, 228–234. [DOI] [PubMed] [Google Scholar]
- Fang, Z. , Rajewsky, N. , 2011. The impact of miRNA target sites in coding sequences and in 3'UTRs. PLoS One 6, e18067 [DOI] [PMC free article] [PubMed] [Google Scholar]
- Faraoni, I. , Antonetti, F.R. , Cardone, J. , Bonmassar, E. , 2009. miR-155 gene: a typical multifunctional microRNA. Biochim. Biophys. Acta 1792, 497–505. [DOI] [PubMed] [Google Scholar]
- Friedlander, M.R. , Mackowiak, S.D. , Li, N. , Chen, W. , Rajewsky, N. , 2012. miRDeep2 accurately identifies known and hundreds of novel microRNA genes in seven animal clades. Nucleic Acids Res. 40, 37–52. [DOI] [PMC free article] [PubMed] [Google Scholar]
- Friedman, R.C. , Farh, K.K. , Burge, C.B. , Bartel, D.P. , 2009. Most mammalian mRNAs are conserved targets of microRNAs. Genome Res. 19, 92–105. [DOI] [PMC free article] [PubMed] [Google Scholar]
- Furnari, F.B. , Fenton, T. , Bachoo, R.M. , Mukasa, A. , Stommel, J.M. , Stegh, A. , Hahn, W.C. , Ligon, K.L. , Louis, D.N. , Brennan, C. , Chin, L. , DePinho, R.A. , Cavenee, W.K. , 2007. Malignant astrocytic glioma: genetics, biology, and paths to treatment. Genes Dev. 21, 2683–2710. [DOI] [PubMed] [Google Scholar]
- Godlewski, J. , Nowicki, M.O. , Bronisz, A. , Williams, S. , Otsuki, A. , Nuovo, G. , Raychaudhury, A. , Newton, H.B. , Chiocca, E.A. , Lawler, S. , 2008. Targeting of the Bmi-1 oncogene/stem cell renewal factor by microRNA-128 inhibits glioma proliferation and self-renewal. Cancer Res. 68, 9125–9130. [DOI] [PubMed] [Google Scholar]
- Gu, W. , Wang, X. , Zhai, C. , Zhou, T. , Xie, X. , 2013. Biological basis of miRNA action when their targets are located in human protein coding region. PLoS One 8, e63403 [DOI] [PMC free article] [PubMed] [Google Scholar]
- Guessous, F. , Zhang, Y. , Kofman, A. , Catania, A. , Li, Y. , Schiff, D. , Purow, B. , Abounader, R. , 2010. microRNA-34a is tumor suppressive in brain tumors and glioma stem cells. Cell Cycle 9, 1031–1036. [DOI] [PMC free article] [PubMed] [Google Scholar]
- Hu, H.Y. , Guo, S. , Xi, J. , Yan, Z. , Fu, N. , Zhang, X. , Menzel, C. , Liang, H. , Yang, H. , Zhao, M. , Zeng, R. , Chen, W. , Paabo, S. , Khaitovich, P. , 2011. MicroRNA expression and regulation in human, chimpanzee, and macaque brains. PLoS Genet. 7, e1002327 [DOI] [PMC free article] [PubMed] [Google Scholar]
- Hua, D. , Mo, F. , Ding, D. , Li, L. , Han, X. , Zhao, N. , Foltz, G. , Lin, B. , Lan, Q. , Huang, Q. , 2012. A catalogue of glioblastoma and brain MicroRNAs identified by deep sequencing. OMICS 16, 690–699. [DOI] [PMC free article] [PubMed] [Google Scholar]
- Huse, J.T. , Brennan, C. , Hambardzumyan, D. , Wee, B. , Pena, J. , Rouhanifard, S.H. , Sohn-Lee, C. , le Sage, C. , Agami, R. , Tuschl, T. , Holland, E.C. , 2009. The PTEN-regulating microRNA miR-26a is amplified in high-grade glioma and facilitates gliomagenesis in vivo. Genes Dev. 23, 1327–1337. [DOI] [PMC free article] [PubMed] [Google Scholar]
- Iorio, M.V. , Croce, C.M. , 2012. MicroRNA dysregulation in cancer: diagnostics, monitoring and therapeutics. A comprehensive review. EMBO Mol. Med. 4, 143–159. [DOI] [PMC free article] [PubMed] [Google Scholar]
- Jiang, L. , Lin, C. , Song, L. , Wu, J. , Chen, B. , Ying, Z. , Fang, L. , Yan, X. , He, M. , Li, J. , Li, M. , 2012. MicroRNA-30e* promotes human glioma cell invasiveness in an orthotopic xenotransplantation model by disrupting the NF-kappaB/IkappaBalpha negative feedback loop. J. Clin. Invest. 122, 33–47. [DOI] [PMC free article] [PubMed] [Google Scholar]
- Jiang, L. , Mao, P. , Song, L. , Wu, J. , Huang, J. , Lin, C. , Yuan, J. , Qu, L. , Cheng, S.Y. , Li, J. , 2010. miR-182 as a prognostic marker for glioma progression and patient survival. Am. J. Pathol. 177, 29–38. [DOI] [PMC free article] [PubMed] [Google Scholar]
- Jiang, Q. , Wang, Y. , Hao, Y. , Juan, L. , Teng, M. , Zhang, X. , Li, M. , Wang, G. , Liu, Y. , 2009. miR2Disease: a manually curated database for microRNA deregulation in human disease. Nucleic Acids Res. 37, D98–D104. [DOI] [PMC free article] [PubMed] [Google Scholar]
- Kapsimali, M. , Kloosterman, W.P. , de Bruijn, E. , Rosa, F. , Plasterk, R.H. , Wilson, S.W. , 2007. MicroRNAs show a wide diversity of expression profiles in the developing and mature central nervous system. Genome Biol. 8, R173 [DOI] [PMC free article] [PubMed] [Google Scholar]
- Karsy, M. , Arslan, E. , Moy, F. , 2012. Current progress on understanding MicroRNAs in glioblastoma multiforme. Genes Cancer 3, 3–15. [DOI] [PMC free article] [PubMed] [Google Scholar]
- Kim, T.M. , Huang, W. , Park, R. , Park, P.J. , Johnson, M.D. , 2011. A developmental taxonomy of glioblastoma defined and maintained by MicroRNAs. Cancer Res. 71, 3387–3399. [DOI] [PMC free article] [PubMed] [Google Scholar]
- Lages, E. , Guttin, A. , El Atifi, M. , Ramus, C. , Ipas, H. , Dupre, I. , Rolland, D. , Salon, C. , Godfraind, C. , deFraipont, F. , Dhobb, M. , Pelletier, L. , Wion, D. , Gay, E. , Berger, F. , Issartel, J.P. , 2011. MicroRNA and target protein patterns reveal physiopathological features of glioma subtypes. PLoS One 6, e20600 [DOI] [PMC free article] [PubMed] [Google Scholar]
- Lang, M.F. , Yang, S. , Zhao, C. , Sun, G. , Murai, K. , Wu, X. , Wang, J. , Gao, H. , Brown, C.E. , Liu, X. , Zhou, J. , Peng, L. , Rossi, J.J. , Shi, Y. , 2012. Genome-wide profiling identified a set of miRNAs that are differentially expressed in glioblastoma stem cells and normal neural stem cells. PLoS One 7, e36248 [DOI] [PMC free article] [PubMed] [Google Scholar]
- Lavon, I. , Zrihan, D. , Granit, A. , Einstein, O. , Fainstein, N. , Cohen, M.A. , Zelikovitch, B. , Shoshan, Y. , Spektor, S. , Reubinoff, B.E. , Felig, Y. , Gerlitz, O. , Ben-Hur, T. , Smith, Y. , Siegal, T. , 2010. Gliomas display a microRNA expression profile reminiscent of neural precursor cells. Neuro Oncol. 12, 422–433. [DOI] [PMC free article] [PubMed] [Google Scholar]
- Lee, H. , Kim, K.R. , Cho, N.H. , Hong, S.R. , Jeong, H. , Kwon, S.Y. , Park, K.H. , An, H.J. , Kim, T.H. , Kim, I. , Yoon, H.K. , Suh, K.S. , Min, K.O. , Choi, H.J. , Park, J.Y. , Yoo, C.W. , Lee, Y.S. , Lee, H.J. , Lee, W.S. , Park, C.S. , Lee, Y. , 2014. MicroRNA expression profiling and Notch1 and Notch2 expression in minimal deviation adenocarcinoma of uterine cervix. World J. Surg. Oncol. 12, 334 [DOI] [PMC free article] [PubMed] [Google Scholar]
- Li, W.B. , Ma, M.W. , Dong, L.J. , Wang, F. , Chen, L.X. , Li, X.R. , 2011. MicroRNA-34a targets notch1 and inhibits cell proliferation in glioblastoma multiforme. Cancer Biol. Ther. 12, 477–483. [DOI] [PubMed] [Google Scholar]
- Li, Y. , Guessous, F. , Zhang, Y. , Dipierro, C. , Kefas, B. , Johnson, E. , Marcinkiewicz, L. , Jiang, J. , Yang, Y. , Schmittgen, T.D. , Lopes, B. , Schiff, D. , Purow, B. , Abounader, R. , 2009. MicroRNA-34a inhibits glioblastoma growth by targeting multiple oncogenes. Cancer Res. 69, 7569–7576. [DOI] [PMC free article] [PubMed] [Google Scholar]
- Lopez, J.P. , Lim, R. , Cruceanu, C. , Crapper, L. , Fasano, C. , Labonte, B. , Maussion, G. , Yang, J.P. , Yerko, V. , Vigneault, E. , El Mestikawy, S. , Mechawar, N. , Pavlidis, P. , Turecki, G. , 2014. miR-1202 is a primate-specific and brain-enriched microRNA involved in major depression and antidepressant treatment. Nat. Med. 20, 764–768. [DOI] [PMC free article] [PubMed] [Google Scholar]
- Luan, S. , Sun, L. , Huang, F. , 2010. MicroRNA-34a: a novel tumor suppressor in p53-mutant glioma cell line U251. Arch. Med. Res. 41, 67–74. [DOI] [PubMed] [Google Scholar]
- Malzkorn, B. , Wolter, M. , Liesenberg, F. , Grzendowski, M. , Stuhler, K. , Meyer, H.E. , Reifenberger, G. , 2010. Identification and functional characterization of microRNAs involved in the malignant progression of gliomas. Brain Pathol. 20, 539–550. [DOI] [PMC free article] [PubMed] [Google Scholar]
- Marino, A.L. , Evangelista, A.F. , Vieira, R.A. , Macedo, T. , Kerr, L.M. , Abrahao-Machado, L.F. , Longatto-Filho, A. , Silveira, H.C. , Marques, M.M. , 2014. MicroRNA expression as risk biomarker of breast cancer metastasis: a pilot retrospective case-cohort study. BMC Cancer 14, 739 [DOI] [PMC free article] [PubMed] [Google Scholar]
- Mizoguchi, M. , Guan, Y. , Yoshimoto, K. , Hata, N. , Amano, T. , Nakamizo, A. , Sasaki, T. , 2012. MicroRNAs in human malignant gliomas. J. Oncol. 2012, 732874 [DOI] [PMC free article] [PubMed] [Google Scholar]
- Mogilyansky, E. , Rigoutsos, I. , 2013. The miR-17/92 cluster: a comprehensive update on its genomics, genetics, functions and increasingly important and numerous roles in health and disease. Cell Death Differ. 20, 1603–1614. [DOI] [PMC free article] [PubMed] [Google Scholar]
- Moller, H.G. , Rasmussen, A.P. , Andersen, H.H. , Johnsen, K.B. , Henriksen, M. , Duroux, M. , 2013. A systematic review of microRNA in glioblastoma multiforme: micro-modulators in the mesenchymal mode of migration and invasion. Mol. Neurobiol. 47, 131–144. [DOI] [PMC free article] [PubMed] [Google Scholar]
- Moreau, M.P. , Bruse, S.E. , Jornsten, R. , Liu, Y. , Brzustowicz, L.M. , 2013. Chronological changes in microRNA expression in the developing human brain. PLoS One 8, e60480 [DOI] [PMC free article] [PubMed] [Google Scholar]
- Nikaki, A. , Piperi, C. , Papavassiliou, A.G. , 2012. Role of microRNAs in gliomagenesis: targeting miRNAs in glioblastoma multiforme therapy. Expert Opin. Investig. Drugs 21, 1475–1488. [DOI] [PubMed] [Google Scholar]
- Pang, Y. , Young, C.Y. , Yuan, H. , 2010. MicroRNAs and prostate cancer. Acta Biochim. Biophys. Sin. (Shanghai) 42, 363–369. [DOI] [PubMed] [Google Scholar]
- Patel, D. , Boufraqech, M. , Jain, M. , Zhang, L. , He, M. , Gesuwan, K. , Gulati, N. , Nilubol, N. , Fojo, T. , Kebebew, E. , 2013. MiR-34a and miR-483-5p are candidate serum biomarkers for adrenocortical tumors. Surgery 154, 1224–1228. discussion 1229 [DOI] [PMC free article] [PubMed] [Google Scholar]
- Poliseno, L. , Salmena, L. , Riccardi, L. , Fornari, A. , Song, M.S. , Hobbs, R.M. , Sportoletti, P. , Varmeh, S. , Egia, A. , Fedele, G. , Rameh, L. , Loda, M. , Pandolfi, P.P. , 2010. Identification of the miR-106b∼25 microRNA cluster as a proto-oncogenic PTEN-targeting intron that cooperates with its host gene MCM7 in transformation. Sci. Signal 3, ra29 [DOI] [PMC free article] [PubMed] [Google Scholar]
- Purow, B. , 2011. The elephant in the room: do microRNA-based therapies have a realistic chance of succeeding for brain tumors such as glioblastoma?. J. Neurooncol. 103, 429–436. [DOI] [PMC free article] [PubMed] [Google Scholar]
- Purow, B. , Schiff, D. , 2009. Advances in the genetics of glioblastoma: are we reaching critical mass?. Nat. Rev. Neurol. 5, 419–426. [DOI] [PMC free article] [PubMed] [Google Scholar]
- Qu, X. , Zhao, M. , Wu, S. , Yu, W. , Xu, J. , Li, J. , Chen, L. , 2014. Circulating microRNA 483-5p as a novel biomarker for diagnosis survival prediction in multiple myeloma. Med. Oncol. 31, 219 [DOI] [PubMed] [Google Scholar]
- Rao, S.A. , Santosh, V. , Somasundaram, K. , 2010. Genome-wide expression profiling identifies deregulated miRNAs in malignant astrocytoma. Mod. Pathol. 23, 1404–1417. [DOI] [PubMed] [Google Scholar]
- Sasayama, T. , Nishihara, M. , Kondoh, T. , Hosoda, K. , Kohmura, E. , 2009. MicroRNA-10b is overexpressed in malignant glioma and associated with tumor invasive factors, uPAR and RhoC. Int. J. Cancer 125, 1407–1413. [DOI] [PubMed] [Google Scholar]
- Schonberg, D.L. , Bao, S. , Rich, J.N. , 2013. Genomics informs glioblastoma biology. Nat. Genet. 45, 1105–1107. [DOI] [PubMed] [Google Scholar]
- Setty, M. , Helmy, K. , Khan, A.A. , Silber, J. , Arvey, A. , Neezen, F. , Agius, P. , Huse, J.T. , Holland, E.C. , Leslie, C.S. , 2012. Inferring transcriptional and microRNA-mediated regulatory programs in glioblastoma. Mol. Syst. Biol. 8, 605 [DOI] [PMC free article] [PubMed] [Google Scholar]
- Shao, N.Y. , Hu, H.Y. , Yan, Z. , Xu, Y. , Hu, H. , Menzel, C. , Li, N. , Chen, W. , Khaitovich, P. , 2010. Comprehensive survey of human brain microRNA by deep sequencing. BMC Genomics 11, 409 [DOI] [PMC free article] [PubMed] [Google Scholar]
- Shen, J. , Wang, A. , Wang, Q. , Gurvich, I. , Siegel, A.B. , Remotti, H. , Santella, R.M. , 2013. Exploration of genome-wide circulating microRNA in hepatocellular carcinoma: MiR-483-5p as a potential biomarker. Cancer Epidemiol. Biomarkers Prev. 22, 2364–2373. [DOI] [PMC free article] [PubMed] [Google Scholar]
- Silber, J. , Lim, D.A. , Petritsch, C. , Persson, A.I. , Maunakea, A.K. , Yu, M. , Vandenberg, S.R. , Ginzinger, D.G. , James, C.D. , Costello, J.F. , Bergers, G. , Weiss, W.A. , Alvarez-Buylla, A. , Hodgson, J.G. , 2008. miR-124 and miR-137 inhibit proliferation of glioblastoma multiforme cells and induce differentiation of brain tumor stem cells. BMC Med. 6, 14 [DOI] [PMC free article] [PubMed] [Google Scholar]
- Skalsky, R.L. , Cullen, B.R. , 2011. Reduced expression of brain-enriched microRNAs in glioblastomas permits targeted regulation of a cell death gene. PLoS One 6, e24248 [DOI] [PMC free article] [PubMed] [Google Scholar]
- Slaby, O. , Lakomy, R. , Fadrus, P. , Hrstka, R. , Kren, L. , Lzicarova, E. , Smrcka, M. , Svoboda, M. , Dolezalova, H. , Novakova, J. , Valik, D. , Vyzula, R. , Michalek, J. , 2010. MicroRNA-181 family predicts response to concomitant chemoradiotherapy with temozolomide in glioblastoma patients. Neoplasma 57, 264–269. [DOI] [PubMed] [Google Scholar]
- Srinivasan, S. , Patric, I.R. , Somasundaram, K. , 2011. A ten-microRNA expression signature predicts survival in glioblastoma. PLoS One 6, e17438 [DOI] [PMC free article] [PubMed] [Google Scholar]
- Stupp, R. , Mason, W.P. , van den Bent, M.J. , Weller, M. , Fisher, B. , Taphoorn, M.J. , Belanger, K. , Brandes, A.A. , Marosi, C. , Bogdahn, U. , Curschmann, J. , Janzer, R.C. , Ludwin, S.K. , Gorlia, T. , Allgeier, A. , Lacombe, D. , Cairncross, J.G. , Eisenhauer, E. , Mirimanoff, R.O. , 2005. Radiotherapy plus concomitant and adjuvant temozolomide for glioblastoma. N. Engl. J. Med. 352, 987–996. [DOI] [PubMed] [Google Scholar]
- Sun, H.B. , Chen, X. , Ji, H. , Wu, T. , Lu, H.W. , Zhang, Y. , Li, H. , Li, Y.M. , 2014. miR494 is an independent prognostic factor and promotes cell migration and invasion in colorectal cancer by directly targeting PTEN. Int. J. Oncol. 45, 2486–2494. [DOI] [PubMed] [Google Scholar]
- Tang, W. , Duan, J. , Zhang, J.G. , Wang, Y.P. , 2013. Subtyping glioblastoma by combining miRNA and mRNA expression data using compressed sensing-based approach. EURASIP J. Bioinform. Syst. Biol. 2013, 2 [DOI] [PMC free article] [PubMed] [Google Scholar]
- Verhaak, R.G. , Hoadley, K.A. , Purdom, E. , Wang, V. , Qi, Y. , Wilkerson, M.D. , Miller, C.R. , Ding, L. , Golub, T. , Mesirov, J.P. , Alexe, G. , Lawrence, M. , O'Kelly, M. , Tamayo, P. , Weir, B.A. , Gabriel, S. , Winckler, W. , Gupta, S. , Jakkula, L. , Feiler, H.S. , Hodgson, J.G. , James, C.D. , Sarkaria, J.N. , Brennan, C. , Kahn, A. , Spellman, P.T. , Wilson, R.K. , Speed, T.P. , Gray, J.W. , Meyerson, M. , Getz, G. , Perou, C.M. , Hayes, D.N. , 2010. Integrated genomic analysis identifies clinically relevant subtypes of glioblastoma characterized by abnormalities in PDGFRA, IDH1, EGFR, and NF1. Cancer Cell 17, 98–110. [DOI] [PMC free article] [PubMed] [Google Scholar]
- Visani, M. , de Biase, D. , Marucci, G. , Cerasoli, S. , Nigrisoli, E. , Bacchi Reggiani, M.L. , Albani, F. , Baruzzi, A. , Pession, A. , 2014. Expression of 19 microRNAs in glioblastoma and comparison with other brain neoplasia of grades I-III. Mol. Oncol. 8, 417–430. [DOI] [PMC free article] [PubMed] [Google Scholar]
- Visani, M. , de Biase, D. , Marucci, G. , Taccioli, C. , Baruzzi, A. , Pession, A. , 2013. Definition of miRNAs expression profile in glioblastoma samples: the relevance of non-neoplastic brain reference. PLoS One 8, e55314 [DOI] [PMC free article] [PubMed] [Google Scholar]
- Vo, N. , Klein, M.E. , Varlamova, O. , Keller, D.M. , Yamamoto, T. , Goodman, R.H. , Impey, S. , 2005. A cAMP-response element binding protein-induced microRNA regulates neuronal morphogenesis. Proc. Natl. Acad. Sci. U S A 102, 16426–16431. [DOI] [PMC free article] [PubMed] [Google Scholar]
- Wang, M. , Li, C. , Nie, H. , Lv, X. , Qu, Y. , Yu, B. , Su, L. , Li, J. , Chen, X. , Ju, J. , Yu, Y. , Yan, M. , Gu, Q. , Zhu, Z. , Liu, B. , 2012. Down-regulated miR-625 suppresses invasion and metastasis of gastric cancer by targeting ILK. FEBS Lett. 586, 2382–2388. [DOI] [PubMed] [Google Scholar]
- Yan, H.L. , Xue, G. , Mei, Q. , Wang, Y.Z. , Ding, F.X. , Liu, M.F. , Lu, M.H. , Tang, Y. , Yu, H.Y. , Sun, S.H. , 2009. Repression of the miR-17-92 cluster by p53 has an important function in hypoxia-induced apoptosis. EMBO J. 28, 2719–2732. [DOI] [PMC free article] [PubMed] [Google Scholar]
- Yan, W. , Li, R. , Liu, Y. , Yang, P. , Wang, Z. , Zhang, C. , Bao, Z. , Zhang, W. , You, Y. , Jiang, T. , 2014. MicroRNA expression patterns in the malignant progression of gliomas and a 5-microRNA signature for prognosis. Oncotarget 5, 12908–12915. [DOI] [PMC free article] [PubMed] [Google Scholar]
- Zhang, B. , Chen, J. , Ren, Z. , Chen, Y. , Li, J. , Miao, X. , Song, Y. , Zhao, T. , Li, Y. , Shi, Y. , Ren, D. , Liu, J. , 2013. A specific miRNA signature promotes radioresistance of human cervical cancer cells. Cancer Cell Int. 13, 118 [DOI] [PMC free article] [PubMed] [Google Scholar]
- Zhang, Y. , Dutta, A. , Abounader, R. , 2012. The role of microRNAs in glioma initiation and progression. Front. Biosci. 17, 700–712. [DOI] [PMC free article] [PubMed] [Google Scholar]
- Zhou, J. , Wang, W. , Gao, Z. , Peng, X. , Chen, X. , Chen, W. , Xu, W. , Xu, H. , Lin, M.C. , Jiang, S. , 2013. MicroRNA-155 promotes glioma cell proliferation via the regulation of MXI1. PLoS One 8, e83055 [DOI] [PMC free article] [PubMed] [Google Scholar]
- Zhou, Y. , Hu, Y. , Yang, M. , Jat, P. , Li, K. , Lombardo, Y. , Xiong, D. , Coombes, R.C. , Raguz, S. , Yague, E. , 2014. The miR-106b∼25 cluster promotes bypass of doxorubicin-induced senescence and increase in motility and invasion by targeting the E-cadherin transcriptional activator EP300. Cell Death Differ. 21, 462–474. [DOI] [PMC free article] [PubMed] [Google Scholar]
Associated Data
This section collects any data citations, data availability statements, or supplementary materials included in this article.
Supplementary Materials
The following are the supplementary data related to this article:
Supplementary data
Supplementary data
Supplementary data
Supplementary data
Supplementary data
Supplementary data