Abstract
Background:
At the annual National Football League (NFL) Scouting Combine, the medical staff of each NFL franchise performs a comprehensive medical evaluation of all athletes potentially entering the NFL. Currently, little is known regarding the overall epidemiology of injuries identified at the combine and their impact on NFL performance.
Purpose:
To determine the epidemiology of injuries identified at the combine and their impact on initial NFL performance.
Study Design:
Cohort study; Level of evidence, 3.
Methods:
All previous musculoskeletal injuries identified at the NFL Combine from 2009 to 2015 were retrospectively reviewed. Medical records and imaging reports were examined. Game statistics for the first 2 seasons of NFL play were obtained for all players from 2009 to 2013. Analysis of injury prevalence and overall impact on the draft status and position-specific performance metrics of each injury was performed and compared with a position-matched control group with no history of injury or surgery.
Results:
A total of 2203 athletes over 7 years were evaluated, including 1490 (67.6%) drafted athletes and 1040 (47.2%) who ultimately played at least 2 years in the NFL. The most common sites of injury were the ankle (1160, 52.7%), shoulder (1143, 51.9%), knee (1128, 51.2%), spine (785, 35.6%), and hand (739, 33.5%). Odds ratios (ORs) demonstrated that quarterbacks were most at risk of shoulder injury (OR, 2.78; P = .001), while running backs most commonly sustained ankle (OR, 1.39; P = .040) and shoulder injuries (OR, 1.55; P = .020) when compared with all other players. Ultimately, defensive players demonstrated a greater negative impact due to injury than offensive players, with multiple performance metrics significantly affected for each defensive position analyzed, whereas skilled offensive players (eg, quarterbacks, running backs) demonstrated only 1 metric significantly affected at each position.
Conclusion:
The most common sites of injury identified at the combine were (1) ankle, (2) shoulder, (3) knee, (4) spine, and (5) hand. Overall, performance in the NFL tended to worsen with injury history, with a direct correlation found between injury at a certain anatomic location and position of play. Defensive players tended to perform worse compared with offensive players if injury history was present.
Keywords: football (American), National Football League, injury rate, epidemiology
American collegiate football players are at significant risk for bodily injury because of the physical nature and high-energy contact of the sport. In a field of over 60,000 participants, the incidence of injuries sustained by National Collegiate Athletic Association (NCAA) college football players has been estimated to be 9.2 injuries per 1000 athletes.11 Although injuries undoubtedly vary in severity, they may dramatically affect an athlete’s future playing potential and possibly have detrimental effects on his future health.1 Furthermore, injuries leading to structural abnormalities may necessitate surgical intervention in order for the athlete to return to optimal function.7,10,12 An understanding of the natural history of injuries sustained by these high-level athletes will give insight into the recovery process as well as better educate athletes and physicians on the risk of long-term complications and limitations.
The National Football League (NFL) holds an annual scouting combine for prospective student-athletes attempting to pursue a professional football career. In addition to serving as an opportunity for athletes to demonstrate their ability and strength, the NFL Scouting Combine serves as a chance for the medical staff of NFL teams to evaluate each prospect. Each NFL team independently reviews an athlete’s prior medical and surgical history, evaluates all available imaging studies, and performs a thorough orthopaedic examination. Once a team completes this process, the assessment will be taken into account when determining a player’s overall draft position. Although prior studies have sought to correlate the impact of specific, more severe injuries3,5 on a player’s potential career, relatively little is known regarding the impact of any injury history stratified by anatomic location on performance in the initial NFL career of prospective players.5,6 The purpose of this study was to determine the epidemiology of injuries by anatomic location, regardless of severity, as assessed at the NFL Scouting Combine and analyze the subsequent impact of any injury history on initial NFL performance.
Methods
Data Collection
Following approval from the institutional review board, the NFL Players Association, and the NFL Physicians Society Research Committee, a retrospective review of all prior or current injures identified at the NFL Scouting Combine was conducted. Inclusion criteria consisted of any offensive or defensive player (special teams athletes were excluded) who participated in medical and performance testing at the NFL Combine from 2009 to 2015. Medical records, imaging reports, physical examination findings, and self-reported history forms were examined to characterize each athlete’s collegiate injuries and their impact on collegiate play. The medical staff of all 32 NFL teams performed the musculoskeletal evaluations, and a single comprehensive orthopaedic note was dictated after all teams examined the athlete.
Demographic data, including collegiate position, college, and date of birth, were recorded, while overall draft pick number was determined from STATS.com. To characterize initial NFL performance, performance metrics for the first 2 seasons of NFL play, including games played, games started, and position-specific statistics, were obtained for all players who attended the NFL Combine from 2009 to 2013. Position-specific performance metrics were selected based on informal consultation with experts in the field, in order to identify metrics that were both variable among players and reliably used by NFL teams in their scouting efforts. All NFL performance data were obtained from STATS.com.
Statistical Analysis
To determine the epidemiology of prior or current injuries identified at the NFL Scouting Combine and their impact on NFL performance, a comprehensive statistical analysis was conducted. First, summary statistics were computed to determine the 5 most common anatomic locations of injury, both overall and by position. The impact of an injury to a specific site location on collegiate play was determined by measuring the number of missed games due to an injury at the location. The impact on draft position and NFL performance was also described.
To measure performance, the following position-specific performance metrics were recorded by position:
Quarterbacks: quarterback rating, yards per attempt, touchdowns
Wide receivers and tight ends: receptions, yards per reception, touchdowns
Running backs: attempts, yards per attempt
Offensive linemen: yards due to penalty, sacks allowed
Defensive backs: interception, passes deflected, tackles
Defensive linemen: tackles, quarterback hits, sacks
Linebackers: tackles, forced fumbles, tackles for loss
Furthermore, each anatomic location was subdivided into the most common specific injuries (ie, medial meniscus injury), and summary statistics regarding prevalence, associated missed games, and impact on draft status were computed for the most common specific injuries within each anatomic location. Additionally, logistic regression was utilized to calculate odds ratios (ORs) to evaluate the risk of suffering an injury at a specific anatomic location relative to all other positions. The impact of injuries to the most common anatomic locations on NFL performance was then assessed by position relative to controls. The control group was selected based on fulfillment of the following criteria: (1) no history of injury to respective location, (2) no significant missed time (≤2 total missed games in college), (3) no history of any prior surgery at any anatomic location, and (4) played the same position. The control group included players from the same series of years, but it was not matched to the same draft round. However, the control group included an equal distribution across the draft rounds in order to appropriately reflect a normal distribution of talent. Players who participated in the 2014 and 2015 NFL Combines were excluded from performance outcomes analysis, as they could not have completed 2 seasons in the NFL at the time of analysis. In addition, outcomes were not evaluated for players who participated in the NFL Combine from 2009 to 2013 but did not play at least 2 seasons in the NFL.
Two-sample, 2-tailed t tests were computed to assess differences between the NFL career group and the control group in draft position, number of games played and started, as well as position-specific performance in the first 2 seasons.
Results
The study group consisted of 2203 athletes who participated in the NFL Scouting Combine between the years 2009 and 2015—an estimated 315 athletes per year. Of these athletes, 1490 (67.6%) were drafted, with a mean overall pick number of 114.7 ± 71. Offensive players (n = 744, 63.3%) were less likely to be drafted compared with defensive players (n = 746, 72.6%). The mean overall pick did not differ significantly among offensive (116.5 ± 70.9) and defensive players (113 ± 71) (Table 1). Overall, 972 (44.1%) players missed ≤2 total games and had no prior history of surgery at any anatomic location, thereby meeting preliminary study criteria for the control group. The impact of injury on the athletes’ collegiate career is summarized in Appendix Table A1.
TABLE 1.
Draft Status by NFL Combine Class, 2009-2015 (N = 2203)a
| Total, n (%) | Undrafted, n (%) | Drafted, n (%) | Pick Number per Draft Class, Mean ± SD | |
|---|---|---|---|---|
| All athletes | 2203 | 713 (32.4) | 1490 (67.6) | 114.7 ± 71.0 |
| Draft class | ||||
| 2009 | 311 (14.1) | 106 (34.1) | 205 (65.9) | 117.2 ± 73.1 |
| 2010 | 315 (14.3) | 104 (33.0) | 211 (67.0) | 112.3 ± 70.9 |
| 2011 | 320 (14.5) | 103 (32.2) | 217 (67.8) | 114.0 ± 69.4 |
| 2012 | 313 (14.2) | 103 (32.9) | 210 (69.1) | 117.1 ± 72.0 |
| 2013 | 317 (14.4) | 100 (31.6) | 217 (68.5) | 115.8 ± 71.7 |
| 2014 | 324 (14.7) | 101 (31.2) | 223 (68.8) | 114.4 ± 70.1 |
| 2015 | 303 (13.8) | 96 (31.7) | 207 (68.3) | 112.4 ± 70.4 |
| Position | ||||
| Offense | 1175 (53.3) | 431 (36.7) | 744 (63.3) | 116.5 ± 70.9 |
| Defense | 1028 (46.7) | 282 (27.4) | 746 (72.6) | 113.0 ± 71.0 |
aNFL, National Football League.
Injury Location
Analysis of all offensive and defensive players who participated in the NFL Combine from 2009 to 2015 demonstrated that the 5 most common locations for injury were the ankle (n = 1160, 52.7%), shoulder (n = 1143, 51.9%), knee (n = 1128, 51.2%), spine (n = 785, 35.6%), and hand (n = 739, 33.5%) (Table 2). Among all athletes, the average number of injuries sustained per athlete was 3.8 ± 1.8. Each anatomic location was then subdivided into the most common specific injuries sustained, as summarized in Table 2.
TABLE 2.
Characterization of Select Common Collegiate Football Injuries as Identified at the NFL Combine, 2009-2015 (N = 2203)a
| Injury Location and Type | Injury, n (%) | Surgery, n (%) | Collegiate Games Missed, Mean ± SD | Undrafted Athletes, n (%) | Pick Number per Draft Class, Mean ± SD |
|---|---|---|---|---|---|
| Shoulder (n = 1143, 51.9%) | 1143 (100.0) | 360 (31.5) | 0.6 ± 2.2 | 388 (33.9) | 119.9 ± 72.2 |
| Acromioclavicular joint | 527 (46.1) | 33 (6.3) | 0.2 ± 0.9 | 189 (35.9) | 117.8 ± 71.6 |
| Posterior labrum | 90 (7.9) | 55 (61.1) | 1.1 ± 3.1 | 26 (28.9) | 107 ± 67.2 |
| Anterior labrum | 77 (6.7) | 60 (77.9) | 1.7 ± 4.2 | 25 (32.5) | 116.8 ± 70.4 |
| Ankle (n = 1160, 52.7%) | 1160 (100.0) | 132 (11.4) | 0.8 ± 1.9 | 386 (33.3) | 115.2 ± 69.0 |
| Low ankle sprain | 694 (59.8) | 11 (1.6) | 0.4 ± 1.2 | 222 (31.9) | 112.7 ± 69.6 |
| High ankle sprain | 240 (20.7) | 18 (7.5) | 1.2 ± 1.9 | 80 (33.3) | 116.8 ± 66.8 |
| Ankle fracture | 64 (5.5) | 45 (70.3) | 1.8 ± 3.2 | 21 (32.8) | 114.8 ± 77.2 |
| Knee (n = 1128, 51.2%) | 1128 (100.0) | 525 (46.5) | 1.7 ± 3.5 | 379 (33.6) | 118.4 ± 72.3 |
| Medial collateral ligament | 335 (29.7) | 16 (4.8) | 0.9 ± 1.8 | 104 (31.0) | 119.4 ± 72.2 |
| Lateral meniscus | 176 (15.6) | 148 (84.1) | 1.0 ± 2.2 | 70 (39.8) | 119.8 ± 71.7 |
| Medial meniscus | 88 (7.8) | 64 (72.7) | 1.1 ± 3.0 | 33 (37.5) | 129.5 ± 76.6 |
| Hand (n = 739, 33.5%) | 739 (100.0) | 166 (22.5) | 0.2 ± 0.9 | 223 (30.2) | 113 ± 69.3 |
| MC/PIP dislocation | 172 (23.3) | 8 (4.7) | 0.1 ± 0.5 | 55 (31.9) | 114.3 ± 69.2 |
| Metacarpal fracture | 111 (15.0) | 29 (26.1) | 0.3 ± 1.1 | 35 (31.5) | 102.4 ± 69.6 |
| Cervical spine (n = 384, 17.4%) | 384 (100.0) | 5 (1.3) | 0.3 ± 1.3 | 115 (29.9) | 115.9 ± 69 |
| Stinger | 239 (62.2) | 0 (0) | 0.1 ± 0.7 | 63 (26.4) | 117.7 ± 71.5 |
| Pain or tightness | 28 (7.3) | 1 (3.6) | 0.5 ± 1.4 | 6 (21.4) | 121.2 ± 69.1 |
| Lumbal spine (n = 401, 18.2%) | 401 (100.0) | 25 (6.2) | 0.4 ± 1.7 | 140 (34.9) | 109.5 ± 74.4 |
| Tightness or spasm | 122 (30.4) | 1 (0.8) | 0.1 ± 0.5 | 49 (40.2) | 111.5 ± 73.4 |
| Degenerative changes | 30 (7.4) | 7 (23.3) | 0.7 ± 2.8 | 9 (30.0) | 97.7 ± 78.8 |
| Hamstring (n = 536, 24.3%) | 536 (100.0) | 0 (0) | 0.4 ± 1.1 | 178 (33.2) | 116.2 ± 69.0 |
aMC, metacarpal; NFL, National Football League; PIP, proximal interphalangeal.
Of all ankle injuries, most were predominately low ankle sprains (n = 694, 59.8%) and high (n = 240, 20.7%) ankle sprains, while shoulder injuries most commonly involved the acromioclavicular joint (n = 527, 46.1%), posterior labrum (n = 90, 7.9%), and anterior labrum (n = 77, 6.7%). Knee injuries involved the medial collateral ligament (n = 335, 29.7%), lateral meniscus (n = 176, 15.6%), and medial meniscus (n = 88, 7.8%). Moreover, the cervical (n = 384, 48.9%) and lumbar (n = 401, 51.1%) spines were involved at approximately equal frequencies, with stingers (n = 239, 30.4%) and lower back spasms (n = 122, 15.5%) comprising the highest incidences of injury at each location, respectively. In all cases of hand injuries, dislocation of the metacarpals and proximal interphalangeal joints (n = 172, 23.3%) were most commonly reported.
Impact of Injury on Collegiate Career
An analysis of total collegiate games showed that players missed a mean of 2.7 ± 4.3 games during a collegiate career, with no significant difference between games missed for offensive compared with defensive players (2.8 ± 4.3 versus 2.7 ± 4.4, respectively). Total collegiate games missed by those players ultimately drafted was 2.5 ± 4.0, while total collegiate games missed by those players undrafted was 3.3 ± 4.9 (P < .001). There was no significant difference in the number of injuries sustained during college among drafted (3.9 ± 1.8) and undrafted players (3.8 ± 1.7) (P = .277). Approximately one-third of all athletes sustaining injuries to these common anatomic locations during their collegiate career were undrafted after their participation in the NFL Scouting Combine.
Certain position and injury combinations also negatively affected an athlete’s overall draft position. Most notably, defensive linemen with shoulder injuries were noted to be drafted significantly later than their controls (115.9 vs 91.1, P = .044), while offensive linemen with shoulder injuries demonstrated a similar trend (122.9 vs 96.1, P = .037). Offensive linemen were also noted to have their draft position significantly affected in the presence of a prior knee injury compared with controls (123.2 vs 94.3, P = .021). Although other injury/position combinations demonstrated trends toward negatively affecting an athlete’s draft position, only defensive and offensive linemen were found to have associated effects that reached statistical significance.
Risk of Injury by Position
When injury was analyzed by player position, the 5 common injury locations remained relatively constant throughout, with the only exception found among the offensive speed position players (running backs, tight ends, and wide receivers). These groups of athletes were noted to have a slightly greater prevalence of hamstring injuries compared with other positions. In addition, players at these positions had a lower frequency of spine injuries compared with defensive linemen, defensive backs, linebackers, offensive linemen, and quarterbacks.
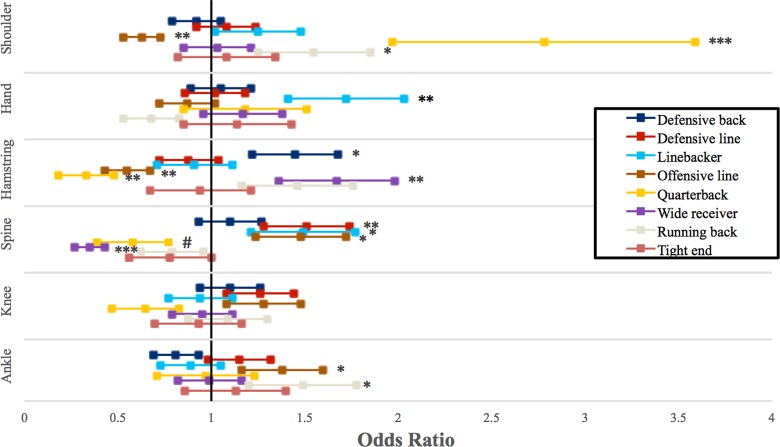
ORs were calculated in order to stratify risk of specific injury by position (Figure 1). Quarterbacks were more likely to have a shoulder injury (OR, 2.78; P = .001). Defensive linemen (OR, 1.51; P = .006) and offensive linemen (OR, 1.48; P = .017), as well as linebackers (OR, 1.49; P = .030) were each found to have a higher likelihood for spinal injuries relative to all other players. Linebackers were at increased risk for hand injuries (OR, 1.72; P = .003), and running backs were found to have a higher likelihood of sustaining shoulder (OR, 1.55; P = .020) and ankle injuries (OR, 1.39; P = .040) in college.
Figure 1.
Risk of collegiate football injuries by position as identified in offensive and defensive players who participated in medical and performance testing at the NFL Combine, 2009 to 2015. *P < .05; **P < .01; ***P < .001.
Impact on Performance
Of the 1576 athletes who participated in the NFL Scouting Combine from 2009 to 2013, 66% ultimately played in each of their first 2 NFL seasons, with offensive players demonstrating less play (60.6%) than defensive players (72.3%) (P < .001). Accordingly, defensive players played more games than offensive players (23.2 ± 7.8 vs 21.9 ± 8.0, P = .004), yet they started fewer games (P = .05). The total number of games played and started (both P < .001) varied among offensive positions; similar differences were not observed among defensive positions. Between cases and controls, there were significant differences among defensive players in terms of the number of games played (P = .001) and games started (P < .001). Significant differences in outcomes were not observed between offensive cases and controls. Offensive players started more games than defensive players (P = .005), yet defensive players were more likely to play 2 years in the NFL (P < .001). Among controls, defensive players played more games in their first 2 seasons (P = .003) compared with offensive players (Table 3).
TABLE 3.
NFL Participation and Performance in Athletes Who Attended the NFL Combine From 2009 to 2013 (N = 1576)a
| 2009-2013 Combine, n (%) | ≥2 y in NFL, n (%) | Games Played, Mean ± SD | Games Started, Mean ± SD | |||||
|---|---|---|---|---|---|---|---|---|
| Cases | Controls | Cases | Controls | Cases | Controls | Cases | Controls | |
| All players | 875 (55.5) | 701 (44.5) | 552 (63.2) | 488 (69.6) | 21.9 ± 8.0 | 23.3 ± 7.8 | 8.9 ± 9.7 | 10.5 ± 10.4 |
| Offense | 494 (58.8) | 346 (41.2) | 288 (58.4) | 220 (63.6) | 21.6 ± 8.1 | 22.3 ± 7.9 | 9.9 ± 9.9 | 10.5 ± 10.2 |
| Offensive line | 158 (58.7) | 111(41.3) | 87 (55.1) | 71 (64.0) | 21.7 ± 8.4 | 21.1 ± 8.3 | 13.9 ± 11.4 | 14.2 ± 11.2 |
| Quarterback | 44 (47.8) | 48 (52.2) | 21 (47.7) | 19 (39.6) | 16.9 ± 9.3 | 17.8 ± 10.0 | 13.1 ± 11.1 | 13.4 ± 12.3 |
| Running back | 120 (71.0) | 49 (23.0) | 77 (64.7) | 34 (69.4) | 21.1 ± 8.3 | 22.4 ± 6.2 | 5.5 ± 7.3 | 5.7 ± 8.0 |
| Tight end | 59 (64.8) | 32 (35.2) | 39 (66.1) | 26 (81.3) | 23.0 ± 7.3 | 24.6 ± 7.3 | 9.9 ± 8.4 | 9.0 ± 6.7 |
| Wide receiver | 113 (51.6) | 106 (48.4) | 64 (56.6) | 70 (66.0) | 22.9 ± 6.8 | 23.7 ± 7.4 | 9.0 ± 8.7 | 9.0 ± 9.1 |
| Defense | 381 (51.7) | 355 (48.2) | 264 (69.3) | 268 (75.5) | 22.2 ± 7.9 | 24.2 ± 7.6 | 7.8 ± 9.3 | 10.5 ± 10.5 |
| Defensive back | 148 (50.9) | 143 (49.1) | 96 (64.9) | 107 (74.8) | 22.1 ± 7.6 | 24.2 ± 7.3 | 8.5 ± 9.3 | 9.9 ± 9.7 |
| Defensive line | 137 (49.8) | 138 (50.2) | 98 (71.5) | 107 (77.5) | 21.7 ± 8.2 | 23.8 ± 8.2 | 6.7 ± 8.5 | 10.3 ± 10.7 |
| Linebacker | 96 (56.5) | 74 (43.5) | 70 (72.9) | 54 (73.0) | 22.9 ± 8.0 | 25.1 ± 7.2 | 8.5 ± 10.2 | 12.3 ± 11.9 |
aPlayers who participated in the 2014 and 2015 NFL Combines were excluded from outcomes analysis since they were unable to compete in ≥2 NFL seasons to allow for adequate data production. NFL, National Football League.
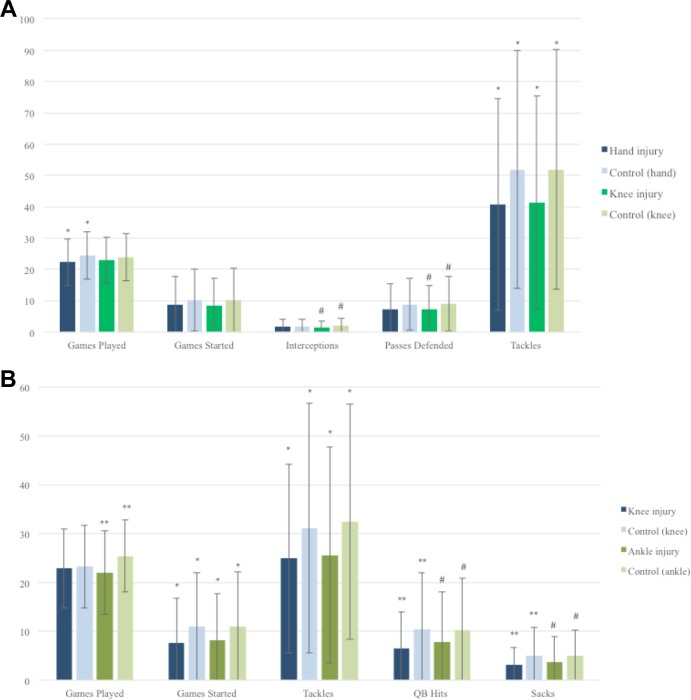
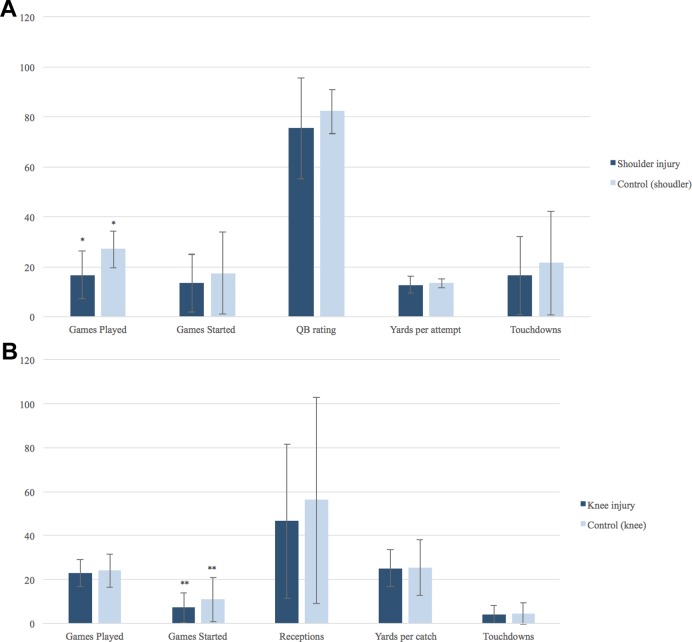
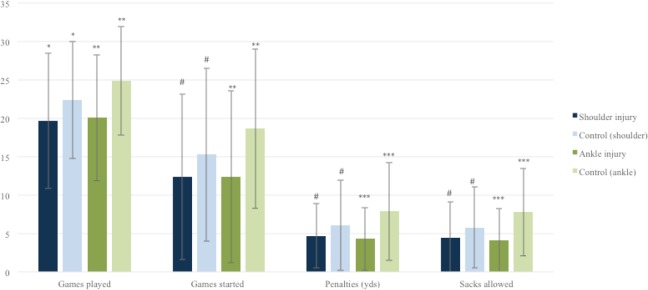
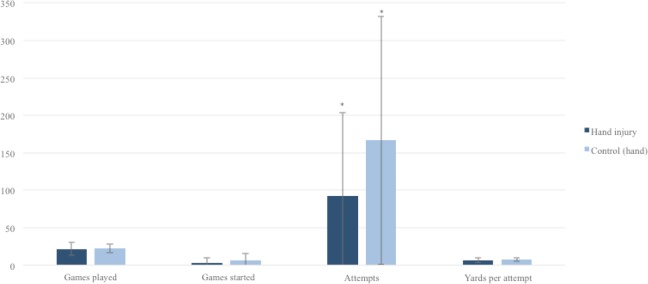
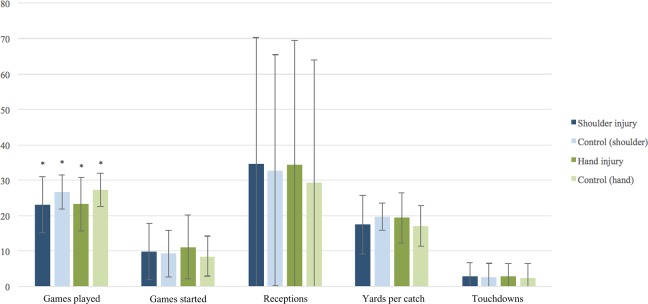
Positional analysis of the impact of prior or current injuries identified at the NFL Scouting Combine on an athlete’s performance and playing time during his first 2 seasons in the NFL demonstrates significant differences between those players with a prior history of injury and their positional control group. Figures 2 and 3 identify the most negatively impactful injuries in defensive backs, defensive linemen, quarterbacks, and wide receivers, and they illustrate how these injuries negatively affected in-game play based on position-specific performance metrics.
Figure 2.
(A) Defensive backs: impact of hand and knee injuries on National Football League (NFL) performance. Overall, 33% (n = 78) of defensive backs had a hand injury, with a mean overall pick of 109.7 ± 58.4 compared with controls (112.6 ± 68.6, P = .78). A total of 51% (n = 120) of defensive backs had a knee injury, with a mean overall pick of 118.8 ± 69.4 compared with controls (111.6 ± 63.4) (P = .49). Defensive backs with a hand or knee injury missed 0.1 ± 0.5 and 1.2 ± 2.6 games in college, respectively. # P < .1; *P < .05. (B) Defensive linemen: impact of knee and ankle injuries on NFL performance. A total of 54% (n = 124) of defensive linemen had a knee injury, with a mean overall pick of 114.9 ± 76.0 compared with controls (96.5 ± 76.5, P = .12). In all, 53% (n = 122) of linemen had an ankle injury, with a mean overall pick of 107.9 ± 74.6 compared with controls (100.2 ± 75.6, P = .54). Defensive linemen with a knee or ankle injury missed 1.6 ± 3.5 and 0.6 ± 1.6 games in college, respectively. # P < .1; *P < .05; **P < .01. QB, quarterback.
Figure 3.
(A) Quarterbacks: impact of shoulder injuries on National Football League (NFL) performance. A total of 71% (n = 42) of quarterbacks had a shoulder injury, with a mean overall pick of 110.1 ± 81.8 compared with controls (107.9 ± 76.0) (P = .94). Quarterbacks with a shoulder injury missed 1.0 ± 2.1 games in college. *P < .05. (B) Wide receivers: impact of knee injuries on NFL performance. A total of 48% (n = 75) of wide receivers had a knee injury, with a mean overall pick of 120.8.1 ± 71.2 compared with controls (100.0 ± 66.3, P = .13). Wide receivers with a knee injury missed 1.0 ± 2.1 games in college. **P < .01. QB, quarterback.
Defensive Players
Defensive backs (n = 236) were found to be most negatively affected by knee (n = 120, 50.8%) and hand injuries (n = 78, 33.1%). Findings demonstrated fewer tackles recorded (P = .030) for those with knee injuries and significantly fewer games played (P = .045) as well as fewer tackles recorded (P = .035) in defensive backs with hand injuries (Figure 2A).
Defensive linemen (n = 231) were most affected by knee (n = 124, 53.7%) and ankle injuries (n = 122, 52.8%). At this position, knee injuries led to fewer games started (P = .017), fewer mean tackles (P = .035), fewer quarterback hits (P = .004), and fewer mean sacks (P = .003), while ankle injuries led to fewer games played (P = .007), fewer games started (P = .049), and fewer mean tackles (P = .043) (Figure 2B).
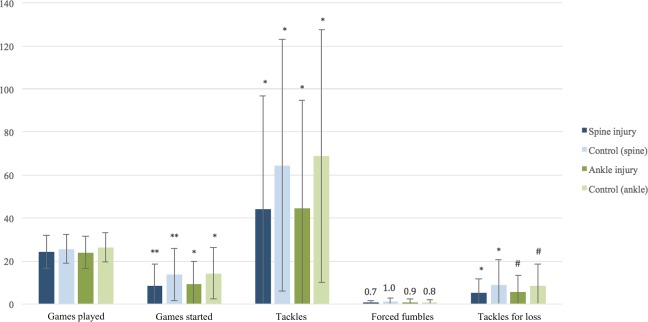
Linebackers (n = 139) were most affected by spine (n = 92, 39.8%) and ankle (n = 66, 47.5%) injuries, as both injuries led to fewer games started (P = .014 and .023, respectively) and fewer overall tackles (P = .048 and .024, respectively) (Appendix Figure A1).
Offensive Players
Offensive linemen (n = 190) were most negatively affected by shoulder (n = 73, 38.6%) injuries, as this led to fewer games played (P = .04) during the first 2 seasons in the NFL compared with controls. Interestingly, ankle injuries (n = 108, 56.5%) also led to fewer games played (P = .002), yet resulted in fewer penalty yards (P < .001) and fewer sacks allowed (P < .001) compared with controls (Appendix Figure A2).
Quarterbacks (n = 59) were most negatively affected by shoulder injuries during their first 2 seasons in the NFL (n = 42, 71.2%). Despite this high percentage, the only identified difference in outcome when compared with controls was fewer games played during the first 2 years: 16.7 ± 9.9 compared with 27 ± 7.4 (P = .024) (Figure 3A).
Wide receivers (n = 157) were most notably affected by knee injuries (n = 75, 47.8%), as they led to significantly fewer games started during their first 2 years: 7.2 ± 6.8 compared with 10.9 ± 10.1 (P = .012) (Figure 3B).
Running backs (n = 124) most commonly sustained injuries involving the shoulder (n = 72, 58.1%) and ankle (n = 73, 58.9%). However, neither injury location was found to affect performance. Although hand injuries were less common (n = 31, 25%), they were found to lead to fewer carries (P = .030) and fewer total yards (P = .030) when compared with the control group. In all, 31.5% (n = 39) of running backs had a prior or current hamstring injury at the NFL Scouting Combine, yet 74.4% (n = 29) missed 0 games due to the injury while in the NFL (Appendix Figure A3).
Tight ends (n = 72) were most negatively affected by shoulder (n = 36, 50%) and hand (n = 25, 35%) injuries during their first 2 NFL seasons. Both injuries were found to lead to significantly fewer games played when compared with their position-matched controls (P = .050 and .040, respectively) (Appendix Figure A4).
Discussion
The principal finding of this study demonstrates that performance in the NFL is significantly affected by history of prior injury. The number of games missed in college were found to be the most reliable indicator of an athlete’s ultimately being drafted into the NFL. This is expected given that more serious injuries typically require longer periods of recovery and are more likely to have a notable impact on career performance. The overall impact of injuries on an athlete’s draft rank and ultimate performance was found to vary by position. No previous report2–6,8,15 has determined the impact of injuries seen at the NFL Scouting Combine on a player’s NFL performance, while demonstrating a dependence on position played.
Analysis of injury and draft position demonstrated that certain positions were associated with a significant drop in ultimate draft ranking when associated with injuries to certain locations (see Appendix Table A1). Specifically, defensive and offensive linemen with shoulder injuries were both noted to be drafted significantly later than their controls (115.9 vs 91.1 [P = .044] and 122.9 vs 96.1 [P = .037], respectively). Knee injuries were found to significantly affect draft position for offensive linemen in a similar fashion (123.3 vs 94.3; P = .022). Contrary to the work of Schroeder et al,13 who reported players with pre-existing lumbar spine conditions were less likely to be drafted into the NFL, our analysis showed no difference in draft likelihood between those with spinal injuries compared with matched controls.
Schroeder et al13,14 concluded that although there was a significant difference in career longevity, there was no difference in career performance for those athletes with pre-existing cervical or lumbar spine conditions compared to controls. Although these authors assessed career performance, our findings are in contrast to theirs, as we found linebackers with a prior history of spinal injury had significantly poorer performance than their controls, recording fewer games started (P = .014), fewer mean tackles (P = .048), and fewer tackles for a loss (P = .033).
Prior works by Brophy et al5 and Kaplan et al9 have shown that injuries among collegiate football players vary by playing position—a conclusion confirmed in this study. We further validated this finding among NFL Combine participants by calculating ORs for each position and each anatomic site of injury in order to strengthen our understanding of which positions are at greatest risk of which injuries (Figure 1).
Our performance analysis was composed of a total of 1040 players (66%) who participated in the NFL Combine between 2009 and 2013 and played a minimum of 2 seasons in the NFL. Matching this group with controls demonstrated significant differences in at least 1 performance quality metric at each position (Figures 2 and 3, Appendix Figures A1–A4).
Overall, defensive players were more negatively affected by their injuries during the first 2 seasons in the NFL than offensive players. Figure 2 and Appendix Figure A1 demonstrate multiple negatively affected performance metrics for each defensive position analyzed, while skilled offensive players (ie, quarterbacks, wide receivers, running backs) demonstrated only 1 metric affected at each position. The difference in injury impact between defensive and offensive players is likely multifactorial. It is possible that defensive players are less resilient than offensive players. It may also be possible that a team may be more likely to overlook an athlete’s injuries in defensive players, such as a linebacker or cornerback, during the draft process, but is not willing to overlook these injuries in a more high-profile skilled position such as a quarterback or a running back. Another possibility is that although the injuries sustained by defensive players are in the same anatomic location as those sustained by offensive players, the mechanism of injury and subsequent specific diagnoses sustained by defensive players may be more severe, thus carrying a more guarded prognosis.
Although we believe our findings are meaningful, we acknowledge several important limitations of this study. First, our analysis does not account for injuries prior to college or new injuries at any point after the NFL Combine, including new injuries sustained during the first 2 seasons of the NFL. To address this, we used a control group for each position and anatomic location of injury in order to better compare performance results during the first 2 seasons of play. Each control group incurred the same risk of potential injury after the NFL Combine as those athletes with previous injury, thereby controlling for the impact any new injury may have on performance during an athlete’s first 2 years in the NFL. Moreover, better or worse draft position as well as better or worse performance during the athlete’s first 2 years in the NFL cannot be directly attributed to injury history, given that some athletes are inherently better players and other players are inherently worse regardless of injury history. Therefore, a direct causation stemming from previous injuries cannot be confirmed, but correlations are noted.
In addition, our analysis is limited to players who played for a minimum of 2 years in the NFL. We do not account for some sequelae of collegiate injuries that may be directly responsible for a player’s being unable to perform at the level necessary to maintain a professional career. We also recognize that the study excludes athletes who were not invited to the NFL Combine or unable to attend due to injury history or incomplete recovery from prior injury. However, there is no effective means of identifying which athletes were limited by prior injury and to what extent, versus the plethora of other reasons that underlie an athlete’s inability to make a career in the NFL. Adjusting the outcomes in any way in an attempt to account for these phenomena would inappropriately skew the results.
Furthermore, we defined injury severity based on the number of missed games. This metric may not capture the impact of all injuries, particularly injuries that occurred in the off-season. Other metrics, specifically time to return to full activity or number of missed practices, were not reliably available. This limitation is mitigated by the fact that the majority of football injuries occur during the competitive season.
Another limitation of our study is that the analysis considered injuries sustained to anatomic locations rather than specific injuries. Because of the variability in diagnoses at each player position, we felt this was the best way to initially analyze the data and make comparisons between positions. However, it does not adequately account for the spectrum of severity between diagnoses at the same anatomic location; further studies are needed to assess the impact of specific diagnoses. Finally, the performance metrics were not validated; however, they were selected based on prior studies, consultation with subject matter experts, and current practices among NFL teams. Still, the selected performance metrics, given that they are objective measures, may not capture the entirety of a player’s impact on NFL play. However, any adjustment to account for additional player impact would add inappropriate bias.
Future studies will be aimed at in-depth analysis of specific anatomic locations in order to better understand specific diagnoses, their potential treatments (surgical vs nonsurgical), and determine each specific injury’s impact on an athlete’s draft position, performance once in the NFL, and ultimate longevity. In addition, analysis of the impact of injury history on performance at the NFL Combine could be performed.
Conclusion
The most common sites of injury identified at the NFL Combine were (1) ankle, (2) shoulder, (3) knee, (4) spine, and (5) hand. Overall, performance in the NFL, as underscored by number of games played, tended to worsen with injury history with a direct correlation found between injury at certain anatomic location and position of play. Overall, defensive players tended to perform worse if injury history was present than offensive players.
Appendix
Figure A1.
Linebackers: impact of spine and ankle injuries on NFL performance. In total, 40% (n = 56) of linebackers had a spine injury, with a mean overall pick of 119 ± 67.4 compared to controls (112.9 ± 71.9, P = .68). A total of 48% (n = 66) of linebackers had an ankle injury, with a mean overall pick of 119.7 ± 68.1 compared to controls (111.2 ± 69.9, P = .58). Linebackers with a spine or ankle injury missed 0.4 ± 1.7 and 0.9 ± 2.3 games in college, respectively. **P < .01; *P < .05; # P < .1.
Figure A2.
Offensive linemen: impact of shoulder and ankle injuries on NFL performance. In total, 39% (n = 73) of offensive linemen had a shoulder injury, with a mean overall pick of 122.9 ± 73.8 compared to controls (96.1 ± 68.8, P = .04). A total of 57% (n = 108) of lineman had an ankle injury, with a mean overall pick of 111.9 ± 66.6 compared to controls (94.5 ± 72.8, P = .19). Offensive linemen with a shoulder or ankle injury missed 0.7 ± 2.1 and 0.8 ± 2.1 games in college, respectively. ***P < .001; **P < .01; *P < .05; # P < .0.
Figure A3.
Running backs: impact of hand injuries on NFL performance. In total, 25% (n = 31) of running backs had a hand injury, with a mean overall pick of 138.5 ± 51.3 compared to controls (121.9 ± 76.0, P = .38). Running backs with a hand injury missed 0.2 ± 0.8 games in college. *P < .01.
Figure A4.
Tight ends: impact of shoulder and hand injuries on NFL performance. In total, 50% (n = 36) of tight ends had a shoulder injury, with a mean overall pick of 125 ± 68.6 compared to controls (138.4 ± 66.5, P = .55). A total of 35% (n = 25) of tight ends had a hand injury, with a mean overall pick of 122 ± 62.7 compared to controls (151.9 ± 54.7, P = .15). Tight ends with a shoulder or hand injury missed 0.9 ± 2.5 and 0 games in college, respectively. *P < 0.1.
Table A1.
Number of Missed Collegiate Games and Draft Status by Position in Players Who Attended the NFL Combine, 2009-2015a
| n (%) | Total Missed Games, Mean ± SD | Undrafted, n (%) | Drafted, n (%) | Pick Number per Draft Class, Mean ± SD | |
|---|---|---|---|---|---|
| All players | 2203 (100) | 2.7 ± 4.3 | 713 (32.4) | 1490 (67.6) | 114.7 ± 71 |
| Offensive | 1175 (53.3) | 2.8 ± 4.3 | 431 (36.7) | 744 (63.3) | 116.5 ± 70.9 |
| Offensive line | 370 (31.5) | 2.4 ± 4.4 | 121 (32.7) | 249 (67.3) | 110.4 ± 71.7 |
| Quarterback | 125 (10.6) | 1.9 ± 2.8 | 54 (43.2) | 71 (56.8) | 105.6 ± 79 |
| Running back | 239 (20.3) | 3.9 ± 4.8 | 97 (40.6) | 142 (59.4) | 126.5 ± 66.0 |
| Tight end | 133 (11.3) | 3.4 ± 4.8 | 44 (33.1) | 89 (66.9) | 133.2 ± 70.1 |
| Wide receiver | 308 (26.2) | 2.4 ± 3.7 | 115 (37.3) | 193 (62.7) | 113.1 ± 69.3 |
| Defense | 1028 (46.7) | 2.7 ± 4.4 | 282 (27.4) | 746 (72.6) | 113.0 ± 71.0 |
| Defensive back | 405 (39.4) | 2.6 ± 4.3 | 118 (29.1) | 287 (70.9) | 115.8 ± 68.0 |
| Defensive line | 384 (37.4) | 2.6 ± 4.5 | 98 (25.5) | 286 (74.5) | 105.7 ± 74.0 |
| Linebacker | 239 (23.2) | 3.0 ± 4.5 | 66 (27.6) | 173 (72.4) | 120.5 ± 67 |
aNFL, National Football League.
Footnotes
One or more of the authors has declared the following potential conflict of interest or source of funding: M.T.P. is a consultant for Arthrex and the Joint Restoration Foundation (Allosource) and receives royalties from Arthrex and SLACK Inc.
Ethical approval for this study was obtained from the Partners Human Research Committee (Protocol No.: 2015P002224/MGH).
References
- 1. Aune KT, Andrews JR, Dugas JR, Cain EL. Return to play after partial lateral meniscectomy in National Football League athletes. Am J Sports Med. 2014;42:1865–1872. [DOI] [PubMed] [Google Scholar]
- 2. Brophy RH, Barnes R, Rodeo SA, Warren RF. Prevalence of musculoskeletal disorders at the NFL Combine—trends from 1987 to 2000. Med Sci Sports Exerc. 2007;39:22–27. [DOI] [PubMed] [Google Scholar]
- 3. Brophy RH, Chehab EL, Barnes RP, Lyman S, Rodeo SA, Warren RF. Predictive value of orthopedic evaluation and injury history at the NFL combine. Med Sci Sports Exerc. 2008;40:1368–1372. [DOI] [PubMed] [Google Scholar]
- 4. Brophy RH, Gill CS, Lyman S, Barnes RP, Rodeo SA, Warren RF. Effect of anterior cruciate ligament reconstruction and meniscectomy on length of career in National Football League athletes: a case control study. Am J Sports Med. 2009;37:2102–2107. [DOI] [PubMed] [Google Scholar]
- 5. Brophy RH, Lyman S, Chehab EL, Barnes RP, Rodeo SA, Warren RF. Predictive value of prior injury on career in professional American football is affected by player position. Am J Sports Med. 2009;37:768–775. [DOI] [PubMed] [Google Scholar]
- 6. Carey JL, Huffman GR, Parekh SG, Sennett BJ. Outcomes of anterior cruciate ligament injuries to running backs and wide receivers in the National Football League. Am J Sports Med. 2006;34:1911–1917. [DOI] [PubMed] [Google Scholar]
- 7. Erickson BJ, Harris JD, Heninger JR, et al. Performance and return-to-sport after ACL reconstruction in NFL quarterbacks. Orthopedics. 2014;37:e728–e734. [DOI] [PubMed] [Google Scholar]
- 8. Gibbs DB, Lynch TS, Gombera MM, et al. Preexisting rotator cuff tears as a predictor of outcomes in National Football League athletes. Sports Health. 2016;8:250–254. [DOI] [PMC free article] [PubMed] [Google Scholar]
- 9. Kaplan LD, Flanigan DC, Norwig J, Jost P, Bradley J. Prevalence and variance of shoulder injuries in elite collegiate football players. Am J Sports Med. 2005;33:1142–1146. [DOI] [PubMed] [Google Scholar]
- 10. Keller RA, Mehran N, Austin W, Marshall NE, Bastin K, Moutzouros V. Athletic performance at the NFL Scouting Combine after anterior cruciate ligament reconstruction. Am J Sports Med. 2015;43:3022–3026. [DOI] [PubMed] [Google Scholar]
- 11. Kerr ZY, Marshall SW, Dompier TP, Corlette J, Klossner DA, Gilchrist J. College sports–related injuries—United States, 2009-10 through 2013-14 academic years. MMWR Morb Mortal Wkly Rep. 2015;64:1330–1336. [DOI] [PubMed] [Google Scholar]
- 12. Pagnani MJ, Dome DC. Surgical treatment of traumatic anterior shoulder instability in American football players. J Bone Joint Surg Am. 2002;84-A:711–715. [DOI] [PubMed] [Google Scholar]
- 13. Schroeder GD, Lynch TS, Gibbs DB, et al. Pre-existing lumbar spine diagnosis as a predictor of outcomes in National Football League athletes. Am J Sports Med. 2015;43:972–978. [DOI] [PubMed] [Google Scholar]
- 14. Schroeder GD, Lynch TS, Gibbs DB, et al. The impact of a cervical spine diagnosis on the careers of National Football League athletes. Spine. 2014;39:947–952. [DOI] [PubMed] [Google Scholar]
- 15. Shaffer B, Wiesel S, Lauerman W. Spondylolisthesis in the elite football player: an epidemiologic study in the NCAA and NFL. J Spinal Disord. 1997;10:365–370. [PubMed] [Google Scholar]


