Abstract
trans- and cis-3-Chloroacrylic acid dehalogenase (CaaD and cis-CaaD, respectively) catalyze the hydrolytic dehalogenation of their respective isomers and represent key steps in the bacterial conversion of 1,3-dichloropropene to acetaldehyde. In prior work, a kinetic mechanism for the CaaD-catalyzed reaction could not be unequivocally determined because (1) the order of product release could not be determined and (2) the fluorescence factor for the enzyme species, E*PQ (where P = bromide and Q = malonate semialdehyde, the two products of the reaction) could not be assigned. The ambiguities in the model have now been resolved by stopped-flow experiments following the reaction using an active site fluorescent probe, αY60W-CaaD and 3-bromopropiolate, previously shown to be a mechanism-based inhibitor of CaaD, coupled with the rate of bromide release in the course of CaaD inactivation. A global fit of the combined datasets provides a complete minimal model for the reaction of αY60W-CaaD and 3-bromoacrylate. In addition, the global fit produces kinetic constants for CaaD inactivation by 3-bromopropiolate and implicates the acyl bromide as the inactivating species. Finally, a comparison of the model with that for cis-CaaD shows that for both enzymes turnover is limited by product release and not chemistry.
Keywords: hydrolytic dehalogenase, kinetic mechanism, enzyme inactivation, rate limiting product
TOC image
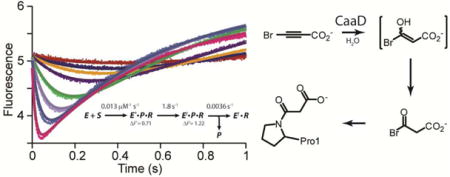
trans- and cis-3-Chloroacrylic acid dehalogenase, designated CaaD and cis-CaaD, respectively, catalyze the hydrolytic dehalogenation of the corresponding isomer of 3-chloroacrylic acid (2 or 3 in Scheme 1) to yield malonate semialdehyde (4) and HCl.1–4 The dehalogenation step is a critical one in bacterial degradative pathways for 1,3-dichloropropene (1).5,6 The isomeric mixture of 1 represents the active ingredient in commercially available fumigants used to kill nematodes. Subsequent decarboxylation of 4 by malonate semialdehyde decarboxylase (MSAD) produces acetaldehyde (5),7 presumably channeled to the Krebs Cycle, and completes the catabolism of 1 in soil.
Scheme 1.

1,3-Dichloropropene Catabolic Pathway.
The two dehalogenases pose various mechanistic, structural, and evolutionary questions.8 CaaD is a heterohexamer made up of three heterodimers.2,9 Each heterodimer consists of an α-subunit (70 amino acids) and a β-subunit (75 amino acids). The accumulated body of evidence suggests a mechanism involving four active site groups, βPro-1, αArg-8, αArg-11, and αGlu-52.2,3,9,10 In contrast, cis-CaaD is a homotrimer where each monomer consists of 149 amino acids.11 The enzyme uses two additional groups, His-28 and Tyr-103, along with four active site groups (Pro-1, Arg-70, Arg-73, and Glu-114) that correspond to the ones in CaaD.4,11
The mechanisms of CaaD and cis-CaaD largely parallel one another.8 In CaaD, αGlu-52 is proposed to activate a water molecule for addition to C-3 of 2, and the two arginine residues are proposed to bind and polarize the substrate (Scheme 2).9,10 Polarization of 2 draws electron density away from C3 to facilitate the addition of water. The combined action produces the enediolate 6 (perhaps not as a distinct entity), which can undergo two fates (routes A and B). In route A, βPro-1 (pKa ~ 9.2) provides a proton at C2 to complete the conjugate addition of water and form a chlorohydrin species, 7. Chemical or enzyme-catalyzed breakdown of 7 expels chloride (as HCl) and affords 4. In route B, enediolate 6 undergoes an α,β-elimination to produce the enol species 8. Chemical or enzymatic ketonization of 8 yields 4. In cis-CaaD, Tyr-103 is proposed to assist Glu-114 in the activation of a water molecule and His-28 might function along with Arg-70 and Arg-73 in the binding and polarization of the substrate in the active site.11
Scheme 2.

Catalytic Mechanism of CaaD using trans-3-Chloroacrylic Acid (2).
As part of an effort to delineate the similarities and differences between these enzymes, the kinetic mechanism for the CaaD reaction was determined. CaaD lacks a strongly fluorescent amino acid in or near the active site, so one was introduced.12 The resulting αY60W mutant of CaaD shows little kinetic differences from those of the wild-type, and accurately reports changes in enzyme fluorescence during the CaaD-conversion of trans-3-bromoacrylate (9, Scheme 3) to 4, in both the transient state and steady-state realms.
Scheme 3.

Compounds Used in the Development of the Kinetic Models.
Subsequently, the stopped-flow, rapid chemical quench, ultraviolet spectroscopy, and product (4 and bromide ion) binding data were subjected to a simultaneous global fit by computational simulation.12 The fit established a minimal kinetic model for the CaaD reaction with estimates on six individual rate constants (Scheme 4), including chemistry (k2), product release (k4) and binding constants for the substrate (KD = k−1/k1) and products (4 and bromide, K5 and K6, respectively). Limits (lower and upper, respectively) were placed on k1 and k−3, but their absolute values were not defined by the data. Values in brackets were held fixed during the fitting routines.
Scheme 4.

Minimal Kinetic Mechanism for the Reaction of αY60W-CaaD and 9, where S corresponds to 9, P corresponds to bromide, and Q corresponds to 4.
However, two features of the model could not be resolved.12 First, the data set did not define the order of product release (P, in Scheme 4) from the E*PQ species. Binding of P to E**Q could only be assessed as weak, with an estimated KD > 200 mM. Hence, it was concluded that product release occurs randomly with a preference for the upper path (in Scheme 4). Second, and more importantly, the data set doesn’t explicitly define the fluorescence factor for E*PQ, which prevents unambiguous resolution of the rate constants for its formation and decay (k3 and k4, respectively in Scheme 4), although the data set provides strict upper and lower limits on each parameter. The inability to determine the fluorescence factor appears to be an inherent limitation of the system and is a common problem. Without knowing the absolute concentration of an intermediate one cannot resolve whether the rate constants for the formation and decay follow a fast-slow or slow-fast sequence, as illustrated in Scheme 4 (k3 and k4).
In order to determine the fluorescence factor for E*, and thereby resolve the ambiguity in the rate constants, the reaction of αY60W-CaaD and 3-bromopropiolate (10, Scheme 3), a mechanism-based inhibitor of CaaD,3 was followed in stopped-flow experiments. The resulting stopped-flow fluorescence data and the previously determined bromide release data (for 10) were fit by conventional methods and simulation to yield kinact/KI,app, kinact, app, and an estimate of the rate of bromide release (P) from species E*PR, where R is the reactive intermediate that results in CaaD inactivation. The fit also defines unique fluorescent factors for two enzyme species (designated E* and E!).
These data were combined with the data for the reaction of αY60W-CaaD and 9, and simultaneously fit by simulation to one combined model. The final fit yields estimates for nine rate constants and three fluorescent factors. The slow observed rate of bromide release (P) from E*PR (in the reaction of CaaD and 10) provides an estimate for the rate of bromide release from species E*PQ (in the reaction of αY60W-CaaD and 9), and confirms that the upper pathway in Scheme 4 is kinetically preferred. A complete minimal kinetic model of αY60W-CaaD and 9 is proposed and compared to the one for cis-CaaD.
EXPERIMENTAL PROCEDURES
Materials
All materials used in this study were obtained from sources reported elsewhere, unless noted otherwise.12–14 The DEAE-Sepharose and Phenyl-Sepharose 6 Fast Flow resins were obtained from GE Healthcare Bio-Sciences (Pittsburgh, PA). The EMD Millipore ultrafiltration membranes (10,000 Da MW cutoff) were purchased from Fisher Scientific. The syntheses of trans-3-bromoacrylic acid (9) and 3-bromopropiolate (10) are reported elsewhere.3
Bacterial Strains, Plasmids, Growth and Purification
Escherichia coli strain BL21-Gold(DE3) was obtained from Agilent Technologies (Santa Clara, CA). The construction of the αY60W-CaaD plasmid, transformation into E. coli BL21-Gold (DE3) cells, and expression are described elsewhere.12 Cells were grown at 37 °C in Luria-Bertani (LB) media that contained kanamycin (Kn, 30 μg/mL). The αY60W mutant of CaaD was purified as reported.12 Typically, 2.5 L of culture yields about 75 mg of pure enzyme.
General Methods
Non-linear regression data fitting to equations was performed using the program Grafit (Erithacus Software Ltd., Staines, U.K.) and KinTek Global Kinetic Explorer Version 5.0 or higher (KinTek Corp, Austin TX) was used to fit data globally based on numerical integration of the rate equations.18 Sodium dodecyl sulfate-polyacrylamide gel electrophoresis (SDS-PAGE) was carried out on denaturing gels containing 15% or 20% polyacrylamide.15 Protein concentrations were determined by the Waddell method.16
Stopped-Flow Kinetic Experiments
Stopped-flow experiments were carried out on a SF-300X stopped-flow apparatus (KinTek Corp., Austin, TX), generally following previously described protocols.12–14 A stock solution of αY60W-CaaD was diluted into 100 mM Na2HPO4 buffer, pH 8.1, to a final concentration of 20 μM (based on the α-β dimer molecular mass).12 This enzyme solution was allowed to equilibrate at 22 °C for 1 h. A stock solution (20,000 μM) of 10 was made up using a mixture of 100 mM Na2HPO4 and 100 mM Na3PO4 buffers to give a final pH of 8.1. Various concentrations of 10 (80–10000 μM, initial concentrations) were made up in 100 mM Na2HPO4 buffer, pH 8.1, using the stock solution of 10. Enzyme and inhibitor were mixed in a 1:1 ratio in the stopped-flow apparatus and changes in enzyme fluorescence were followed for 1 and 10 s. The fluorescence was excited at 280 nm and the emission was observed using a 340 nm band pass filter (Semrock, Rochester, NY). The slit width on the monochromator was set at 0.6 mm. Traces represent an average of at least five runs at each substrate concentration.
Stopped-flow fluorescence traces were fit initially to defined exponential functions by non-linear regression using the KinTek stopped-flow software.17,18 The 1 s time-course data were fit to a double exponential function (eq 1).
| (1) |
Subsequently, the resulting observed rates (λ1 and λ2) were plotted versus inhibitor concentration, [I]. The concentration dependence of the fast and slow rates (obtained from the double exponential fit) were fit by Grafit to a line (eq 2) and a hyperbola (eq 3), respectively.
| (2) |
| (3) |
The resulting plots suggested a minimal two-step model with the data only providing well-defined forward rate constants. Complete solution of the rate equations for a two-step reaction yields observed rates that are the roots of a quadratic equation. Simplification based upon the square-root approximation yields two rates defined by equations 4 and 5.
| (4) |
| (5) |
Thus, in fitting the data using equation 2, the slope defined k1 and the intercept defines the sum of all other rate constants. In fitting to eq 3, kmax = k2 + k−2.19 For the full three step reaction sequence (Scheme 6) kmax = k2 + k−2 + k3, but k−2 and k3 are negligible.
Scheme 6.

Final Kinetic Model for αY60W-CaaD and 10, where S corresponds to 10, P corresponds to bromide, and R corresponds to the reactive species that forms a covalent bond with enzyme.
Bromide Release in the Reaction of CaaD and 10
The bromide release data for the reaction of 10 with CaaD were obtained previously.3 However, the data were not fit using non-linear regression or simulation. In this work, the data were fit to a single exponential expression (eq 6) and simultaneously with the stopped-flow data by global simulation to a single kinetic model.
| (6) |
Global Fit of αY60W-CaaD and 10 By Simulation
Conventional analysis of the stopped-flow and bromide release data for αY60W-CaaD/CaaD and 10 (by non-linear regression) provides initial estimates for rate constants and a minimal number of steps in the overall reaction model (for the αY60W-CaaD reaction).17 The data were then globally fit to a single kinetic model using KinTek Global Kinetic Explorer, as described elsewhere.12,18 During the process of global optimization, the data collected over a series of concentrations within a given experiment were scaled using a correction factor (less than 5%) for each trace to correct for slight lamp drift between traces.
Simultaneous Global Fit of αY60W-CaaD with 9 and 10 By Simulation
As shown in the fit by simulation of the reaction of 10 with αY60W-CaaD, the data contains sufficient information to define the fluorescent factor for the enzyme species to be lower than free enzyme. This species is designated E*. As a result, the data set obtained with 10 was combined with the data set following the reaction of αY60W-CaaD and 9, and both datasets were globally fit simultaneously to a combined minimal model. (The development of the kinetic model used to simulate the αY60W-CaaD reaction with 9, shown in Scheme 4, is discussed in detail elsewhere.12) Here, the αY60W-CaaD/9 data set is modeled under the same conditions as previously outlined.12 The stopped-flow data with 9 contains two observed fluorescent factors associated with different enzymatic states as the fluorescence changes over the course of the reaction. There is one enzymatic species with lower fluorescence than free enzyme and one with higher fluorescence than free enzyme. They are designated E* and E**, respectively.
Docking of the Putative Intermediates 6, 11, and 12 (Scheme 9)
Scheme 9.

Hypothetical Intermediates Formed the During Catalysis of 9 and 10.
Docking experiments were carried out using PyMOL (version 1.4 or higher) with Autodock Vina plug-in, following a previously reported protocol.12,20,21 The active site used for docking was a modified version of the active site used in a previous study (Protein Data Bank (PDB) code 1S0Y).9,12 The structure corresponds to the inactivated enzyme after incubation with 10, where there is a malonate adduct on the βPro-1 (16 in Scheme 10). This adduct was removed prior to docking. The search space was confined to a 10 Å × 15 Å × 10 Å box centered on the βPro-1 residue. Unlike the previous docking studies,12 αGlu-52 and αLeu-57 are placed in fixed positions during the search for the optimal positions of the active site groups to carry out the proposed chemistry. These orientations are slightly different than those in the native PDB structure (as discussed elsewhere).12
Scheme 10.

Proposed Mechanism for the Irreversible Inhibition of CaaD by 10.
RESULTS
Stopped-Flow Kinetic Experiments
The reaction of the αY60W mutant of CaaD and 3-bromopropiolate (10) was monitored using stopped-flow, following changes in enzyme fluorescence during the course of the reaction. The data collected over the first second shows an initial decrease in the fluorescence signal followed by a slow increase to a final fluorescent signal that is higher than free enzyme alone (Figure 1A). After 10 s, the fluorescence signal remains unchanged at all concentrations. The 1-s data set was initially fit to a double exponential function (eq 1).17 Subsequently, the observed rates (λ1 and λ2) were plotted versus the concentration of 10 (Figures 1B,C). The concentration-dependence plots were fit to equations 2 and 3 using linear and non-linear regression, respectively. The initial rate (λ1) increases linearly with increasing concentrations of 10 (Figure 1B). The slope of the line yields an estimate for k1 (0.014 ± 0.0002 mM−1s−1). The second rate (λ2) shows a hyperbolic dependence on 10, with the maximum observed rate yielding an estimate for k2 + k−2 (2.43 ± 0.2 s−1) (Scheme 5, Figure 1C). The two observed exponentials suggest a minimum of two steps in the model where the values yield the forward rate constants k1 and k2 (Scheme 5).17 Moreover, the y-intercept in the first plot (Figure 1B) is close to the maximum observed rate in the second plot (Figure 1C). This observation indicates that the reverse rate constant, k−1, is negligible.17 Based on the chemistry of the reaction, we suggest that k−2 is also negligible. Accordingly, conventional data fitting provides estimates of k1 from the slope of the concentration dependence of the fast phase and k2 from the maximum rate of the slow phase.
Figure 1.
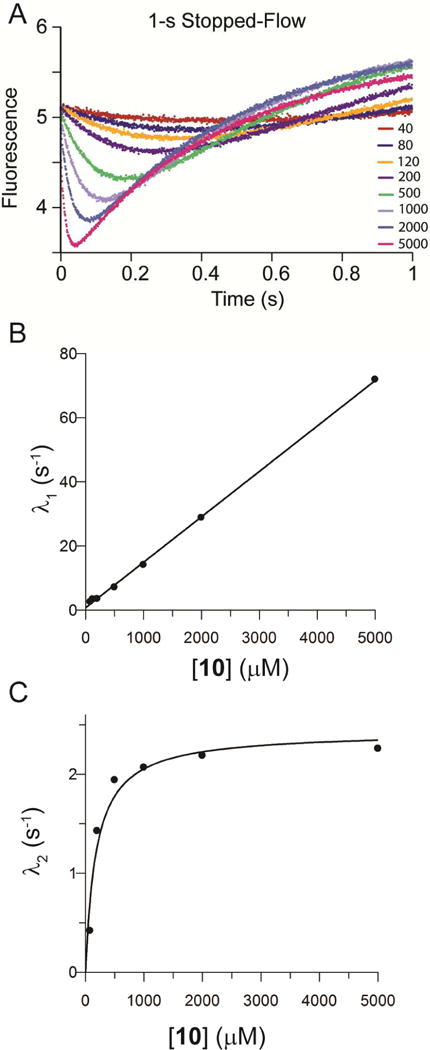
Data and Conventional Analysis of αY60W-CaaD and 3-Bromopropiolate (10).17 A) The 1-s stopped-flow fluorescence data for 10 and αY60W-CaaD. B) Plot of λ1 vs. 10 with fit to a line (eq. 2). C) Plot of λ2 vs. 10 with fit to a line (eq 3) (solid line).
Scheme 5.

Minimal Kinetic Model Used for Data Simulation of αY60W-CaaD and 10, where S corresponds to 10, P corresponds to bromide, and R corresponds to the reactive species that forms a covalent bond with enzyme.
Fitting the Bromide Release Dataset
The bromide release data for 10 in the presence of CaaD are reported elsewhere.3 Here, the data obtained at the 3 concentrations of 10 (25, 150, 300 μM, Figure 2D) were fit to a single exponential expression (eq 6) by non-linear regression (vide infra). The resulting observed rates (kobs) were 0.0125 ± 0.0006, 0.0068 ± 0.0003, and 0.0072 ± 0.0003, respectively. These observed rates are significantly slower than the rate of enzyme inhibition by 10 (with 80% loss of activity occurring in less than 10 s, based on the time-dependent inhibition assays)3 and the observed rate of the second phase of the stopped-flow data (i.e., k2 = 2.43 ± 0.2 s−1).
Figure 2.
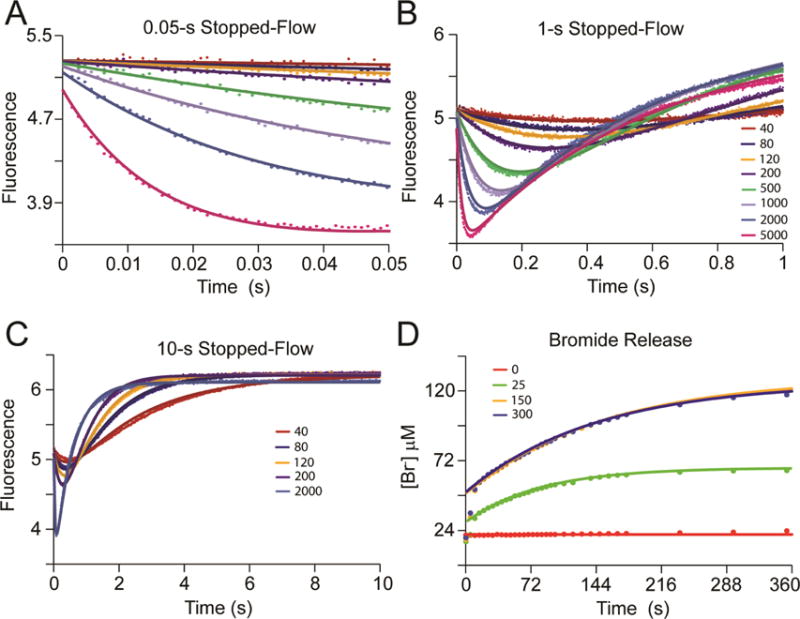
Global Data Fitting of αY60W-CaaD and 3-Bromopropiolate (10).18 The αY60W-CaaD kinetic data with 10 globally fit by simulation to the mechanism shown in Scheme 6. A) Stopped-flow fluorescence traces (0.05 s) for 10 (0–5000 μM) and αY60W-CaaD. B) Stopped-flow fluorescence traces (1 s) for 10 (0–5000 μM) and αY60W-CaaD. C) Stopped-flow fluorescence traces (10 s) for 10 (0–2000 μM) and αY60W-CaaD. D) The free bromide release with wild-type CaaD and 10. Concentrations of 10 are shown in the legends. Colors corresponding to the concentrations of 10 are the same in A-C. For A-C, the solid lines are the fits to the data by simulation. For D, the solid lines represent a fit to the data to eq 6. A summary of the numerical values is shown in Table 1.
Global fit of αY60W-CaaD with 10 by Simulation
The stopped-flow datasets were fit by simulation to a single kinetic model.17,18 The model is based on the results from the conventional analysis of the data where the concentration dependence of λ1 and λ2 require at least a two-step model. These two steps and a third step to account for the slow release of bromide (P) were incorporated into a model for fitting by simulation (Scheme 5). In this model, P is designated as bromide product and R is designated as the reactive species that forms a covalent bond with the prolyl nitrogen (14 or 15 in Scheme 10). There are two observable fluorescent species in the course of the reaction: one represents the initial decrease in fluorescence and one represents the increase in fluorescence at the endpoint equilibrium. These fluorescence states are designated E* and E!, respectively.
The results of the fit by computer simulation are shown in Figure 2. Figure 2A highlights the first (fast) phase of the stopped-flow data and the fit by simulation (solid lines). The second phase is readily observed in Figures 2B and 2C. Figure 2C shows that after 10 s the fluorescence has come to equilibrium and remains constant for at least 2 additional seconds (not shown). The bromide release data were fit to eq 6 (Figure 2D). The values of the apparent kinact/KI and kinact are given by the rate constants k1 and k2, respectively (Scheme 5). The rate of bromide release is determined to be less than 0.01 s−1. The FitSpace confidence contour analysis results suggest that the two rate constants and two fluorescent factors are well-constrained by the data set (Figure 3).22 The resulting rate constants, fluorescent factors, and error ranges are summarized in Table 1 and Scheme 6.
Figure 3.
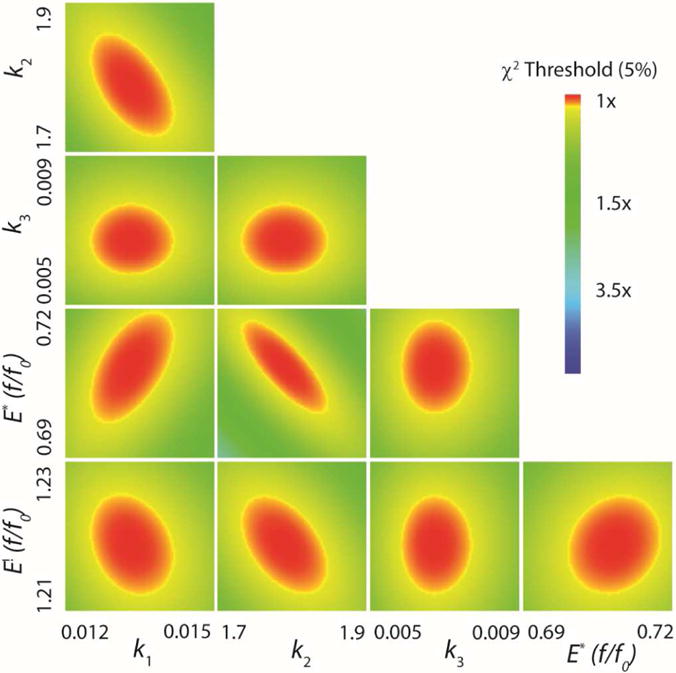
FitSpace Confidence Contours for the Global Fit for αY60W-CaaD and Bromopropiolate (10).22 FitSpace confidence contours (5% χ2) for the global fit of the kinetic data shown in Figure 2 (αY60W-CaaD and 10) to the model in Scheme 5. Included in the FitSpace are the two observed fluorescence factors for enzyme species designated E* and E!. Optimal values and numerical error ranges can be found in Table 1.
Table 1.
Rate Constants and Fluorescence Factors for αY60W-CaaD and 3-Bromopropiolate (10)a
| Parameter | Lower Limitb | Upper Limitb | % Rangec | Best fit |
|---|---|---|---|---|
| k1 | 0.0124 | 0.0141 | 6.4% | 0.0132 μM−1 s−1 |
| k2 | 1.72 | 1.85 | 3.7% | 1.78 s−1 |
| k3 | 0.0032 | 0.0038 | 17% | 0.0036 s−1 |
|
| ||||
| E*(f/f0)d | 0.695 | 0.715 | 1.4% | 0.706 |
| E!(f/f0)d | 1.215 | 1.22 | 0.2% | 1.218 |
The data are fit globally to the model shown in Scheme 6.18 Respective units for the fitted parameters are found in the best fit column.
The upper and lower limits reflect a threshold of 5% deviation from the minimal χ2 in the confidence contours.22 FitSpace error confidence contours are shown in Figure 3.
The percentage range was calculated by dividing the mean of the range by the best fit value as (upper-lower)/(2*best fit). This reflects the allowable variation of each best fit value as a percentage.
The fluorescence scaling factor is shown as the fractional change in enzyme fluorescence.
Global fit of αY60W-CaaD with 9 and 10 by Simulation
The fit of the reaction of αY60W-CaaD and 9 to the model shown in Scheme 4 was reported previously12, where we describe the development of this model and the rationale for fixing certain rate constants during the fitting process. The prior fit resulted in ambiguity in the rate constants designated k3 and k4 with two optimal values for each (~9 and ~3 s−1), due to a lack of data to explicitly define the fluorescence factor for the species designated E*PQ (vide supra). There are two possible values for k3 and k4 because there are two possible values for the fluorescence factors that yield an optimal fit. The fast-slow sequence (k3 ~9 s−1 and k4 ~3 s−1) gives a fluorescence factor of 0.7 for E*PQ. The slow-fast sequence (k3 ~3 s−1 and k4 ~9 s−1) sequence gives a fluorescence factor of 0.2. The FitSpace analysis shows that other combinations of values can account for the data equally as well (within the 3% deviation of the total χ2).22 Nonetheless, the FitSpace analysis shows strict upper and lower limits for k3 and k4 equal to 13 s−1 and 2.5 s−1. The fit of αY60W-CaaD and 10 shows that the species designated as E*PR has a fluorescence factor of 0.7. In light of the similarity of this fluorescence factor to that of the fast-slow sequence, the two data sets (αY60W-CaaD with 9 and 10) were combined and simultaneously fit by simulation (Scheme 7),18 with the assumption that the intermediate enzyme species E* is the same in both reactions. This additional constraint affords an unambiguous set of rate constants for the formation and decay of E*PQ.
Scheme 7.
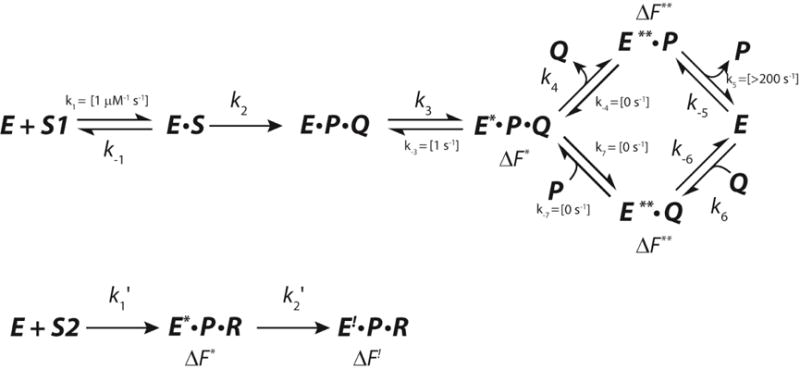
Complete Model Used for Simultaneous Fitting of Both Datasets Collected for αY60W-CaaD, where S corresponds to 9, S2 corresponds to 10, Q corresponds to 4, P corresponds to bromide, and R corresponds to the reactive species that forms a covalent bond with enzyme.
In this model, S1 is trans-3-bromoacrylate (9), S2 is 3-bromopropiolate (10), P is bromide, Q is malonate semialdehyde (4), and R is the reactive species that forms a covalent bond with the prolyl nitrogen of βPro1 (14 or 15 in Scheme 10). There are three observed fluorescent species for the enzyme E*, E**, and E!. The values shown in brackets in Scheme 7 are held fixed at the designated values during the fitting process. A forward only arrow designates that the reverse rate constant is fixed at zero. The resulting global fit by simulation is shown in Figure 4. A summary of numerical values resulting from the fit is shown in Table 2. The optimal values are shown above the corresponding steps in Scheme 8. The values reported in the curly brackets (Scheme 8A) are the upper limits for k−3, k−4, k7, and k−7, and the lower limits for k1 and k5. The Fitspace shows that all the rate constants are well-constrained by the data with unique optimal values (Figure 5). The ambiguity in the rate constants for k3 and k4 is eliminated and absolute values have been assigned. The model predicts that the fast-slow sequence and the upper pathway (Scheme 8A) are operative. The fit shows that release of 4 or a step associated with the release of 4 is rate-limiting (k4), and the unknown step, associated with a change in enzyme fluorescence, is partially rate-limiting (k3).
Figure 4.
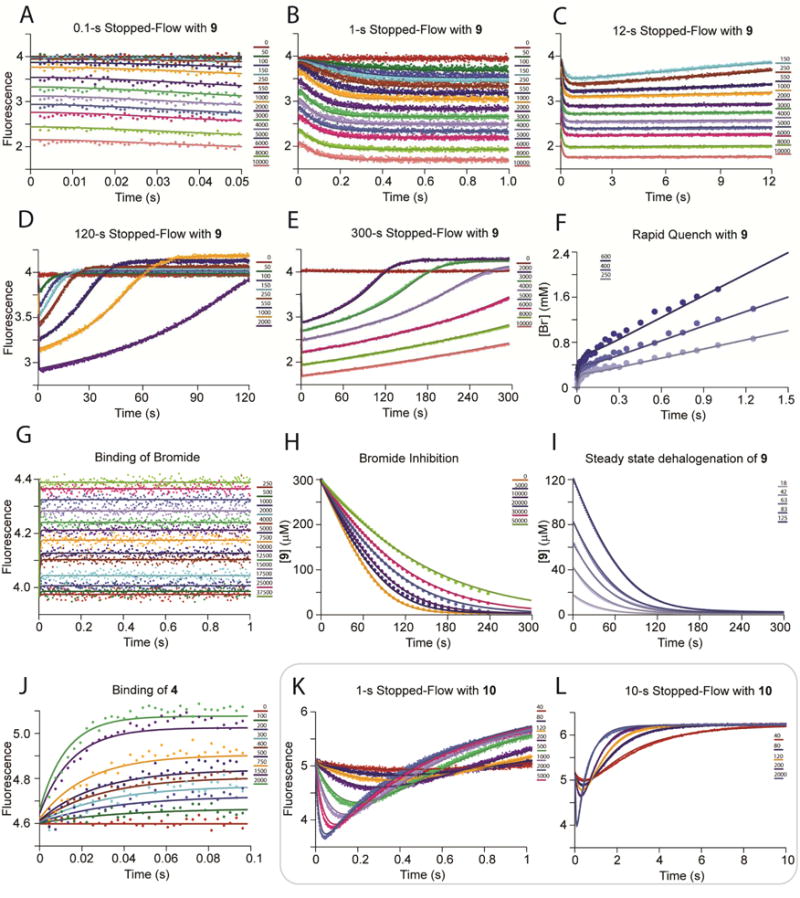
The Simultaneous Global Fit of αY60W-CaaD with 9 and 10.22 The global fit of the kinetic data with αY60W-CaaD and 9 and 10 to the model in Scheme 7. Visually, the fits (not shown) only change slightly from those shown in a previous publication and remain unchanged from the fits shown in Figure 2A–C. A summary of the numerical rate constants is shown in Table 2.
Table 2.
Rate Constants and Fluorescence Factors for the Comprehensive Global Fit of All Dataa
| Rate | Lower Limitb | Upper Limitb | % Rangec | Best fit | |
|---|---|---|---|---|---|
| k−1d | 2300 | 4900 | 42% | 3100 s−1 | |
| k2 | 64 | 133 | 40% | 85 s−1 | |
|
| |||||
| k3e | 8.1 | 9.9 | 10% | 8.9 s−1 | |
| k4 | 3.3 | 3.5 | 1.5% | 3.4 s−1 | |
|
| |||||
| kD,Brf | 8.4 | 13.5 | 24% | 10.8 mM | |
| k6g | 0.022 | 0.036 | 25% | 0.028 μM−1 s−1 | |
|
| |||||
| k−6 | 15 | 31 | 36% | 22 s−1 | |
|
|
0.0121 | 0.0132 | 4.4% | 0.0126 μM−1 s−1 | |
|
| |||||
|
|
1.73 | 1.83 | 2.9% | 1.78 s−1 | |
| (f/f0)* | 0.695 | 0.710 | 1.1% | 0.703 | |
|
| |||||
| (f/f0)** | 1.125 | 1.134 | 0.4% | 1.131 | |
| (f/f0)! | 1.22 | 1.22 | 0.2%h | 1.22 | |
The data are fit globally to the model shown in Scheme 8.18 Respective units for the fitted parameters are found in the best fit column.
The upper and lower limits reflect a threshold of 3% deviation from the minimal χ2 in the confidence contours.22 FitSpace error confidence plots are shown in Figure 5.
The percentage range was calculated by dividing the mean of the range by the best fit value as (upper-lower)/(2*best fit). This reflects the allowable variation of each best fit value as a percentage.
The value for k1 (substrate binding) was assumed to be fast and held fixed at 1 μM−1 s−1, so fitting to derive k−1 defined only Kd,S
Formation of E*PQ was modeled as a reversible step associated with a conformational change in the enzyme. The value of k−3 was held fixed at 1 s−1 during global fitting.
The value for k5 (release of bromide ion) was assumed to be fast and held fixed at 200 s−1. The fit optimizes the k−5 rate constant such that it satisfies the equilibrium constant (KD,Br) defined by the data.
The error percentage was taken from Table 1 as the upper and lower bounds were the same value for this fit.
Scheme 8.
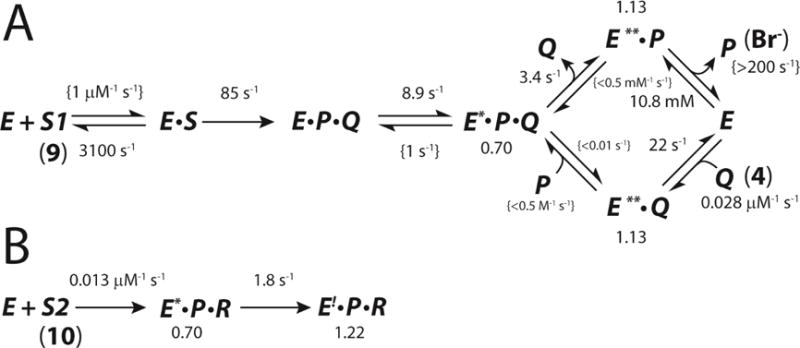
Final Complete Kinetic Model with Rate Constants and Fluorescence Factors for A) CaaD and 9 and B) CaaD and 10, where S corresponds to 9, S2 corresponds to 10, Q corresponds to 4, P corresponds to bromide, and R corresponds to the reactive species that forms a covalent bond with enzyme.
Figure 5.
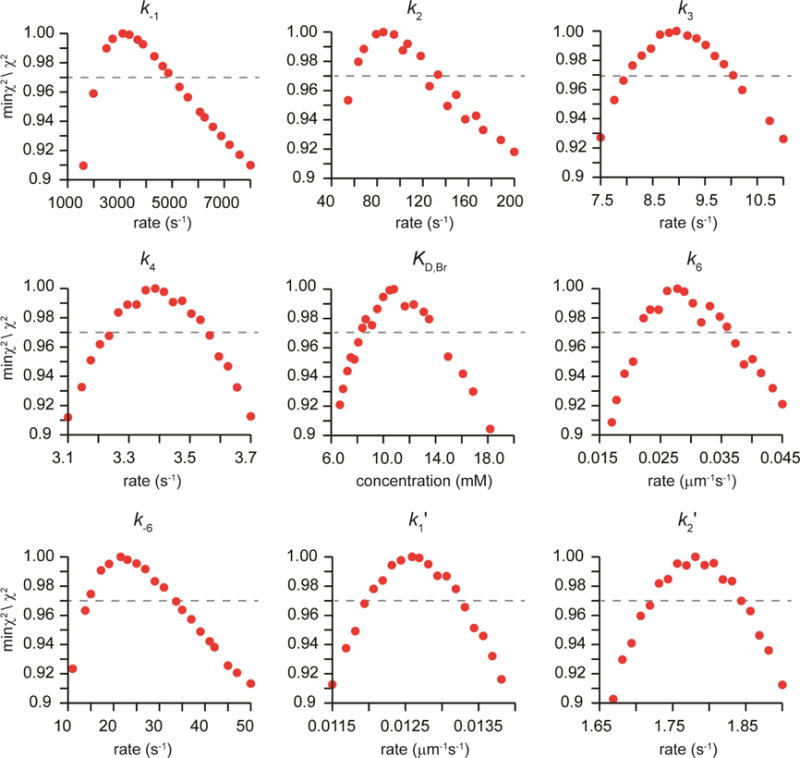
1D FitSpace Confidence Plots for the Simultaneous Global Fit of αY60W-CaaD with 9 and 10. FitSpace confidence plots for the global fit of the kinetic data with αY60W-CaaD and 9 and 10 (Figure 4) to the model in Scheme 7. A summary of the numerical rate constants is in Table 2.
Docking of the Putative Intermediates 6, 11, and 12 (Scheme 9)
Docking studies were carried out with three hypothetical intermediates, 6 (Scheme 2), and 11 and 12 (Scheme 9) in the reactions of 9 (i.e., 6) and 10 (i.e., 11 and 12) with CaaD. The docking studies were conducted in order to determine: (1) whether the preferred position of 6 in the active site is consistent with that of 9 (the docking of 9 in the active site of CaaD was carried out previously);12 and (2) whether the enzyme has a preference for 11, the (E)-isomer, or 12, the (Z)-isomer (13 in Scheme 10).
The docking results show that 6 and 11 have a preference to bind in an orientation similar to that of 9, as reported previously.12 Accordingly, the bromide is positioned behind the newly incorporated hydroxyl moiety found near αGlu-52 (Figures 6A and 6B). The positioning of the bromide in both 6 and 11 combined with the orientations of αLeu-57 and αGlu-52 suggests that it would be difficult for the bromide to be released first. This agrees with the kinetic data supporting release of 4 first during turnover of 9, and is consistent with the slow observed rate for bromide release in the reaction of αY60W-CaaD and 10, where the prolyl adduct (16 in Scheme 10) would block release.
Figure 6.
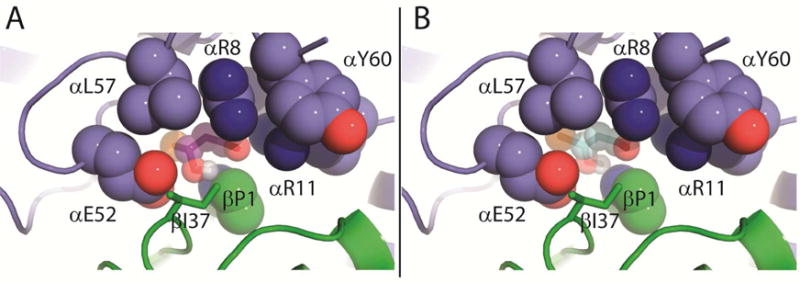
Docking of 6 and 11 in the CaaD Active Site. A) Shown in purple spheres/sticks blue spheres is the docked intermediate, 6 (Scheme 9). The bromide moiety is shown as an orange sphere. It is positioned almost directly behind C3 of 6. B) Shown in teal spheres/sticks is the docked enolate intermediate, 11, proposed to be formed in the course of the CaaD-catalyzed reaction with 10. The bromide moiety is shown as an orange sphere. Shown in blue and green spheres are the residues around the active site. The Figures were generated using PyMOL.21
The docking studies predict that the binding of 11 is more favorable than that of 12. A comparison of the top poses shows that the predicted free energy of binding for 11 is −0.7 kcal/mol lower than that of 12. Moreover, the top pose for 12 places the hydroxyl moiety near the back of the active site and the bromide near the front. This configuration is unlikely given that the hydroxyl moiety was added to 10 after activation by αGlu-52. This observation further supports the preference for the binding of 11 over 12 as well as the fact that CaaD does not process the cis-isomer of 3-bromoacrylate.
DISCUSSION
3-Bromopropiolate (10) was identified as a mechanism-based inhibitor of CaaD that is converted to a reactive species that, in turn, forms a covalent bond with the prolyl nitrogen of βPro-1.3 Although the exact mechanism is not known, it is proposed that 10 undergoes hydration to form an enol species (13, Scheme 10).3 Chemical rearrangement of 13 produces as acyl bromide, 14 (path A), or a ketene, 15 (path B). Either species could form a covalent bond with the prolyl nitrogen of βPro-1 (16).3
In this prior work, the inactivation kinetics could not be determined due to the fast rate, so only a qualitative assessment was made (i.e., the enzyme loses ~80% activity in ~10 s when incubated with a 10% stoichiometric excess).3 Since this report in 2004, a validated active site fluorescent probe (i.e., αY60W-CaaD) was developed and the reaction of 10 with αY60W-CaaD can now be monitored by stopped-flow.12 Accordingly, the changes in enzyme fluorescence (for the reaction of 10 and αY60W-CaaD) were followed over the course of the reaction. The resulting stopped-flow data were fit using both conventional methods and by simulation based on the numerical integration of rate equations.17,18 The reaction follows a two-step irreversible kinetic model (Schemes 5 and 6). Fitting the data provides well-constrained rate constants for both steps as well as fluorescence factors for two enzyme species. The two fitted rate constants (k1 and k2) are equivalent to the classic inhibitor kinetic parameters for apparent inhibitor potency (kinact/KI, app) and rate of inactivation (kinact, app), respectively. The kinact/KI, app is 0.0132 ± 0.0008 μM−1 s−1, (i.e., the second-order rate-constant k1), and the kinact, app is 1.78 ± 0.05 s−1 (i.e., k2). Using these values, the apparent KI (KI, app) is calculated to be 140 μM, but this clearly does not represent a Kd for inhibitor binding. These kinetic constants are consistent with the qualitative assessment previously reported for the inhibition of wild-type CaaD by 10.
The data also define the fluorescence factor for the enzyme species, E*. Hence, a simultaneous fit by simulation of the combined αY60W-CaaD/9 and αY60W-CaaD/10 data sets resolves the ambiguity in the rate constants k3 and k4 that results from the αY60W-CaaD/9 data fit alone.12 The resulting global fit provides absolute values for these rate constants and the identification of the rate-limiting step. The fit results in well-constrained values for the nine fitted rate-constants and three observed fluorescent factors for the different enzyme species (Table 2). The release of 4 (k4), or a step-associated with the release of 4, is the rate-limiting step (kcat = 3.4 s−1) in the reaction of αY60W-CaaD and 9. An unknown step that is associated with the initial change in the enzyme fluorescence (k3) is the partially rate-limiting step (8.9 s−1). The upper pathway is operative. The previously reported conclusions about substrate binding, rate of chemistry, and product binding remain unchanged.12
These results assume that E* has the same fluorescence state in both systems (αY60W-CaaD and 9 and αY60W-CaaD and 10). For αY60W-CaaD and 9, the proposed model has two fluorescent species: one occurring after chemistry and the other occurring with first product release. This conclusion is primarily based on the rate observed in the burst experiment (85 s−1) versus the rate observed in the stopped flow experiments (8.9 s−1). Further support comes from observation of a brief lag phase in the stopped-flow data, which is comparable to that of the burst rate.
The rate of chemistry (i.e., the rate of water addition to 10 by αY60W-CaaD) appears to be much faster than the rate of chemistry for αY60W-CaaD and 9. In order to account for the failure to observe a lag in the stopped-flow fluorescence (i.e., it occurs within the dead-time of the instrument, 1.3 ms), a 6-fold higher value than that observed for αY60W-CaaD and 9 is required for the rate of chemistry (kchem > 500 s−1) in the reaction of αY60W-CaaD and 10 (Scheme 11). Unfortunately, the lack of data in this region precludes error analysis on the rate provided by the fitting optimization routines. The lower limit (500 s−1) is obtained by visual inspection of the computed time courses relative to the data.
Scheme 11.

The Required Rate of Chemistry in the Reaction of αY60W-CaaD and 10, where S corresponds to 10, P corresponds to bromide, and R corresponds to the reactive species that forms a covalent bond with enzyme.
Previous work showed that bromide is released very slowly when CaaD is inactivated by 10.3 Here, we show that the observed rate of bromide release is ~kobs = 0.01 ± 0.003 s−1 by fitting to eq 4 and by global simulation (k3 = 0.0036 ± 0.0004). The simulated traces do not account for the data as well as the fitting to eq 6. Moreover, the first 10 s of the data are not considered for the fit due to the electrode response time and sensitivity. The rate of bromide release is at least 100-fold less than the observed apparent rate of inactivation (kinact = 1.8 s−1), as determined in the stopped-flow experiment. The “fast” kinact rate constant is consistent with the observations made previously in the time-dependent inhibition experiment.3
At first glance, the “slow” rate of bromide release from 10 (in the presence of αY60W-CaaD) seems to contradict the observed rapid rate of bromide release in the reaction of αY60W-CaaD and 9. In the previous study of αY60W-CaaD and 9, it was concluded that product release occurs in a biased random release order with a preference for the upper pathway (Scheme 4).12 The upper pathway allows for “slow” release of 4 (k4 = 3 s−1) followed by rapid release of bromide (k5 > 200 s−1). It was concluded that the bottom pathway (release of bromide first followed by 4) was not significant. Three lines of evidence support this conclusion. First, bromide is a competitive inhibitor of the reaction suggesting that it is released last, after the release of 4.12,23,24 Second, the fluorescence at the end of the reaction with 9 matches the end-point fluorescence of the individual products. This argument also suggests that k−4 is small. Third, the dissociation constant for the bottom pathway (K7) is at least 10-fold higher (reflecting weaker binding) than the upper pathway (K4) using a thermodynamic box argument, as discussed previously.12
In the case of αY60W-CaaD and 10, it is proposed that bromide release occurs slowly, because the reaction with the enzyme generates bromide and the covalently modified enzyme (and no other products). This is supported by two observations: the stoichiometric amounts of 10 required to label CaaD and the absence of evidence to suggest that the reactive intermediate (i.e., 14 or 15 in Scheme 10) leaves the active site (i.e., labeling only occurs on βPro-1). As a result, the bromide is trapped in the active site behind the adduct on the covalently modified βPro-1 (i.e., 16 in Scheme 10) and its subsequent release is slow (0.003 s−1).
This “slow” rate of bromide release first observed in the reaction of CaaD and 10, can be used as an estimate for k7 in the lower pathway of Scheme 8A. The rate constant of bromide release first is approximately 3-orders of magnitude less than the rate constant of release of 4 first (upper pathway of Scheme 8A) during the enzyme-catalyzed reaction using 9 (3.4 s−1) and, at least, 4-orders of magnitude slower than when bromide is the second product released (>200 s−1). These observations are consistent with the evidence that CaaD preferentially releases 4 followed by bromide in the dehalogenation of 9 (upper pathway).
The positioning of the bromide at the back of the active site is supported by docking studies carried out with the hypothetical intermediates (6, 11, and 12 in Scheme 9) in the reactions of 9 and 10 with CaaD. The docking results suggest that bromide (of 6 and 11) is positioned away from the αGlu52 residue toward the back of the active site. This is furthered highlighted by the docking preference of 6, which takes advantage of the flexibility at C3 (due to sp3 hybridization). The bromide (orange sphere) is twisted almost completely to the back, so that it is just barely visible in Figure 6A.
These results have implications for the inactivation of CaaD by 3-bromopropiolate, the cis-CaaD-catalyzed reaction, and the evolution of isomer-specific dehalogenases. First, the kinetic parameters obtained for the inactivation of CaaD by 3-bromopropiolate are consistent with the qualitative assessment previously reported.3 Moreover, the slow rate constant of bromide release suggests that 14 (in Scheme 10) and route A is operative in the inactivation of CaaD. Second, a comparison to the kinetic model for cis-CaaD indicates that the rate of chemistry is comparable and is not rate-limiting for either enzyme. In both enzymes, bromide release occurs after malonate semialdehyde, possibly because it is positioned at the back of the active site. The dissociation constant for bromide is comparable (10 mM for CaaD and 3 mM for cis-CaaD), but CaaD binds malonate semialdehyde (4) more tightly (the KD is 10-fold less than that for bromide) than cis-CaaD (where the KD is 10-fold greater than that for bromide).13 Both enzymes are limited by product release and not chemistry. In contrast, Horvat et al. reported that product release is not rate limiting for CaaD, based on the observation that increasing the solvent viscosity did not decrease the values of kcat or kcat/Km.25 The results reported herein and elsewhere12 show that this is not the case. The results also support the more accurate estimate of the rate enhancement for the CaaD-catalyzed reaction (k2/knon = 3.6 × 10¹³)12, which is an order of magnitude higher than that previously reported.25
Highlights.
Kinetic mechanism for αY60W-CaaD and 3-bromoacrylate was determined
Kinetic parameters were obtained for CaaD inactivated by 3-bromopropiolate
The acyl bromide is implicated as the inactivating species of CaaD
CaaD and cis-CaaD are rate limited by product release and not chemistry
Acknowledgments
Funding
This research was supported by the National Institutes of Health Grants (GM-65324) and the Robert A. Welch Foundation Grant (F-1334).
ABBREVIATIONS
- CaaD and cis-CaaD
trans- and cis-3-chloroacrylic acid dehalogenase, respectively
- MSAD
malonate semialdehyde decarboxylase
- 4-OT
4-oxalocrotonate tautomerase
- PDB
Protein Data Bank
- SDS-PAGE
sodium dodecyl sulfate-polyacrylamide gel electrophoresis
Footnotes
Publisher's Disclaimer: This is a PDF file of an unedited manuscript that has been accepted for publication. As a service to our customers we are providing this early version of the manuscript. The manuscript will undergo copyediting, typesetting, and review of the resulting proof before it is published in its final citable form. Please note that during the production process errors may be discovered which could affect the content, and all legal disclaimers that apply to the journal pertain.
Notes
K.A.J. is President of KinTek Corp., which provided the stopped-flow instrument and the KinTek Explorer software used in this study.
The other authors declare no competing financial interest.
References
- 1.van Hylckama Vlieg JE, Janssen DB. Bacterial degradation of 3-chloroacrylic acid and the characterization of cis- and trans-specific dehalogenases. Biodegradation. 1991;2:139–150. doi: 10.1007/BF00124488. [DOI] [PubMed] [Google Scholar]
- 2.Poelarends GJ, Saunier R, Janssen DB. trans-3-Chloroacrylic acid dehalogenase from Pseudomonas pavonaceae 170 shares structural and mechanistic similarities with 4-oxalocrotonate tautomerase. J Bacteriol. 2001;183:4269–4277. doi: 10.1128/JB.183.14.4269-4277.2001. [DOI] [PMC free article] [PubMed] [Google Scholar]
- 3.Wang SC, Person MD, Johnson WH, Jr, Whitman CP. Reactions of trans-3-chloroacrylic acid dehalogenase with acetylene substrates: consequences of and evidence for a hydration reaction. Biochemistry. 2003;42:8762–8773. doi: 10.1021/bi034598+. [DOI] [PubMed] [Google Scholar]
- 4.Poelarends GJ, Serrano H, Person MD, Johnson WH, Jr, Murzin AG, Whitman CP. Cloning, expression, and characterization of a cis-3-chloroacrylic acid dehalogenase: insights into the mechanistic, structural, and evolutionary relationship between isomer-specific 3-chloroacrylic acid dehalogenases. Biochemistry. 2004;43:759–772. doi: 10.1021/bi0355948. [DOI] [PubMed] [Google Scholar]
- 5.Hartmans S, Jansen MW, Van der Werf MJ, De Bont JAM. Bacterial metabolism of 3-chloroacrylic acid. J Gen Microbiol. 1991;137:2025–2032. doi: 10.1099/00221287-137-8-2025. [DOI] [PubMed] [Google Scholar]
- 6.Poelarends GJ, Wilkens M, Larkin MJ, Van Elsas JD, Janssen DB. Degradation of 1,3-dichloropropene by Pseudomonas cichorii 170. Appl Environ Microbiol. 1998;64:2931–2936. doi: 10.1128/aem.64.8.2931-2936.1998. [DOI] [PMC free article] [PubMed] [Google Scholar]
- 7.Poelarends GJ, Johnson WH, Jr, Murzin AG, Whitman CP. Mechanistic characterization of a bacterial malonate semialdehyde decarboxylase: identification of a new activity on the tautomerase superfamily. J Biol Chem. 2003;278:48674–48683. doi: 10.1074/jbc.M306706200. [DOI] [PubMed] [Google Scholar]
- 8.Poelarends GJ, Veetil VP, Whitman CP. The chemical versatility of the β-α-β fold: Catalytic promiscuity and divergent evolution in the tautomerase superfamily. Cell Mol Life Sci. 2008;65:3606–3618. doi: 10.1007/s00018-008-8285-x. [DOI] [PMC free article] [PubMed] [Google Scholar]
- 9.De Jong RM, Brugman W, Poelarends GJ, Whitman CP, Dijkstra BW. The X-ray structure of trans-3-chloroacrylic acid dehalogenase reveals a novel hydration mechanism in the tautomerase superfamily. J Biol Chem. 2004;279:11546–11552. doi: 10.1074/jbc.M311966200. [DOI] [PubMed] [Google Scholar]
- 10.Azurmendi HF, Wang SC, Massiah MA, Poelarends GJ, Whitman CP, Mildvan AS. The roles of active-site residues in the catalytic mechanism of trans-3-chloroacrylic acid dehalogenase: A kinetic, NMR, and mutational analysis. Biochemistry. 2004;43:4082–4091. doi: 10.1021/bi030241u. [DOI] [PubMed] [Google Scholar]
- 11.De Jong RM, Bazzacco P, Poelarends GJ, Johnson WH, Jr, Kim YJ, Burks EA, Serrano H, Thunnissen AMWH, Whitman CP, Dijkstra BW. Crystal structures of native and inactivated cis-3-chloroacrylic acid dehalogenase. Structural basis for substrate specificity and inactivation by (R)-oxirane-2-carboxylate. J Biol Chem. 2007;282:2440–2449. doi: 10.1074/jbc.M608134200. [DOI] [PubMed] [Google Scholar]
- 12.Huddleston JP, Schroeder GK, Johnson KA, Whitman CP. A pre-steady-state kinetic analysis of the αY60W mutant of trans-3-chloroacrylic acid dehalogenase: implications for the mechanism of the wild type enzyme. Biochemistry. 2012;51:9420–9435. doi: 10.1021/bi3010686. [DOI] [PMC free article] [PubMed] [Google Scholar]
- 13.Robertson BA, Schroeder GK, Jin Z, Johnson KA, Whitman CP. Pre-Steady-State kinetic analysis of cis-3-chloroacrylic acid dehalogenase: analysis and implications. Biochemistry. 2009;48:11737–11744. doi: 10.1021/bi901349z. [DOI] [PMC free article] [PubMed] [Google Scholar]
- 14.Schroeder GK, Johnson WH, Huddleston JP, Serrano H, Johnson KA, Whitman CP. Reaction of cis-3-chloroacrylic acid dehalogenase with an allene substrate, 2,3-butadienoate: Hydration via an enamine. J Am Chem Soc. 2011;134:293–304. doi: 10.1021/ja206873f. [DOI] [PMC free article] [PubMed] [Google Scholar]
- 15.Laemmli UK. Cleavage of structural proteins during the assembly of the head of bacteriophage T4. Nature. 1970;227:680–685. doi: 10.1038/227680a0. [DOI] [PubMed] [Google Scholar]
- 16.Waddell WJ. A simple ultraviolet spectrophotometric method for the determination of protein. J Lab Clin Med. 1956;48:311–314. [PubMed] [Google Scholar]
- 17.Johnson KA. Transient-state kinetic analysis of enzyme reaction pathways. In: Sigman DS, editor. The Enzymes. 3. Academic Press; San Diego: 1992. pp. 1–61. [Google Scholar]
- 18.Johnson KA, Simpson ZB, Blom T. Global Kinetic Explorer: A new computer program for dynamic simulation and fitting of kinetic data. Anal Biochem. 2009;387:20–29. doi: 10.1016/j.ab.2008.12.024. [DOI] [PubMed] [Google Scholar]
- 19.Anderson KS, Miles EW, Johnson KA. Serine modulates substrate channeling in tryptophan synthase: A novel intersubunit triggering mechanism. J Biol Chem. 1991;266:8020–8033. [PubMed] [Google Scholar]
- 20.Trott O, Olson AJ. AutoDock vina: Improving the speed and accuracy of docking with a new scoring function, efficient optimization, and multithreading. J Comput Chem. 2010;31:455–461. doi: 10.1002/jcc.21334. [DOI] [PMC free article] [PubMed] [Google Scholar]
- 21.DeLano WL. The PyMol molecular graphics system. DeLano Scientific; San Carlos, CA: 2002. [Google Scholar]
- 22.Johnson KA, Simpson ZB, Blom T. FitSpace Explorer: An algorithm to evaluate multidimensional parameter space in fitting kinetic data. Anal Biochem. 2009;387:30–41. doi: 10.1016/j.ab.2008.12.025. [DOI] [PubMed] [Google Scholar]
- 23.Dixon M. Determination of enzyme-inhibitor constants. Biochem J. 1953;55:170–171. doi: 10.1042/bj0550170. [DOI] [PMC free article] [PubMed] [Google Scholar]
- 24.Cornish-Bowden A. Simple graphical method for determining the inhibition constants of mixed, uncompetitive, and noncompetitive inhibitors. Biochem J. 1974;137:143–144. doi: 10.1042/bj1370143. [DOI] [PMC free article] [PubMed] [Google Scholar]
- 25.Horvat CM, Wolfenden RV. A persistent pesticide residue and the unusual catalytic proficiency of a dehalgenating enzyme. Proc Natl Acad Sci USA. 2005;102:16199–16202. doi: 10.1073/pnas.0508176102. [DOI] [PMC free article] [PubMed] [Google Scholar]


